Cost And Profit
Salon Marketing Plan Identifying Potential Barriers To Online Conversions Strategy SS V
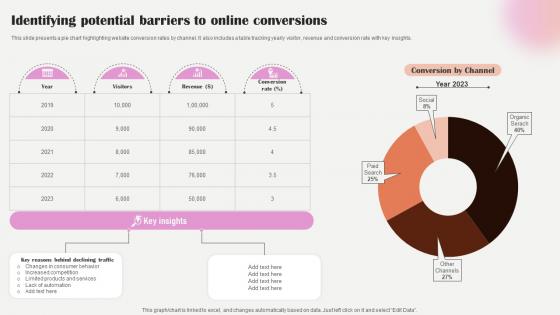
This slide presents a pie chart highlighting website conversion rates by channel. It also includes a table tracking yearly visitor, revenue and conversion rate with key insights. Create an editable Salon Marketing Plan Identifying Potential Barriers To Online Conversions Strategy SS V that communicates your idea and engages your audience. Whether you are presenting a business or an educational presentation, pre-designed presentation templates help save time. Salon Marketing Plan Identifying Potential Barriers To Online Conversions Strategy SS V is highly customizable and very easy to edit, covering many different styles from creative to business presentations. Slidegeeks has creative team members who have crafted amazing templates. So, go and get them without any delay. This slide presents a pie chart highlighting website conversion rates by channel. It also includes a table tracking yearly visitor, revenue and conversion rate with key insights.
Dashboard To Evaluate Performance Strategic Wealth Management And Financial Fin SS V
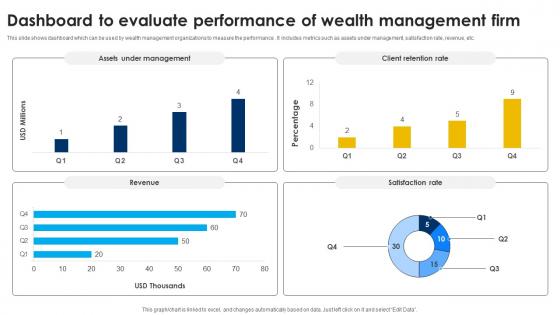
This slide shows dashboard which can be used by wealth management organizations to measure the performance . It includes metrics such as assets under management, satisfaction rate, revenue, etc. Present like a pro with Dashboard To Evaluate Performance Strategic Wealth Management And Financial Fin SS V. Create beautiful presentations together with your team, using our easy-to-use presentation slides. Share your ideas in real-time and make changes on the fly by downloading our templates. So whether youre in the office, on the go, or in a remote location, you can stay in sync with your team and present your ideas with confidence. With Slidegeeks presentation got a whole lot easier. Grab these presentations today. This slide shows dashboard which can be used by wealth management organizations to measure the performance . It includes metrics such as assets under management, satisfaction rate, revenue, etc.
Market Potential Biotech Firm Pitch Deck
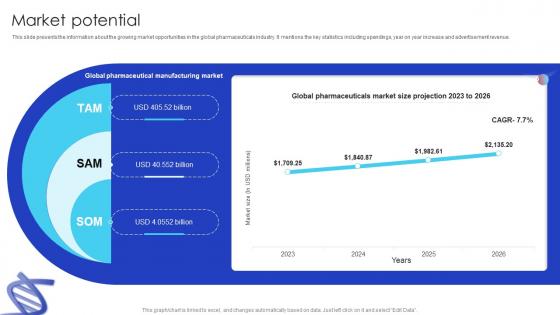
This slide presents the information about the growing market opportunities in the global pharmaceuticals industry. It mentions the key statistics including spendings, year on year increase and advertisement revenue. Are you in need of a template that can accommodate all of your creative concepts This one is crafted professionally and can be altered to fit any style. Use it with Google Slides or PowerPoint. Include striking photographs, symbols, depictions, and other visuals. Fill, move around, or remove text boxes as desired. Test out color palettes and font mixtures. Edit and save your work, or work with colleagues. Download Market Potential Biotech Firm Pitch Deck and observe how to make your presentation outstanding. Give an impeccable presentation to your group and make your presentation unforgettable. This slide presents the information about the growing market opportunities in the global pharmaceuticals industry. It mentions the key statistics including spendings, year on year increase and advertisement revenue.
Highlighting Graphical Sales Growth Of Restaurant Create An Effective Restaurant
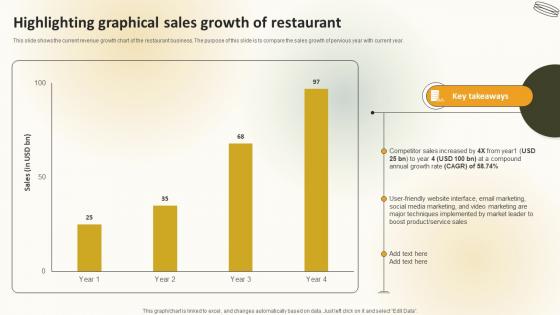
This slide shows the current revenue growth chart of the restaurant business. The purpose of this slide is to compare the sales growth of pervious year with current year. If your project calls for a presentation, then Slidegeeks is your go-to partner because we have professionally designed, easy-to-edit templates that are perfect for any presentation. After downloading, you can easily edit Highlighting Graphical Sales Growth Of Restaurant Create An Effective Restaurant and make the changes accordingly. You can rearrange slides or fill them with different images. Check out all the handy templates This slide shows the current revenue growth chart of the restaurant business. The purpose of this slide is to compare the sales growth of pervious year with current year.
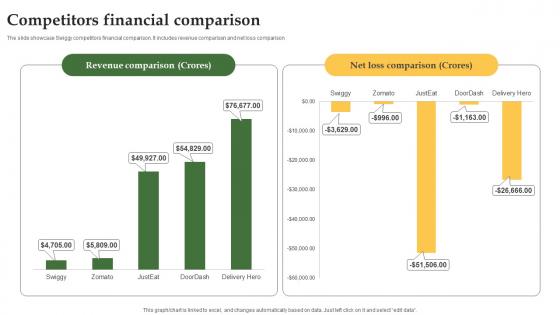
Competitors Financial Comparison Grocery Delivery Company Profile CP SS V
The slide showcase Swiggy competitors financial comparison. It includes revenue comparison and net loss comparison. Do you have to make sure that everyone on your team knows about any specific topic I yes, then you should give Competitors Financial Comparison Grocery Delivery Company Profile CP SS V a try. Our experts have put a lot of knowledge and effort into creating this impeccable Competitors Financial Comparison Grocery Delivery Company Profile CP SS V. You can use this template for your upcoming presentations, as the slides are perfect to represent even the tiniest detail. You can download these templates from the Slidegeeks website and these are easy to edit. So grab these today The slide showcase Swiggy competitors financial comparison. It includes revenue comparison and net loss comparison.
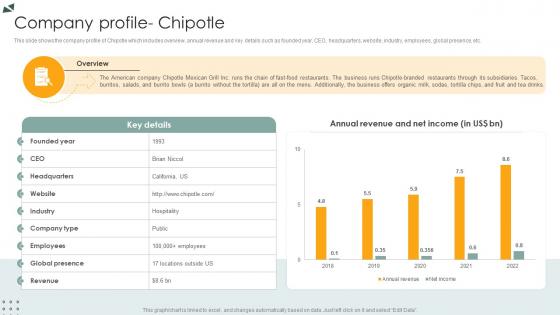
Company Profile Chipotle Lodging And Accommodation Industry IR SS V
This slide shows the company profile of Chipotle which includes overview, annual revenue and key details such as founded year, CEO, headquarters, website, industry, employees, global presence, etc. Want to ace your presentation in front of a live audience Our Company Profile Chipotle Lodging And Accommodation Industry IR SS V can help you do that by engaging all the users towards you. Slidegeeks experts have put their efforts and expertise into creating these impeccable powerpoint presentations so that you can communicate your ideas clearly. Moreover, all the templates are customizable, and easy-to-edit and downloadable. Use these for both personal and commercial use. This slide shows the company profile of Chipotle which includes overview, annual revenue and key details such as founded year, CEO, headquarters, website, industry, employees, global presence, etc.
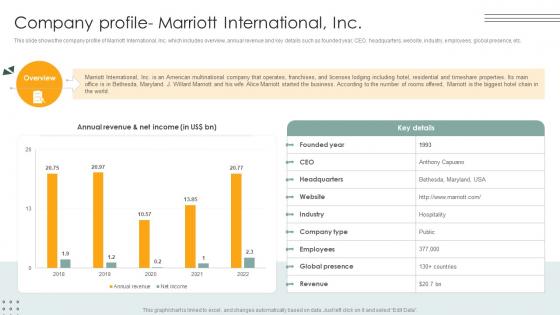
Company Profile Marriott International Inc Lodging And Accommodation Industry IR SS V
This slide shows the company profile of Marriott International, Inc. which includes overview, annual revenue and key details such as founded year, CEO, headquarters, website, industry, employees, global presence, etc. Do you have to make sure that everyone on your team knows about any specific topic I yes, then you should give Company Profile Marriott International Inc Lodging And Accommodation Industry IR SS V a try. Our experts have put a lot of knowledge and effort into creating this impeccable Company Profile Marriott International Inc Lodging And Accommodation Industry IR SS V. You can use this template for your upcoming presentations, as the slides are perfect to represent even the tiniest detail. You can download these templates from the Slidegeeks website and these are easy to edit. So grab these today This slide shows the company profile of Marriott International, Inc. which includes overview, annual revenue and key details such as founded year, CEO, headquarters, website, industry, employees, global presence, etc.
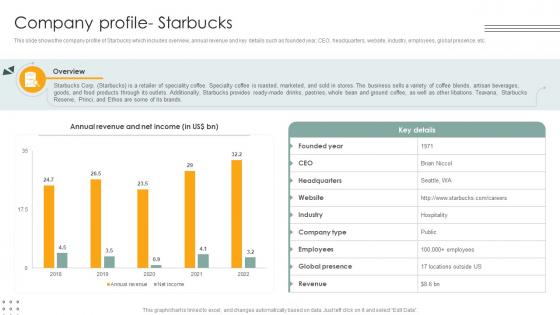
Company Profile Starbucks Lodging And Accommodation Industry IR SS V
This slide shows the company profile of Starbucks which includes overview, annual revenue and key details such as founded year, CEO, headquarters, website, industry, employees, global presence, etc. Get a simple yet stunning designed Company Profile Starbucks Lodging And Accommodation Industry IR SS V. It is the best one to establish the tone in your meetings. It is an excellent way to make your presentations highly effective. So, download this PPT today from Slidegeeks and see the positive impacts. Our easy-to-edit Company Profile Starbucks Lodging And Accommodation Industry IR SS V can be your go-to option for all upcoming conferences and meetings. So, what are you waiting for Grab this template today. This slide shows the company profile of Starbucks which includes overview, annual revenue and key details such as founded year, CEO, headquarters, website, industry, employees, global presence, etc.
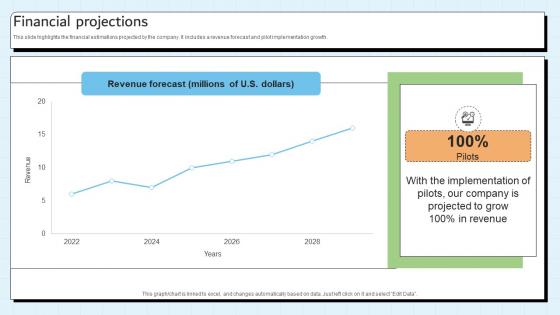
Financial Projections Customer Relationship Management Platform Pitch Deck
This slide highlights the financial estimations projected by the company. It includes a revenue forecast and pilot implementation growth. Slidegeeks is here to make your presentations a breeze with Financial Projections Customer Relationship Management Platform Pitch Deck With our easy-to-use and customizable templates, you can focus on delivering your ideas rather than worrying about formatting. With a variety of designs to choose from, you are sure to find one that suits your needs. And with animations and unique photos, illustrations, and fonts, you can make your presentation pop. So whether you are giving a sales pitch or presenting to the board, make sure to check out Slidegeeks first This slide highlights the financial estimations projected by the company. It includes a revenue forecast and pilot implementation growth.
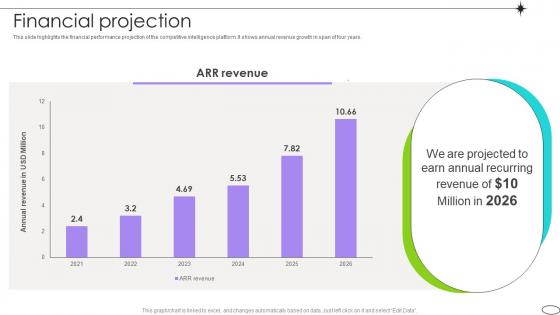
Financial Projection Competitive Landscape Analysis Platform Pitch Deck
This slide highlights the financial performance projection of the competitive intelligence platform. It shows annual revenue growth in span of four years. Slidegeeks is here to make your presentations a breeze with Financial Projection Competitive Landscape Analysis Platform Pitch Deck With our easy-to-use and customizable templates, you can focus on delivering your ideas rather than worrying about formatting. With a variety of designs to choose from, you are sure to find one that suits your needs. And with animations and unique photos, illustrations, and fonts, you can make your presentation pop. So whether you are giving a sales pitch or presenting to the board, make sure to check out Slidegeeks first This slide highlights the financial performance projection of the competitive intelligence platform. It shows annual revenue growth in span of four years.
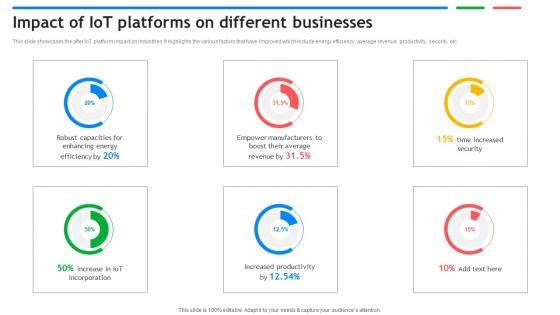
Impact Of IoT Platforms On Different Businesses Exploring Google Cloud IoT Platform
This slide showcases the after IoT platform impact on industries. It highlights the various factors that have improved which include energy efficiency, average revenue, productivity, security, etc. Coming up with a presentation necessitates that the majority of the effort goes into the content and the message you intend to convey. The visuals of a PowerPoint presentation can only be effective if it supplements and supports the story that is being told. Keeping this in mind our experts created Impact Of IoT Platforms On Different Businesses Exploring Google Cloud IoT Platform to reduce the time that goes into designing the presentation. This way, you can concentrate on the message while our designers take care of providing you with the right template for the situation. This slide showcases the after IoT platform impact on industries. It highlights the various factors that have improved which include energy efficiency, average revenue, productivity, security, etc.
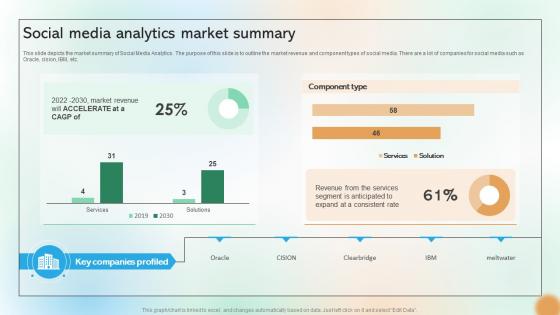
Social Media Analytics Market Summary Cracking The Code Of Social Media
This slide depicts the market summary of Social Media Analytics. The purpose of this slide is to outline the market revenue and component types of social media. There are a lot of companies for social media such as Oracle, cision, IBM, etc. Want to ace your presentation in front of a live audience Our Social Media Analytics Market Summary Cracking The Code Of Social Media can help you do that by engaging all the users towards you. Slidegeeks experts have put their efforts and expertise into creating these impeccable powerpoint presentations so that you can communicate your ideas clearly. Moreover, all the templates are customizable, and easy-to-edit and downloadable. Use these for both personal and commercial use. This slide depicts the market summary of Social Media Analytics. The purpose of this slide is to outline the market revenue and component types of social media. There are a lot of companies for social media such as Oracle, cision, IBM, etc.
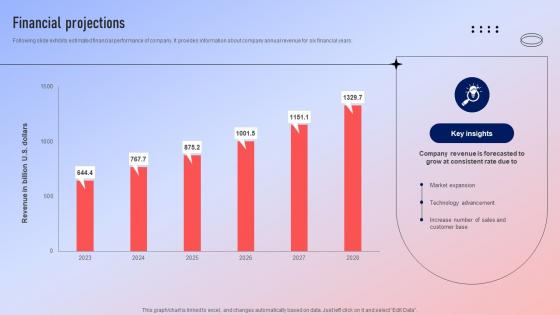
Financial Projections Fundraising Pitch Deck For Ecommerce Platform
Following slide exhibits estimated financial performance of company. It provides information about company annual revenue for six financial years. Present like a pro with Financial Projections Fundraising Pitch Deck For Ecommerce Platform. Create beautiful presentations together with your team, using our easy-to-use presentation slides. Share your ideas in real-time and make changes on the fly by downloading our templates. So whether you are in the office, on the go, or in a remote location, you can stay in sync with your team and present your ideas with confidence. With Slidegeeks presentation got a whole lot easier. Grab these presentations today. Following slide exhibits estimated financial performance of company. It provides information about company annual revenue for six financial years.

Executive Summary Wind Turbines Manufacturer Company Profile CP SS V
The slide showcases the executive summary to provide brief insights of Vestas company, including business overview, global presence, executive team, business competitors and revenue by segment.Do you have an important presentation coming up Are you looking for something that will make your presentation stand out from the rest Look no further than Executive Summary Wind Turbines Manufacturer Company Profile CP SS V. With our professional designs, you can trust that your presentation will pop and make delivering it a smooth process. And with Slidegeeks, you can trust that your presentation will be unique and memorable. So why wait Grab Executive Summary Wind Turbines Manufacturer Company Profile CP SS V today and make your presentation stand out from the rest The slide showcases the executive summary to provide brief insights of Vestas company, including business overview, global presence, executive team, business competitors and revenue by segment.
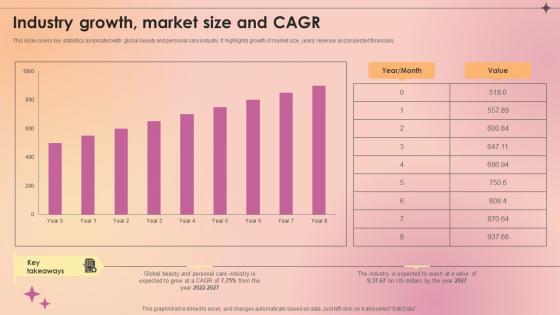
Industry Growth Market Size And Cagr Makeup And Skincare Market IR SS V
This slide covers key statistics associated with global beauty and personal care industry. It highlights growth of market size, yearly revenue and projected financials. you in need of a template that can accommodate all of your creative concepts This one is crafted professionally and can be altered to fit any style. Use it with Google Slides or PowerPoint. Include striking photographs, symbols, depictions, and other visuals. Fill, move around, or remove text boxes as desired. Test out color palettes and font mixtures. Edit and save your work, or work with colleagues. Download Industry Growth Market Size And Cagr Makeup And Skincare Market IR SS V and observe how to make your presentation outstanding. Give an impeccable presentation to your group and make your presentation unforgettable. This slide covers key statistics associated with global beauty and personal care industry. It highlights growth of market size, yearly revenue and projected financials.
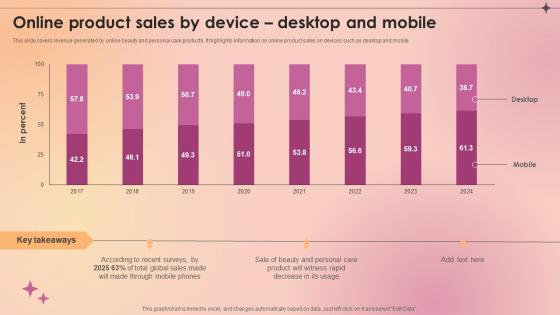
Online Product Sales By Device Desktop And Mobile Makeup And Skincare Market IR SS V
This slide covers revenue generated by online beauty and personal care products. It highlights information on online product sales on devices such as desktop and mobile. This modern and well-arranged Online Product Sales By Device Desktop And Mobile Makeup And Skincare Market IR SS V provides lots of creative possibilities. It is very simple to customize and edit with the Powerpoint Software. Just drag and drop your pictures into the shapes. All facets of this template can be edited with Powerpoint, no extra software is necessary. Add your own material, put your images in the places assigned for them, adjust the colors, and then you can show your slides to the world, with an animated slide included. This slide covers revenue generated by online beauty and personal care products. It highlights information on online product sales on devices such as desktop and mobile.
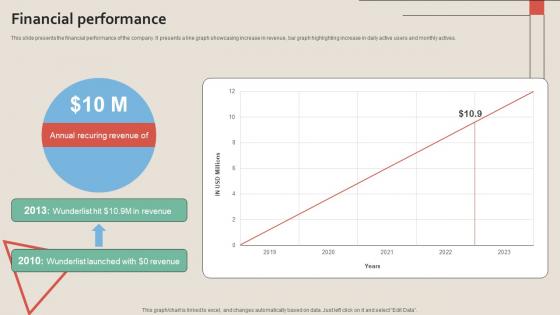
Financial Performance Work Management Tool Pitch Deck
This slide presents the financial performance of the company. It presents a line graph showcasing increase in revenue, bar graph highlighting increase in daily active users and monthly actives.Present like a pro with Financial Performance Work Management Tool Pitch Deck. Create beautiful presentations together with your team, using our easy-to-use presentation slides. Share your ideas in real-time and make changes on the fly by downloading our templates. So whether you are in the office, on the go, or in a remote location, you can stay in sync with your team and present your ideas with confidence. With Slidegeeks presentation got a whole lot easier. Grab these presentations today. This slide presents the financial performance of the company. It presents a line graph showcasing increase in revenue, bar graph highlighting increase in daily active users and monthly actives.

Financial Projections Work Management Tool Pitch Deck
This slide presents the financial projection of the company with the help of line graphs. It showcases projected increase in company revenue and growth of EBITDA.Slidegeeks is here to make your presentations a breeze with Financial Projections Work Management Tool Pitch Deck With our easy-to-use and customizable templates, you can focus on delivering your ideas rather than worrying about formatting. With a variety of designs to choose from, you are sure to find one that suits your needs. And with animations and unique photos, illustrations, and fonts, you can make your presentation pop. So whether you are giving a sales pitch or presenting to the board, make sure to check out Slidegeeks first This slide presents the financial projection of the company with the help of line graphs. It showcases projected increase in company revenue and growth of EBITDA.

Create A Restaurant Marketing Highlighting Graphical Sales Growth Of Restaurant
This slide shows the current revenue growth chart of the restaurant business. The purpose of this slide is to compare the sales growth of pervious year with current year. Find highly impressive Create A Restaurant Marketing Highlighting Graphical Sales Growth Of Restaurant on Slidegeeks to deliver a meaningful presentation. You can save an ample amount of time using these presentation templates. No need to worry to prepare everything from scratch because Slidegeeks experts have already done a huge research and work for you. You need to download Create A Restaurant Marketing Highlighting Graphical Sales Growth Of Restaurant for your upcoming presentation. All the presentation templates are 100 percent editable and you can change the color and personalize the content accordingly. Download now This slide shows the current revenue growth chart of the restaurant business. The purpose of this slide is to compare the sales growth of pervious year with current year.
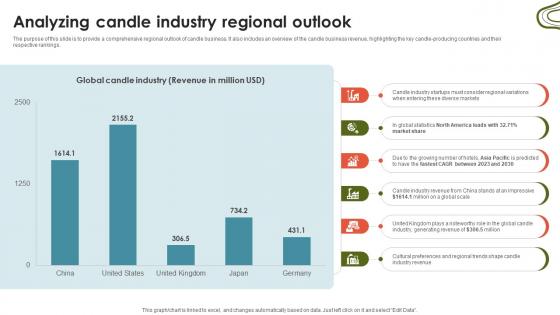
Candle Business Venture Analyzing Candle Industry Regional Outlook BP SS V
The purpose of this slide is to provide a comprehensive regional outlook of candle business. It also includes an overview of the candle business revenue, highlighting the key candle-producing countries and their respective rankings. Create an editable Candle Business Venture Analyzing Candle Industry Regional Outlook BP SS V that communicates your idea and engages your audience. Whether you are presenting a business or an educational presentation, pre-designed presentation templates help save time. Candle Business Venture Analyzing Candle Industry Regional Outlook BP SS V is highly customizable and very easy to edit, covering many different styles from creative to business presentations. Slidegeeks has creative team members who have crafted amazing templates. So, go and get them without any delay. The purpose of this slide is to provide a comprehensive regional outlook of candle business. It also includes an overview of the candle business revenue, highlighting the key candle-producing countries and their respective rankings.
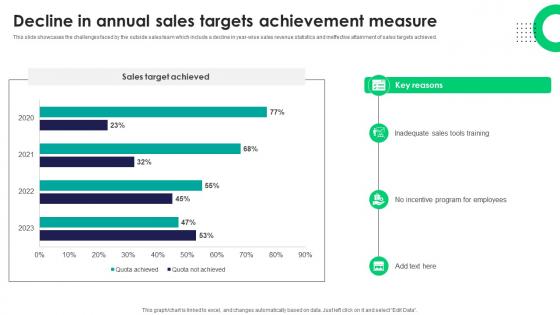
Decline In Annual Sales Targets Achievement Measure Tactics For Improving Field Sales Team SA SS V
This slide showcases the challenges faced by the outside sales team which include a decline in year-wise sales revenue statistics and ineffective attainment of sales targets achieved.Slidegeeks is here to make your presentations a breeze with Decline In Annual Sales Targets Achievement Measure Tactics For Improving Field Sales Team SA SS V With our easy-to-use and customizable templates, you can focus on delivering your ideas rather than worrying about formatting. With a variety of designs to choose from, you are sure to find one that suits your needs. And with animations and unique photos, illustrations, and fonts, you can make your presentation pop. So whether you are giving a sales pitch or presenting to the board, make sure to check out Slidegeeks first This slide showcases the challenges faced by the outside sales team which include a decline in year-wise sales revenue statistics and ineffective attainment of sales targets achieved.
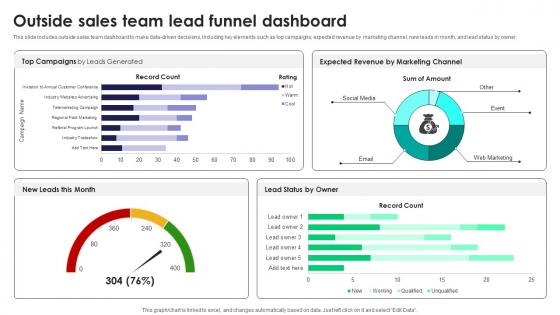
Outside Sales Team Lead Funnel Dashboard Tactics For Improving Field Sales Team SA SS V
This slide includes outside sales team dashboard to make data-driven decisions, including key elements such as top campaigns, expected revenue by marketing channel, new leads in month, and lead status by owner.Retrieve professionally designed Outside Sales Team Lead Funnel Dashboard Tactics For Improving Field Sales Team SA SS V to effectively convey your message and captivate your listeners. Save time by selecting pre-made slideshows that are appropriate for various topics, from business to educational purposes. These themes come in many different styles, from creative to corporate, and all of them are easily adjustable and can be edited quickly. Access them as PowerPoint templates or as Google Slides themes. You do not have to go on a hunt for the perfect presentation because Slidegeeks got you covered from everywhere. This slide includes outside sales team dashboard to make data-driven decisions, including key elements such as top campaigns, expected revenue by marketing channel, new leads in month, and lead status by owner.
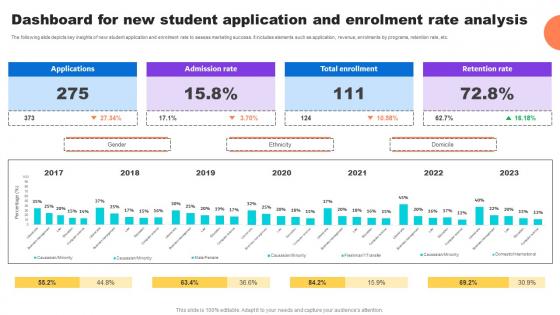
Dashboard For New Student Application And Enrolment Key Step To Implementation University Strategy SS V
The following slide depicts key insights of new student application and enrolment rate to assess marketing success. It includes elements such as application, revenue, enrolments by programs, retention rate, etc.Crafting an eye-catching presentation has never been more straightforward. Let your presentation shine with this tasteful yet straightforward Dashboard For New Student Application And Enrolment Key Step To Implementation University Strategy SS V template. It offers a minimalistic and classy look that is great for making a statement. The colors have been employed intelligently to add a bit of playfulness while still remaining professional. Construct the ideal Dashboard For New Student Application And Enrolment Key Step To Implementation University Strategy SS V that effortlessly grabs the attention of your audience Begin now and be certain to wow your customers The following slide depicts key insights of new student application and enrolment rate to assess marketing success. It includes elements such as application, revenue, enrolments by programs, retention rate, etc.
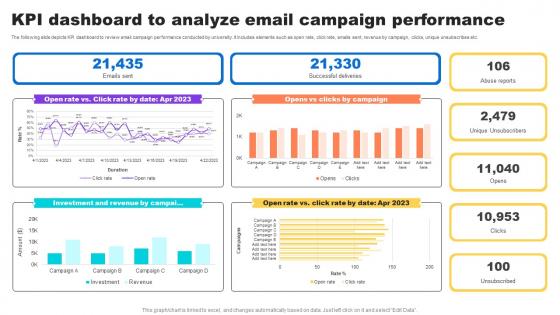
Kpi Dashboard To Analyze Email Campaign Key Step To Implementation University Strategy SS V
The following slide depicts KPI dashboard to review email campaign performance conducted by university. It includes elements such as open rate, click rate, emails sent, revenue by campaign, clicks, unique unsubscribes etc.The Kpi Dashboard To Analyze Email Campaign Key Step To Implementation University Strategy SS V is a compilation of the most recent design trends as a series of slides. It is suitable for any subject or industry presentation, containing attractive visuals and photo spots for businesses to clearly express their messages. This template contains a variety of slides for the user to input data, such as structures to contrast two elements, bullet points, and slides for written information. Slidegeeks is prepared to create an impression. The following slide depicts KPI dashboard to review email campaign performance conducted by university. It includes elements such as open rate, click rate, emails sent, revenue by campaign, clicks, unique unsubscribes etc.
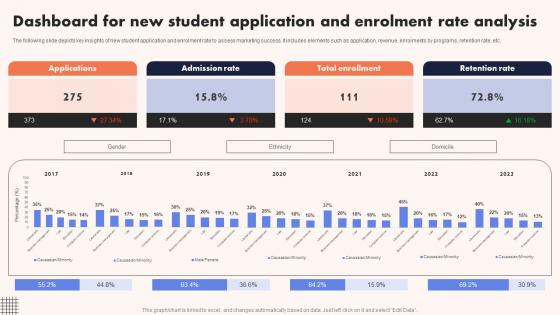
University Marketing Guide Dashboard For New Student Application And Enrolment Strategy SS V
The following slide depicts key insights of new student application and enrolment rate to assess marketing success. It includes elements such as application, revenue, enrolments by programs, retention rate, etc. Coming up with a presentation necessitates that the majority of the effort goes into the content and the message you intend to convey. The visuals of a PowerPoint presentation can only be effective if it supplements and supports the story that is being told. Keeping this in mind our experts created University Marketing Guide Dashboard For New Student Application And Enrolment Strategy SS V to reduce the time that goes into designing the presentation. This way, you can concentrate on the message while our designers take care of providing you with the right template for the situation. The following slide depicts key insights of new student application and enrolment rate to assess marketing success. It includes elements such as application, revenue, enrolments by programs, retention rate, etc.
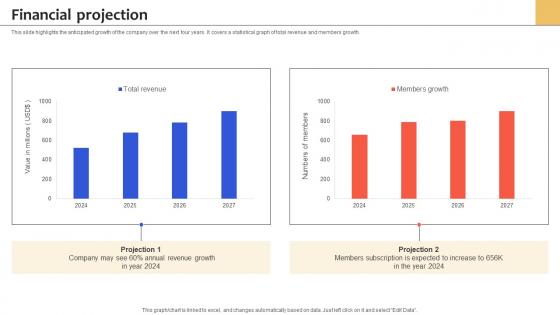
Financial Projection Health Insurance Services Management Platform Pitch Deck
This slide highlights the anticipated growth of the company over the next four years. It covers a statistical graph of total revenue and members growth. Slidegeeks is here to make your presentations a breeze with Financial Projection Health Insurance Services Management Platform Pitch Deck With our easy-to-use and customizable templates, you can focus on delivering your ideas rather than worrying about formatting. With a variety of designs to choose from, you are sure to find one that suits your needs. And with animations and unique photos, illustrations, and fonts, you can make your presentation pop. So whether you are giving a sales pitch or presenting to the board, make sure to check out Slidegeeks first This slide highlights the anticipated growth of the company over the next four years. It covers a statistical graph of total revenue and members growth.
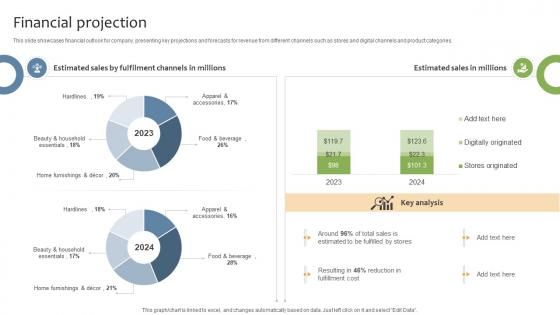
Financial Projection General Merchandising Store Business Model BMC SS V
This slide showcases financial outlook for company, presenting key projections and forecasts for revenue from different channels such as stores and digital channels and product categories. This Financial Projection General Merchandising Store Business Model BMC SS V is perfect for any presentation, be it in front of clients or colleagues. It is a versatile and stylish solution for organizing your meetings. The Financial Projection General Merchandising Store Business Model BMC SS V features a modern design for your presentation meetings. The adjustable and customizable slides provide unlimited possibilities for acing up your presentation. Slidegeeks has done all the homework before launching the product for you. So, do not wait, grab the presentation templates today This slide showcases financial outlook for company, presenting key projections and forecasts for revenue from different channels such as stores and digital channels and product categories.
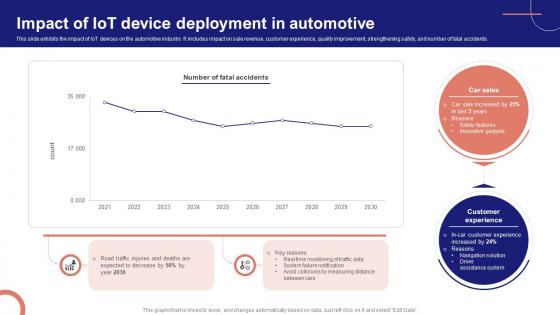
IoT Device Management Fundamentals Impact Of IoT Device Deployment In Automotive IoT Ss V
This slide exhibits the impact of IoT devices on the automotive industry. It includes impact on sale revenue, customer experience, quality improvement, strengthening safety, and number of fatal accidents. This modern and well-arranged IoT Device Management Fundamentals Impact Of IoT Device Deployment In Automotive IoT SS V provides lots of creative possibilities. It is very simple to customize and edit with the Powerpoint Software. Just drag and drop your pictures into the shapes. All facets of this template can be edited with Powerpoint, no extra software is necessary. Add your own material, put your images in the places assigned for them, adjust the colors, and then you can show your slides to the world, with an animated slide included. This slide exhibits the impact of IoT devices on the automotive industry. It includes impact on sale revenue, customer experience, quality improvement, strengthening safety, and number of fatal accidents.
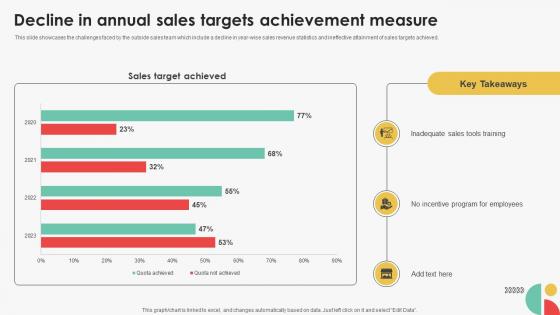
Decline In Annual Sales Targets Achievement Efficient Sales Territory Management To Build SA SS V
This slide showcases the challenges faced by the outside sales team which include a decline in year-wise sales revenue statistics and ineffective attainment of sales targets achieved. Slidegeeks is here to make your presentations a breeze with Decline In Annual Sales Targets Achievement Efficient Sales Territory Management To Build SA SS V With our easy-to-use and customizable templates, you can focus on delivering your ideas rather than worrying about formatting. With a variety of designs to choose from, you are sure to find one that suits your needs. And with animations and unique photos, illustrations, and fonts, you can make your presentation pop. So whether you are giving a sales pitch or presenting to the board, make sure to check out Slidegeeks first This slide showcases the challenges faced by the outside sales team which include a decline in year-wise sales revenue statistics and ineffective attainment of sales targets achieved.
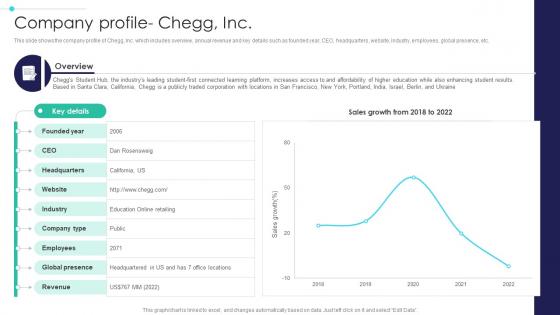
Global Digital Education Company Profile Chegg Inc IR SS V
This slide shows the company profile of Chegg, Inc. which includes overview, annual revenue and key details such as founded year, CEO, headquarters, website, industry, employees, global presence, etc. Want to ace your presentation in front of a live audience Our Global Digital Education Company Profile Chegg Inc IR SS V can help you do that by engaging all the users towards you. Slidegeeks experts have put their efforts and expertise into creating these impeccable powerpoint presentations so that you can communicate your ideas clearly. Moreover, all the templates are customizable, and easy-to-edit and downloadable. Use these for both personal and commercial use. This slide shows the company profile of Chegg, Inc. which includes overview, annual revenue and key details such as founded year, CEO, headquarters, website, industry, employees, global presence, etc.
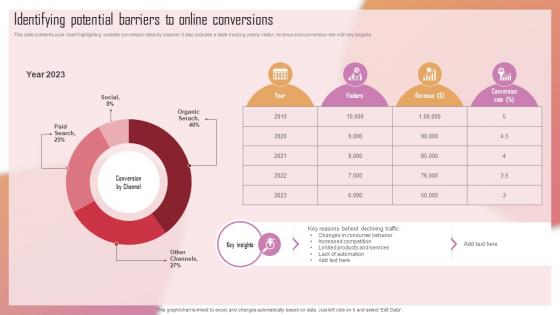
Customizing The Salon Experience Identifying Potential Barriers To Online Conversions Strategy SS V
This slide presents a pie chart highlighting website conversion rates by channel. It also includes a table tracking yearly visitor, revenue and conversion rate with key insights. Are you searching for a Customizing The Salon Experience Identifying Potential Barriers To Online Conversions Strategy SS V that is uncluttered, straightforward, and original Its easy to edit, and you can change the colors to suit your personal or business branding. For a presentation that expresses how much effort you have put in, this template is ideal With all of its features, including tables, diagrams, statistics, and lists, its perfect for a business plan presentation. Make your ideas more appealing with these professional slides. Download Customizing The Salon Experience Identifying Potential Barriers To Online Conversions Strategy SS V from Slidegeeks today. This slide presents a pie chart highlighting website conversion rates by channel. It also includes a table tracking yearly visitor, revenue and conversion rate with key insights.
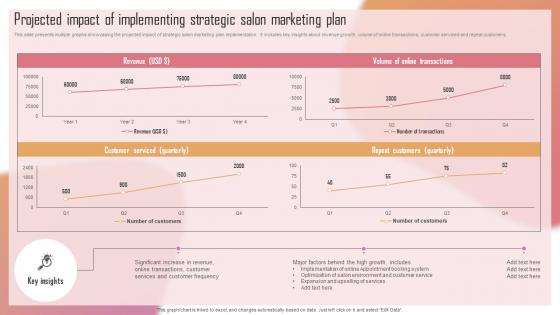
Customizing The Salon Experience Projected Impact Of Implementing Strategic Salon Marketing Strategy SS V
This slide presents multiple graphs showcasing the projected impact of strategic salon marketing plan implementation. It includes key insights about revenue growth, volume of online transactions, customer serviced and repeat customers. Crafting an eye-catching presentation has never been more straightforward. Let your presentation shine with this tasteful yet straightforward Customizing The Salon Experience Projected Impact Of Implementing Strategic Salon Marketing Strategy SS V template. It offers a minimalistic and classy look that is great for making a statement. The colors have been employed intelligently to add a bit of playfulness while still remaining professional. Construct the ideal Customizing The Salon Experience Projected Impact Of Implementing Strategic Salon Marketing Strategy SS V that effortlessly grabs the attention of your audience Begin now and be certain to wow your customers This slide presents multiple graphs showcasing the projected impact of strategic salon marketing plan implementation. It includes key insights about revenue growth, volume of online transactions, customer serviced and repeat customers.
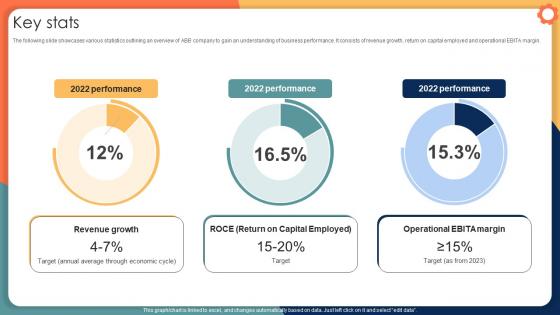
Key Stats Engineering Solution Provider Company Profile CP SS V
The following slide showcases various statistics outlining an overview of ABB company to gain an understanding of business performance. It consists of revenue growth, return on capital employed and operational EBITA margin. This modern and well-arranged Key Stats Engineering Solution Provider Company Profile CP SS V provides lots of creative possibilities. It is very simple to customize and edit with the Powerpoint Software. Just drag and drop your pictures into the shapes. All facets of this template can be edited with Powerpoint, no extra software is necessary. Add your own material, put your images in the places assigned for them, adjust the colors, and then you can show your slides to the world, with an animated slide included. The following slide showcases various statistics outlining an overview of ABB company to gain an understanding of business performance. It consists of revenue growth, return on capital employed and operational EBITA margin.
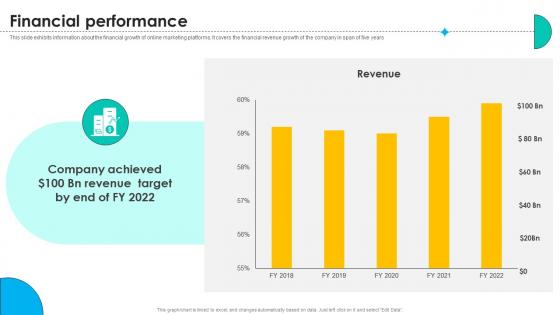
Financial Performance Online Marketing Solutions Pitch Deck
This slide exhibits information about the financial growth of online marketing platforms. It covers the financial revenue growth of the company in span of five years. Present like a pro with Financial Performance Online Marketing Solutions Pitch Deck. Create beautiful presentations together with your team, using our easy-to-use presentation slides. Share your ideas in real-time and make changes on the fly by downloading our templates. So whether you are in the office, on the go, or in a remote location, you can stay in sync with your team and present your ideas with confidence. With Slidegeeks presentation got a whole lot easier. Grab these presentations today. This slide exhibits information about the financial growth of online marketing platforms. It covers the financial revenue growth of the company in span of five years
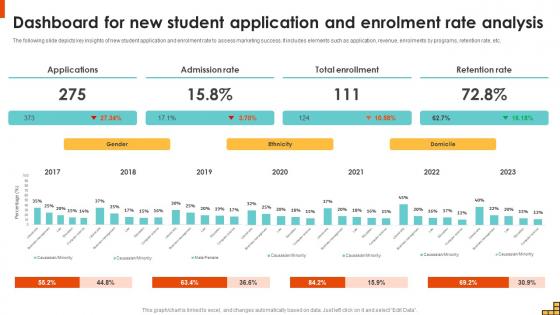
Dashboard For New Student Application And Enrolment Running Marketing Campaigns Strategy SS V
The following slide depicts key insights of new student application and enrolment rate to assess marketing success. It includes elements such as application, revenue, enrolments by programs, retention rate, etc. Crafting an eye-catching presentation has never been more straightforward. Let your presentation shine with this tasteful yet straightforward Dashboard For New Student Application And Enrolment Running Marketing Campaigns Strategy SS V template. It offers a minimalistic and classy look that is great for making a statement. The colors have been employed intelligently to add a bit of playfulness while still remaining professional. Construct the ideal Dashboard For New Student Application And Enrolment Running Marketing Campaigns Strategy SS V that effortlessly grabs the attention of your audience Begin now and be certain to wow your customers The following slide depicts key insights of new student application and enrolment rate to assess marketing success. It includes elements such as application, revenue, enrolments by programs, retention rate, etc.

Marketing Growth Strategy KPI Dashboard To Evaluate Sales Performance Strategy SS V
The following slide outlines key performance indicator KPI dashboard to monitor sales performance of company. The key metrics covered in slide are total sales by location, monthly sales trend, average revenue AR by clients, etc. This Marketing Growth Strategy KPI Dashboard To Evaluate Sales Performance Strategy SS V is perfect for any presentation, be it in front of clients or colleagues. It is a versatile and stylish solution for organizing your meetings. The Marketing Growth Strategy KPI Dashboard To Evaluate Sales Performance Strategy SS V features a modern design for your presentation meetings. The adjustable and customizable slides provide unlimited possibilities for acing up your presentation. Slidegeeks has done all the homework before launching the product for you. So, do not wait, grab the presentation templates today The following slide outlines key performance indicator KPI dashboard to monitor sales performance of company. The key metrics covered in slide are total sales by location, monthly sales trend, average revenue AR by clients, etc.
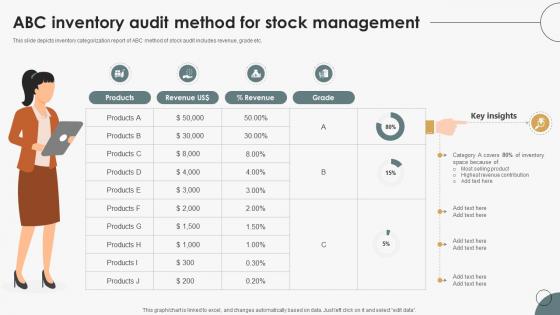
Boosting Efficiency In Inventory ABC Inventory Audit Method For Stock Management
This slide depicts inventory categorization report of ABC method of stock audit includes revenue, grade etc. Create an editable Boosting Efficiency In Inventory ABC Inventory Audit Method For Stock Management that communicates your idea and engages your audience. Whether you are presenting a business or an educational presentation, pre-designed presentation templates help save time. Boosting Efficiency In Inventory ABC Inventory Audit Method For Stock Management is highly customizable and very easy to edit, covering many different styles from creative to business presentations. Slidegeeks has creative team members who have crafted amazing templates. So, go and get them without any delay. This slide depicts inventory categorization report of ABC method of stock audit includes revenue, grade etc.

Competitor Analysis C2C Ecommerce Platform Company Profile CP SS V
This slide highlights the competitor analysis of eBay with Amazon, Walmart and Alibaba based on categories such as employee count, annual revenue, founding year and market capitalization.From laying roadmaps to briefing everything in detail, our templates are perfect for you. You can set the stage with your presentation slides. All you have to do is download these easy-to-edit and customizable templates. Competitor Analysis C2C Ecommerce Platform Company Profile CP SS V will help you deliver an outstanding performance that everyone would remember and praise you for. Do download this presentation today. This slide highlights the competitor analysis of eBay with Amazon, Walmart and Alibaba based on categories such as employee count, annual revenue, founding year and market capitalization.
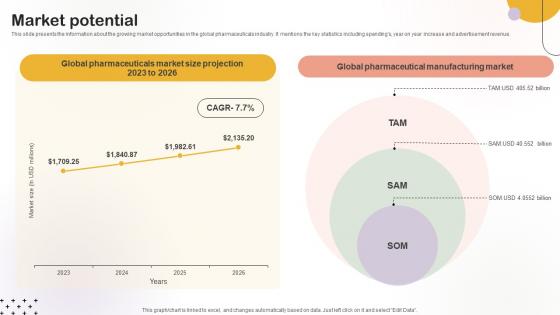
Market Potential Medical Research Organization Pitch Deck
This slide presents the information about the growing market opportunities in the global pharmaceuticals industry. It mentions the key statistics including spendings, year on year increase and advertisement revenue.If you are looking for a format to display your unique thoughts, then the professionally designed Market Potential Medical Research Organization Pitch Deck is the one for you. You can use it as a Google Slides template or a PowerPoint template. Incorporate impressive visuals, symbols, images, and other charts. Modify or reorganize the text boxes as you desire. Experiment with shade schemes and font pairings. Alter, share or cooperate with other people on your work. Download Market Potential Medical Research Organization Pitch Deck and find out how to give a successful presentation. Present a perfect display to your team and make your presentation unforgettable. This slide presents the information about the growing market opportunities in the global pharmaceuticals industry. It mentions the key statistics including spendings, year on year increase and advertisement revenue.
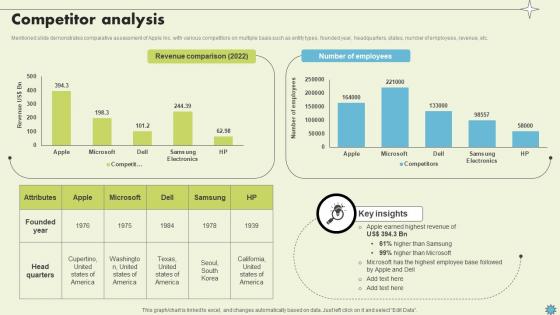
Competitor Analysis Consumer Electronics Company Profile CP SS V
Mentioned slide demonstrates comparative assessment of Apple Inc. with various competitors on multiple basis such as entity types, founded year, headquarters, states, number of employees, revenue, etc.Crafting an eye-catching presentation has never been more straightforward. Let your presentation shine with this tasteful yet straightforward Competitor Analysis Consumer Electronics Company Profile CP SS V template. It offers a minimalistic and classy look that is great for making a statement. The colors have been employed intelligently to add a bit of playfulness while still remaining professional. Construct the ideal Competitor Analysis Consumer Electronics Company Profile CP SS V that effortlessly grabs the attention of your audience Begin now and be certain to wow your customers Mentioned slide demonstrates comparative assessment of Apple Inc. with various competitors on multiple basis such as entity types, founded year, headquarters, states, number of employees, revenue, etc.
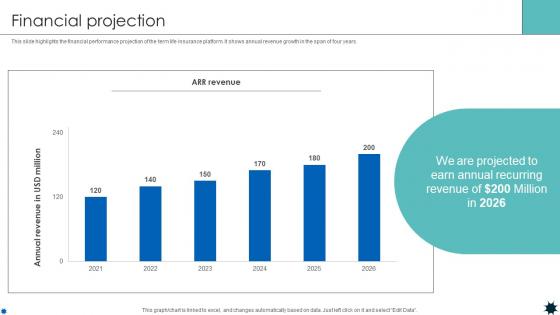
Financial Projection Life Coverage Platform Pitch Deck
This slide highlights the financial performance projection of the term life insurance platform. It shows annual revenue growth in the span of four years. Slidegeeks is here to make your presentations a breeze with Financial Projection Life Coverage Platform Pitch Deck With our easy-to-use and customizable templates, you can focus on delivering your ideas rather than worrying about formatting. With a variety of designs to choose from, you are sure to find one that suits your needs. And with animations and unique photos, illustrations, and fonts, you can make your presentation pop. So whether you are giving a sales pitch or presenting to the board, make sure to check out Slidegeeks first This slide highlights the financial performance projection of the term life insurance platform. It shows annual revenue growth in the span of four years.
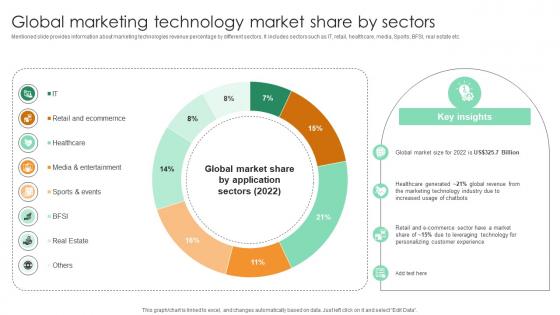
Global Marketing Technology Market Share By Sectors Comprehensive Guide For Marketing Technology
Mentioned slide provides information about marketing technologies revenue percentage by different sectors. It includes sectors such as IT, retail, healthcare, media, Sports, BFSI, real estate etc. This Global Marketing Technology Market Share By Sectors Comprehensive Guide For Marketing Technology from Slidegeeks makes it easy to present information on your topic with precision. It provides customization options, so you can make changes to the colors, design, graphics, or any other component to create a unique layout. It is also available for immediate download, so you can begin using it right away. Slidegeeks has done good research to ensure that you have everything you need to make your presentation stand out. Make a name out there for a brilliant performance. Mentioned slide provides information about marketing technologies revenue percentage by different sectors. It includes sectors such as IT, retail, healthcare, media, Sports, BFSI, real estate etc.

Complete Beginners Guide Statistics Associates With Market Of Crypto Wallets Fin SS V
This slide shows key statistical facts related to crypto wallets or Bitcoin wallets. It includes information such as highest revenue generating region, fastest growing region, total number if crypto wallet users, etc. Create an editable Complete Beginners Guide Statistics Associates With Market Of Crypto Wallets Fin SS V that communicates your idea and engages your audience. Whether you are presenting a business or an educational presentation, pre-designed presentation templates help save time. Complete Beginners Guide Statistics Associates With Market Of Crypto Wallets Fin SS V is highly customizable and very easy to edit, covering many different styles from creative to business presentations. Slidegeeks has creative team members who have crafted amazing templates. So, go and get them without any delay. This slide shows key statistical facts related to crypto wallets or Bitcoin wallets. It includes information such as highest revenue generating region, fastest growing region, total number if crypto wallet users, etc.
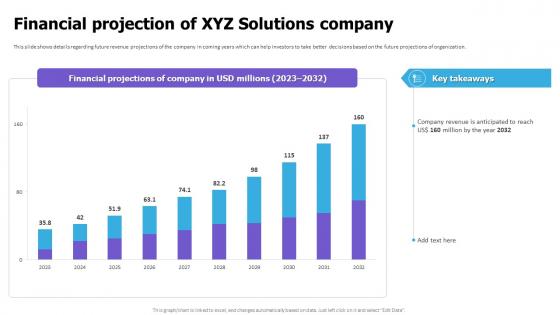
Financial Projection Of XYZ Solutions Company Cloud Game Development Fundraising Pitch Deck
This slide shows details regarding future revenue projections of the company in coming years which can help investors to take better decisions based on the future projections of organization. Get a simple yet stunning designed Financial Projection Of XYZ Solutions Company Cloud Game Development Fundraising Pitch Deck. It is the best one to establish the tone in your meetings. It is an excellent way to make your presentations highly effective. So, download this PPT today from Slidegeeks and see the positive impacts. Our easy-to-edit Financial Projection Of XYZ Solutions Company Cloud Game Development Fundraising Pitch Deck can be your go-to option for all upcoming conferences and meetings. So, what are you waiting for Grab this template today. This slide shows details regarding future revenue projections of the company in coming years which can help investors to take better decisions based on the future projections of organization.
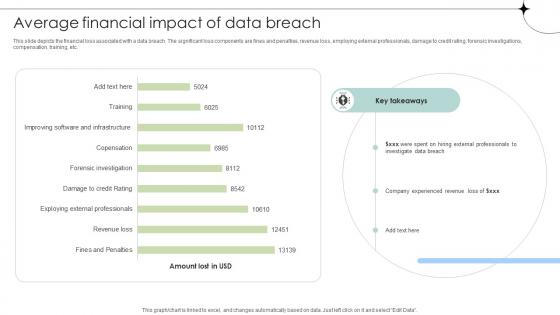
Average Financial Impact Of Data Breach Data Fortification Strengthening Defenses
This slide depicts the financial loss associated with a data breach. The significant loss components are fines and penalties, revenue loss, employing external professionals, damage to credit rating, forensic investigations, compensation, training, etc.There are so many reasons you need a Average Financial Impact Of Data Breach Data Fortification Strengthening Defenses. The first reason is you can not spend time making everything from scratch, Thus, Slidegeeks has made presentation templates for you too. You can easily download these templates from our website easily. This slide depicts the financial loss associated with a data breach. The significant loss components are fines and penalties, revenue loss, employing external professionals, damage to credit rating, forensic investigations, compensation, training, etc.
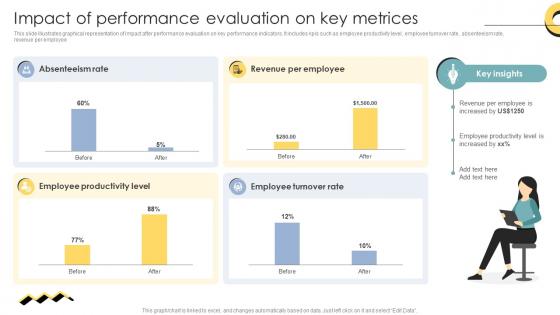
Skill Enhancement Performance Impact Of Performance Evaluation On Key Metrices
This slide illustrates graphical representation of impact after performance evaluation on key performance indicators. It includes kpis such as employee productivity level, employee turnover rate, absenteeism rate, revenue per employee. Do you have to make sure that everyone on your team knows about any specific topic I yes, then you should give Skill Enhancement Performance Impact Of Performance Evaluation On Key Metrices a try. Our experts have put a lot of knowledge and effort into creating this impeccable Skill Enhancement Performance Impact Of Performance Evaluation On Key Metrices. You can use this template for your upcoming presentations, as the slides are perfect to represent even the tiniest detail. You can download these templates from the Slidegeeks website and these are easy to edit. So grab these today This slide illustrates graphical representation of impact after performance evaluation on key performance indicators. It includes kpis such as employee productivity level, employee turnover rate, absenteeism rate, revenue per employee.
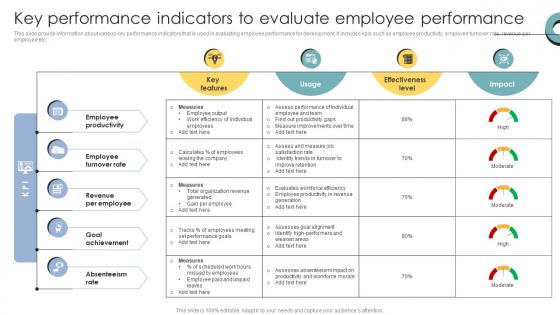
Skill Enhancement Performance Key Performance Indicators To Evaluate Employee Performance
This slide provide information about various key performance indicators that is used in evaluating employee performance for development. It includes kpis such as employee productivity, employee turnover rate, revenue per employee etc. Get a simple yet stunning designed Skill Enhancement Performance Key Performance Indicators To Evaluate Employee Performance. It is the best one to establish the tone in your meetings. It is an excellent way to make your presentations highly effective. So, download this PPT today from Slidegeeks and see the positive impacts. Our easy-to-edit Skill Enhancement Performance Key Performance Indicators To Evaluate Employee Performance can be your go-to option for all upcoming conferences and meetings. So, what are you waiting for Grab this template today. This slide provide information about various key performance indicators that is used in evaluating employee performance for development. It includes kpis such as employee productivity, employee turnover rate, revenue per employee etc.
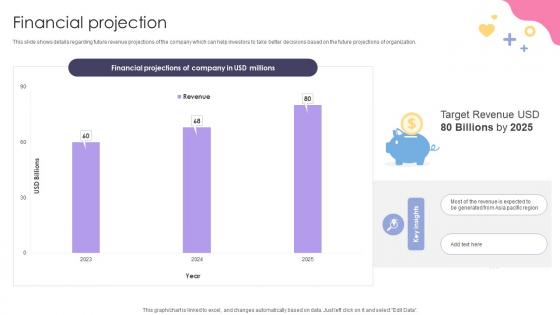
Financial Projection Social Media Application Development Company Fundraising Pitch Deck
This slide shows details regarding future revenue projections of the company which can help investors to take better decisions based on the future projections of organization. Slidegeeks is here to make your presentations a breeze with Financial Projection Social Media Application Development Company Fundraising Pitch Deck With our easy-to-use and customizable templates, you can focus on delivering your ideas rather than worrying about formatting. With a variety of designs to choose from, you are sure to find one that suits your needs. And with animations and unique photos, illustrations, and fonts, you can make your presentation pop. So whether you are giving a sales pitch or presenting to the board, make sure to check out Slidegeeks first This slide shows details regarding future revenue projections of the company which can help investors to take better decisions based on the future projections of organization.
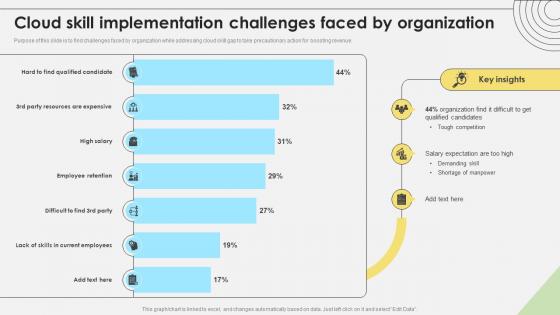
Workforce Competency Enhancement Cloud Skill Implementation Challenges Faced By Organization DTE SS V
Purpose of this slide is to find challenges faced by organization while addressing cloud skill gap to take precautionary action for boosting revenue. Present like a pro with Workforce Competency Enhancement Cloud Skill Implementation Challenges Faced By Organization DTE SS V. Create beautiful presentations together with your team, using our easy-to-use presentation slides. Share your ideas in real-time and make changes on the fly by downloading our templates. So whether you are in the office, on the go, or in a remote location, you can stay in sync with your team and present your ideas with confidence. With Slidegeeks presentation got a whole lot easier. Grab these presentations today. Purpose of this slide is to find challenges faced by organization while addressing cloud skill gap to take precautionary action for boosting revenue.
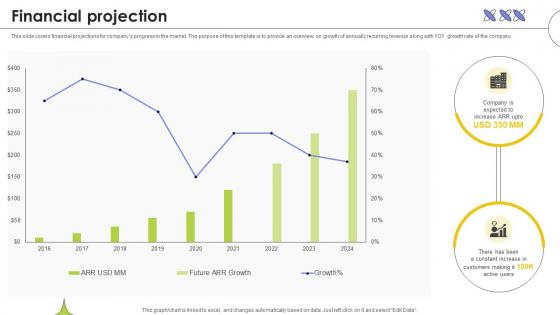
Financial Projection Web Based Automated Tool Platform Pitch Deck Ppt Template
This slide covers financial projections for companys progress in the market. The purpose of this template is to provide an overview on growth of annually recurring revenue along with YOY growth rate of the company. Present like a pro with Financial Projection Web Based Automated Tool Platform Pitch Deck Ppt Template. Create beautiful presentations together with your team, using our easy-to-use presentation slides. Share your ideas in real-time and make changes on the fly by downloading our templates. So whether you are in the office, on the go, or in a remote location, you can stay in sync with your team and present your ideas with confidence. With Slidegeeks presentation got a whole lot easier. Grab these presentations today. This slide covers financial projections for companys progress in the market. The purpose of this template is to provide an overview on growth of annually recurring revenue along with YOY growth rate of the company.
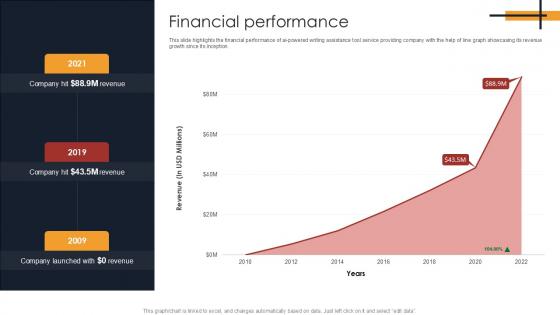
Financial Performance Writing Enhancement Software Pitch Deck PPT Example
This slide highlights the financial performance of ai powered writing assistance tool service providing company with the help of line graph showcasing its revenue growth since its inception. Find a pre designed and impeccable Financial Performance Writing Enhancement Software Pitch Deck PPT Example. The templates can ace your presentation without additional effort. You can download these easy to edit presentation templates to make your presentation stand out from others. So, what are you waiting for Download the template from Slidegeeks today and give a unique touch to your presentation. This slide highlights the financial performance of ai powered writing assistance tool service providing company with the help of line graph showcasing its revenue growth since its inception.
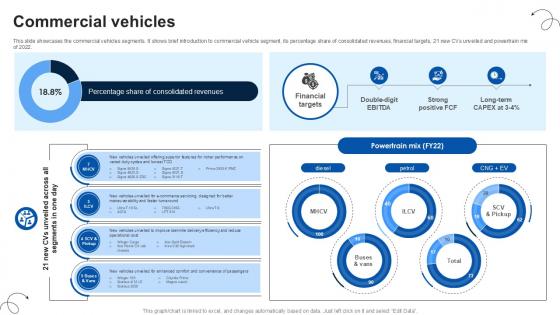
Commercial Vehicles Luxury Automobile Vehicles PPT PowerPoint CP SS V
This slide showcases the commercial vehicles segments. It shows brief introduction to commercial vehicle segment, its percentage share of consolidated revenues, financial targets, 21 new CVs unveiled and powertrain mix of 2022. Get a simple yet stunning designed Commercial Vehicles Luxury Automobile Vehicles PPT PowerPoint CP SS V. It is the best one to establish the tone in your meetings. It is an excellent way to make your presentations highly effective. So, download this PPT today from Slidegeeks and see the positive impacts. Our easy-to-edit Commercial Vehicles Luxury Automobile Vehicles PPT PowerPoint CP SS V can be your go-to option for all upcoming conferences and meetings. So, what are you waiting for Grab this template today. This slide showcases the commercial vehicles segments. It shows brief introduction to commercial vehicle segment, its percentage share of consolidated revenues, financial targets, 21 new CVs unveiled and powertrain mix of 2022.

Financial Metrics Of Commercial Vehicles Luxury Automobile Vehicles PPT Slide CP SS V
This slide showcases the financial metrics of commercial vehicles. It includes metrics such as sales volume in units, revenue in crores, domestic market share and EBITDA percent and Y-O-Y growth. Make sure to capture your audiences attention in your business displays with our gratis customizable Financial Metrics Of Commercial Vehicles Luxury Automobile Vehicles PPT Slide CP SS V. These are great for business strategies, office conferences, capital raising or task suggestions. If you desire to acquire more customers for your tech business and ensure they stay satisfied, create your own sales presentation with these plain slides. This slide showcases the financial metrics of commercial vehicles. It includes metrics such as sales volume in units, revenue in crores, domestic market share and EBITDA percent and Y-O-Y growth.

Financial Metrics Of Land Rover Jaguar Luxury Automobile Vehicles PPT PowerPoint CP SS V
This slide showcases the financial metrics of Land Rover Jaguar. It includes metrics such as sales volume in units including CJLR, revenue million, Free cash flowpost interest million, EBITDA and Y-O-Y growth. Coming up with a presentation necessitates that the majority of the effort goes into the content and the message you intend to convey. The visuals of a PowerPoint presentation can only be effective if it supplements and supports the story that is being told. Keeping this in mind our experts created Financial Metrics Of Land Rover Jaguar Luxury Automobile Vehicles PPT PowerPoint CP SS V to reduce the time that goes into designing the presentation. This way, you can concentrate on the message while our designers take care of providing you with the right template for the situation. This slide showcases the financial metrics of Land Rover Jaguar. It includes metrics such as sales volume in units including CJLR, revenue million, Free cash flowpost interest million, EBITDA and Y-O-Y growth.

Financial Metrics Of Passenger Vehicles Luxury Automobile Vehicles PPT Slide CP SS V
This slide showcases the financial metrics of passenger vehicles. It includes metrics such as sales volume in units, revenue in crores, market share and EBITDA percent and Y-O-Y growth. This modern and well-arranged Financial Metrics Of Passenger Vehicles Luxury Automobile Vehicles PPT Slide CP SS V provides lots of creative possibilities. It is very simple to customize and edit with the Powerpoint Software. Just drag and drop your pictures into the shapes. All facets of this template can be edited with Powerpoint, no extra software is necessary. Add your own material, put your images in the places assigned for them, adjust the colors, and then you can show your slides to the world, with an animated slide included. This slide showcases the financial metrics of passenger vehicles. It includes metrics such as sales volume in units, revenue in crores, market share and EBITDA percent and Y-O-Y growth.
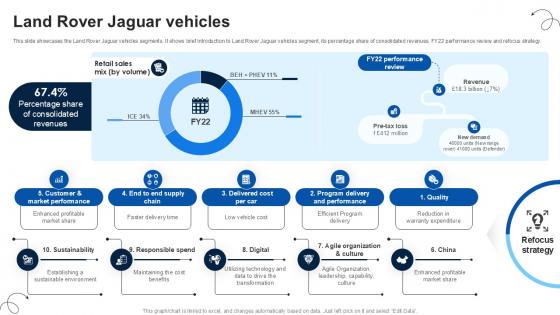
Land Rover Jaguar Vehicles Luxury Automobile Vehicles PPT Example CP SS V
This slide showcases the Land Rover Jaguar vehicles segments. It shows brief introduction to Land Rover Jaguar vehicles segment, its percentage share of consolidated revenues, FY22 performance review and refocus strategy. Are you searching for a Land Rover Jaguar Vehicles Luxury Automobile Vehicles PPT Example CP SS V that is uncluttered, straightforward, and original Its easy to edit, and you can change the colors to suit your personal or business branding. For a presentation that expresses how much effort you have put in, this template is ideal With all of its features, including tables, diagrams, statistics, and lists, its perfect for a business plan presentation. Make your ideas more appealing with these professional slides. Download Land Rover Jaguar Vehicles Luxury Automobile Vehicles PPT Example CP SS V from Slidegeeks today. This slide showcases the Land Rover Jaguar vehicles segments. It shows brief introduction to Land Rover Jaguar vehicles segment, its percentage share of consolidated revenues, FY22 performance review and refocus strategy.
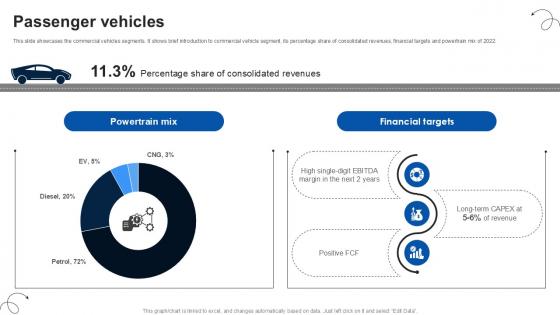
Passenger Vehicles Luxury Automobile Vehicles PPT PowerPoint CP SS V
This slide showcases the commercial vehicles segments. It shows brief introduction to commercial vehicle segment, its percentage share of consolidated revenues, financial targets and powertrain mix of 2022. Do you know about Slidesgeeks Passenger Vehicles Luxury Automobile Vehicles PPT PowerPoint CP SS V These are perfect for delivering any kind od presentation. Using it, create PowerPoint presentations that communicate your ideas and engage audiences. Save time and effort by using our pre-designed presentation templates that are perfect for a wide range of topic. Our vast selection of designs covers a range of styles, from creative to business, and are all highly customizable and easy to edit. Download as a PowerPoint template or use them as Google Slides themes. This slide showcases the commercial vehicles segments. It shows brief introduction to commercial vehicle segment, its percentage share of consolidated revenues, financial targets and powertrain mix of 2022.
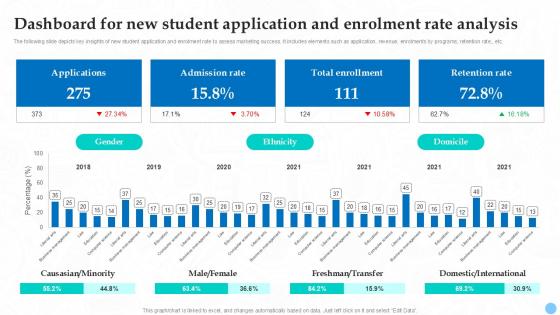
Dashboard For New Student Application Higher Education Ppt Sample Strategy SS V
The following slide depicts key insights of new student application and enrolment rate to assess marketing success. It includes elements such as application, revenue, enrolments by programs, retention rate, etc. Crafting an eye-catching presentation has never been more straightforward. Let your presentation shine with this tasteful yet straightforward Dashboard For New Student Application Higher Education Ppt Sample Strategy SS V template. It offers a minimalistic and classy look that is great for making a statement. The colors have been employed intelligently to add a bit of playfulness while still remaining professional. Construct the ideal Dashboard For New Student Application Higher Education Ppt Sample Strategy SS V that effortlessly grabs the attention of your audience Begin now and be certain to wow your customers The following slide depicts key insights of new student application and enrolment rate to assess marketing success. It includes elements such as application, revenue, enrolments by programs, retention rate, etc.
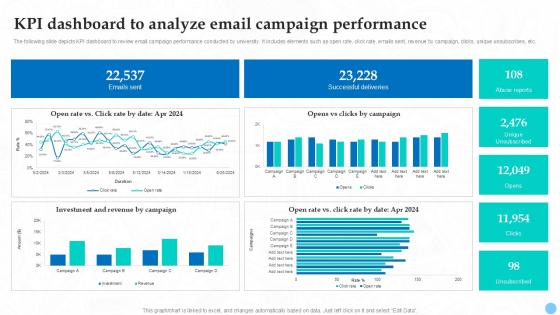
KPI Dashboard To Analyze Email Campaign Higher Education Ppt Sample Strategy SS V
The following slide depicts KPI dashboard to review email campaign performance conducted by university. It includes elements such as open rate, click rate, emails sent, revenue by campaign, clicks, unique unsubscribes, etc. The KPI Dashboard To Analyze Email Campaign Higher Education Ppt Sample Strategy SS V is a compilation of the most recent design trends as a series of slides. It is suitable for any subject or industry presentation, containing attractive visuals and photo spots for businesses to clearly express their messages. This template contains a variety of slides for the user to input data, such as structures to contrast two elements, bullet points, and slides for written information. Slidegeeks is prepared to create an impression. The following slide depicts KPI dashboard to review email campaign performance conducted by university. It includes elements such as open rate, click rate, emails sent, revenue by campaign, clicks, unique unsubscribes, etc.
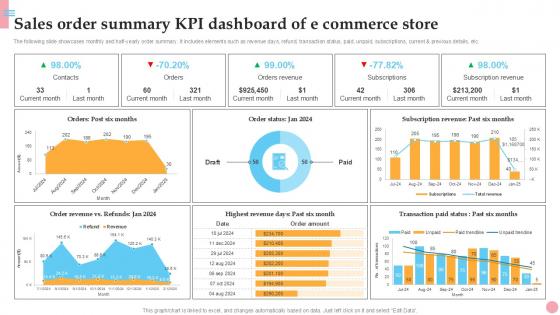
Sales Order Summary KPI Dashboard How To Improve Company PPT Sample Strategy SS V
The following slide showcases monthly and half-yearly order summary. It includes elements such as revenue days, refund, transaction status, paid, unpaid, subscriptions, current and previous details, etc. Do you know about Slidesgeeks Sales Order Summary KPI Dashboard How To Improve Company PPT Sample Strategy SS V These are perfect for delivering any kind od presentation. Using it, create PowerPoint presentations that communicate your ideas and engage audiences. Save time and effort by using our pre-designed presentation templates that are perfect for a wide range of topic. Our vast selection of designs covers a range of styles, from creative to business, and are all highly customizable and easy to edit. Download as a PowerPoint template or use them as Google Slides themes. The following slide showcases monthly and half-yearly order summary. It includes elements such as revenue days, refund, transaction status, paid, unpaid, subscriptions, current and previous details, etc.


 Continue with Email

 Home
Home


