Cost And Profit
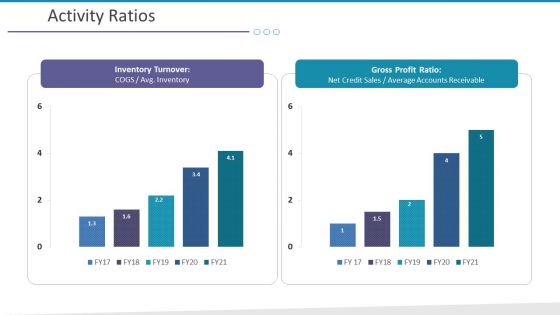
Investigation For Business Procurement Activity Ratios Ppt Slides Designs Download PDF
Deliver an awe-inspiring pitch with this creative investigation for business procurement activity ratios ppt slides designs download pdf. bundle. Topics like inventory turnover, gross profit ratio can be discussed with this completely editable template. It is available for immediate download depending on the needs and requirements of the user.

Customer Relationship Management Action Plan CRM Data Analysis Gride Pictures PDF
Deliver an awe inspiring pitch with this creative customer relationship management action plan crm data analysis gride pictures pdf bundle. Topics like activity last 3 months, sales last 3 months, profit last 3 months can be discussed with this completely editable template. It is available for immediate download depending on the needs and requirements of the user.
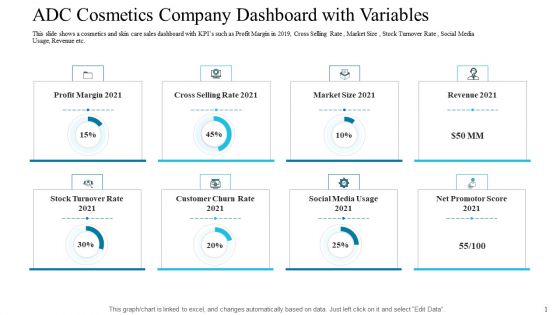
ADC Cosmetics Company Dashboard With Variables Brochure PDF
Deliver an awe inspiring pitch with this creative adc cosmetics company dashboard with variables brochure pdf bundle. Topics like profit margin 2021, cross selling rate 2021, market size 2021 can be discussed with this completely editable template. It is available for immediate download depending on the needs and requirements of the user.
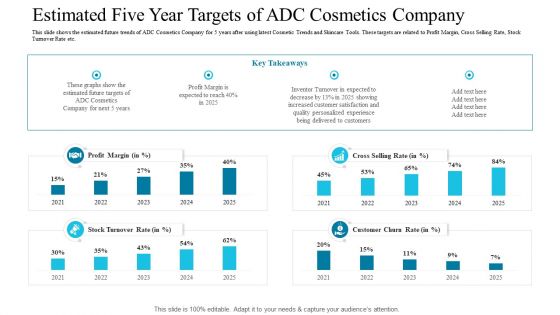
Estimated Five Year Targets Of ADC Cosmetics Company Download PDF
Deliver and pitch your topic in the best possible manner with this estimated five year targets of adc cosmetics company download pdf. Use them to share invaluable insights on profit margin, cross selling rate, stock turnover rate and impress your audience. This template can be altered and modified as per your expectations. So, grab it now.
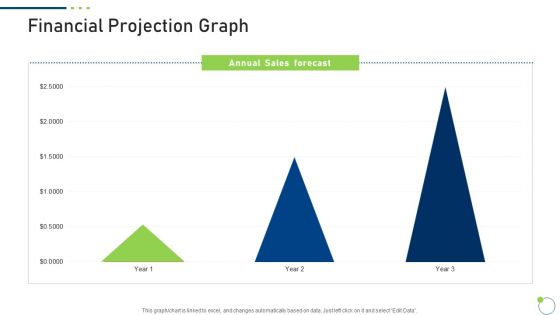
Investor Pitch Deck New Venture Capital Raising Financial Projection Graph Slide2 Portrait PDF
Deliver and pitch your topic in the best possible manner with this investor pitch deck new venture capital raising financial projection graph slide2 portrait pdf. Use them to share invaluable insights on annual sales, gross margin, net profit and impress your audience. This template can be altered and modified as per your expectations. So, grab it now.
KPI Dashboard Showing Warehouse Data And Fleet Status Icons PDF
Pitch your topic with ease and precision using this KPI Dashboard Showing Warehouse Data And Fleet Status Icons PDF This layout presents information on Deliveries By Country, Delivery Status, Profit By Country It is also available for immediate download and adjustment. So, changes can be made in the color, design, graphics or any other component to create a unique layout.

Escape Plan Venture Capitalist Potential Buyer Profile Ppt Slides Design Templates PDF
Presenting this set of slides with name escape plan venture capitalist potential buyer profile ppt slides design templates pdf. The topics discussed in these slides are industry, geography, profit margin, revenues, business objectives, decision making factors, budget, notable attributes. This is a completely editable PowerPoint presentation and is available for immediate download. Download now and impress your audience.
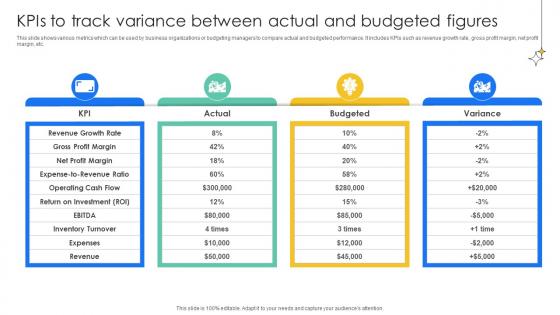
KPIs To Track Variance Between Actual Effective And Efficient Tools To Develop Fin SS V
This slide shows various metrics which can be used by business organizations or budgeting managers to compare actual and budgeted performance. It includes KPIs such as revenue growth rate, gross profit margin, net profit margin, etc. Coming up with a presentation necessitates that the majority of the effort goes into the content and the message you intend to convey. The visuals of a PowerPoint presentation can only be effective if it supplements and supports the story that is being told. Keeping this in mind our experts created KPIs To Track Variance Between Actual Effective And Efficient Tools To Develop Fin SS V to reduce the time that goes into designing the presentation. This way, you can concentrate on the message while our designers take care of providing you with the right template for the situation. This slide shows various metrics which can be used by business organizations or budgeting managers to compare actual and budgeted performance. It includes KPIs such as revenue growth rate, gross profit margin, net profit margin, etc.
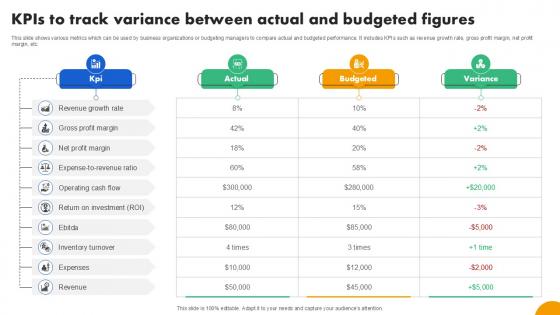
KPIs To Track Variance Between Strategies To Develop Effective Ppt PowerPoint Fin SS V
This slide shows various metrics which can be used by business organizations or budgeting managers to compare actual and budgeted performance. It includes KPIs such as revenue growth rate, gross profit margin, net profit margin, etc. Coming up with a presentation necessitates that the majority of the effort goes into the content and the message you intend to convey. The visuals of a PowerPoint presentation can only be effective if it supplements and supports the story that is being told. Keeping this in mind our experts created KPIs To Track Variance Between Strategies To Develop Effective Ppt PowerPoint Fin SS V to reduce the time that goes into designing the presentation. This way, you can concentrate on the message while our designers take care of providing you with the right template for the situation. This slide shows various metrics which can be used by business organizations or budgeting managers to compare actual and budgeted performance. It includes KPIs such as revenue growth rate, gross profit margin, net profit margin, etc.
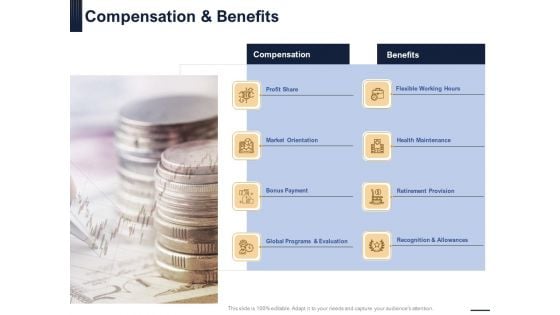
Guide Map Employee Experience Workplace Compensation And Benefits Ppt Infographics Background Designs PDF
Presenting this set of slides with name guide map employee experience workplace compensation and benefits ppt infographics background designs pdf. This is a eight stage process. The stages in this process are profit share, market orientation, bonus payment, flexible working hours, health maintenance, retirement provision. This is a completely editable PowerPoint presentation and is available for immediate download. Download now and impress your audience.
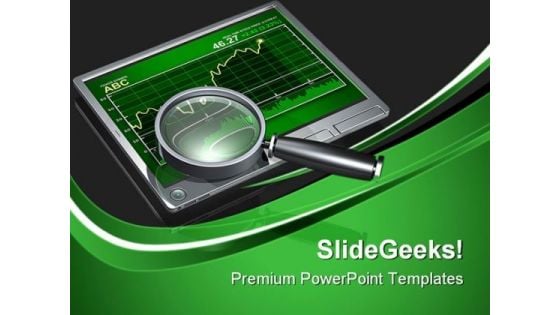
Online Stock Data Internet PowerPoint Templates And PowerPoint Backgrounds 0311
Microsoft PowerPoint Template and Background with a large magnifying glass top of touch screen computer with green stock chart show profit Our Online Stock Data Internet PowerPoint Templates And PowerPoint Backgrounds 0311 define the standards. Like you they excel at what they do.

Pick Me Leadership PowerPoint Templates And PowerPoint Backgrounds 0911
Microsoft PowerPoint Template and Background with pick me and stands out from the crowded field of applicants for a new job Achieve strong & sustainable profit gains with our Pick Me Leadership PowerPoint Templates And PowerPoint Backgrounds 0911. They will make you look good.
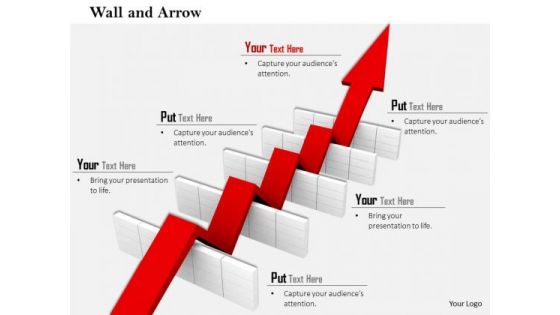
Stock Photo Arrow Making Path In Hurdles PowerPoint Slide
This power point image has been crafted with graphic of red arrow and stairs. In this image red arrow is moving upward on stairs which displays the concept of leadership and growth. Use this image for displaying growth in profit aspects for any business and financial matters. Build a quality presentations for your viewers and get noticed.

Stock Photo Blue Green Yellow Arrows In Upward Position PowerPoint Slide
Blue, green and yellow arrows are use in this power point image slide. All these arrows are twisted and in upward direction. These arrows are showing the concept of growth. Display growth in business and profit with this conceptual image. Build an innovative presentations with our unique image collection.
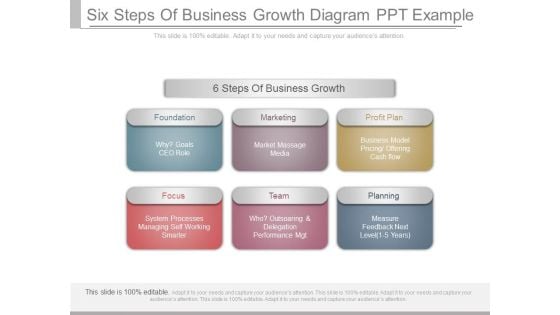
Six Steps Of Business Growth Diagram Ppt Example
This is a six steps of business growth diagram ppt example. This is a six stage process. The stages in this process are foundation, marketing, profit plan, focus, team, planning, why goals ceo role, market massage media, business model pricing offering cash flow, system processes managing self working smarter, who outsoaring and delegation performance mgt, measure feedback next level.\n\n
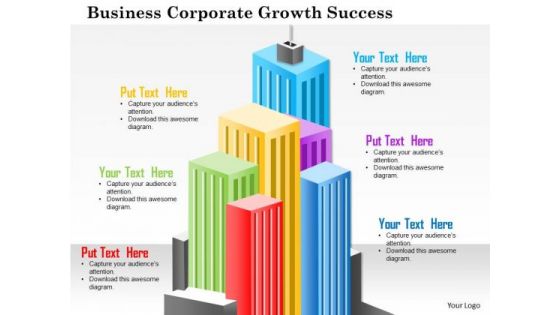
Business Framework Business Corporate Growth Success PowerPoint Presentation
This power point diagram slide has been designed with business corporate growth and success concept. To display this concept we have used graphic of multicolored bar graphs. This graphic slide is based on profit growth in any business. Use this slide for business and finance related presentations.
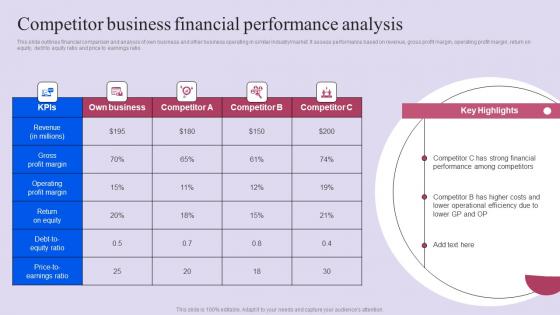
Competitor Business Financial Performance Analysis Ppt Slides Display Pdf
This slide outlines financial comparison and analysis of own business and other business operating in similar industrymarket. It assess performance based on revenue, gross profit margin, operating profit margin, return on equity, debt to equity ratio and price to earnings ratio. Do you have an important presentation coming up Are you looking for something that will make your presentation stand out from the rest Look no further than Competitor Business Financial Performance Analysis Ppt Slides Display Pdf. With our professional designs, you can trust that your presentation will pop and make delivering it a smooth process. And with Slidegeeks, you can trust that your presentation will be unique and memorable. So why wait Grab Competitor Business Financial Performance Analysis Ppt Slides Display Pdf today and make your presentation stand out from the rest This slide outlines financial comparison and analysis of own business and other business operating in similar industrymarket. It assess performance based on revenue, gross profit margin, operating profit margin, return on equity, debt to equity ratio and price to earnings ratio.
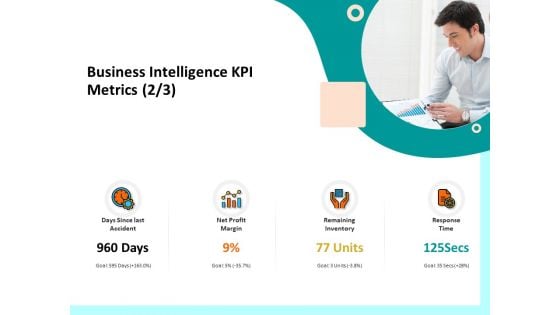
Firm Productivity Administration Business Intelligence KPI Metrics Inventory Ppt PowerPoint Presentation Inspiration Guide PDF
Presenting this set of slides with name firm productivity administration business intelligence kpi metrics inventory ppt powerpoint presentation inspiration guide pdf. This is a four stage process. The stages in this process are days since last accident, net profit margin, remaining inventory, response time. This is a completely editable PowerPoint presentation and is available for immediate download. Download now and impress your audience.
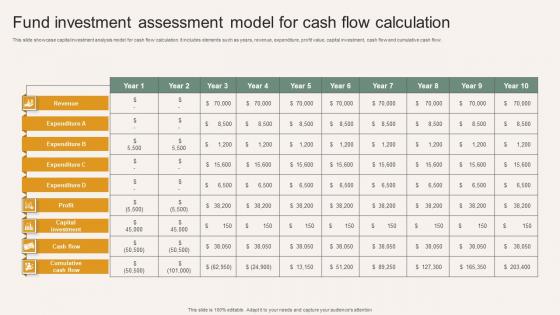
Fund Investment Assessment Model For Cash Flow Calculation Structure Pdf
This slide showcase capital investment analysis model for cash flow calculation. It includes elements such as years, revenue, expenditure, profit value, capital investment, cash flow and cumulative cash flow. Pitch your topic with ease and precision using this Fund Investment Assessment Model For Cash Flow Calculation Structure Pdf. This layout presents information on Fund Investment Assessment Model, Cash Flow Calculation, Revenue, Expenditure. It is also available for immediate download and adjustment. So, changes can be made in the color, design, graphics or any other component to create a unique layout. This slide showcase capital investment analysis model for cash flow calculation. It includes elements such as years, revenue, expenditure, profit value, capital investment, cash flow and cumulative cash flow.
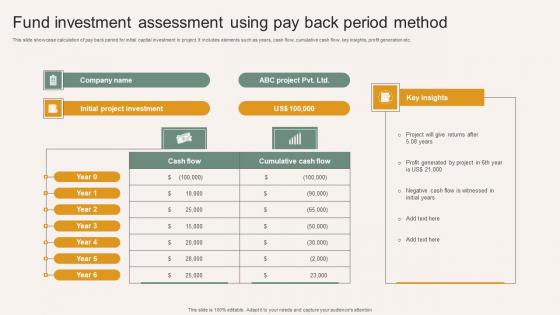
Fund Investment Assessment Using Pay Back Period Method Inspiration Pdf
This slide showcase calculation of pay back period for initial capital investment in project. It includes elements such as years, cash flow, cumulative cash flow, key insights, profit generation etc. Pitch your topic with ease and precision using this Fund Investment Assessment Using Pay Back Period Method Inspiration Pdf. This layout presents information on Fund Investment Assessment, Pay Back Period Method, Cash Flow, Cumulative Cash Flow. It is also available for immediate download and adjustment. So, changes can be made in the color, design, graphics or any other component to create a unique layout. This slide showcase calculation of pay back period for initial capital investment in project. It includes elements such as years, cash flow, cumulative cash flow, key insights, profit generation etc.
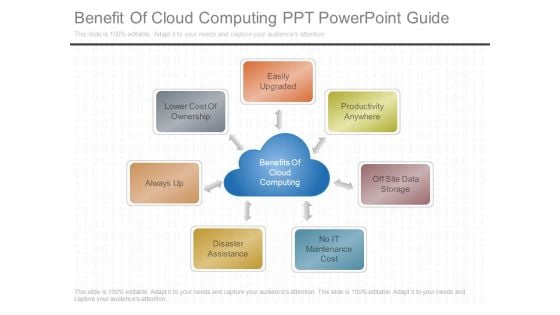
Benefits Of Cloud Computing Ppt Powerpoint Guide
This is a benefits of cloud computing ppt powerpoint guide. This is a seven stage process. The stages in this process are lower cost of ownership, always up, disaster assistance, no it maintenance cost, off site data storage, productivity anywhere, easily upgraded, benefits of cloud computing.
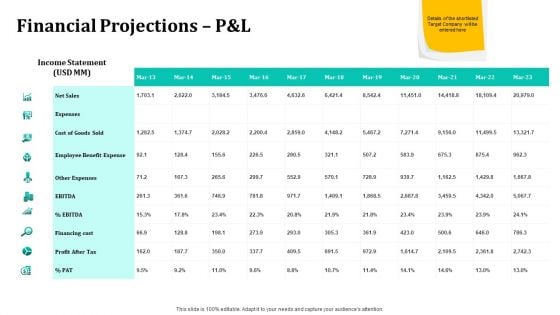
Merger And Acquisition Strategy For Inorganic Growth Financial Projections P And L Ppt Show PDF
Deliver an awe inspiring pitch with this creative merger and acquisition strategy for inorganic growth financial projections P and L ppt show pdf bundle. Topics like income statement, net sales, cost of goods sold, financing cost, employee benefit expense can be discussed with this completely editable template. It is available for immediate download depending on the needs and requirements of the user.
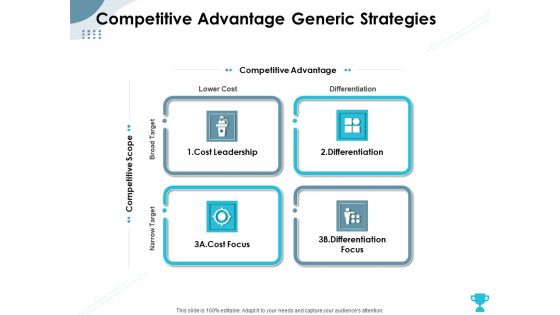
Strategies Take Your Retail Business Ahead Competition Competitive Advantage Generic Strategies Structure PDF
Presenting this set of slides with name strategies take your retail business ahead competition competitive advantage generic strategies structure pdf. This is a four stage process. The stages in this process are cost leadership, differentiation, cost focus, differentiation focus. This is a completely editable PowerPoint presentation and is available for immediate download. Download now and impress your audience.
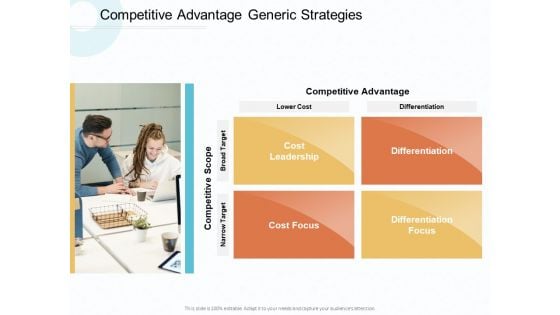
Action Plan Gain Competitive Advantage Generic Strategies Ppt Layouts Background Images PDF
Presenting this set of slides with name action plan gain competitive advantage generic strategies ppt layouts background images pdf. The topics discussed in these slides are cost leadership, differentiation, differentiation focus, cost focus. This is a completely editable PowerPoint presentation and is available for immediate download. Download now and impress your audience.
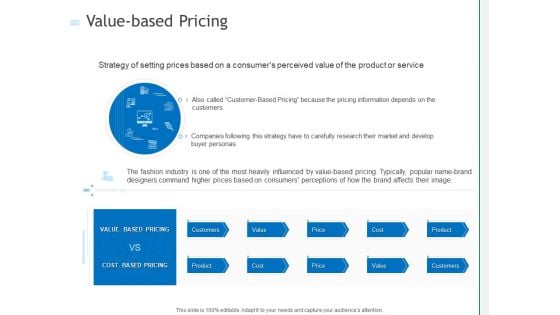
Value Based Pricing Ppt PowerPoint Presentation Infographics Themes PDF
Presenting this set of slides with name value based pricing ppt powerpoint presentation infographics themes pdf. This is a one stage process. The stages in this process are value based pricing, cost based pricing, customer-based pricing, strategy, carefully research, customers, value, price, cost, product, customers. This is a completely editable PowerPoint presentation and is available for immediate download. Download now and impress your audience.
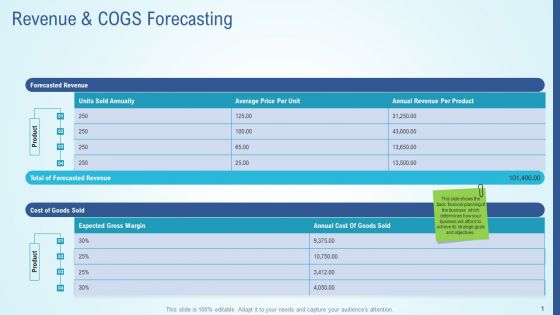
Business Strategy Development Process Revenue And COGS Forecasting Graphics PDF
Deliver an awe inspiring pitch with this creative business strategy development process revenue and cogs forecasting graphics pdf bundle. Topics like forecasted revenue, cost of goods sold, annual revenue per product, annual cost of goods sold can be discussed with this completely editable template. It is available for immediate download depending on the needs and requirements of the user.
Firm Competitive Plan Of Action To Gain Competitive Advantage Across Industry Ppt PowerPoint Presentation Complete Deck With Slides
Presenting this set of slides with name firm competitive plan of action to gain competitive advantage across industry ppt powerpoint presentation complete deck with slides. The topics discussed in these slides are economies, business, goals, cost leadership, cost focus. This is a completely editable PowerPoint presentation and is available for immediate download. Download now and impress your audience.
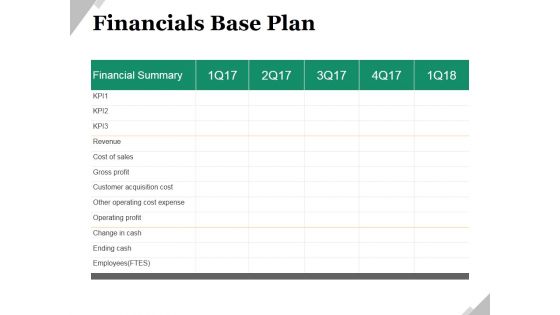
Financials Base Plan Ppt PowerPoint Presentation Model Shapes
This is a financials base plan ppt powerpoint presentation model shapes. This is a five stage process. The stages in this process are financial summary, business, marketing, revenue, cost of sales, gross profit.
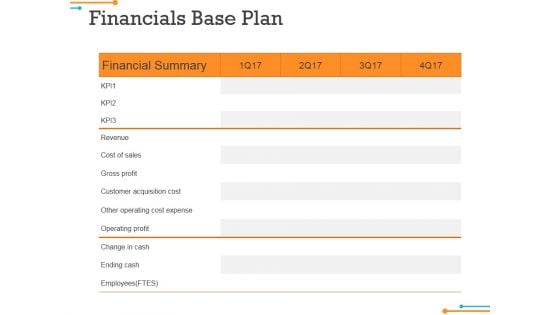
Financials Base Plan Ppt Powerpoint Presentation Slides Design Inspiration
This is a financials base plan ppt powerpoint presentation slides design inspiration. This is a four stage process. The stages in this process are financial summary, revenue, cost of sales, gross profit.
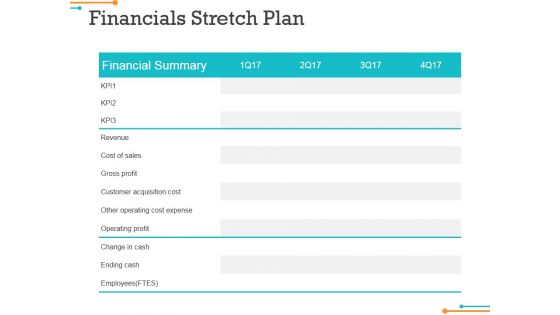
Financials Stretch Plan Ppt Powerpoint Presentation Infographics Background Image
This is a financials stretch plan ppt powerpoint presentation infographics background image. This is a four stage process. The stages in this process are financial summary, revenue, cost of sales, gross profit.
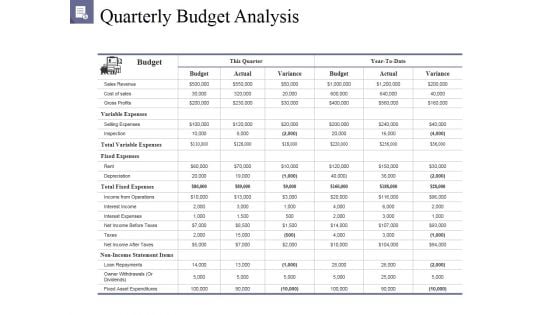
Quarterly Budget Analysis Ppt PowerPoint Presentation Outline Background Image
This is a quarterly budget analysis ppt powerpoint presentation outline background image. This is a two stage process. The stages in this process are budget, this quarter, sales revenue, cost of sales, gross profits.
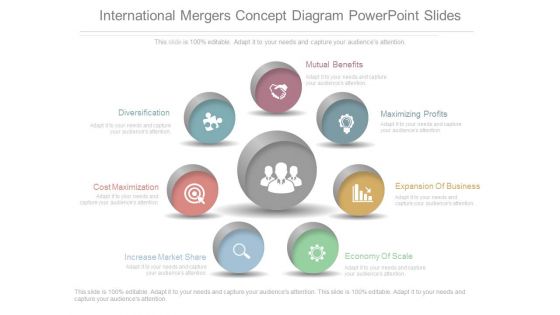
International Mergers Concept Diagram Powerpoint Slides
This is an international mergers concept diagram powerpoint slides. This is a seven stage process. The stages in this process are mutual benefits, maximizing profits, expansion of business, economy of scale, increase market share, cost maximization, diversification.
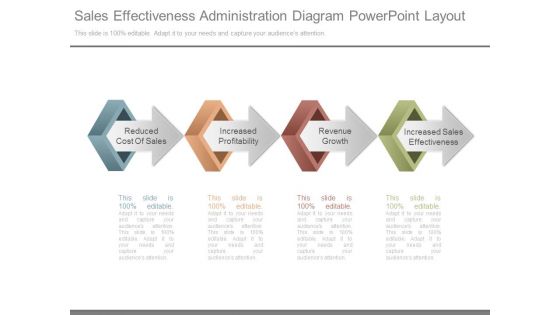
Sales Effectiveness Administration Diagram Powerpoint Layout
This is a sales effectiveness administration diagram powerpoint layout. This is a four stage process. The stages in this process are reduced cost of sales, increased profitability, revenue growth, increased sales effectiveness.
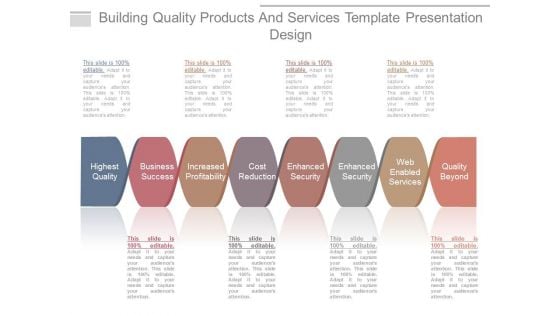
Building Quality Products And Services Template Presentation Design
This is a building quality products and services template presentation design. This is a eight stage process. The stages in this process are highest quality, business success, increased profitability, cost reduction, enhanced security, web enabled services, quality beyond.
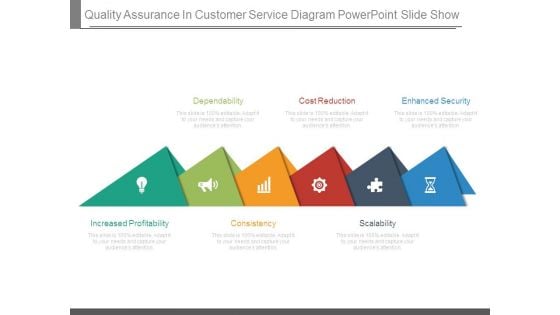
Quality Assurance In Customer Service Diagram Powerpoint Slide Show
This is a quality assurance in customer service diagram powerpoint slide show. This is a six stage process. The stages in this process are dependability, cost reduction, enhanced security, scalability, consistency, increased profitability.
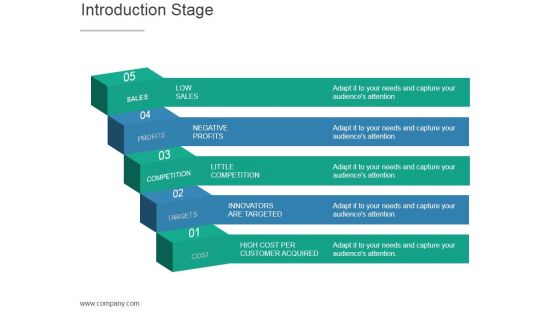
Introduction Stage Ppt PowerPoint Presentation Graphics
This is a introduction stage ppt powerpoint presentation graphics. This is a five stage process. The stages in this process are low sales, negative profits, little competition, innovators are targeted, high cost per customer acquired.
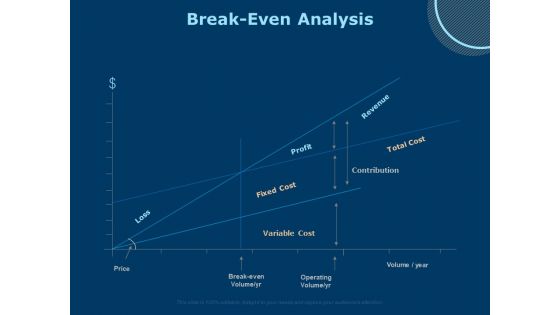
Investing In Start Ups Break Even Analysis Ppt Show Smartart PDF
Presenting this set of slides with name investing in start ups break even analysis ppt show smartart pdf. This is a one stage process. The stages in this process are fixed cost, variable cost, total cost, revenue, profit contribution, operating volume, break even, volume, loss, price. This is a completely editable PowerPoint presentation and is available for immediate download. Download now and impress your audience.
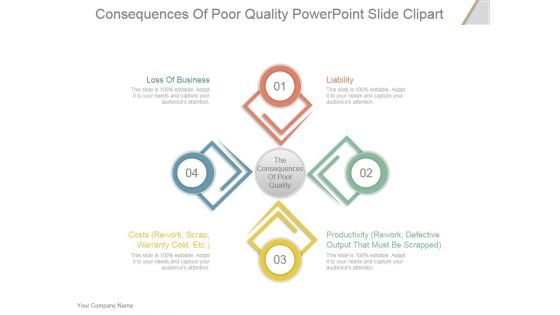
Consequences Of Poor Quality Ppt PowerPoint Presentation Deck
This is a consequences of poor quality ppt powerpoint presentation deck. This is a four stage process. The stages in this process are loss of business, costs rework scrap warranty cost etc, the consequences of poor quality, liability, productivity rework defective output that must be scrapped.
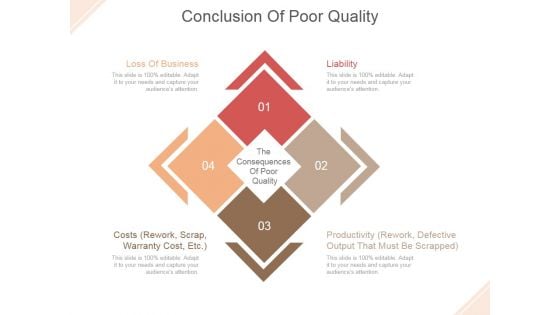
Conclusion Of Poor Quality Ppt PowerPoint Presentation Show
This is a conclusion of poor quality ppt powerpoint presentation show. This is a four stage process. The stage in this process are loss of business, liability, costs rework scrap warranty cost etc, productivity rework defective output that must be scrapped, the consequences of poor quality.
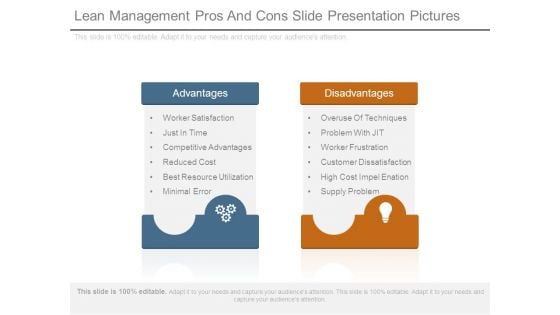
Lean Management Pros And Cons Slide Presentation Pictures
This is a lean management pros and cons slide presentation pictures. This is a two stage process. The stages in this process are advantages, worker satisfaction, just in time, competitive advantages, reduced cost, best resource utilization, minimal error, disadvantages overuse of techniques, problem with jit, worker frustration, customer dissatisfaction, high cost impel enation, supply problem.
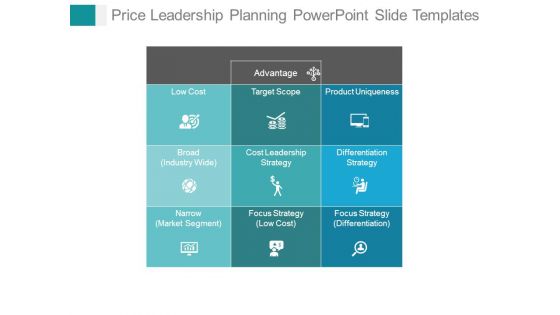
Price Leadership Planning Powerpoint Slide Templates
This is a price leadership planning powerpoint slide templates. This is a nine stage process. The stages in this process are advantage, low cost, broad industry wide, narrow market segment, target scope, cost leadership strategy, focus strategy, product uniqueness, differentiation strategy, focus strategy differentiation.
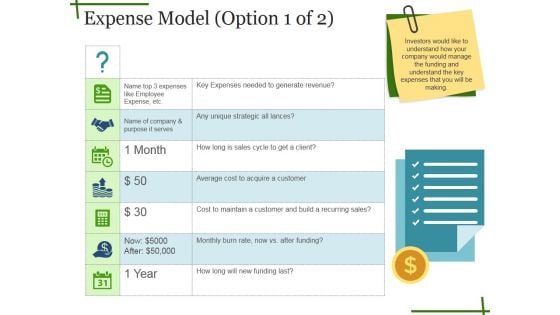
Expense Model Ppt PowerPoint Presentation Slides
This is a expense model ppt powerpoint presentation slides. This is a seven stage process. The stages in this process are key expenses needed to generate revenue, any unique strategic alliances, how long is sales cycle to get a client, average cost to acquire a customer, cost to maintain a customer and build a recurring sales.
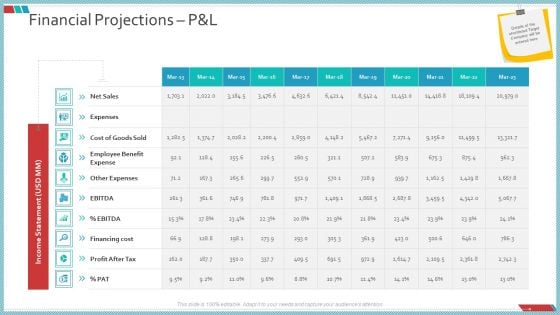
Enterprise Action Plan For Growth Financial Projections P And L Portrait PDF
Deliver and pitch your topic in the best possible manner with this enterprise action plan for growth financial projections p and l portrait pdf. Use them to share invaluable insights on cost of goods sold, employee benefit expense, financing cost and impress your audience. This template can be altered and modified as per your expectations. So, grab it now.
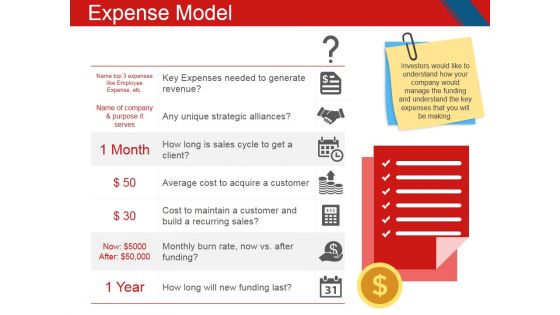
Expense Model Template 1 Ppt PowerPoint Presentation Slides Format Ideas
This is a expense model template 1 ppt powerpoint presentation slides format ideas. This is a two stage process. The stages in this process are key expenses needed to generate revenue, any unique strategic alliances, how long is sales cycle to get a client, average cost to acquire a customer, cost to maintain a customer and build a recurring sales.
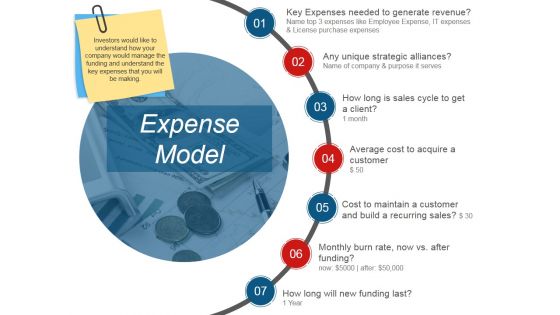
Expense Model Template 2 Ppt PowerPoint Presentation Gallery Infographic Template
This is a expense model template 2 ppt powerpoint presentation gallery infographic template. This is a seven stage process. The stages in this process are key expenses needed to generate revenue, any unique strategic alliances, how long is sales cycle to get a client, average cost to acquire a customer, cost to maintain a customer and build a recurring sales.
Expense Model Template Ppt PowerPoint Presentation Icon Deck
This is a expense model template ppt powerpoint presentation icon deck. This is a seven stage process. The stages in this process are key expenses needed to generate revenue, any unique strategic all lances, how long is sales cycle to get a client, average cost to acquire a customer, cost to maintain a customer and build a recurring sales.
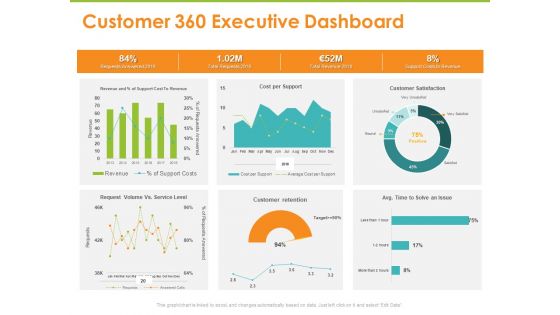
Synchronized Information About Your Customers Customer 360 Executive Dashboard Ppt PowerPoint Presentation Ideas Aids PDF
Deliver an awe-inspiring pitch with this creative synchronized information about your customers customer 360 executive dashboard ppt powerpoint presentation ideas aids pdf bundle. Topics like requests answered 2018, total requests 2018, total revenue 2018, support costs to revenue, cost per support can be discussed with this completely editable template. It is available for immediate download depending on the needs and requirements of the user.
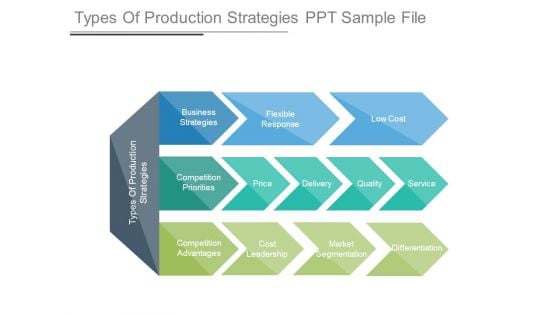
Types Of Production Strategies Ppt Sample File
This is a types of production strategies ppt sample file. This is a three stage process. The stages in this process are types of production strategies, business strategies, flexible response, low cost, competition priorities, price, delivery, quality, service, competition advantages, cost leadership, market segmentation, differentiation.
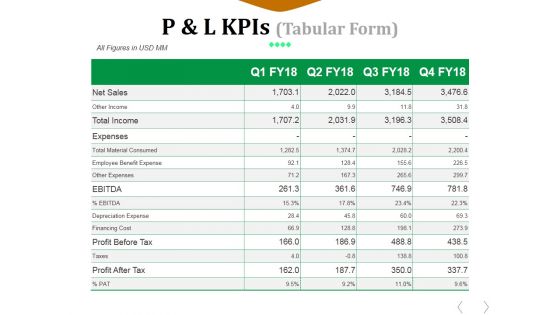
P And L Kpis Template 2 Ppt PowerPoint Presentation File Graphics Example
This is a p and l kpis template 2 ppt powerpoint presentation file graphics example. This is a four stage process. The stages in this process are net sales, expenses, cost of goods sold, employee benefit expense, other expenses, financing cost.
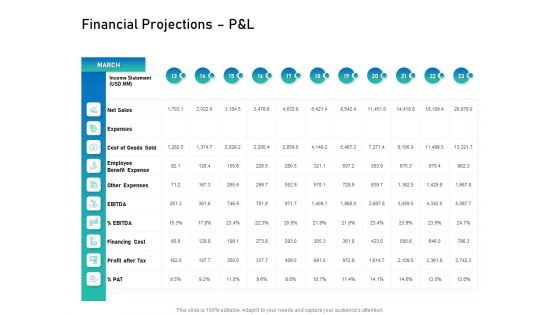
Alliance Evaluation Financial Projections P And L Ppt Outline Summary PDF
Presenting this set of slides with name alliance evaluation financial projections p and l ppt outline summary pdf. The topics discussed in these slides are financing cost, expenses, cost of goods sold, employee benefit expense, other expenses. This is a completely editable PowerPoint presentation and is available for immediate download. Download now and impress your audience.
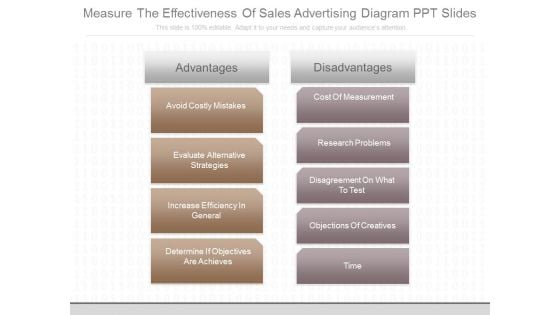
Measure The Effectiveness Of Sales Advertising Diagram Ppt Slides
This is a measure the effectiveness of sales advertising diagram ppt slides. This is a nine stage process. The stages in this process are advantages, avoid costly mistakes, evaluate alternative strategies, increase efficiency in general, determine if objectives are achieves, disadvantages, cost of measurement, research problems, disagreement on what to test, objections of creatives, time.
Strategic Management Of Competitive Management Ppt PowerPoint Presentation Icon Guide PDF
Presenting this set of slides with name strategic management of competitive management ppt powerpoint presentation icon guide pdf. This is a four stage process. The stages in this process are cost leadership, differentiation, focused differentiation, focused cost leadership, competitive advantage, competitive area. This is a completely editable PowerPoint presentation and is available for immediate download. Download now and impress your audience.
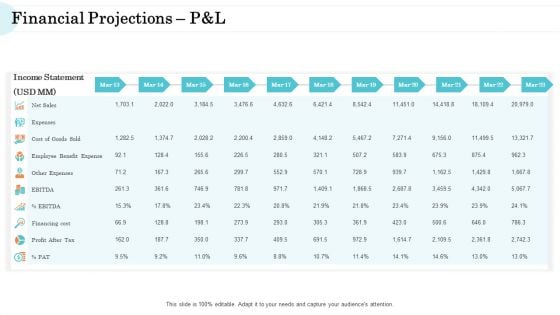
Steps In M And A Process Financial Projections Pandl Pictures PDF
Deliver an awe inspiring pitch with this creative steps in m and a process financial projections pandl pictures pdf bundle. Topics like cost of goods sold, financing cost, employee benefit expense can be discussed with this completely editable template. It is available for immediate download depending on the needs and requirements of the user.
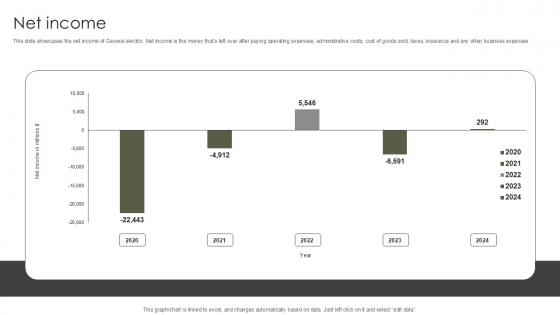
Net Income Military Aircraft Engine Manufacturing PPT Presentation CP SS V
This slide showcases the net income of General electric. Net income is the money thats left over after paying operating expenses, administrative costs, cost of goods sold, taxes, insurance and any other business expenses. Slidegeeks has constructed Net Income Military Aircraft Engine Manufacturing PPT Presentation CP SS V after conducting extensive research and examination. These presentation templates are constantly being generated and modified based on user preferences and critiques from editors. Here, you will find the most attractive templates for a range of purposes while taking into account ratings and remarks from users regarding the content. This is an excellent jumping-off point to explore our content and will give new users an insight into our top-notch PowerPoint Templates. This slide showcases the net income of General electric. Net income is the money thats left over after paying operating expenses, administrative costs, cost of goods sold, taxes, insurance and any other business expenses
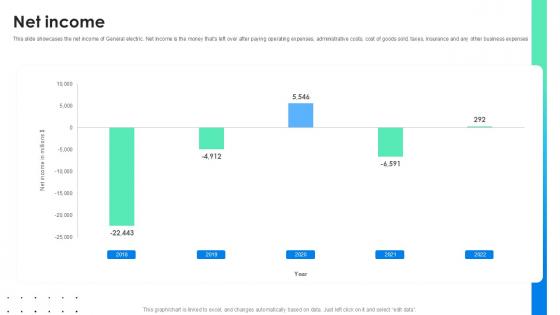
Net Income Global Energy Company Profile PPT Sample CP SS V
This slide showcases the net income of General electric. Net income is the money thats left over after paying operating expenses, administrative costs, cost of goods sold, taxes, insurance and any other business expenses. Slidegeeks has constructed Net Income Global Energy Company Profile PPT Sample CP SS V after conducting extensive research and examination. These presentation templates are constantly being generated and modified based on user preferences and critiques from editors. Here, you will find the most attractive templates for a range of purposes while taking into account ratings and remarks from users regarding the content. This is an excellent jumping-off point to explore our content and will give new users an insight into our top-notch PowerPoint Templates. This slide showcases the net income of General electric. Net income is the money thats left over after paying operating expenses, administrative costs, cost of goods sold, taxes, insurance and any other business expenses
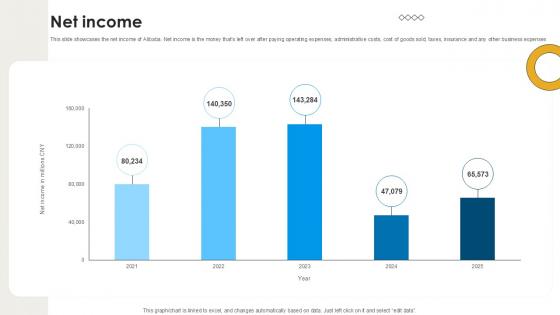
Net Income International Trade Of Products And Services PPT Sample CP SS V
This slide showcases the net income of Alibaba. Net income is the money that s left over after paying operating expenses, administrative costs, cost of goods sold, taxes, insurance and any other business expenses. Slidegeeks has constructed Net Income International Trade Of Products And Services PPT Sample CP SS V after conducting extensive research and examination. These presentation templates are constantly being generated and modified based on user preferences and critiques from editors. Here, you will find the most attractive templates for a range of purposes while taking into account ratings and remarks from users regarding the content. This is an excellent jumping-off point to explore our content and will give new users an insight into our top-notch PowerPoint Templates. This slide showcases the net income of Alibaba. Net income is the money that s left over after paying operating expenses, administrative costs, cost of goods sold, taxes, insurance and any other business expenses
IT Project Results With Roi Analysis Icons PDF
Showcasing this set of slides titledit project results with roi analysis icons pdf. The topics addressed in these templates are it department, revenue, it costs, budget, it cost break down. All the content presented in this PPT design is completely editable. Download it and make adjustments in color, background, font etc. as per your unique business setting.
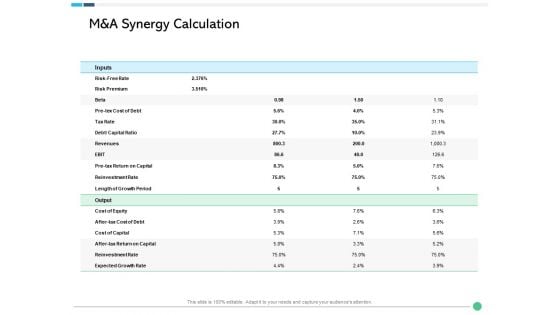
Assessing Synergies M And A Synergy Calculation Ppt PowerPoint Presentation Gallery Designs PDF
Deliver an awe-inspiring pitch with this creative assessing synergies m and a synergy calculation ppt powerpoint presentation gallery designs pdf bundle. Topics like risk free rate, risk premium, revenues, cost equity, cost capital, expected growth rate, reinvestment rate, tax rate can be discussed with this completely editable template. It is available for immediate download depending on the needs and requirements of the user.
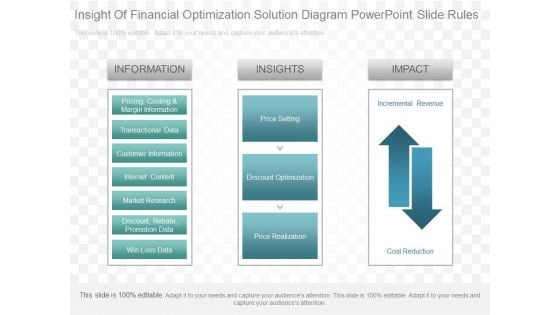
Insight Of Financial Optimization Solution Diagram Powerpoint Slide Rules
This is a insight of financial optimization solution diagram powerpoint slide rules. This is a three stage process. The stages in this process are information, pricing, costing and margin information, transactional data, customer information, internet content, market research, discount, rebate, promotion data, win loss data, insights, price setting, discount optimization, price realization, impact, incremental revenue, cost reduction.
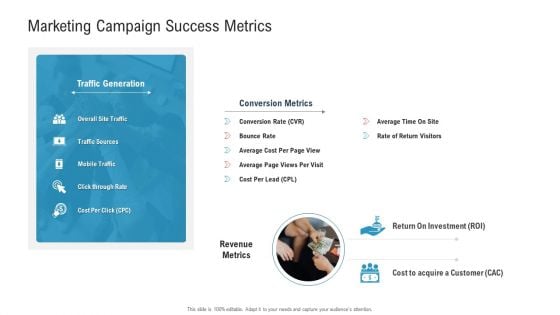
Enhancing Product Service Awareness Advertising Techniques Marketing Campaign Success Metrics Structure PDF
Deliver an awe-inspiring pitch with this creative enhancing product service awareness advertising techniques marketing campaign success metrics structure pdf bundle. Topics like average cost, return on investment, cost to acquire a customer, revenue metrics can be discussed with this completely editable template. It is available for immediate download depending on the needs and requirements of the user.


 Continue with Email

 Home
Home


