Cost Chart
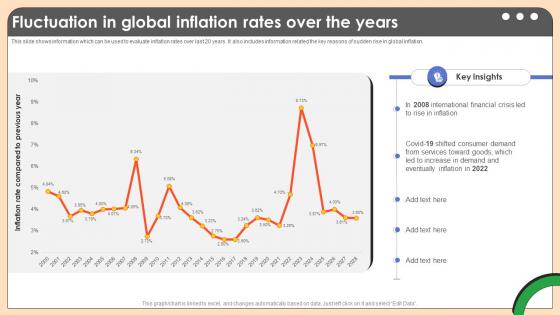
Fluctuation In Global Inflation Rates Comprehensive Guide On Inflation Control CM SS V
This slide shows information which can be used to evaluate inflation rates over last 20 years. It also includes information related the key reasons of sudden rise in global inflation. If you are looking for a format to display your unique thoughts, then the professionally designed Fluctuation In Global Inflation Rates Comprehensive Guide On Inflation Control CM SS V is the one for you. You can use it as a Google Slides template or a PowerPoint template. Incorporate impressive visuals, symbols, images, and other charts. Modify or reorganize the text boxes as you desire. Experiment with shade schemes and font pairings. Alter, share or cooperate with other people on your work. Download Fluctuation In Global Inflation Rates Comprehensive Guide On Inflation Control CM SS V and find out how to give a successful presentation. Present a perfect display to your team and make your presentation unforgettable. This slide shows information which can be used to evaluate inflation rates over last 20 years. It also includes information related the key reasons of sudden rise in global inflation.
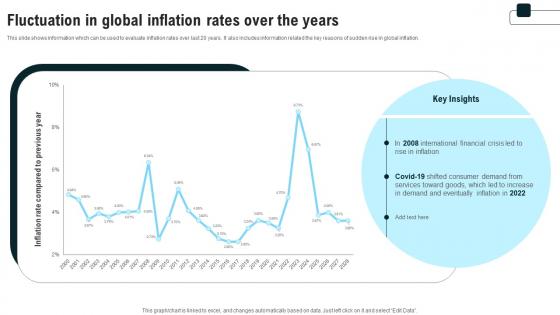
Fluctuation In Global Inflation Rates Over The Years Strategies For Inflation A Tactical Guide Fin SS V
This slide shows information which can be used to evaluate inflation rates over last 20 years. It also includes information related the key reasons of sudden rise in global inflation. If you are looking for a format to display your unique thoughts, then the professionally designed Fluctuation In Global Inflation Rates Over The Years Strategies For Inflation A Tactical Guide Fin SS V is the one for you. You can use it as a Google Slides template or a PowerPoint template. Incorporate impressive visuals, symbols, images, and other charts. Modify or reorganize the text boxes as you desire. Experiment with shade schemes and font pairings. Alter, share or cooperate with other people on your work. Download Fluctuation In Global Inflation Rates Over The Years Strategies For Inflation A Tactical Guide Fin SS V and find out how to give a successful presentation. Present a perfect display to your team and make your presentation unforgettable. This slide shows information which can be used to evaluate inflation rates over last 20 years. It also includes information related the key reasons of sudden rise in global inflation.
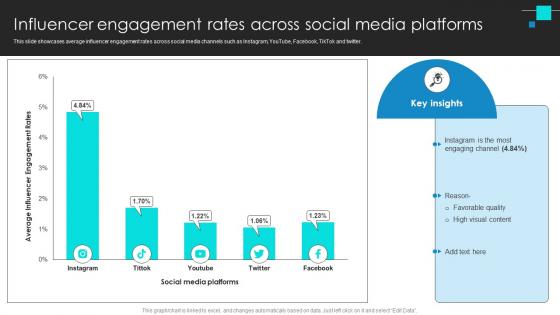
Project Benchmarking Process Influencer Engagement Rates Across Social Media CRP DK SS V
This slide showcases average influencer engagement rates across social media channels such as Instagram, YouTube, Facebook, TikTok and twitter. The best PPT templates are a great way to save time, energy, and resources. Slidegeeks have 100 percent editable powerpoint slides making them incredibly versatile. With these quality presentation templates, you can create a captivating and memorable presentation by combining visually appealing slides and effectively communicating your message. Download Project Benchmarking Process Influencer Engagement Rates Across Social Media CRP DK SS V from Slidegeeks and deliver a wonderful presentation. This slide showcases average influencer engagement rates across social media channels such as Instagram, YouTube, Facebook, TikTok and twitter.
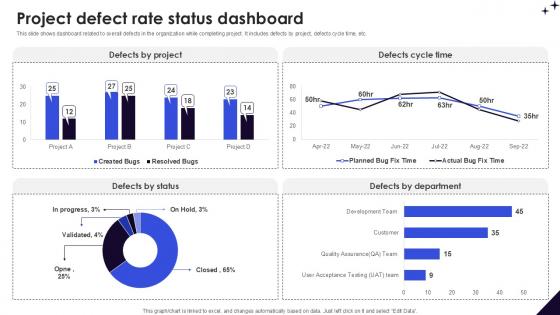
Project Defect Rate Status Dashboard DMAIC Methodology To Maintain PPT Slide
This slide shows dashboard related to overall defects in the organization while completing project. It includes defects by project, defects cycle time, etc. The best PPT templates are a great way to save time, energy, and resources. Slidegeeks have 100 percent editable powerpoint slides making them incredibly versatile. With these quality presentation templates, you can create a captivating and memorable presentation by combining visually appealing slides and effectively communicating your message. Download Project Defect Rate Status Dashboard DMAIC Methodology To Maintain PPT Slide from Slidegeeks and deliver a wonderful presentation. This slide shows dashboard related to overall defects in the organization while completing project. It includes defects by project, defects cycle time, etc.
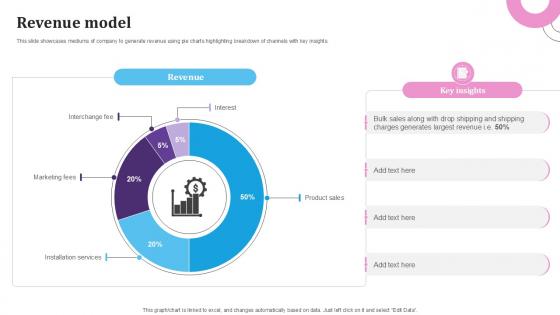
Revenue Model E Commerce Platform For Furniture PPT Slide BMC SS V
This slide showcases mediums of company to generate revenue using pie charts highlighting breakdown of channels with key insights. Find highly impressive Revenue Model E Commerce Platform For Furniture PPT Slide BMC SS V on Slidegeeks to deliver a meaningful presentation. You can save an ample amount of time using these presentation templates. No need to worry to prepare everything from scratch because Slidegeeks experts have already done a huge research and work for you. You need to download Revenue Model E Commerce Platform For Furniture PPT Slide BMC SS V for your upcoming presentation. All the presentation templates are 100 percent editable and you can change the color and personalize the content accordingly. Download now This slide showcases mediums of company to generate revenue using pie charts highlighting breakdown of channels with key insights.
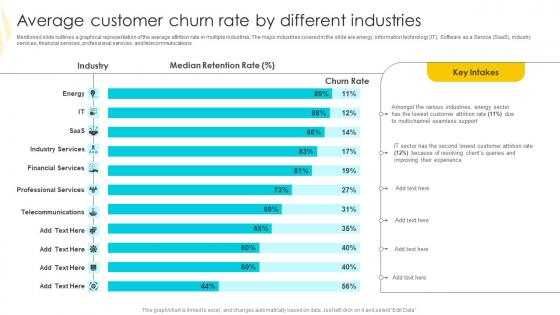
Average Customer Churn Rate By Strategies To Mitigate Customer Churn Background Pdf
Mentioned slide outlines a graphical representation of the average attrition rate in multiple industries. The major industries covered in the slide are energy, information technology IT, Software as a Service SaaS, industry services, financial services, professional services, and telecommunications. Slidegeeks is one of the best resources for PowerPoint templates. You can download easily and regulate Average Customer Churn Rate By Strategies To Mitigate Customer Churn Background Pdf for your personal presentations from our wonderful collection. A few clicks is all it takes to discover and get the most relevant and appropriate templates. Use our Templates to add a unique zing and appeal to your presentation and meetings. All the slides are easy to edit and you can use them even for advertisement purposes. Mentioned slide outlines a graphical representation of the average attrition rate in multiple industries. The major industries covered in the slide are energy, information technology IT, Software as a Service SaaS, industry services, financial services, professional services, and telecommunications.
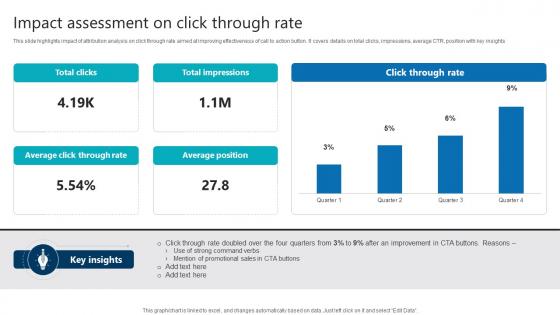
Impact Assessment On Click Through Rate Product Analytics Implementation Data Analytics V
This slide highlights impact of attribution analysis on click through rate aimed at improving effectiveness of call to action button. It covers details on total clicks, impressions, average CTR, position with key insights The best PPT templates are a great way to save time, energy, and resources. Slidegeeks have 100 percent editable powerpoint slides making them incredibly versatile. With these quality presentation templates, you can create a captivating and memorable presentation by combining visually appealing slides and effectively communicating your message. Download Impact Assessment On Click Through Rate Product Analytics Implementation Data Analytics V from Slidegeeks and deliver a wonderful presentation. This slide highlights impact of attribution analysis on click through rate aimed at improving effectiveness of call to action button. It covers details on total clicks, impressions, average CTR, position with key insights
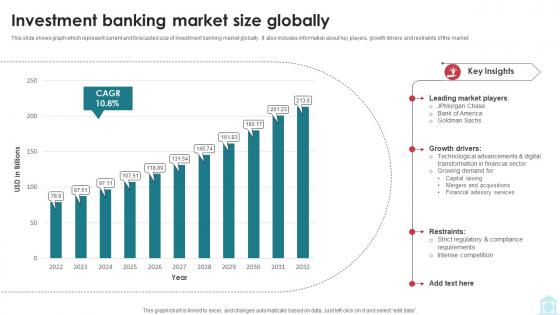
Investment Banking Market Size Globally Mastering Investment Banking Fin SS V
This slide shows graph which represent current and forecasted size of investment banking market globally . It also includes information about key players, growth drivers and restraints of the market. Explore a selection of the finest Investment Banking Market Size Globally Mastering Investment Banking Fin SS V here. With a plethora of professionally designed and pre-made slide templates, you can quickly and easily find the right one for your upcoming presentation. You can use our Investment Banking Market Size Globally Mastering Investment Banking Fin SS V to effectively convey your message to a wider audience. Slidegeeks has done a lot of research before preparing these presentation templates. The content can be personalized and the slides are highly editable. Grab templates today from Slidegeeks. This slide shows graph which represent current and forecasted size of investment banking market globally . It also includes information about key players, growth drivers and restraints of the market.

Investment Banking Market Size Globally Investment Banking Simplified Functions Fin SS V
This slide shows graph which represent current and forecasted size of investment banking market globally . It also includes information about key players, growth drivers and restraints of the market. Explore a selection of the finest Investment Banking Market Size Globally Investment Banking Simplified Functions Fin SS V here. With a plethora of professionally designed and pre-made slide templates, you can quickly and easily find the right one for your upcoming presentation. You can use our Investment Banking Market Size Globally Investment Banking Simplified Functions Fin SS V to effectively convey your message to a wider audience. Slidegeeks has done a lot of research before preparing these presentation templates. The content can be personalized and the slides are highly editable. Grab templates today from Slidegeeks. This slide shows graph which represent current and forecasted size of investment banking market globally . It also includes information about key players, growth drivers and restraints of the market.
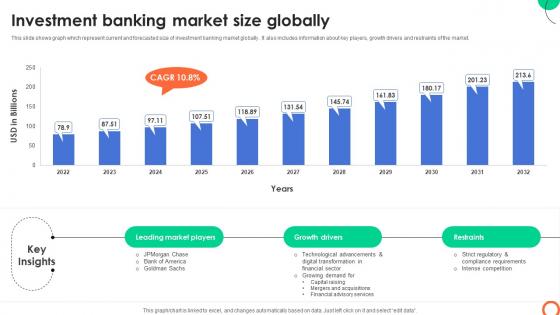
Investment Banking Market Size Globally Understanding Investment Banking Framework Fin SS V
This slide shows graph which represent current and forecasted size of investment banking market globally . It also includes information about key players, growth drivers and restraints of the market. Explore a selection of the finest Investment Banking Market Size Globally Understanding Investment Banking Framework Fin SS V here. With a plethora of professionally designed and pre-made slide templates, you can quickly and easily find the right one for your upcoming presentation. You can use our Investment Banking Market Size Globally Understanding Investment Banking Framework Fin SS V to effectively convey your message to a wider audience. Slidegeeks has done a lot of research before preparing these presentation templates. The content can be personalized and the slides are highly editable. Grab templates today from Slidegeeks. This slide shows graph which represent current and forecasted size of investment banking market globally . It also includes information about key players, growth drivers and restraints of the market.
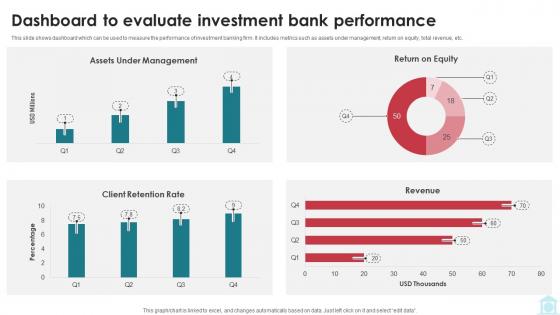
Dashboard To Evaluate Investment Bank Performance Mastering Investment Banking Fin SS V
This slide shows dashboard which can be used to measure the performance of investment banking firm. It includes metrics such as assets under management, return on equity, total revenue, etc. Find highly impressive Dashboard To Evaluate Investment Bank Performance Mastering Investment Banking Fin SS V on Slidegeeks to deliver a meaningful presentation. You can save an ample amount of time using these presentation templates. No need to worry to prepare everything from scratch because Slidegeeks experts have already done a huge research and work for you. You need to download Dashboard To Evaluate Investment Bank Performance Mastering Investment Banking Fin SS V for your upcoming presentation. All the presentation templates are 100 percent editable and you can change the color and personalize the content accordingly. Download now This slide shows dashboard which can be used to measure the performance of investment banking firm. It includes metrics such as assets under management, return on equity, total revenue, etc.
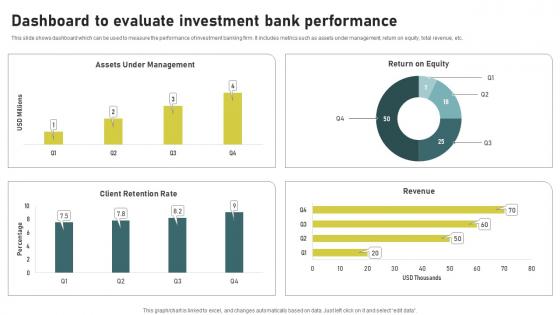
Dashboard To Evaluate Investment Bank Investment Banking Simplified Functions Fin SS V
This slide shows dashboard which can be used to measure the performance of investment banking firm. It includes metrics such as assets under management, return on equity, total revenue, etc. Find highly impressive Dashboard To Evaluate Investment Bank Investment Banking Simplified Functions Fin SS V on Slidegeeks to deliver a meaningful presentation. You can save an ample amount of time using these presentation templates. No need to worry to prepare everything from scratch because Slidegeeks experts have already done a huge research and work for you. You need to download Dashboard To Evaluate Investment Bank Investment Banking Simplified Functions Fin SS V for your upcoming presentation. All the presentation templates are 100 percent editable and you can change the color and personalize the content accordingly. Download now This slide shows dashboard which can be used to measure the performance of investment banking firm. It includes metrics such as assets under management, return on equity, total revenue, etc.
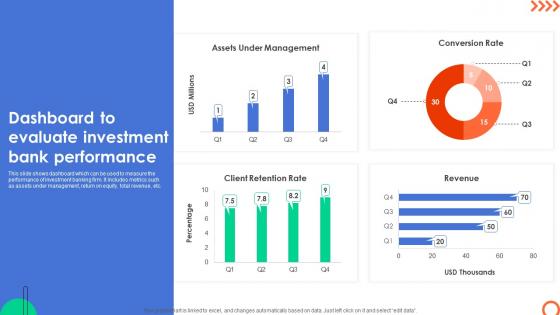
Dashboard To Evaluate Investment Bank Understanding Investment Banking Framework Fin SS V
This slide shows dashboard which can be used to measure the performance of investment banking firm. It includes metrics such as assets under management, return on equity, total revenue, etc. Find highly impressive Dashboard To Evaluate Investment Bank Understanding Investment Banking Framework Fin SS V on Slidegeeks to deliver a meaningful presentation. You can save an ample amount of time using these presentation templates. No need to worry to prepare everything from scratch because Slidegeeks experts have already done a huge research and work for you. You need to download Dashboard To Evaluate Investment Bank Understanding Investment Banking Framework Fin SS V for your upcoming presentation. All the presentation templates are 100 percent editable and you can change the color and personalize the content accordingly. Download now This slide shows dashboard which can be used to measure the performance of investment banking firm. It includes metrics such as assets under management, return on equity, total revenue, etc.
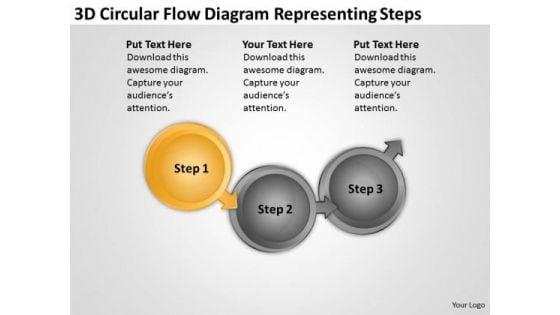
3d Circular Flow Diagram Representing Steps Mini Business Plan PowerPoint Templates
We present our 3d circular flow diagram representing steps mini business plan PowerPoint templates.Download our Finance PowerPoint Templates because let this slide illustrates others piggyback on you to see well over the horizon. Present our Business PowerPoint Templates because this slide will fire away with all the accuracy at your command. Present our Circle Charts PowerPoint Templates because the concept and strategy is your strength. Download our Flow charts PowerPoint Templates because this slide is an excellent backdrop for you to enlighten your audience on the process you have gone through and the vision you have for the future. Download and present our Arrows PowerPoint Templates because this PPt slide helps you to measure key aspects of the current process and collect relevant data.Use these PowerPoint slides for presentations relating to Arrow, Business, Chain, Chart, Circle, Circle, Frame, Color, Concept, Connect, Connection, Connectivity, Corporate, Data, Design, Diagram, Financial, Flow, Flowchart, Graph, Graphical, Group, Important, Organization, Organize, Plan, Process, Rectangle, Relation, Set, Steps, Structure, Teamwork. The prominent colors used in the PowerPoint template are Yellow, Gray, Black. Professionals tell us our 3d circular flow diagram representing steps mini business plan PowerPoint templates are Nifty. We assure you our Color PowerPoint templates and PPT Slides are Wistful. People tell us our 3d circular flow diagram representing steps mini business plan PowerPoint templates are Clever. Customers tell us our Chart PowerPoint templates and PPT Slides are Festive. Use our 3d circular flow diagram representing steps mini business plan PowerPoint templates will save the presenter time. We assure you our Concept PowerPoint templates and PPT Slides are Pleasant. Take the plunge with our 3d Circular Flow Diagram Representing Steps Mini Business Plan PowerPoint Templates. Success will surely ensue.
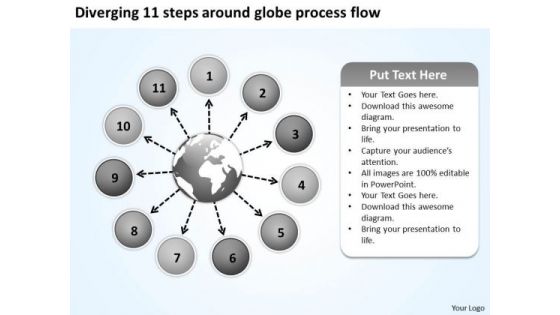
Diverging 11 Steps Around Globe Process Flow Ppt Circular Arrow Network PowerPoint Slides
We present our diverging 11 steps around globe process flow ppt Circular Arrow Network PowerPoint Slides.Download our Globe PowerPoint Templates because brilliant ideas are your forte. Use our Business PowerPoint Templates because it helps you to explain your plans in all earnest to your colleagues and raise the bar for all. Download and present our Circle Charts PowerPoint Templates because business ethics is an essential element in your growth. Download and present our Flow charts PowerPoint Templates because if making a mark is your obsession, then let others get Obsessed with you. Download our Marketing PowerPoint Templates because networking is an imperative in todays world. You need to access the views of others. Similarly you need to give access to them of your abilities.Use these PowerPoint slides for presentations relating to Around, arrow, business, chart, circle,circular, circulation, commerce, concept,curving, cycle, diagram, direction,element, finance, financial,flow, flowchart, flowing, global, globe,internet, investment, loop, map, market,motion, movement, moving,presentation, process, recession,recycle, repeat, repetitive, ring, rotation,round, savings, shape. The prominent colors used in the PowerPoint template are Blue, Black, Yellow. People tell us our diverging 11 steps around globe process flow ppt Circular Arrow Network PowerPoint Slides are Stylish. Professionals tell us our chart PowerPoint templates and PPT Slides are Romantic. We assure you our diverging 11 steps around globe process flow ppt Circular Arrow Network PowerPoint Slides are Nostalgic. PowerPoint presentation experts tell us our business PowerPoint templates and PPT Slides are Sparkling. We assure you our diverging 11 steps around globe process flow ppt Circular Arrow Network PowerPoint Slides are Magical. People tell us our circle PowerPoint templates and PPT Slides are Charming. Add brilliance with our Diverging 11 Steps Around Globe Process Flow Ppt Circular Arrow Network PowerPoint Slides. You will come out on top.
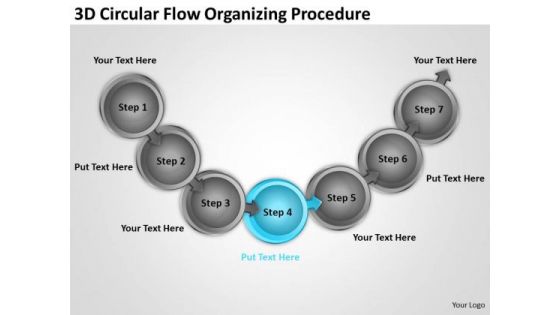
3d Circular Flow Organizing Procedure Templates For Business Plan PowerPoint Slides
We present our 3d circular flow organizing procedure templates for business plan PowerPoint Slides.Download and present our Finance PowerPoint Templates because they are the stepping stones of our journey till date. Present our Business PowerPoint Templates because everybody knows The world over it is a priority for many. Along with it there are so many oppurtunities waiting to be utilised. Download and present our Circle Charts PowerPoint Templates because they are Gauranteed to focus the minds of your team. Download and present our Flow charts PowerPoint Templates because the lessons have been analyzed, studied and conclusions drawn. Download our Arrows PowerPoint Templates because this diagram is designed to help your audience to develop their thoughts along the way.Use these PowerPoint slides for presentations relating to Arrow, Business, Chain, Chart, Circle, Circle, Frame, Color, Concept, Connect, Connection, Connectivity, Corporate, Data, Design, Diagram, Financial, Flow, Flowchart, Graph, Graphical, Group, Important, Organization, Organize, Plan, Process, Rectangle, Relation, Set, Steps, Structure, Teamwork. The prominent colors used in the PowerPoint template are Blue, Gray, Black. Professionals tell us our 3d circular flow organizing procedure templates for business plan PowerPoint Slides are Breathtaking. We assure you our Concept PowerPoint templates and PPT Slides are Appealing. People tell us our 3d circular flow organizing procedure templates for business plan PowerPoint Slides are Fun. Customers tell us our Chart PowerPoint templates and PPT Slides will impress their bosses and teams. Use our 3d circular flow organizing procedure templates for business plan PowerPoint Slides are Fun. We assure you our Circle PowerPoint templates and PPT Slides are Striking. Create the aroma with our 3d Circular Flow Organizing Procedure Templates For Business Plan PowerPoint Slides. Draw the crowds to your views.
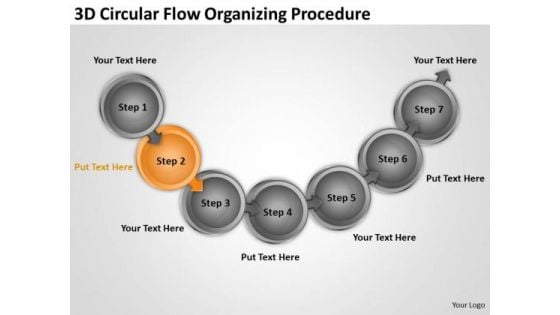
3d Circular Flow Organizing Procedure Daycare Business Plan Template PowerPoint Slides
We present our 3d circular flow organizing procedure daycare business plan template PowerPoint Slides.Download our Finance PowerPoint Templates because you can Bullet-point your thoughts and ideas to profitably accomplish every step of every stage along the way. Use our Business PowerPoint Templates because you have churned your mind and come upwith solutions. Present our Circle Charts PowerPoint Templates because this template helps you to delve on these thoughts and brief your team on the value of your depth of understanding of the subject. Download and present our Flow charts PowerPoint Templates because Our Template designs are State of the Art. Download and present our Arrows PowerPoint Templates because the graphic is a symbol of growth and success.Use these PowerPoint slides for presentations relating to Arrow, Business, Chain, Chart, Circle, Circle, Frame, Color, Concept, Connect, Connection, Connectivity, Corporate, Data, Design, Diagram, Financial, Flow, Flowchart, Graph, Graphical, Group, Important, Organization, Organize, Plan, Process, Rectangle, Relation, Set, Steps, Structure, Teamwork. The prominent colors used in the PowerPoint template are Orange, Gray, Black. Professionals tell us our 3d circular flow organizing procedure daycare business plan template PowerPoint Slides are Perfect. We assure you our Circle PowerPoint templates and PPT Slides are Bold. People tell us our 3d circular flow organizing procedure daycare business plan template PowerPoint Slides are Elevated. Customers tell us our Circle PowerPoint templates and PPT Slides are Splendid. Use our 3d circular flow organizing procedure daycare business plan template PowerPoint Slides are Flirty. We assure you our Chart PowerPoint templates and PPT Slides are Functional. Put your customer in the spotlight with your thoughts. Centre it on him with our 3d Circular Flow Organizing Procedure Daycare Business Plan Template PowerPoint Slides.
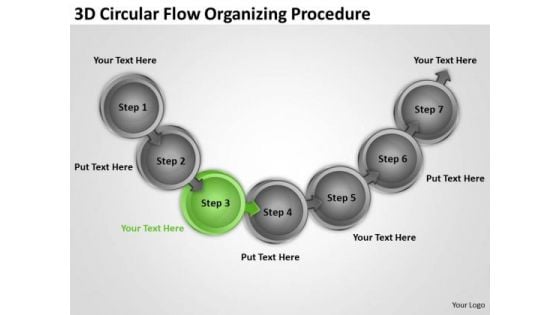
3d Circular Flow Organizing Procedure Ppt Elements Of Business Plan PowerPoint Slides
We present our 3d circular flow organizing procedure ppt elements of business plan PowerPoint Slides.Use our Finance PowerPoint Templates because let this slide illustrates others piggyback on you to see well over the horizon. Download our Business PowerPoint Templates because maximising sales of your product is the intended destination. Download our Circle Charts PowerPoint Templates because it demonstrates to your audience how the best and most refined ideas pass through. Present our Flow charts PowerPoint Templates because this is An innovative slide design depicting driving home the relevance of a steady rhythm. Use our Arrows PowerPoint Templates because the key criteria for necessary infrastructure are at your finger tips. Radiate this knowledge to the group and see their eyes light up.Use these PowerPoint slides for presentations relating to Arrow, Business, Chain, Chart, Circle, Circle, Frame, Color, Concept, Connect, Connection, Connectivity, Corporate, Data, Design, Diagram, Financial, Flow, Flowchart, Graph, Graphical, Group, Important, Organization, Organize, Plan, Process, Rectangle, Relation, Set, Steps, Structure, Teamwork. The prominent colors used in the PowerPoint template are Green, Gray, Black. Professionals tell us our 3d circular flow organizing procedure ppt elements of business plan PowerPoint Slides are Pretty. We assure you our Concept PowerPoint templates and PPT Slides are Dynamic. People tell us our 3d circular flow organizing procedure ppt elements of business plan PowerPoint Slides are Lush. Customers tell us our Chart PowerPoint templates and PPT Slides are Appealing. Use our 3d circular flow organizing procedure ppt elements of business plan PowerPoint Slides are Endearing. We assure you our Circle PowerPoint templates and PPT Slides are Efficient. Search everywhere but find it here. Our 3d Circular Flow Organizing Procedure Ppt Elements Of Business Plan PowerPoint Slides catalogue will have it right there.
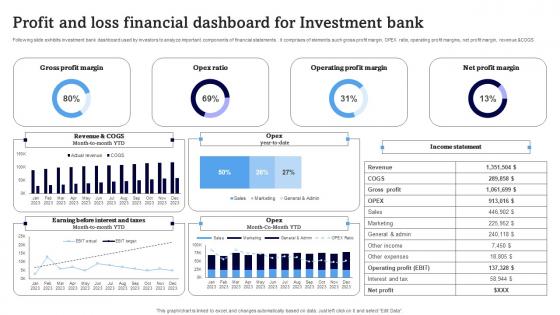
Profit And Loss Financial Dashboard For Investment Bank Download Pdf
Following slide exhibits investment bank dashboard used by investors to analyze important components of financial statements . it comprises of elements such gross profit margin, OPEX ratio, operating profit margins, net profit margin, revenue andCOGS Pitch your topic with ease and precision using this Profit And Loss Financial Dashboard For Investment Bank Download Pdf. This layout presents information on Gross Profit Margin, Opex Ratio, Operating Profit Margin. It is also available for immediate download and adjustment. So, changes can be made in the color, design, graphics or any other component to create a unique layout. Following slide exhibits investment bank dashboard used by investors to analyze important components of financial statements . it comprises of elements such gross profit margin, OPEX ratio, operating profit margins, net profit margin, revenue andCOGS
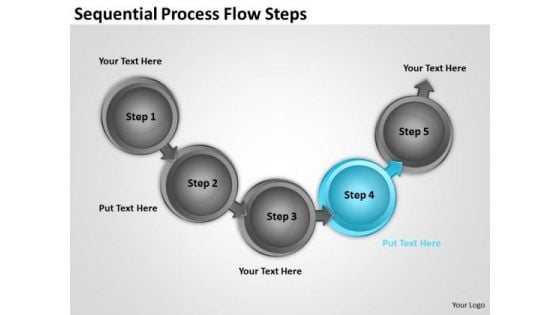
Sequential Process Flow Steps Professional Business Plan Writers PowerPoint Templates
We present our sequential process flow steps professional business plan writers PowerPoint templates.Download our Flow charts PowerPoint Templates because you can Present your views on the methods using our self-explanatory templates. Present our Arrows PowerPoint Templates because you can asked to strive to give true form to your great dream. Use our Circle charts PowerPoint Templates because it is in your DNA to analyse possible causes to the minutest detail. Present our Process and flows PowerPoint Templates because this diagram has the unique ability to drive home your ideas and show how they mesh to guarantee success. Present our Shapes PowerPoint Templates because you are aware of some pitfalls ahead where you need to be cautious not to overrun and avoid a stall.Use these PowerPoint slides for presentations relating to arrow, business, chain, chart, circle, color, concept, connect, connection, connectivity corporate, data, design, diagram, financial, flow, flowchart, frame, graph, graphical group, important, organization, organize, plan, process, rectangle, relation, set, steps structure, teamwork. The prominent colors used in the PowerPoint template are Blue light, Black, Gray. People tell us our sequential process flow steps professional business plan writers PowerPoint templates are Nostalgic. People tell us our circle PowerPoint templates and PPT Slides are Endearing. Presenters tell us our sequential process flow steps professional business plan writers PowerPoint templates are Awesome. Customers tell us our chart PowerPoint templates and PPT Slides are Energetic. Customers tell us our sequential process flow steps professional business plan writers PowerPoint templates will help you be quick off the draw. Just enter your specific text and see your points hit home. The feedback we get is that our color PowerPoint templates and PPT Slides are the best it can get when it comes to presenting. Expedite growth with our Sequential Process Flow Steps Professional Business Plan Writers PowerPoint Templates. Download without worries with our money back guaranteee.
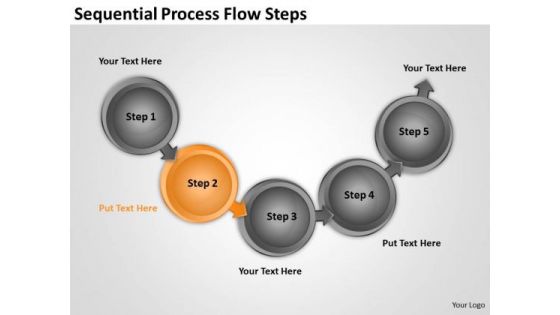
Sequential Process Flow Steps Sales Business Plan PowerPoint Templates
We present our sequential process flow steps sales business plan PowerPoint templates.Download our Flow charts PowerPoint Templates because it Educates your team with your thoughts and logic. Download our Arrows PowerPoint Templates because this diagram helps you to light up enthusiasm in your team like dream emerge.ge. Present our Circle charts PowerPoint Templates because this business powerpoint template helps expound on the logic of your detailed thought process to take your company forward. Present our Process and flows PowerPoint Templates because the gears of youthful minds are useful, therefore set them in motion. Download our Shapes PowerPoint Templates because it transmits this clarity of purpose onto the eager minds of your team.Use these PowerPoint slides for presentations relating to arrow, business, chain, chart, circle, color, concept, connect, connection, connectivity corporate, data, design, diagram, financial, flow, flowchart, frame, graph, graphical group, important, organization, organize, plan, process, rectangle, relation, set, steps structure, teamwork. The prominent colors used in the PowerPoint template are Orange, Black, Gray. People tell us our sequential process flow steps sales business plan PowerPoint templates are Swanky. People tell us our connection PowerPoint templates and PPT Slides are Charming. Presenters tell us our sequential process flow steps sales business plan PowerPoint templates are second to none. Customers tell us our chart PowerPoint templates and PPT Slides are Enchanting. Customers tell us our sequential process flow steps sales business plan PowerPoint templates are Charming. The feedback we get is that our chain PowerPoint templates and PPT Slides will save the presenter time. Build teams with our Sequential Process Flow Steps Sales Business Plan PowerPoint Templates. Download without worries with our money back guaranteee.
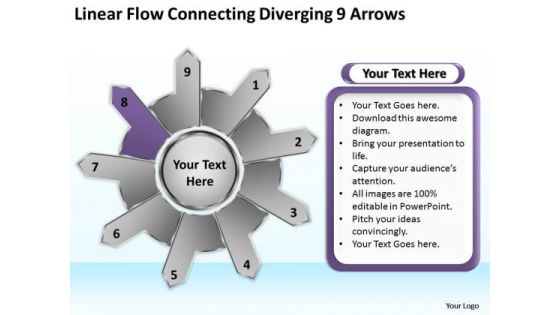
Linear Flow Connecting Diverging 9 Arrows Ppt Cycle Diagram PowerPoint Slides
We present our linear flow connecting diverging 9 arrows ppt Cycle Diagram PowerPoint Slides.Present our Ring Charts PowerPoint Templates because you are going along well but your foresight shows that it may need a slight change in plans or direction. Download and present our Arrows PowerPoint Templates because you can Take your team along by explaining your plans. Download our Success PowerPoint Templates because you have come up with a brilliant breakthrough idea. you can also visualise the interest it will generate. Use our Business PowerPoint Templates because our template will help pinpoint their viability. Download and present our Flow charts PowerPoint Templates because with the help of our Slides you can Illustrate how each element flows seamlessly onto the next stage.Use these PowerPoint slides for presentations relating to Abstract, arrow, brochure, business,button, chart, circle, company, cyclic,data, demonstration, diagram,economic, financial, glossy, goal, graph,illustration, info, information, investment,manage, marketing, model, navigation,option, part, pie, presentation, process,result, section, segmented, sharing,sphere. The prominent colors used in the PowerPoint template are Purple, Black, Gray. People tell us our linear flow connecting diverging 9 arrows ppt Cycle Diagram PowerPoint Slides are Vintage. Customers tell us our company PowerPoint templates and PPT Slides are Zippy. Professionals tell us our linear flow connecting diverging 9 arrows ppt Cycle Diagram PowerPoint Slides are Stunning. Presenters tell us our circle PowerPoint templates and PPT Slides are Ultra. Use our linear flow connecting diverging 9 arrows ppt Cycle Diagram PowerPoint Slides are No-nonsense. Presenters tell us our chart PowerPoint templates and PPT Slides are Perfect. Build on your charisma with our Linear Flow Connecting Diverging 9 Arrows Ppt Cycle Diagram PowerPoint Slides. Create a definite aura around you.
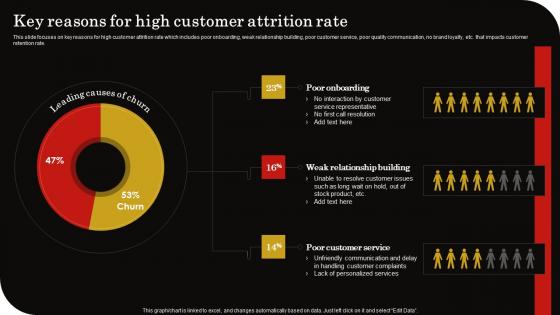
Key Reasons For High Customer Attrition Rate Client Retention Strategy To Reduce Churn Rate Designs Pdf
This slide focuses on key reasons for high customer attrition rate which includes poor onboarding, weak relationship building, poor customer service, poor quality communication, no brand loyalty, etc. that impacts customer retention rate. Coming up with a presentation necessitates that the majority of the effort goes into the content and the message you intend to convey. The visuals of a PowerPoint presentation can only be effective if it supplements and supports the story that is being told. Keeping this in mind our experts created Key Reasons For High Customer Attrition Rate Client Retention Strategy To Reduce Churn Rate Designs Pdf to reduce the time that goes into designing the presentation. This way, you can concentrate on the message while our designers take care of providing you with the right template for the situation. This slide focuses on key reasons for high customer attrition rate which includes poor onboarding, weak relationship building, poor customer service, poor quality communication, no brand loyalty, etc. that impacts customer retention rate.
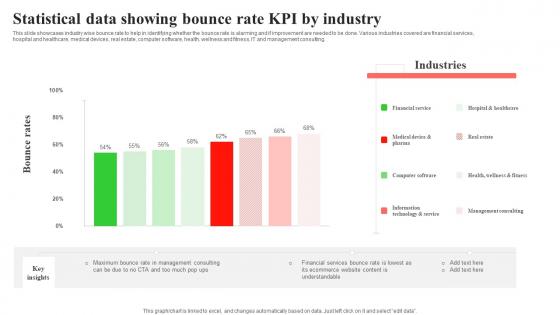
Statistical Data Showing Bounce Rate KPI By Industry Ideas Pdf
This slide showcases industry wise bounce rate to help in identifying whether the bounce rate is alarming and if improvement are needed to be done. Various industries covered are financial services, hospital and healthcare, medical devices, real estate, computer software, health, wellness and fitness, IT and management consulting. Showcasing this set of slides titled Statistical Data Showing Bounce Rate KPI By Industry Ideas Pdf. The topics addressed in these templates are Financial Services, Hospital And Healthcare, Medical Devices. All the content presented in this PPT design is completely editable. Download it and make adjustments in color, background, font etc. as per your unique business setting. This slide showcases industry wise bounce rate to help in identifying whether the bounce rate is alarming and if improvement are needed to be done. Various industries covered are financial services, hospital and healthcare, medical devices, real estate, computer software, health, wellness and fitness, IT and management consulting.
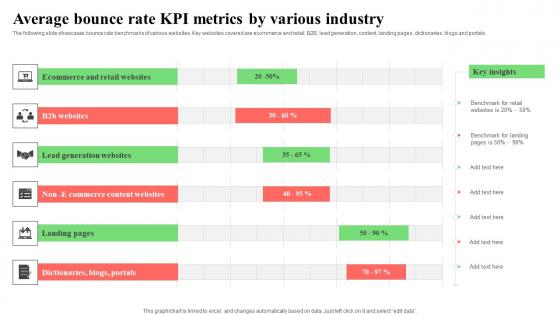
Average Bounce Rate KPI Metrics By Various Industry Information Pdf
The following slide showcases bounce rate benchmarks of various websites. Key websites covered are ecommerce and retail, B2B, lead generation, content, landing pages, dictionaries, blogs and portals. Showcasing this set of slides titled Average Bounce Rate KPI Metrics By Various Industry Information Pdf. The topics addressed in these templates are Content, Landing Pages, Dictionaries. All the content presented in this PPT design is completely editable. Download it and make adjustments in color, background, font etc. as per your unique business setting. The following slide showcases bounce rate benchmarks of various websites. Key websites covered are ecommerce and retail, B2B, lead generation, content, landing pages, dictionaries, blogs and portals.
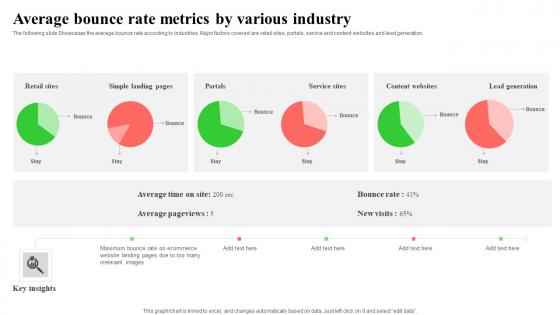
Average Bounce Rate Metrics By Various Industry Mockup Pdf
The following slide Showcases the average bounce rate according to industries. Major factors covered are retail sites, portals, service and content websites and lead generation. Showcasing this set of slides titled Average Bounce Rate Metrics By Various Industry Mockup Pdf. The topics addressed in these templates are Portals, Service,Content Websites. All the content presented in this PPT design is completely editable. Download it and make adjustments in color, background, font etc. as per your unique business setting. The following slide Showcases the average bounce rate according to industries. Major factors covered are retail sites, portals, service and content websites and lead generation.
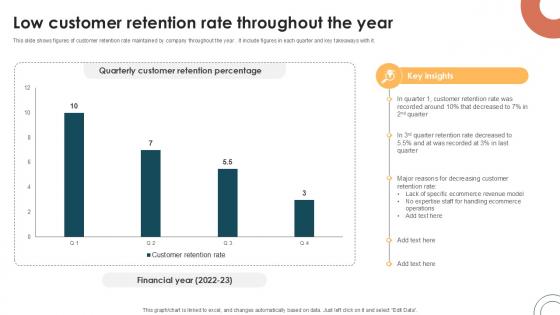
Low Customer Retention Rate Internet Based Trade Structure Ppt Presentation
This slide shows figures of customer retention rate maintained by company throughout the year . It include figures in each quarter and key takeaways with it. Here you can discover an assortment of the finest PowerPoint and Google Slides templates. With these templates, you can create presentations for a variety of purposes while simultaneously providing your audience with an eye-catching visual experience. Download Low Customer Retention Rate Internet Based Trade Structure Ppt Presentation to deliver an impeccable presentation. These templates will make your job of preparing presentations much quicker, yet still, maintain a high level of quality. Slidegeeks has experienced researchers who prepare these templates and write high-quality content for you. Later on, you can personalize the content by editing the Low Customer Retention Rate Internet Based Trade Structure Ppt Presentation. This slide shows figures of customer retention rate maintained by company throughout the year . It include figures in each quarter and key takeaways with it.
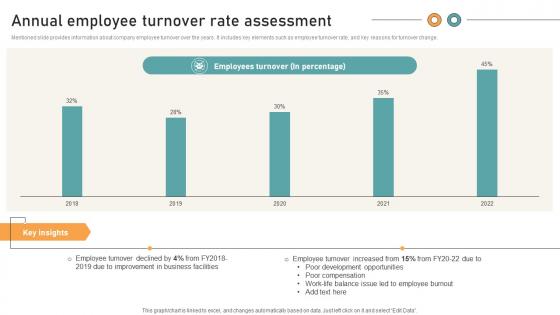
Comprehensive Guide For Website Annual Employee Turnover Rate Assessment
Mentioned slide provides information about company employee turnover over the years. It includes key elements such as employee turnover rate, and key reasons for turnover change. Do you have to make sure that everyone on your team knows about any specific topic I yes, then you should give Comprehensive Guide For Website Annual Employee Turnover Rate Assessment a try. Our experts have put a lot of knowledge and effort into creating this impeccable Comprehensive Guide For Website Annual Employee Turnover Rate Assessment. You can use this template for your upcoming presentations, as the slides are perfect to represent even the tiniest detail. You can download these templates from the Slidegeeks website and these are easy to edit. So grab these today Mentioned slide provides information about company employee turnover over the years. It includes key elements such as employee turnover rate, and key reasons for turnover change.
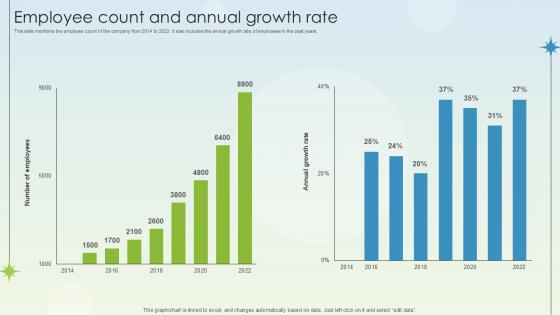
Employee Count And Annual Growth Rate Business Growth Ppt Example
This slide mentions the employee count of the company from 2014 to 2022. It also includes the annual growth rate of employees in the past years. Create an editable Employee Count And Annual Growth Rate Business Growth Ppt Example that communicates your idea and engages your audience. Whether you are presenting a business or an educational presentation, pre-designed presentation templates help save time. Employee Count And Annual Growth Rate Business Growth Ppt Example is highly customizable and very easy to edit, covering many different styles from creative to business presentations. Slidegeeks has creative team members who have crafted amazing templates. So, go and get them without any delay. This slide mentions the employee count of the company from 2014 to 2022. It also includes the annual growth rate of employees in the past years.
Dashboard For Tracking Employee Satisfaction Rate Detailed Personnel Slides Pdf
This slide covers KPI dashboard to measure employee satisfaction due to effective internal communication. It includes indicators such as net promoter score, retention rate, absenteeism etc. This Dashboard For Tracking Employee Satisfaction Rate Detailed Personnel Slides Pdf is perfect for any presentation, be it in front of clients or colleagues. It is a versatile and stylish solution for organizing your meetings. The Dashboard For Tracking Employee Satisfaction Rate Detailed Personnel Slides Pdf features a modern design for your presentation meetings. The adjustable and customizable slides provide unlimited possibilities for acing up your presentation. Slidegeeks has done all the homework before launching the product for you. So, do not wait, grab the presentation templates today This slide covers KPI dashboard to measure employee satisfaction due to effective internal communication. It includes indicators such as net promoter score, retention rate, absenteeism etc.
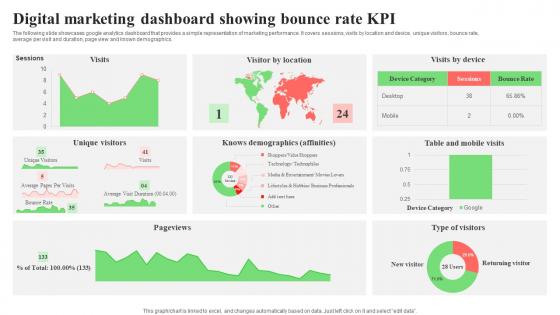
Digital Marketing Dashboard Showing Bounce Rate KPI Microsoft Pdf
The following slide showcases google analytics dashboard that provides a simple representation of marketing performance. It covers sessions, visits by location and device, unique visitors, bounce rate, average per visit and duration, page view and known demographics. Showcasing this set of slides titled Digital Marketing Dashboard Showing Bounce Rate KPI Microsoft Pdf. The topics addressed in these templates are Unique Visitors, Bounce Rate, Average Per Visit. All the content presented in this PPT design is completely editable. Download it and make adjustments in color, background, font etc. as per your unique business setting. The following slide showcases google analytics dashboard that provides a simple representation of marketing performance. It covers sessions, visits by location and device, unique visitors, bounce rate, average per visit and duration, page view and known demographics.
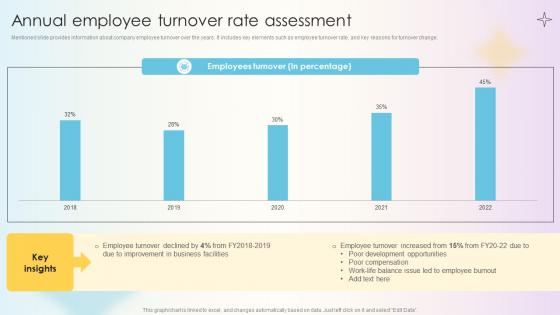
Managing Technical And Non Annual Employee Turnover Rate Assessment
Mentioned slide provides information about company employee turnover over the years. It includes key elements such as employee turnover rate, and key reasons for turnover change. Get a simple yet stunning designed Managing Technical And Non Annual Employee Turnover Rate Assessment. It is the best one to establish the tone in your meetings. It is an excellent way to make your presentations highly effective. So, download this PPT today from Slidegeeks and see the positive impacts. Our easy-to-edit Managing Technical And Non Annual Employee Turnover Rate Assessment can be your go-to option for all upcoming conferences and meetings. So, what are you waiting for Grab this template today. Mentioned slide provides information about company employee turnover over the years. It includes key elements such as employee turnover rate, and key reasons for turnover change.
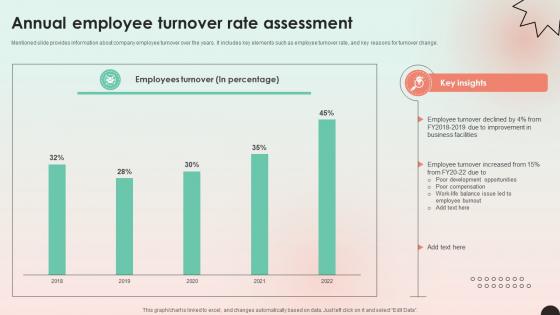
Web Consulting Business Annual Employee Turnover Rate Assessment
Mentioned slide provides information about company employee turnover over the years. It includes key elements such as employee turnover rate, and key reasons for turnover change. From laying roadmaps to briefing everything in detail, our templates are perfect for you. You can set the stage with your presentation slides. All you have to do is download these easy-to-edit and customizable templates. Web Consulting Business Annual Employee Turnover Rate Assessment will help you deliver an outstanding performance that everyone would remember and praise you for. Do download this presentation today. Mentioned slide provides information about company employee turnover over the years. It includes key elements such as employee turnover rate, and key reasons for turnover change.
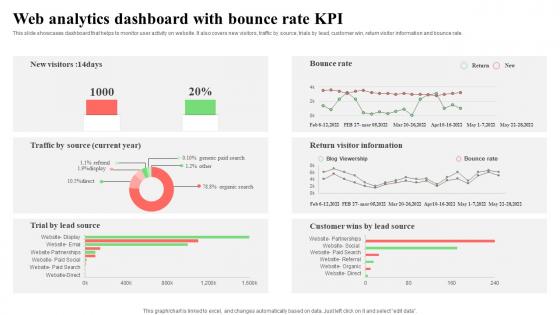
Web Analytics Dashboard With Bounce Rate KPI Elements Pdf
This slide showcases dashboard that helps to monitor user activity on website. It also covers new visitors, traffic by source, trials by lead, customer win, return visitor information and bounce rate. Showcasing this set of slides titled Web Analytics Dashboard With Bounce Rate KPI Elements Pdf. The topics addressed in these templates are Lead, Customer Win, Return Visitor Information. All the content presented in this PPT design is completely editable. Download it and make adjustments in color, background, font etc. as per your unique business setting. This slide showcases dashboard that helps to monitor user activity on website. It also covers new visitors, traffic by source, trials by lead, customer win, return visitor information and bounce rate.
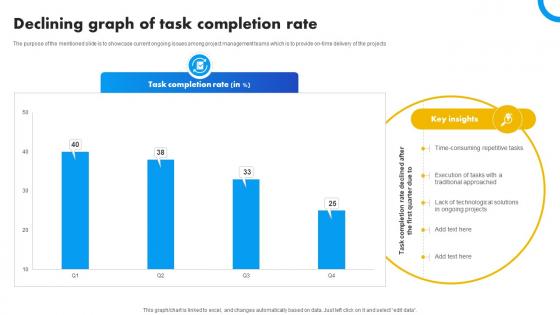
Declining Graph Of Task Completion Rate Strategies For Success In Digital
The purpose of the mentioned slide is to showcase current ongoing issues among project management teams which is to provide on-time delivery of the projects. From laying roadmaps to briefing everything in detail, our templates are perfect for you. You can set the stage with your presentation slides. All you have to do is download these easy-to-edit and customizable templates. Declining Graph Of Task Completion Rate Strategies For Success In Digital will help you deliver an outstanding performance that everyone would remember and praise you for. Do download this presentation today. The purpose of the mentioned slide is to showcase current ongoing issues among project management teams which is to provide on-time delivery of the projects.
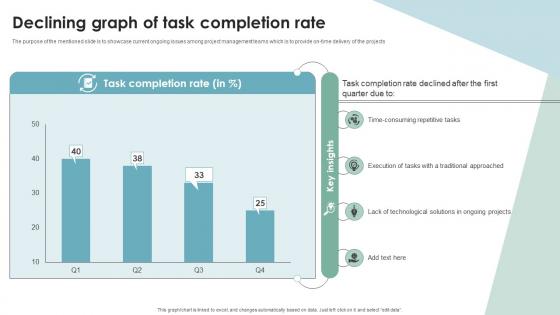
Declining Graph Of Task Completion Rate Digital Transformation In Project Management
The purpose of the mentioned slide is to showcase current ongoing issues among project management teams which is to provide on-time delivery of the projects. From laying roadmaps to briefing everything in detail, our templates are perfect for you. You can set the stage with your presentation slides. All you have to do is download these easy-to-edit and customizable templates. Declining Graph Of Task Completion Rate Digital Transformation In Project Management will help you deliver an outstanding performance that everyone would remember and praise you for. Do download this presentation today. The purpose of the mentioned slide is to showcase current ongoing issues among project management teams which is to provide on-time delivery of the projects
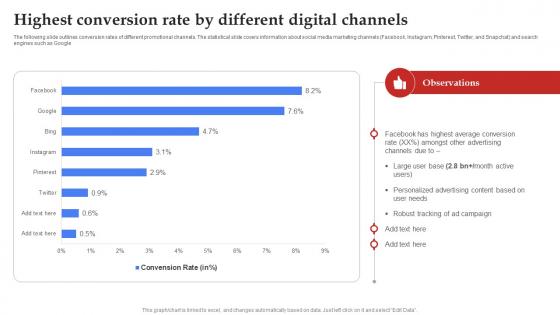
Facebook Marketing Plan Highest Conversion Rate By Different Digital Channels Strategy SS V
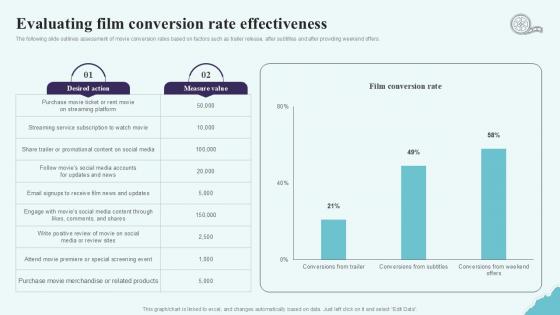
Evaluating Film Conversion Rate Effectiveness Strategic Plan To Increase Film Ppt Powerpoint Strategy SS V
The following slide outlines assessment of movie conversion rates based on factors such as trailer release, after subtitles and after providing weekend offers. Slidegeeks is here to make your presentations a breeze with Evaluating Film Conversion Rate Effectiveness Strategic Plan To Increase Film Ppt Powerpoint Strategy SS V With our easy-to-use and customizable templates, you can focus on delivering your ideas rather than worrying about formatting. With a variety of designs to choose from, you are sure to find one that suits your needs. And with animations and unique photos, illustrations, and fonts, you can make your presentation pop. So whether you are giving a sales pitch or presenting to the board, make sure to check out Slidegeeks first The following slide outlines assessment of movie conversion rates based on factors such as trailer release, after subtitles and after providing weekend offers.
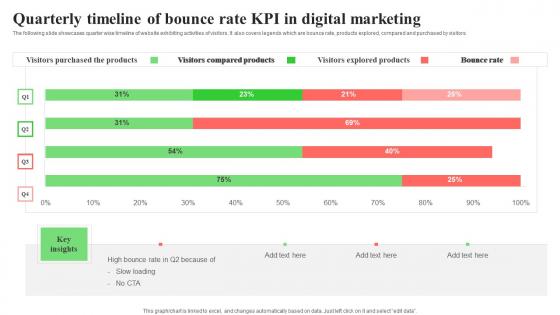
Quarterly Timeline Of Bounce Rate KPI In Digital Marketing Template Pdf
The following slide showcases quarter wise timeline of website exhibiting activities of visitors. It also covers legends which are bounce rate, products explored, compared and purchased by visitors. Showcasing this set of slides titled Quarterly Timeline Of Bounce Rate KPI In Digital Marketing Template Pdf. The topics addressed in these templates are Visitors Compared Products, Bounce Rate. All the content presented in this PPT design is completely editable. Download it and make adjustments in color, background, font etc. as per your unique business setting. The following slide showcases quarter wise timeline of website exhibiting activities of visitors. It also covers legends which are bounce rate, products explored, compared and purchased by visitors.
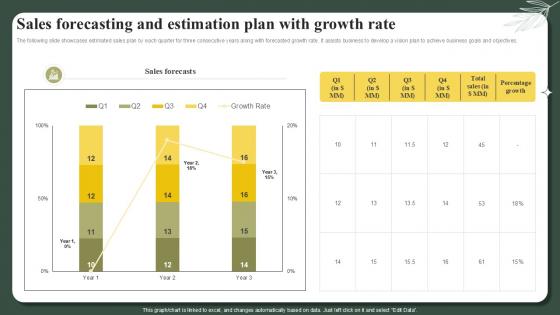
Sales Forecasting And Estimation Plan With Growth Rate Successful Launch Ppt Powerpoint
The following slide showcases estimated sales plan by each quarter for three consecutive years along with forecasted growth rate. It assists business to develop a vision plan to achieve business goals and objectives. Formulating a presentation can take up a lot of effort and time, so the content and message should always be the primary focus. The visuals of the PowerPoint can enhance the presenters message, so our Sales Forecasting And Estimation Plan With Growth Rate Successful Launch Ppt Powerpoint was created to help save time. Instead of worrying about the design, the presenter can concentrate on the message while our designers work on creating the ideal templates for whatever situation is needed. Slidegeeks has experts for everything from amazing designs to valuable content, we have put everything into Sales Forecasting And Estimation Plan With Growth Rate Successful Launch Ppt Powerpoint The following slide showcases estimated sales plan by each quarter for three consecutive years along with forecasted growth rate. It assists business to develop a vision plan to achieve business goals and objectives.
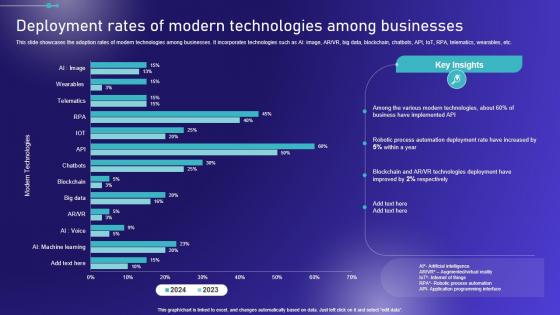
Deployment Rates Of Modern Technologies Embracing Robotic Process Diagrams PDF
This slide showcases the adoption rates of modern technologies among businesses. It incorporates technologies such as AI image, AR VR, big data, blockchain, chatbots, API, IoT, RPA, telematics, wearables, etc. Make sure to capture your audiences attention in your business displays with our gratis customizable Deployment Rates Of Modern Technologies Embracing Robotic Process Diagrams PDF. These are great for business strategies, office conferences, capital raising or task suggestions. If you desire to acquire more customers for your tech business and ensure they stay satisfied, create your own sales presentation with these plain slides. This slide showcases the adoption rates of modern technologies among businesses. It incorporates technologies such as AI image, AR VR, big data, blockchain, chatbots, API, IoT, RPA, telematics, wearables, etc.

Compound Annual Growth Rate CAGR Of Application Security Testing
This slide depicts the market growth of application security by software tools such as white-box testing, black-box testing, etc. Crafting an eye-catching presentation has never been more straightforward. Let your presentation shine with this tasteful yet straightforward Compound Annual Growth Rate CAGR Of Application Security Testing template. It offers a minimalistic and classy look that is great for making a statement. The colors have been employed intelligently to add a bit of playfulness while still remaining professional. Construct the ideal Compound Annual Growth Rate CAGR Of Application Security Testing that effortlessly grabs the attention of your audience Begin now and be certain to wow your customers This slide depicts the market growth of application security by software tools such as white-box testing, black-box testing, etc.
Implementing Strategies To Enhance Average Customer Churn Rate By Different Industries Icons PDF
Mentioned slide outlines a graphical representation of the average attrition rate in multiple industries. The major industries covered in the slide are energy, information technology IT, Software as a Service SaaS, industry services, financial services, professional services, and telecommunications. Get a simple yet stunning designed Implementing Strategies To Enhance Average Customer Churn Rate By Different Industries Icons PDF It is the best one to establish the tone in your meetings. It is an excellent way to make your presentations highly effective. So, download this PPT today from Slidegeeks and see the positive impacts. Our easy-to-edit Implementing Strategies To Enhance Average Customer Churn Rate By Different Industries Icons PDF can be your go-to option for all upcoming conferences and meetings. So, what are you waiting for Grab this template today. Mentioned slide outlines a graphical representation of the average attrition rate in multiple industries. The major industries covered in the slide are energy, information technology IT, Software as a Service SaaS, industry services, financial services, professional services, and telecommunications.
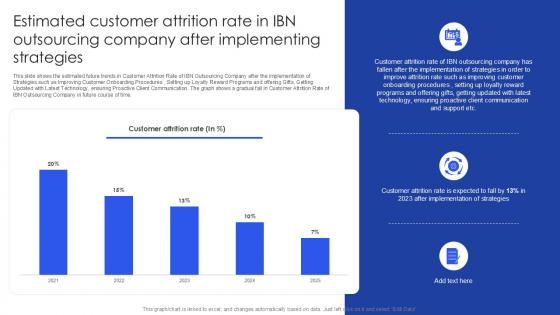
Estimated Customer Attrition Rate In IBN Outsourcing Company PPT PowerPoint SS
This slide shows the estimated future trends in Customer Attrition Rate of IBN Outsourcing Company after the implementation of Strategies such as Improving Customer Onboarding Procedures , Setting up Loyalty Reward Programs and offering Gifts, Getting Updated with Latest Technology, ensuring Proactive Client Communication. The graph shows a gradual fall in Customer Attrition Rate of IBN Outsourcing Company in future course of time. Slidegeeks is here to make your presentations a breeze with Estimated Customer Attrition Rate In IBN Outsourcing Company PPT PowerPoint SS With our easy-to-use and customizable templates, you can focus on delivering your ideas rather than worrying about formatting. With a variety of designs to choose from, you are sure to find one that suits your needs. And with animations and unique photos, illustrations, and fonts, you can make your presentation pop. So whether you are giving a sales pitch or presenting to the board, make sure to check out Slidegeeks first This slide shows the estimated future trends in Customer Attrition Rate of IBN Outsourcing Company after the implementation of Strategies such as Improving Customer Onboarding Procedures , Setting up Loyalty Reward Programs and offering Gifts, Getting Updated with Latest Technology, ensuring Proactive Client Communication. The graph shows a gradual fall in Customer Attrition Rate of IBN Outsourcing Company in future course of time.
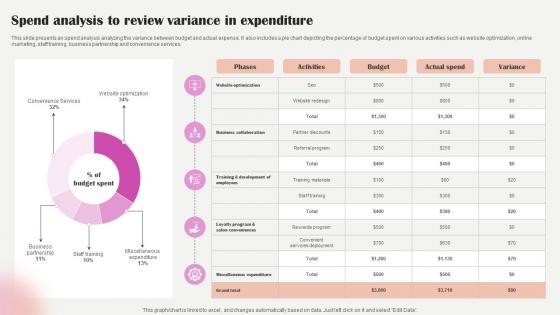
Salon Marketing Plan To Optimize Spend Analysis To Review Variance In Expenditure Strategy SS V
This slide presents an spend analysis analyzing the variance between budget and actual expense. It also includes a pie chart depicting the percentage of budget spent on various activities such as website optimization, online marketing, staff training, business partnership and convenience services. Explore a selection of the finest Salon Marketing Plan To Optimize Spend Analysis To Review Variance In Expenditure Strategy SS V here. With a plethora of professionally designed and pre-made slide templates, you can quickly and easily find the right one for your upcoming presentation. You can use our Salon Marketing Plan To Optimize Spend Analysis To Review Variance In Expenditure Strategy SS V to effectively convey your message to a wider audience. Slidegeeks has done a lot of research before preparing these presentation templates. The content can be personalized and the slides are highly editable. Grab templates today from Slidegeeks. This slide presents an spend analysis analyzing the variance between budget and actual expense. It also includes a pie chart depicting the percentage of budget spent on various activities such as website optimization, online marketing, staff training, business partnership and convenience services.
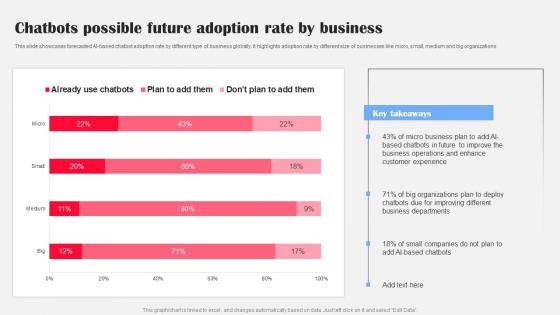
Chatbots Possible Future Adoption Rate AI Bot Application For Various Industries Formats Pdf
This slide showcases forecasted AI based chatbot adoption rate by different type of business globally. It highlights adoption rate by different size of businesses like micro, small, medium and big organizations Welcome to our selection of the Chatbots Possible Future Adoption Rate AI Bot Application For Various Industries Formats Pdf. These are designed to help you showcase your creativity and bring your sphere to life. Planning and Innovation are essential for any business that is just starting out. This collection contains the designs that you need for your everyday presentations. All of our PowerPoints are 100 percent editable, so you can customize them to suit your needs. This multi purpose template can be used in various situations. Grab these presentation templates today This slide showcases forecasted AI based chatbot adoption rate by different type of business globally. It highlights adoption rate by different size of businesses like micro, small, medium and big organizations
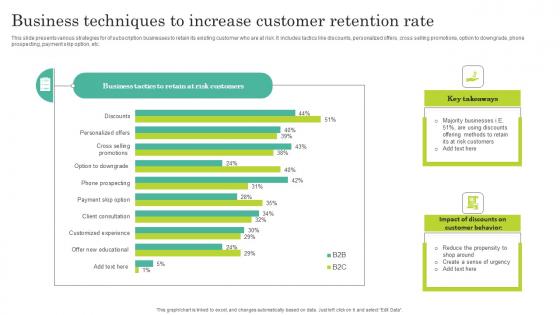
Business Techniques To Increase Customer Retention Rate Slides Pdf
This slide presents various strategies for of subscription businesses to retain its existing customer who are at risk. It includes tactics like discounts, personalized offers, cross selling promotions, option to downgrade, phone prospecting, payment skip option, etc. Showcasing this set of slides titled Business Techniques To Increase Customer Retention Rate Slides Pdf. The topics addressed in these templates are Majority Businesses, Offering Methods Retain, Reduce Propensity. All the content presented in this PPT design is completely editable. Download it and make adjustments in color, background, font etc. as per your unique business setting. This slide presents various strategies for of subscription businesses to retain its existing customer who are at risk. It includes tactics like discounts, personalized offers, cross selling promotions, option to downgrade, phone prospecting, payment skip option, etc.
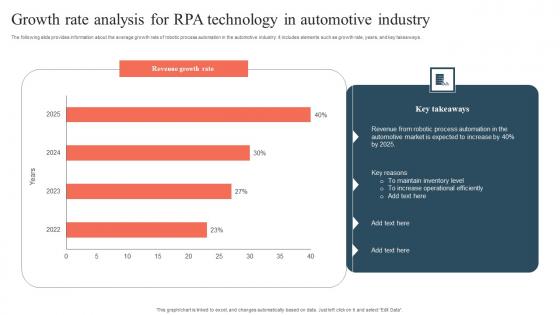
Growth Rate Analysis For RPA Technology In Automotive Industry Professional Pdf
The following slide provides information about the average growth rate of robotic process automation in the automotive industry. It includes elements such as growth rate, years, and key takeaways. Showcasing this set of slides titled Growth Rate Analysis For RPA Technology In Automotive Industry Professional Pdf. The topics addressed in these templates are Robotic Process Automation, Automotive Market, Key Reasons . All the content presented in this PPT design is completely editable. Download it and make adjustments in color, background, font etc. as per your unique business setting. The following slide provides information about the average growth rate of robotic process automation in the automotive industry. It includes elements such as growth rate, years, and key takeaways.

Impact Of Marketing On Patient Conversion Rate Implementation Of Online Ppt Sample
This slide illustrates the positive impact of marketing strategies on the hospitals conversion rate. It includes a conversion report for 5 years 2019 2023 highlighting the increase in the rate The Impact Of Marketing On Patient Conversion Rate Implementation Of Online Ppt Sample is a compilation of the most recent design trends as a series of slides. It is suitable for any subject or industry presentation, containing attractive visuals and photo spots for businesses to clearly express their messages. This template contains a variety of slides for the user to input data, such as structures to contrast two elements, bullet points, and slides for written information. Slidegeeks is prepared to create an impression. This slide illustrates the positive impact of marketing strategies on the hospitals conversion rate. It includes a conversion report for 5 years 2019 2023 highlighting the increase in the rate
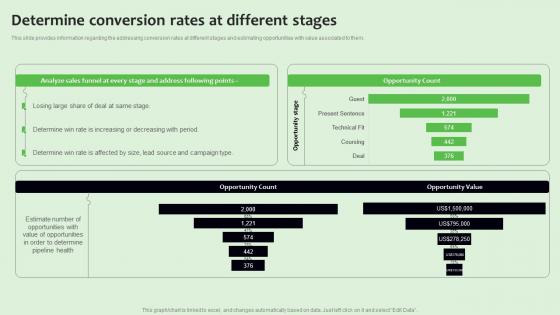
Determine Conversion Rates At Different Stages Strategies To Manage Sales Funnel Professional Pdf
This slide provides information regarding the addressing conversion rates at different stages and estimating opportunities with value associated to them. If your project calls for a presentation, then Slidegeeks is your go-to partner because we have professionally designed, easy-to-edit templates that are perfect for any presentation. After downloading, you can easily edit Determine Conversion Rates At Different Stages Strategies To Manage Sales Funnel Professional Pdf and make the changes accordingly. You can rearrange slides or fill them with different images. Check out all the handy templates This slide provides information regarding the addressing conversion rates at different stages and estimating opportunities with value associated to them.
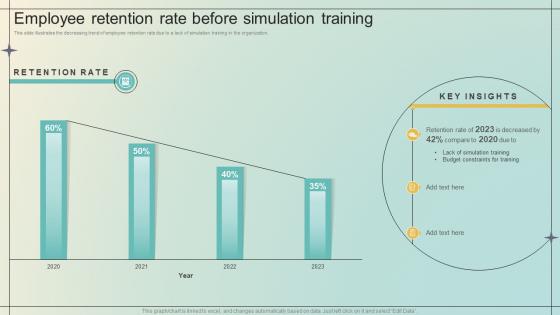
Immersive Training For Practical Employee Retention Rate Before Simulation Training DTE SS V
This slide illustrates the decreasing trend of employee retention rate due to a lack of simulation training in the organization. From laying roadmaps to briefing everything in detail, our templates are perfect for you. You can set the stage with your presentation slides. All you have to do is download these easy-to-edit and customizable templates. Immersive Training For Practical Employee Retention Rate Before Simulation Training DTE SS V will help you deliver an outstanding performance that everyone would remember and praise you for. Do download this presentation today. This slide illustrates the decreasing trend of employee retention rate due to a lack of simulation training in the organization.
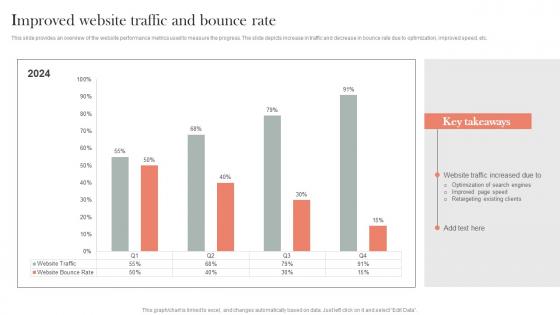
Improved Website Traffic And Bounce Rate Efficient Nonprofit Marketing Microsoft Pdf
This slide provides an overview of the website performance metrics used to measure the progress. The slide depicts increase in traffic and decrease in bounce rate due to optimization, improved speed, etc.Slidegeeks has constructed Improved Website Traffic And Bounce Rate Efficient Nonprofit Marketing Microsoft Pdf after conducting extensive research and examination. These presentation templates are constantly being generated and modified based on user preferences and critiques from editors. Here, you will find the most attractive templates for a range of purposes while taking into account ratings and remarks from users regarding the content. This is an excellent jumping-off point to explore our content and will give new users an insight into our top-notch PowerPoint Templates. This slide provides an overview of the website performance metrics used to measure the progress. The slide depicts increase in traffic and decrease in bounce rate due to optimization, improved speed, etc.
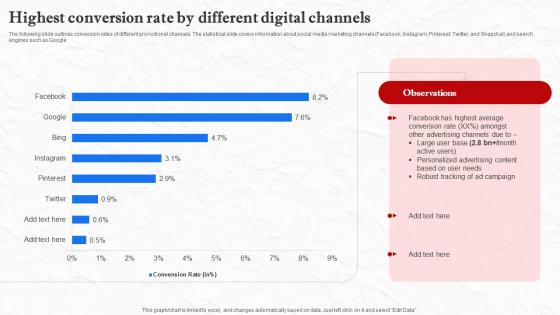
Facebook Marketing Techniques Highest Conversion Rate By Different Digital Channels Strategy SS V
The following slide outlines conversion rates of different promotional channels. The statistical slide covers information about social media marketing channels Facebook, Instagram, Pinterest, Twitter, and Snapchat and search engines such as Google. Explore a selection of the finest Facebook Marketing Techniques Highest Conversion Rate By Different Digital Channels Strategy SS V here. With a plethora of professionally designed and pre-made slide templates, you can quickly and easily find the right one for your upcoming presentation. You can use our Facebook Marketing Techniques Highest Conversion Rate By Different Digital Channels Strategy SS V to effectively convey your message to a wider audience. Slidegeeks has done a lot of research before preparing these presentation templates. The content can be personalized and the slides are highly editable. Grab templates today from Slidegeeks. The following slide outlines conversion rates of different promotional channels. The statistical slide covers information about social media marketing channels Facebook, Instagram, Pinterest, Twitter, and Snapchat and search engines such as Google
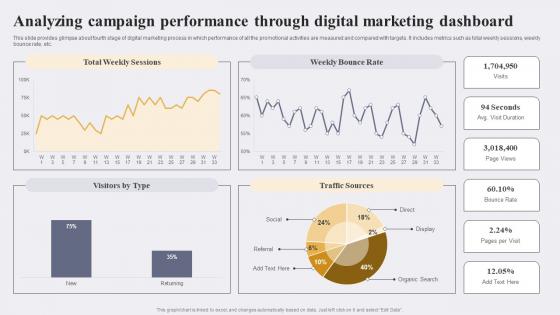
Analyzing Campaign Performance Through Enhancing Conversion Rate By Leveraging Guidelines Pdf
This slide provides glimpse about fourth stage of digital marketing process in which performance of all the promotional activities are measured and compared with targets. It includes metrics such as total weekly sessions, weekly bounce rate, etc.Create an editable Analyzing Campaign Performance Through Enhancing Conversion Rate By Leveraging Guidelines Pdf that communicates your idea and engages your audience. Whether you are presenting a business or an educational presentation, pre-designed presentation templates help save time. Analyzing Campaign Performance Through Enhancing Conversion Rate By Leveraging Guidelines Pdf is highly customizable and very easy to edit, covering many different styles from creative to business presentations. Slidegeeks has creative team members who have crafted amazing templates. So, go and get them without any delay. This slide provides glimpse about fourth stage of digital marketing process in which performance of all the promotional activities are measured and compared with targets. It includes metrics such as total weekly sessions, weekly bounce rate, etc.
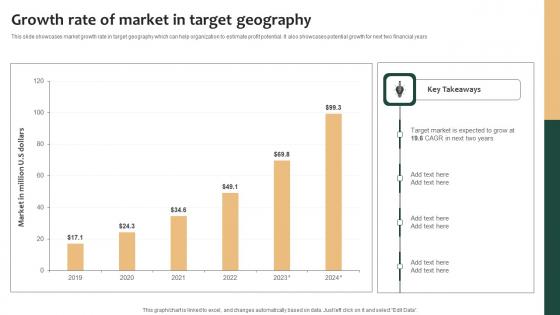
Tailored Product Approach Growth Rate Of Market In Target Geography Ideas Pdf
This slide showcases market growth rate in target geography which can help organization to estimate profit potential. It also showcases potential growth for next two financial years. Find highly impressive Tailored Product Approach Growth Rate Of Market In Target Geography Ideas Pdf on Slidegeeks to deliver a meaningful presentation. You can save an ample amount of time using these presentation templates. No need to worry to prepare everything from scratch because Slidegeeks experts have already done a huge research and work for you. You need to download Tailored Product Approach Growth Rate Of Market In Target Geography Ideas Pdf for your upcoming presentation. All the presentation templates are 100 percent editable and you can change the color and personalize the content accordingly. Download now This slide showcases market growth rate in target geography which can help organization to estimate profit potential. It also showcases potential growth for next two financial years

Project Benchmarking Process Analyzing Customer Bounce Rate For Company CRP DK SS V
This slide showcases website bounce rate monitoring which helps in identifying reasons for poor customer engagement such as usability issues etc. Do you have to make sure that everyone on your team knows about any specific topic I yes, then you should give Project Benchmarking Process Analyzing Customer Bounce Rate For Company CRP DK SS V a try. Our experts have put a lot of knowledge and effort into creating this impeccable Project Benchmarking Process Analyzing Customer Bounce Rate For Company CRP DK SS V. You can use this template for your upcoming presentations, as the slides are perfect to represent even the tiniest detail. You can download these templates from the Slidegeeks website and these are easy to edit. So grab these today This slide showcases website bounce rate monitoring which helps in identifying reasons for poor customer engagement such as usability issues etc.
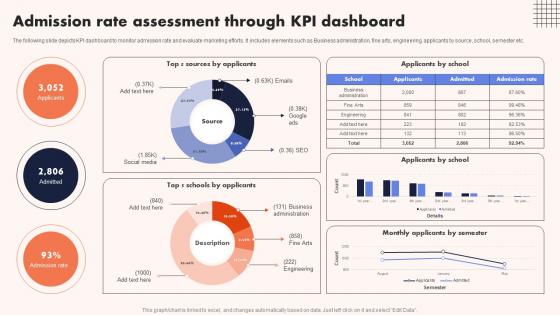
University Marketing Guide Admission Rate Assessment Through KPI Dashboard Strategy SS V
The following slide depicts KPI dashboard to monitor admission rate and evaluate marketing efforts. It includes elements such as Business administration, fine arts, engineering, applicants by source, school, semester etc. Get a simple yet stunning designed University Marketing Guide Admission Rate Assessment Through KPI Dashboard Strategy SS V. It is the best one to establish the tone in your meetings. It is an excellent way to make your presentations highly effective. So, download this PPT today from Slidegeeks and see the positive impacts. Our easy-to-edit University Marketing Guide Admission Rate Assessment Through KPI Dashboard Strategy SS V can be your go-to option for all upcoming conferences and meetings. So, what are you waiting for Grab this template today. The following slide depicts KPI dashboard to monitor admission rate and evaluate marketing efforts. It includes elements such as Business administration, fine arts, engineering, applicants by source, school, semester etc.
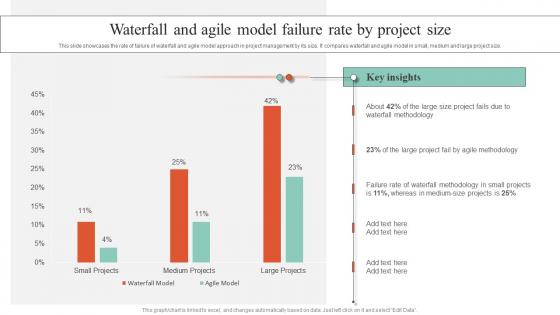
Waterfall And Agile Model Failure Rate By Project Size Executing Guide For Waterfall Download Pdf
This slide showcases the rate of failure of waterfall and agile model approach in project management by its size. It compares waterfall and agile model in small, medium and large project size. Welcome to our selection of the Waterfall And Agile Model Failure Rate By Project Size Executing Guide For Waterfall Download Pdf. These are designed to help you showcase your creativity and bring your sphere to life. Planning and Innovation are essential for any business that is just starting out. This collection contains the designs that you need for your everyday presentations. All of our PowerPoints are 100 percent editable, so you can customize them to suit your needs. This multi-purpose template can be used in various situations. Grab these presentation templates today. This slide showcases the rate of failure of waterfall and agile model approach in project management by its size. It compares waterfall and agile model in small, medium and large project size.
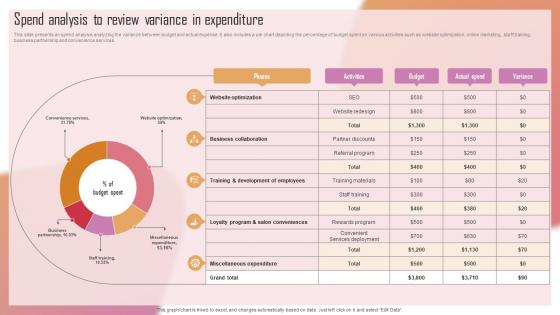
Customizing The Salon Experience Spend Analysis To Review Variance In Expenditure Strategy SS V
This slide presents an spend analysis analyzing the variance between budget and actual expense. It also includes a pie chart depicting the percentage of budget spent on various activities such as website optimization, online marketing, staff training, business partnership and convenience services. Do you know about Slidesgeeks Customizing The Salon Experience Spend Analysis To Review Variance In Expenditure Strategy SS V These are perfect for delivering any kind od presentation. Using it, create PowerPoint presentations that communicate your ideas and engage audiences. Save time and effort by using our pre-designed presentation templates that are perfect for a wide range of topic. Our vast selection of designs covers a range of styles, from creative to business, and are all highly customizable and easy to edit. Download as a PowerPoint template or use them as Google Slides themes. This slide presents an spend analysis analyzing the variance between budget and actual expense. It also includes a pie chart depicting the percentage of budget spent on various activities such as website optimization, online marketing, staff training, business partnership and convenience services.
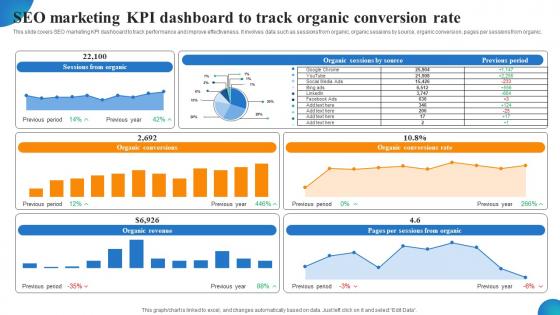
Seo Marketing KPI Dashboard To Track Organic Conversion Rate MDSS For Enhanced Template Pdf
This slide covers SEO marketing KPI dashboard to track performance and improve effectiveness. It involves data such as sessions from organic, organic sessions by source, organic conversion, pages per sessions from organic. Here you can discover an assortment of the finest PowerPoint and Google Slides templates. With these templates, you can create presentations for a variety of purposes while simultaneously providing your audience with an eye-catching visual experience. Download Seo Marketing KPI Dashboard To Track Organic Conversion Rate MDSS For Enhanced Template Pdf to deliver an impeccable presentation. These templates will make your job of preparing presentations much quicker, yet still, maintain a high level of quality. Slidegeeks has experienced researchers who prepare these templates and write high-quality content for you. Later on, you can personalize the content by editing the Seo Marketing KPI Dashboard To Track Organic Conversion Rate MDSS For Enhanced Template Pdf This slide covers SEO marketing KPI dashboard to track performance and improve effectiveness. It involves data such as sessions from organic, organic sessions by source, organic conversion, pages per sessions from organic.


 Continue with Email

 Home
Home


