Cost Chart
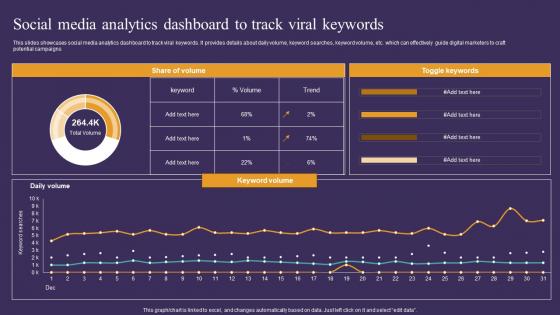
Strategic Guide To Attract Social Media Analytics Dashboard To Track Viral Inspiration Pdf
This slides showcases social media analytics dashboard to track viral keywords. It provides details about daily volume, keyword searches, keyword volume, etc. which can effectively guide digital marketers to craft potential campaigns. Slidegeeks has constructed Strategic Guide To Attract Social Media Analytics Dashboard To Track Viral Inspiration Pdf after conducting extensive research and examination. These presentation templates are constantly being generated and modified based on user preferences and critiques from editors. Here, you will find the most attractive templates for a range of purposes while taking into account ratings and remarks from users regarding the content. This is an excellent jumping-off point to explore our content and will give new users an insight into our top-notch PowerPoint Templates. This slides showcases social media analytics dashboard to track viral keywords. It provides details about daily volume, keyword searches, keyword volume, etc. which can effectively guide digital marketers to craft potential campaigns.
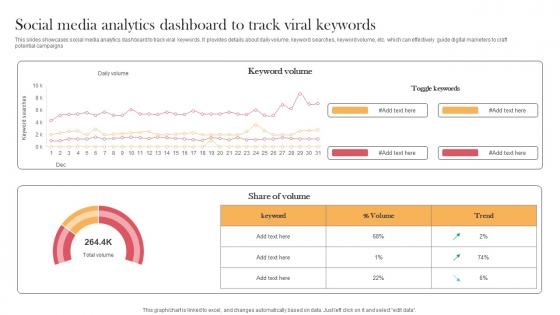
Social Media Analytics Dashboard To Track Viral Keywords Designing Approaches Designs Pdf
This slides showcases social media analytics dashboard to track viral keywords. It provides details about daily volume, keyword searches, keyword volume, etc. which can effectively guide digital marketers to craft potential campaigns. Slidegeeks has constructed Social Media Analytics Dashboard To Track Viral Keywords Designing Approaches Designs Pdf after conducting extensive research and examination. These presentation templates are constantly being generated and modified based on user preferences and critiques from editors. Here, you will find the most attractive templates for a range of purposes while taking into account ratings and remarks from users regarding the content. This is an excellent jumping-off point to explore our content and will give new users an insight into our top-notch PowerPoint Templates. This slides showcases social media analytics dashboard to track viral keywords. It provides details about daily volume, keyword searches, keyword volume, etc. which can effectively guide digital marketers to craft potential campaigns.
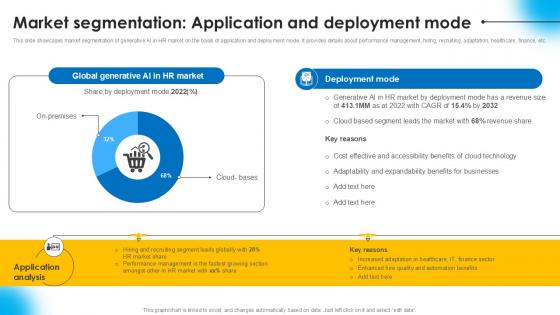
Market Segmentation Application AI Powered Recruitment Enhancing Ppt Slide AI SS V
This slide showcases market segmentation of generative AI in HR market on the basis of application and deployment mode. It provides details about performance management, hiring, recruiting, adaptation, healthcare, finance, etc.Slidegeeks has constructed Market Segmentation Application AI Powered Recruitment Enhancing Ppt Slide AI SS V after conducting extensive research and examination. These presentation templates are constantly being generated and modified based on user preferences and critiques from editors. Here, you will find the most attractive templates for a range of purposes while taking into account ratings and remarks from users regarding the content. This is an excellent jumping off point to explore our content and will give new users an insight into our top notch PowerPoint Templates. This slide showcases market segmentation of generative AI in HR market on the basis of application and deployment mode. It provides details about performance management, hiring, recruiting, adaptation, healthcare, finance, etc.
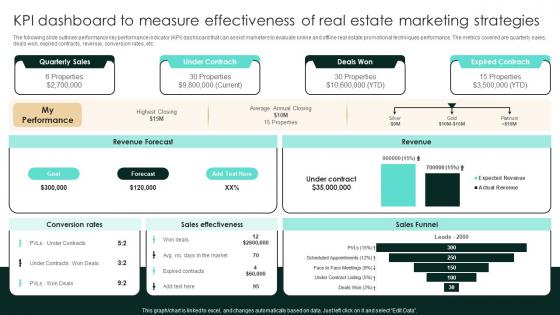
KPI Dashboard To Measure Effectiveness Of Real Estate Marketing Strategic Real Estate Structure Pdf
The following slide outlines performance key performance indicator KPI dashboard that can assist marketers to evaluate online and offline real estate promotional techniques performance. The metrics covered are quarterly sales, deals won, expired contracts, revenue, conversion rates, etc. Here you can discover an assortment of the finest PowerPoint and Google Slides templates. With these templates, you can create presentations for a variety of purposes while simultaneously providing your audience with an eye-catching visual experience. Download KPI Dashboard To Measure Effectiveness Of Real Estate Marketing Strategic Real Estate Structure Pdf to deliver an impeccable presentation. These templates will make your job of preparing presentations much quicker, yet still, maintain a high level of quality. Slidegeeks has experienced researchers who prepare these templates and write high-quality content for you. Later on, you can personalize the content by editing the KPI Dashboard To Measure Effectiveness Of Real Estate Marketing Strategic Real Estate Structure Pdf The following slide outlines performance key performance indicator KPI dashboard that can assist marketers to evaluate online and offline real estate promotional techniques performance. The metrics covered are quarterly sales, deals won, expired contracts, revenue, conversion rates, etc.
Predictive Analytics Model Performance Tracking Predictive Analytics For Improved Portrait Pdf
This slide represents the predictive analytics model performance tracking dashboard, and it covers the details of total visitors, total buyers, total products added to the cart, filters by date and category, visitors to clients conversion rate, and so on. Here you can discover an assortment of the finest PowerPoint and Google Slides templates. With these templates, you can create presentations for a variety of purposes while simultaneously providing your audience with an eye-catching visual experience. Download Predictive Analytics Model Performance Tracking Predictive Analytics For Improved Portrait Pdf to deliver an impeccable presentation. These templates will make your job of preparing presentations much quicker, yet still, maintain a high level of quality. Slidegeeks has experienced researchers who prepare these templates and write high-quality content for you. Later on, you can personalize the content by editing the Predictive Analytics Model Performance Tracking Predictive Analytics For Improved Portrait Pdf. This slide represents the predictive analytics model performance tracking dashboard, and it covers the details of total visitors, total buyers, total products added to the cart, filters by date and category, visitors to clients conversion rate, and so on.
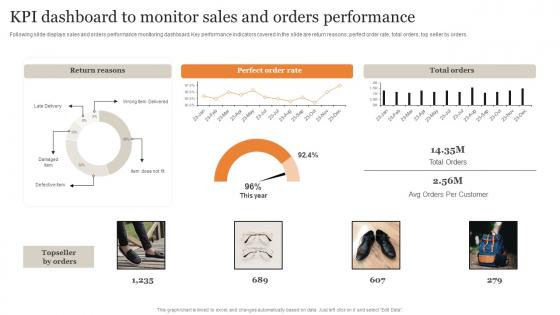
KPI Dashboard To Monitor Sales And Orders Performance Ultimate Guide Implementing Demonstration Pdf
Following slide displays sales and orders performance monitoring dashboard. Key performance indicators covered in the slide are return reasons, perfect order rate, total orders, top seller by orders. Here you can discover an assortment of the finest PowerPoint and Google Slides templates. With these templates, you can create presentations for a variety of purposes while simultaneously providing your audience with an eye-catching visual experience. Download KPI Dashboard To Monitor Sales And Orders Performance Ultimate Guide Implementing Demonstration Pdf to deliver an impeccable presentation. These templates will make your job of preparing presentations much quicker, yet still, maintain a high level of quality. Slidegeeks has experienced researchers who prepare these templates and write high-quality content for you. Later on, you can personalize the content by editing the KPI Dashboard To Monitor Sales And Orders Performance Ultimate Guide Implementing Demonstration Pdf Following slide displays sales and orders performance monitoring dashboard. Key performance indicators covered in the slide are return reasons, perfect order rate, total orders, top seller by orders.
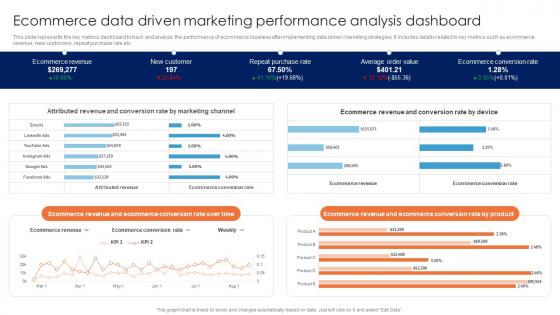
Ecommerce Data Driven Marketing Performance Guide For Data Driven Advertising Brochure Pdf
This slide represents the key metrics dashboard to track and analyze the performance of ecommerce business after implementing data driven marketing strategies. It includes details related to key metrics such as ecommerce revenue, new customers, repeat purchase rate etc.Here you can discover an assortment of the finest PowerPoint and Google Slides templates. With these templates, you can create presentations for a variety of purposes while simultaneously providing your audience with an eye-catching visual experience. Download Ecommerce Data Driven Marketing Performance Guide For Data Driven Advertising Brochure Pdf to deliver an impeccable presentation. These templates will make your job of preparing presentations much quicker, yet still, maintain a high level of quality. Slidegeeks has experienced researchers who prepare these templates and write high-quality content for you. Later on, you can personalize the content by editing the Ecommerce Data Driven Marketing Performance Guide For Data Driven Advertising Brochure Pdf. This slide represents the key metrics dashboard to track and analyze the performance of ecommerce business after implementing data driven marketing strategies. It includes details related to key metrics such as ecommerce revenue, new customers, repeat purchase rate etc.
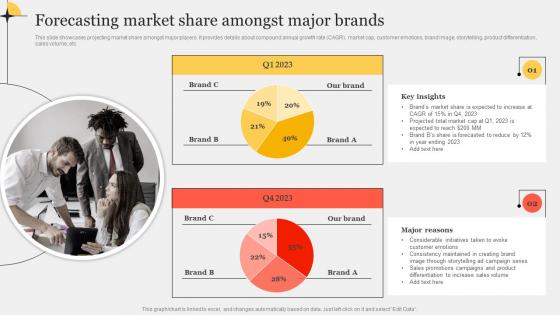
Forecasting Market Share Amongst Major Brands Improving Customer Interaction Through Graphics Pdf
This slide showcases projecting market share amongst major players. It provides details about compound annual growth rate CAGR, market cap, customer emotions, brand image, storytelling, product differentiation, sales volume, etc.Here you can discover an assortment of the finest PowerPoint and Google Slides templates. With these templates, you can create presentations for a variety of purposes while simultaneously providing your audience with an eye-catching visual experience. Download Forecasting Market Share Amongst Major Brands Improving Customer Interaction Through Graphics Pdf to deliver an impeccable presentation. These templates will make your job of preparing presentations much quicker, yet still, maintain a high level of quality. Slidegeeks has experienced researchers who prepare these templates and write high-quality content for you. Later on, you can personalize the content by editing the Forecasting Market Share Amongst Major Brands Improving Customer Interaction Through Graphics Pdf. This slide showcases projecting market share amongst major players. It provides details about compound annual growth rate CAGR, market cap, customer emotions, brand image, storytelling, product differentiation, sales volume, etc.
Social Media Performance Tracking Sales Performance Enhancement Infographics Pdf
The following slide showcases a dashboard to track and measure social media platforms performance. It includes key elements such as website traffic, social media referral rate, site revenue, social media site revenue, etc. Here you can discover an assortment of the finest PowerPoint and Google Slides templates. With these templates, you can create presentations for a variety of purposes while simultaneously providing your audience with an eye catching visual experience. Download Social Media Performance Tracking Sales Performance Enhancement Infographics Pdf to deliver an impeccable presentation. These templates will make your job of preparing presentations much quicker, yet still, maintain a high level of quality. Slidegeeks has experienced researchers who prepare these templates and write high quality content for you. Later on, you can personalize the content by editing the Social Media Performance Tracking Sales Performance Enhancement Infographics Pdf. The following slide showcases a dashboard to track and measure social media platforms performance. It includes key elements such as website traffic, social media referral rate, site revenue, social media site revenue, etc.

KPI Dashboard Showcasing Smart Meter Internet Of Things Solutions To Enhance Energy IoT SS V
This slide exhibits a smart meter monitoring dashboard that provides valuable data, helpful in decision making and enhance regulatory compliance. It includes elements such as voltage, energy consumption, energy meters, energy consumption rate, etc. Here you can discover an assortment of the finest PowerPoint and Google Slides templates. With these templates, you can create presentations for a variety of purposes while simultaneously providing your audience with an eye-catching visual experience. Download KPI Dashboard Showcasing Smart Meter Internet Of Things Solutions To Enhance Energy IoT SS V to deliver an impeccable presentation. These templates will make your job of preparing presentations much quicker, yet still, maintain a high level of quality. Slidegeeks has experienced researchers who prepare these templates and write high-quality content for you. Later on, you can personalize the content by editing the KPI Dashboard Showcasing Smart Meter Internet Of Things Solutions To Enhance Energy IoT SS V. This slide exhibits a smart meter monitoring dashboard that provides valuable data, helpful in decision making and enhance regulatory compliance. It includes elements such as voltage, energy consumption, energy meters, energy consumption rate, etc.
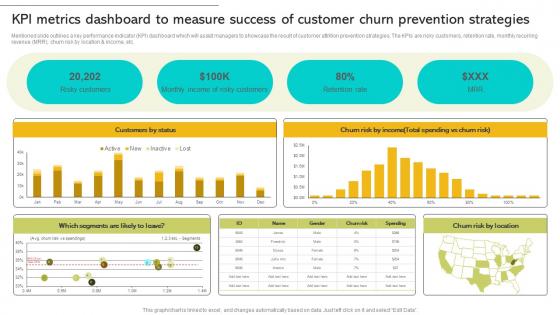
Implementing Strategies To Enhance Kpi Metrics Dashboard To Measure Success Of Customer Churn Ideas PDF
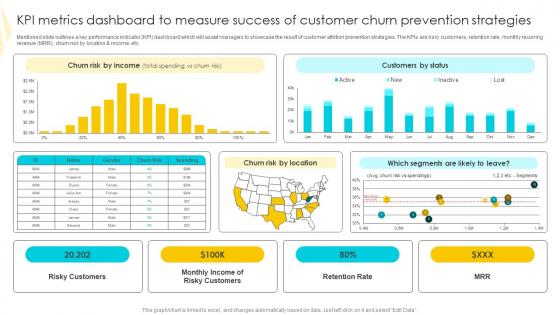
Mentioned slide outlines a key performance indicator KPI dashboard which will assist managers to showcase the result of customer attrition prevention strategies. The KPIs are risky customers, retention rate, monthly recurring revenue MRR, churn risk by location and income, etc. Explore a selection of the finest Implementing Strategies To Enhance Kpi Metrics Dashboard To Measure Success Of Customer Churn Ideas PDF here. With a plethora of professionally designed and pre-made slide templates, you can quickly and easily find the right one for your upcoming presentation. You can use our Implementing Strategies To Enhance Kpi Metrics Dashboard To Measure Success Of Customer Churn Ideas PDF to effectively convey your message to a wider audience. Slidegeeks has done a lot of research before preparing these presentation templates. The content can be personalized and the slides are highly editable. Grab templates today from Slidegeeks. Mentioned slide outlines a key performance indicator KPI dashboard which will assist managers to showcase the result of customer attrition prevention strategies. The KPIs are risky customers, retention rate, monthly recurring revenue MRR, churn risk by location and income, etc.
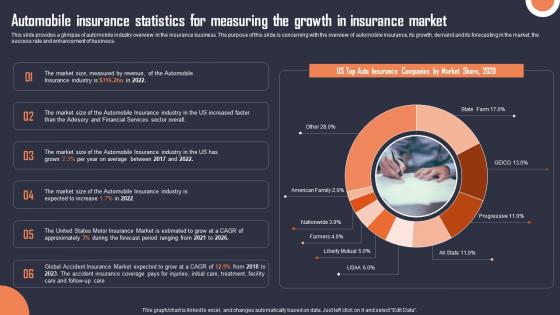
Automobile Insurance Statistics For Measuring The Growth Building An Insurance Company Download Pdf
This slide provides a glimpse of automobile industry overview in the insurance business. The purpose of this slide is concerning with the overview of automobile insurance, its growth, demand and its forecasting in the market, the success rate and enhancement of business. Explore a selection of the finest Automobile Insurance Statistics For Measuring The Growth Building An Insurance Company Download Pdf here. With a plethora of professionally designed and pre-made slide templates, you can quickly and easily find the right one for your upcoming presentation. You can use our Automobile Insurance Statistics For Measuring The Growth Building An Insurance Company Download Pdf to effectively convey your message to a wider audience. Slidegeeks has done a lot of research before preparing these presentation templates. The content can be personalized and the slides are highly editable. Grab templates today from Slidegeeks. This slide provides a glimpse of automobile industry overview in the insurance business. The purpose of this slide is concerning with the overview of automobile insurance, its growth, demand and its forecasting in the market, the success rate and enhancement of business.
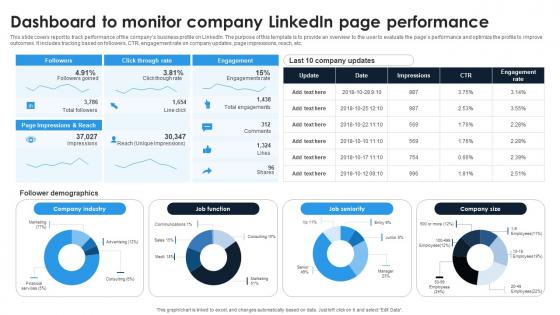
Linkedin Content Strategies Dashboard To Monitor Company Linkedin Page MKT SS V
This slide covers report to track performance of the compans business profile on LinkedIn. The purpose of this template is to provide an overview to the user to evaluate the pages performance and optimize the profile to improve outcomes. It includes tracking based on followers, CTR, engagement rate on company updates, page impressions, reach, etc. Slidegeeks is here to make your presentations a breeze with Linkedin Content Strategies Dashboard To Monitor Company Linkedin Page MKT SS V With our easy-to-use and customizable templates, you can focus on delivering your ideas rather than worrying about formatting. With a variety of designs to choose from, you are sure to find one that suits your needs. And with animations and unique photos, illustrations, and fonts, you can make your presentation pop. So whether you are giving a sales pitch or presenting to the board, make sure to check out Slidegeeks first This slide covers report to track performance of the compans business profile on LinkedIn. The purpose of this template is to provide an overview to the user to evaluate the pages performance and optimize the profile to improve outcomes. It includes tracking based on followers, CTR, engagement rate on company updates, page impressions, reach, etc.
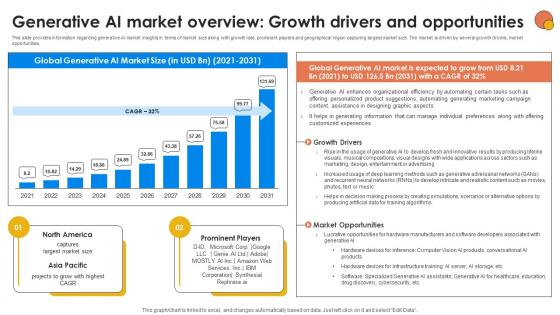
Generative AI Market Overview Growth Generative AI For Better Productivity AI SS V
This slide provides information regarding generative AI market insights in terms of market size along with growth rate, prominent players and geographical region capturing largest market size. The market is driven by several growth drivers, market opportunities. Explore a selection of the finest Generative AI Market Overview Growth Generative AI For Better Productivity AI SS V here. With a plethora of professionally designed and pre-made slide templates, you can quickly and easily find the right one for your upcoming presentation. You can use our Generative AI Market Overview Growth Generative AI For Better Productivity AI SS V to effectively convey your message to a wider audience. Slidegeeks has done a lot of research before preparing these presentation templates. The content can be personalized and the slides are highly editable. Grab templates today from Slidegeeks. This slide provides information regarding generative AI market insights in terms of market size along with growth rate, prominent players and geographical region capturing largest market size. The market is driven by several growth drivers, market opportunities.
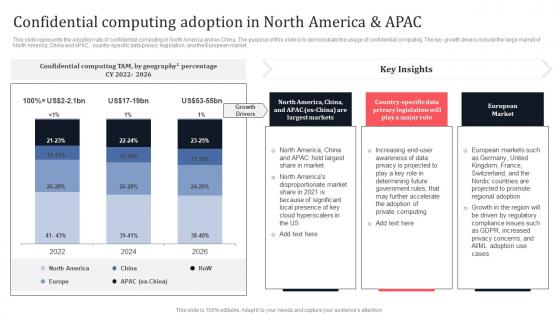
Confidential Computing Adoption In North America And APAC Secure Multi Party Brochure Pdf
This slide represents the adoption rate of confidential computing in North America and ex-China. The purpose of this slide is to demonstrate the usage of confidential computing. The key growth drivers include the large market of North America, China and APAC, country-specific data privacy legislation, and the European market. From laying roadmaps to briefing everything in detail, our templates are perfect for you. You can set the stage with your presentation slides. All you have to do is download these easy-to-edit and customizable templates. Confidential Computing Adoption In North America And APAC Secure Multi Party Brochure Pdf will help you deliver an outstanding performance that everyone would remember and praise you for. Do download this presentation today. This slide represents the adoption rate of confidential computing in North America and ex-China. The purpose of this slide is to demonstrate the usage of confidential computing. The key growth drivers include the large market of North America, China and APAC, country-specific data privacy legislation, and the European market.
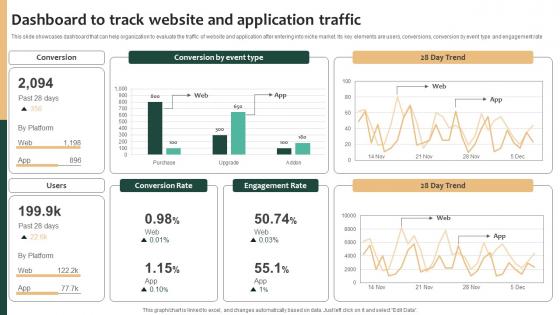
Tailored Product Approach Dashboard To Track Website And Application Traffic Structure Pdf
This slide showcases dashboard that can help organization to evaluate the traffic of website and application after entering into niche market. Its key elements are users, conversions, conversion by event type and engagement rate. Do you have to make sure that everyone on your team knows about any specific topic I yes, then you should give Tailored Product Approach Dashboard To Track Website And Application Traffic Structure Pdf a try. Our experts have put a lot of knowledge and effort into creating this impeccable Tailored Product Approach Dashboard To Track Website And Application Traffic Structure Pdf You can use this template for your upcoming presentations, as the slides are perfect to represent even the tiniest detail. You can download these templates from the Slidegeeks website and these are easy to edit. So grab these today This slide showcases dashboard that can help organization to evaluate the traffic of website and application after entering into niche market. Its key elements are users, conversions, conversion by event type and engagement rate
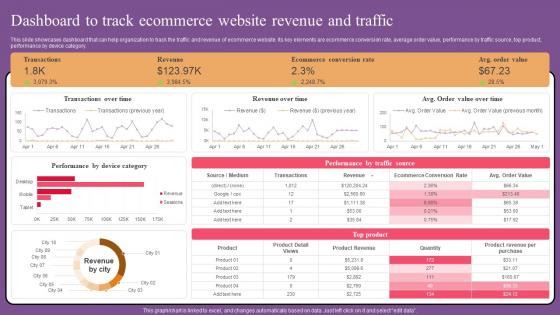
Dashboard Track Ecommerce Website Optimization To Improve Product Sale Professional Pdf
This slide showcases dashboard that can help organization to track the traffic and revenue of ecommerce website. Its key elements are ecommerce conversion rate, average order value, performance by traffic source, top product, performance by device category. Find highly impressive Dashboard Track Ecommerce Website Optimization To Improve Product Sale Professional Pdf on Slidegeeks to deliver a meaningful presentation. You can save an ample amount of time using these presentation templates. No need to worry to prepare everything from scratch because Slidegeeks experts have already done a huge research and work for you. You need to download Dashboard Track Ecommerce Website Optimization To Improve Product Sale Professional Pdf for your upcoming presentation. All the presentation templates are 100 percent editable and you can change the color and personalize the content accordingly. Download now This slide showcases dashboard that can help organization to track the traffic and revenue of ecommerce website. Its key elements are ecommerce conversion rate, average order value, performance by traffic source, top product, performance by device category.
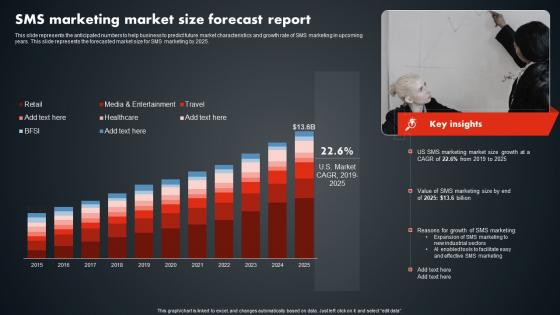
SMS Marketing Market Size Forecast Report SMS Promotional Tactics Clipart PDF
This slide represents the anticipated numbers to help business to predict future market characteristics and growth rate of SMS marketing in upcoming years. This slide represents the forecasted market size for SMS marketing by 2025. Do you have to make sure that everyone on your team knows about any specific topic I yes, then you should give SMS Marketing Market Size Forecast Report SMS Promotional Tactics Clipart PDF a try. Our experts have put a lot of knowledge and effort into creating this impeccable SMS Marketing Market Size Forecast Report SMS Promotional Tactics Clipart PDF. You can use this template for your upcoming presentations, as the slides are perfect to represent even the tiniest detail. You can download these templates from the Slidegeeks website and these are easy to edit. So grab these today This slide represents the anticipated numbers to help business to predict future market characteristics and growth rate of SMS marketing in upcoming years. This slide represents the forecasted market size for SMS marketing by 2025.
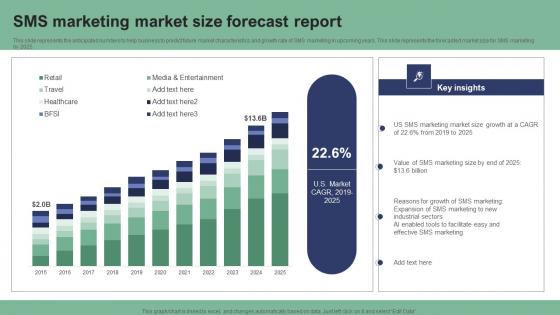
SMS Marketing Market Size Forecast Report Text Message Marketing Strategies Summary Pdf
This slide represents the anticipated numbers to help business to predict future market characteristics and growth rate of SMS marketing in upcoming years. This slide represents the forecasted market size for SMS marketing by 2025. Do you have to make sure that everyone on your team knows about any specific topic I yes, then you should give SMS Marketing Market Size Forecast Report Text Message Marketing Strategies Summary Pdf a try. Our experts have put a lot of knowledge and effort into creating this impeccable SMS Marketing Market Size Forecast Report Text Message Marketing Strategies Summary Pdf. You can use this template for your upcoming presentations, as the slides are perfect to represent even the tiniest detail. You can download these templates from the Slidegeeks website and these are easy to edit. So grab these today. This slide represents the anticipated numbers to help business to predict future market characteristics and growth rate of SMS marketing in upcoming years. This slide represents the forecasted market size for SMS marketing by 2025.
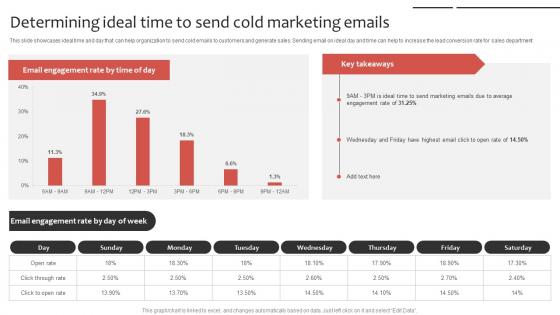
Phone Sales Strategy To Drive Determining Ideal Time To Send Cold Marketing Strategy SS V
This slide showcases ideal time and day that can help organization to send cold emails to customers and generate sales. Sending email on ideal day and time can help to increase the lead conversion rate for sales department. Find highly impressive Phone Sales Strategy To Drive Determining Ideal Time To Send Cold Marketing Strategy SS V on Slidegeeks to deliver a meaningful presentation. You can save an ample amount of time using these presentation templates. No need to worry to prepare everything from scratch because Slidegeeks experts have already done a huge research and work for you. You need to download Phone Sales Strategy To Drive Determining Ideal Time To Send Cold Marketing Strategy SS V for your upcoming presentation. All the presentation templates are 100 percent editable and you can change the color and personalize the content accordingly. Download now This slide showcases ideal time and day that can help organization to send cold emails to customers and generate sales. Sending email on ideal day and time can help to increase the lead conversion rate for sales department.
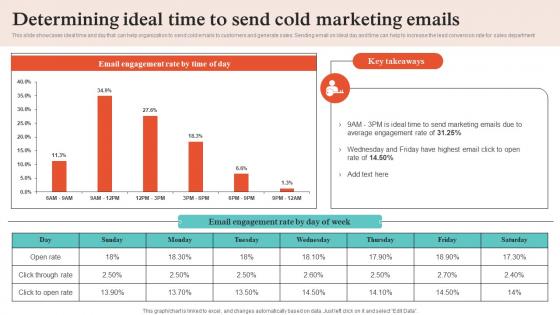
Virtual Sales Strategies Determining Ideal Time To Send Cold Marketing Emails Strategy SS V
This slide showcases ideal time and day that can help organization to send cold emails to customers and generate sales. Sending email on ideal day and time can help to increase the lead conversion rate for sales department. Find highly impressive Virtual Sales Strategies Determining Ideal Time To Send Cold Marketing Emails Strategy SS V on Slidegeeks to deliver a meaningful presentation. You can save an ample amount of time using these presentation templates. No need to worry to prepare everything from scratch because Slidegeeks experts have already done a huge research and work for you. You need to download Virtual Sales Strategies Determining Ideal Time To Send Cold Marketing Emails Strategy SS V for your upcoming presentation. All the presentation templates are 100 percent editable and you can change the color and personalize the content accordingly. Download now This slide showcases ideal time and day that can help organization to send cold emails to customers and generate sales. Sending email on ideal day and time can help to increase the lead conversion rate for sales department.
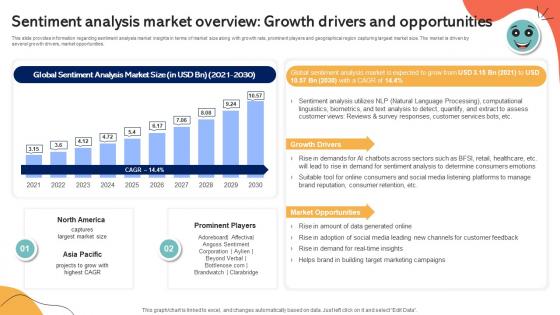
Sentiment Analysis Market Overview Growth Drivers Emotionally Intelligent Insights Leveraging AI SS V
This slide provides information regarding sentiment analysis market insights in terms of market size along with growth rate, prominent players and geographical region capturing largest market size. The market is driven by several growth drivers, market opportunities. Find highly impressive Sentiment Analysis Market Overview Growth Drivers Emotionally Intelligent Insights Leveraging AI SS V on Slidegeeks to deliver a meaningful presentation. You can save an ample amount of time using these presentation templates. No need to worry to prepare everything from scratch because Slidegeeks experts have already done a huge research and work for you. You need to download Sentiment Analysis Market Overview Growth Drivers Emotionally Intelligent Insights Leveraging AI SS V for your upcoming presentation. All the presentation templates are 100 percent editable and you can change the color and personalize the content accordingly. Download now This slide provides information regarding sentiment analysis market insights in terms of market size along with growth rate, prominent players and geographical region capturing largest market size. The market is driven by several growth drivers, market opportunities.
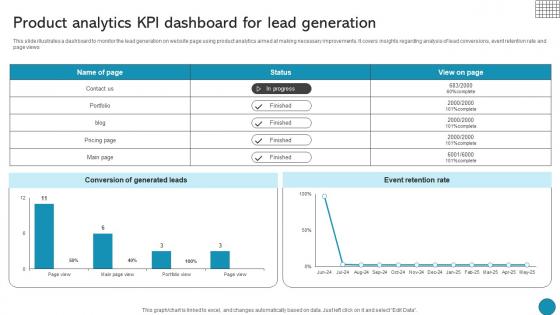
Product Analytics Kpi Dashboard For Lead Generation Driving Business Success Integrating Product
This slide illustrates a dashboard to monitor the lead generation on website page using product analytics aimed at making necessary improvements. It covers insights regarding analysis of lead conversions, event retention rate and page views Do you have to make sure that everyone on your team knows about any specific topic I yes, then you should give Product Analytics Kpi Dashboard For Lead Generation Driving Business Success Integrating Product a try. Our experts have put a lot of knowledge and effort into creating this impeccable Product Analytics Kpi Dashboard For Lead Generation Driving Business Success Integrating Product. You can use this template for your upcoming presentations, as the slides are perfect to represent even the tiniest detail. You can download these templates from the Slidegeeks website and these are easy to edit. So grab these today This slide illustrates a dashboard to monitor the lead generation on website page using product analytics aimed at making necessary improvements. It covers insights regarding analysis of lead conversions, event retention rate and page views
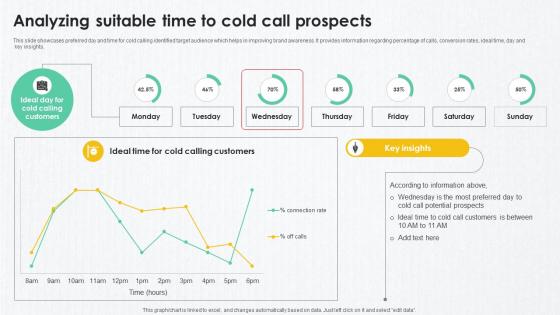
B2B Marketing Techniques Analyzing Suitable Time To Cold Call Prospects
This slide showcases preferred day and time for cold calling identified target audience which helps in improving brand awareness. It provides information regarding percentage of calls, conversion rates, ideal time, day and key insights. Do you have to make sure that everyone on your team knows about any specific topic I yes, then you should give B2B Marketing Techniques Analyzing Suitable Time To Cold Call Prospects a try. Our experts have put a lot of knowledge and effort into creating this impeccable B2B Marketing Techniques Analyzing Suitable Time To Cold Call Prospects. You can use this template for your upcoming presentations, as the slides are perfect to represent even the tiniest detail. You can download these templates from the Slidegeeks website and these are easy to edit. So grab these today This slide showcases preferred day and time for cold calling identified target audience which helps in improving brand awareness. It provides information regarding percentage of calls, conversion rates, ideal time, day and key insights.

Product Analytics KPI Dashboard For Lead Generation Product Analytics Implementation Data Analytics V
This slide illustrates a dashboard to monitor the lead generation on website page using product analytics aimed at making necessary improvements. It covers insights regarding analysis of lead conversions, event retention rate and page views.Do you have to make sure that everyone on your team knows about any specific topic I yes, then you should give Product Analytics KPI Dashboard For Lead Generation Product Analytics Implementation Data Analytics V a try. Our experts have put a lot of knowledge and effort into creating this impeccable Product Analytics KPI Dashboard For Lead Generation Product Analytics Implementation Data Analytics V. You can use this template for your upcoming presentations, as the slides are perfect to represent even the tiniest detail. You can download these templates from the Slidegeeks website and these are easy to edit. So grab these today This slide illustrates a dashboard to monitor the lead generation on website page using product analytics aimed at making necessary improvements. It covers insights regarding analysis of lead conversions, event retention rate and page views

Digital Content Performance Assessment Top Of The Funnel Digital Content Strategy SS V
The following slide depicts key performance indicators of digital content marketing to monitor results. It includes elements such as page views, social shares, click through rate, blog subscribers, conversions, opportunities influenced, average time on page etc. Find highly impressive Digital Content Performance Assessment Top Of The Funnel Digital Content Strategy SS V on Slidegeeks to deliver a meaningful presentation. You can save an ample amount of time using these presentation templates. No need to worry to prepare everything from scratch because Slidegeeks experts have already done a huge research and work for you. You need to download Digital Content Performance Assessment Top Of The Funnel Digital Content Strategy SS V for your upcoming presentation. All the presentation templates are 100 percent editable and you can change the color and personalize the content accordingly. Download now The following slide depicts key performance indicators of digital content marketing to monitor results. It includes elements such as page views, social shares, click through rate, blog subscribers, conversions, opportunities influenced, average time on page etc.
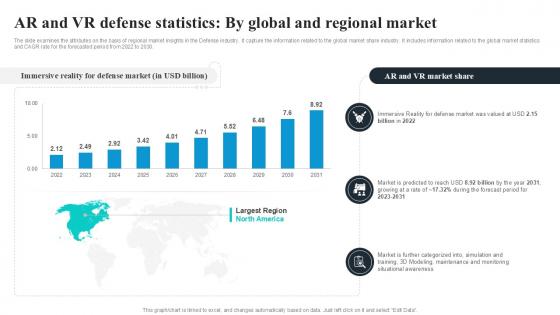
AR And VR Defense Statistics By Global Security Industry PPT Slide IR SS V
The slide examines the attributes on the basis of regional market insights in the Defense industry. It capture the information related to the global market share industry. It includes information related to the global market statistics and CAGR rate for the forecasted period from 2022 to 2030. Create an editable AR And VR Defense Statistics By Global Security Industry PPT Slide IR SS V that communicates your idea and engages your audience. Whether you are presenting a business or an educational presentation, pre-designed presentation templates help save time. AR And VR Defense Statistics By Global Security Industry PPT Slide IR SS V is highly customizable and very easy to edit, covering many different styles from creative to business presentations. Slidegeeks has creative team members who have crafted amazing templates. So, go and get them without any delay. The slide examines the attributes on the basis of regional market insights in the Defense industry. It capture the information related to the global market share industry. It includes information related to the global market statistics and CAGR rate for the forecasted period from 2022 to 2030.
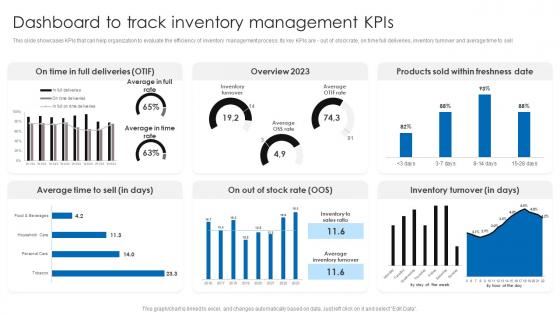
Dashboard To Track Inventory Management Kpis Retail Stock Administration Strategies Rules Pdf
This slide showcases KPIs that can help organization to evaluate the efficiency of inventory management process. Its key KPIs are - out of stock rate, on time full deliveries, inventory turnover and average time to sell.Coming up with a presentation necessitates that the majority of the effort goes into the content and the message you intend to convey. The visuals of a PowerPoint presentation can only be effective if it supplements and supports the story that is being told. Keeping this in mind our experts created Dashboard To Track Inventory Management Kpis Retail Stock Administration Strategies Rules Pdf to reduce the time that goes into designing the presentation. This way, you can concentrate on the message while our designers take care of providing you with the right template for the situation. This slide showcases KPIs that can help organization to evaluate the efficiency of inventory management process. Its key KPIs are out of stock rate, on time full deliveries, inventory turnover and average time to sell
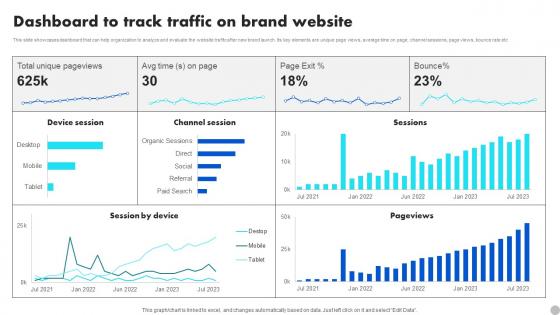
Dashboard To Track Traffic On Brand Website Brand Diversification Approach Rules Pdf
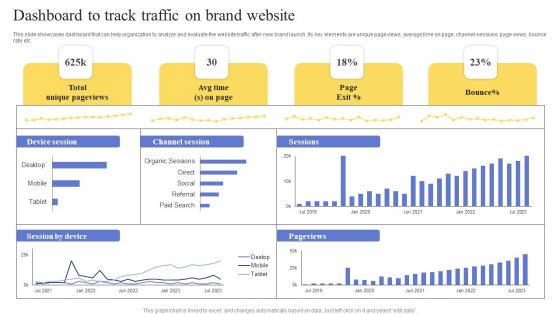
This slide showcases dashboard that can help organization to analyze and evaluate the website traffic after new brand launch. Its key elements are unique page views, average time on page, channel sessions, page views, bounce rate etc. Are you in need of a template that can accommodate all of your creative concepts This one is crafted professionally and can be altered to fit any style. Use it with Google Slides or PowerPoint. Include striking photographs, symbols, depictions, and other visuals. Fill, move around, or remove text boxes as desired. Test out color palettes and font mixtures. Edit and save your work, or work with colleagues. Download Dashboard To Track Traffic On Brand Website Brand Diversification Approach Rules Pdf and observe how to make your presentation outstanding. Give an impeccable presentation to your group and make your presentation unforgettable. This slide showcases dashboard that can help organization to analyze and evaluate the website traffic after new brand launch. Its key elements are unique page views, average time on page, channel sessions, page views, bounce rate etc.
Dashboard To Track Traffic On Brand Website Maximizing Revenue Using Professional Pdf
This slide showcases dashboard that can help organization to analyze and evaluate the website traffic after new brand launch. Its key elements are unique page views, average time on page, channel sessions, page views, bounce rate etc. Are you in need of a template that can accommodate all of your creative concepts This one is crafted professionally and can be altered to fit any style. Use it with Google Slides or PowerPoint. Include striking photographs, symbols, depictions, and other visuals. Fill, move around, or remove text boxes as desired. Test out color palettes and font mixtures. Edit and save your work, or work with colleagues. Download Dashboard To Track Traffic On Brand Website Maximizing Revenue Using Professional Pdf and observe how to make your presentation outstanding. Give an impeccable presentation to your group and make your presentation unforgettable. This slide showcases dashboard that can help organization to analyze and evaluate the website traffic after new brand launch. Its key elements are unique page views, average time on page, channel sessions, page views, bounce rate etc.
Confidential Computing Adoption By Regulated Industries Secure Multi Party Professional Pdf
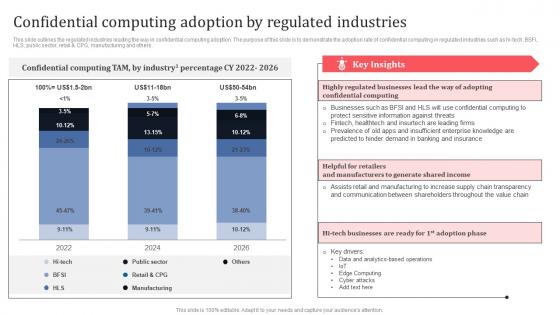
This slide outlines the regulated industries leading the way in confidential computing adoption. The purpose of this slide is to demonstrate the adoption rate of confidential computing in regulated industries such as hi-tech, BSFI, HLS, public sector, retail and CPG, manufacturing and others. Get a simple yet stunning designed Confidential Computing Adoption By Regulated Industries Secure Multi Party Professional Pdf It is the best one to establish the tone in your meetings. It is an excellent way to make your presentations highly effective. So, download this PPT today from Slidegeeks and see the positive impacts. Our easy-to-edit Confidential Computing Adoption By Regulated Industries Secure Multi Party Professional Pdf can be your go-to option for all upcoming conferences and meetings. So, what are you waiting for Grab this template today. This slide outlines the regulated industries leading the way in confidential computing adoption. The purpose of this slide is to demonstrate the adoption rate of confidential computing in regulated industries such as hi-tech, BSFI, HLS, public sector, retail and CPG, manufacturing and others.
KPI Metrics Dashboard To Measure Strategies To Mitigate Customer Churn Formats Pdf
Mentioned slide outlines a key performance indicator KPI dashboard which will assist managers to showcase the result of customer attrition prevention strategies. The KPIs are risky customers, retention rate, monthly recurring revenue MRR, churn risk by location and income, etc. This KPI Metrics Dashboard To Measure Strategies To Mitigate Customer Churn Formats Pdf is perfect for any presentation, be it in front of clients or colleagues. It is a versatile and stylish solution for organizing your meetings. The KPI Metrics Dashboard To Measure Strategies To Mitigate Customer Churn Formats Pdf features a modern design for your presentation meetings. The adjustable and customizable slides provide unlimited possibilities for acing up your presentation. Slidegeeks has done all the homework before launching the product for you. So, do not wait, grab the presentation templates today Mentioned slide outlines a key performance indicator KPI dashboard which will assist managers to showcase the result of customer attrition prevention strategies. The KPIs are risky customers, retention rate, monthly recurring revenue MRR, churn risk by location and income, etc.
Digital Advertising Using Twitter Performance Analysis Dashboard For Twitter Marketing Topics Pdf
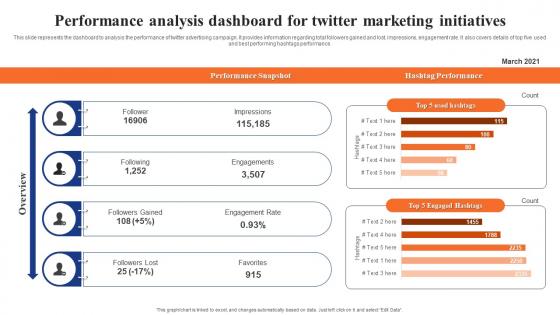
This slide represents the dashboard to analysis the performance of twitter advertising campaign. It provides information regarding total followers gained and lost, impressions, engagement rate. It also covers details of top five used and best performing hashtags performance. Crafting an eye catching presentation has never been more straightforward. Let your presentation shine with this tasteful yet straightforward Digital Advertising Using Twitter Performance Analysis Dashboard For Twitter Marketing Topics Pdf template. It offers a minimalistic and classy look that is great for making a statement. The colors have been employed intelligently to add a bit of playfulness while still remaining professional. Construct the ideal Digital Advertising Using Twitter Performance Analysis Dashboard For Twitter Marketing Topics Pdf that effortlessly grabs the attention of your audience Begin now and be certain to wow your customers This slide represents the dashboard to analysis the performance of twitter advertising campaign. It provides information regarding total followers gained and lost, impressions, engagement rate. It also covers details of top five used and best performing hashtags performance.
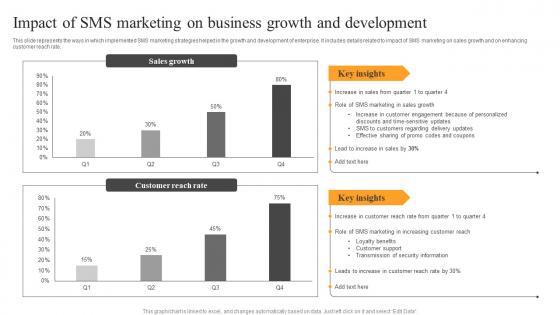
Impact Of SMS Marketing Business Text Message Advertising Solutions Enhancing Introduction Pdf
This slide represents the ways in which implemented SMS marketing strategies helped in the growth and development of enterprise. It includes details related to impact of SMS marketing on sales growth and on enhancing customer reach rate. Coming up with a presentation necessitates that the majority of the effort goes into the content and the message you intend to convey. The visuals of a PowerPoint presentation can only be effective if it supplements and supports the story that is being told. Keeping this in mind our experts created Impact Of SMS Marketing Business Text Message Advertising Solutions Enhancing Introduction Pdf to reduce the time that goes into designing the presentation. This way, you can concentrate on the message while our designers take care of providing you with the right template for the situation. This slide represents the ways in which implemented SMS marketing strategies helped in the growth and development of enterprise. It includes details related to impact of SMS marketing on sales growth and on enhancing customer reach rate.
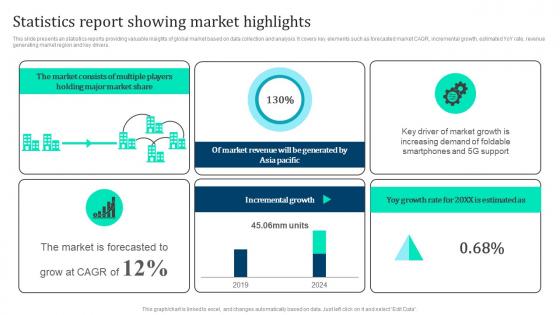
Statistics Report Showing Marketing Intelligence Guide Data Gathering Slides Pdf
This slide presents an statistics reports providing valuable insights of global market based on data collection and analysis. It covers key elements such as forecasted market CAGR, incremental growth, estimated YoY rate, revenue generating market region and key drivers. Get a simple yet stunning designed Statistics Report Showing Marketing Intelligence Guide Data Gathering Slides Pdf. It is the best one to establish the tone in your meetings. It is an excellent way to make your presentations highly effective. So, download this PPT today from Slidegeeks and see the positive impacts. Our easy to edit Statistics Report Showing Marketing Intelligence Guide Data Gathering Slides Pdf can be your go to option for all upcoming conferences and meetings. So, what are you waiting for Grab this template today. This slide presents an statistics reports providing valuable insights of global market based on data collection and analysis. It covers key elements such as forecasted market CAGR, incremental growth, estimated YoY rate, revenue generating market region and key drivers.
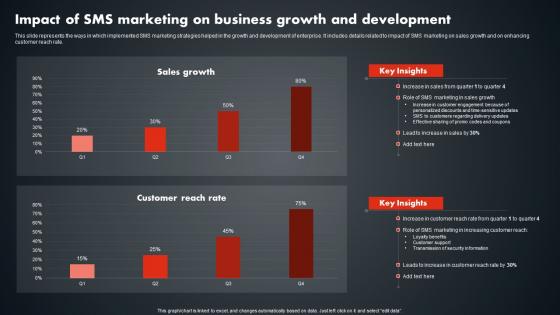
Impact Of SMS Marketing On Business Growth SMS Promotional Tactics Infographics PDF
This slide represents the ways in which implemented SMS marketing strategies helped in the growth and development of enterprise. It includes details related to impact of SMS marketing on sales growth and on enhancing customer reach rate. Crafting an eye-catching presentation has never been more straightforward. Let your presentation shine with this tasteful yet straightforward Impact Of SMS Marketing On Business Growth SMS Promotional Tactics Infographics PDF template. It offers a minimalistic and classy look that is great for making a statement. The colors have been employed intelligently to add a bit of playfulness while still remaining professional. Construct the ideal Impact Of SMS Marketing On Business Growth SMS Promotional Tactics Infographics PDF that effortlessly grabs the attention of your audience Begin now and be certain to wow your customers This slide represents the ways in which implemented SMS marketing strategies helped in the growth and development of enterprise. It includes details related to impact of SMS marketing on sales growth and on enhancing customer reach rate.
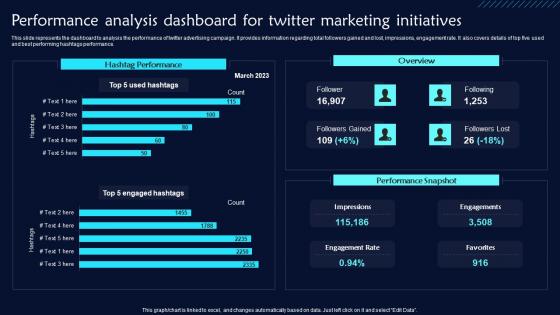
Performance Analysis Dashboard For Twitter Twitter Promotional Techniques Clipart Pdf
This slide represents the dashboard to analysis the performance of twitter advertising campaign. It provides information regarding total followers gained and lost, impressions, engagement rate. It also covers details of top five used and best performing hashtags performance. Crafting an eye-catching presentation has never been more straightforward. Let your presentation shine with this tasteful yet straightforward Performance Analysis Dashboard For Twitter Twitter Promotional Techniques Clipart Pdf template. It offers a minimalistic and classy look that is great for making a statement. The colors have been employed intelligently to add a bit of playfulness while still remaining professional. Construct the ideal Performance Analysis Dashboard For Twitter Twitter Promotional Techniques Clipart Pdf that effortlessly grabs the attention of your audience Begin now and be certain to wow your customers This slide represents the dashboard to analysis the performance of twitter advertising campaign. It provides information regarding total followers gained and lost, impressions, engagement rate. It also covers details of top five used and best performing hashtags performance.
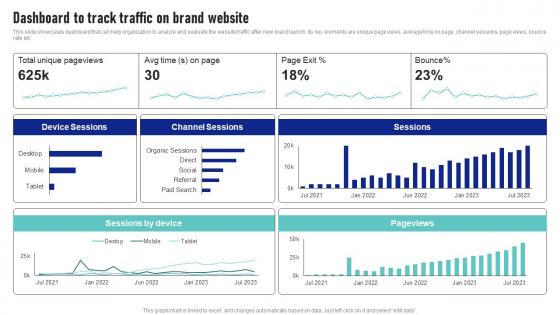
Dashboard To Track Traffic On Brand Website Launching New Product Brand Sample Pdf
This slide showcases dashboard that can help organization to analyze and evaluate the website traffic after new brand launch. Its key elements are unique page views, average time on page, channel sessions, page views, bounce rate etc Are you in need of a template that can accommodate all of your creative concepts This one is crafted professionally and can be altered to fit any style. Use it with Google Slides or PowerPoint. Include striking photographs, symbols, depictions, and other visuals. Fill, move around, or remove text boxes as desired. Test out color palettes and font mixtures. Edit and save your work, or work with colleagues. Download Dashboard To Track Traffic On Brand Website Launching New Product Brand Sample Pdf and observe how to make your presentation outstanding. Give an impeccable presentation to your group and make your presentation unforgettable. This slide showcases dashboard that can help organization to analyze and evaluate the website traffic after new brand launch. Its key elements are unique page views, average time on page, channel sessions, page views, bounce rate etc
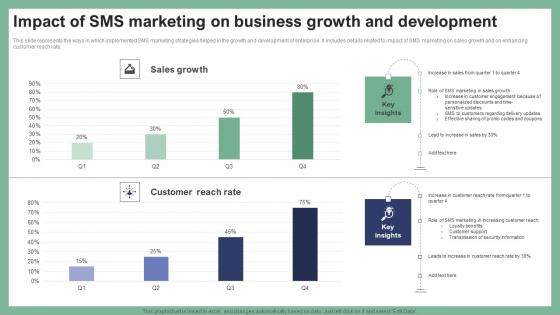
Impact Of SMS Marketing On Business Growth Text Message Marketing Strategies Slides Pdf
This slide represents the ways in which implemented SMS marketing strategies helped in the growth and development of enterprise. It includes details related to impact of SMS marketing on sales growth and on enhancing customer reach rate. Crafting an eye-catching presentation has never been more straightforward. Let your presentation shine with this tasteful yet straightforward Impact Of SMS Marketing On Business Growth Text Message Marketing Strategies Slides Pdf template. It offers a minimalistic and classy look that is great for making a statement. The colors have been employed intelligently to add a bit of playfulness while still remaining professional. Construct the ideal Impact Of SMS Marketing On Business Growth Text Message Marketing Strategies Slides Pdf that effortlessly grabs the attention of your audience. Begin now and be certain to wow your customers. This slide represents the ways in which implemented SMS marketing strategies helped in the growth and development of enterprise. It includes details related to impact of SMS marketing on sales growth and on enhancing customer reach rate.
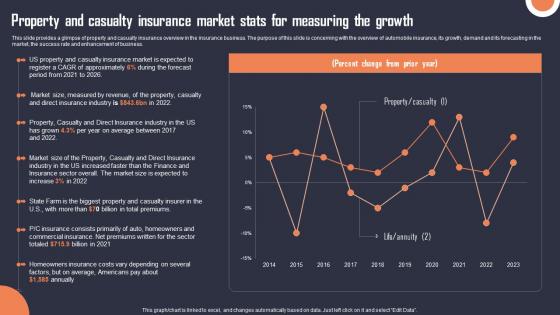
Property And Casualty Insurance Market Stats Building An Insurance Company Graphics Pdf
This slide provides a glimpse of property and casualty insurance overview in the insurance business. The purpose of this slide is concerning with the overview of automobile insurance, its growth, demand and its forecasting in the market, the success rate and enhancement of business. Are you in need of a template that can accommodate all of your creative concepts This one is crafted professionally and can be altered to fit any style. Use it with Google Slides or PowerPoint. Include striking photographs, symbols, depictions, and other visuals. Fill, move around, or remove text boxes as desired. Test out color palettes and font mixtures. Edit and save your work, or work with colleagues. Download Property And Casualty Insurance Market Stats Building An Insurance Company Graphics Pdf and observe how to make your presentation outstanding. Give an impeccable presentation to your group and make your presentation unforgettable. This slide provides a glimpse of property and casualty insurance overview in the insurance business. The purpose of this slide is concerning with the overview of automobile insurance, its growth, demand and its forecasting in the market, the success rate and enhancement of business.
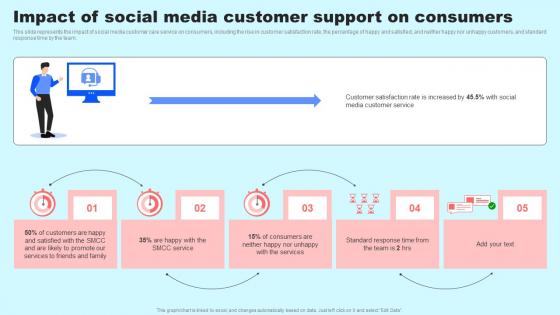
Social Media In Customer Impact Of Social Media Customer Support On Consumers Introduction Pdf
This slide represents the impact of social media customer care service on consumers, including the rise in customer satisfaction rate, the percentage of happy and satisfied, and neither happy nor unhappy customers, and standard response time by the team. Are you in need of a template that can accommodate all of your creative concepts This one is crafted professionally and can be altered to fit any style. Use it with Google Slides or PowerPoint. Include striking photographs, symbols, depictions, and other visuals. Fill, move around, or remove text boxes as desired. Test out color palettes and font mixtures. Edit and save your work, or work with colleagues. Download Social Media In Customer Impact Of Social Media Customer Support On Consumers Introduction Pdf and observe how to make your presentation outstanding. Give an impeccable presentation to your group and make your presentation unforgettable. This slide represents the impact of social media customer care service on consumers, including the rise in customer satisfaction rate, the percentage of happy and satisfied, and neither happy nor unhappy customers, and standard response time by the team.
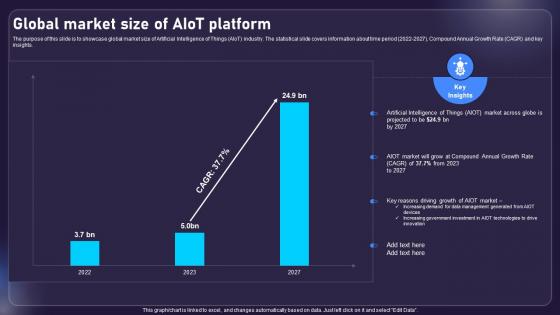
Global Market Size Of AIOT Platform AIOT Applications For Various Industries IoT SS V
The purpose of this slide is to showcase global market size of Artificial Intelligence of Things AIoT industry. The statistical slide covers information about time period 2022-2027, Compound Annual Growth Rate CAGR and key insights. Coming up with a presentation necessitates that the majority of the effort goes into the content and the message you intend to convey. The visuals of a PowerPoint presentation can only be effective if it supplements and supports the story that is being told. Keeping this in mind our experts created Global Market Size Of AIOT Platform AIOT Applications For Various Industries IoT SS V to reduce the time that goes into designing the presentation. This way, you can concentrate on the message while our designers take care of providing you with the right template for the situation. The purpose of this slide is to showcase global market size of Artificial Intelligence of Things AIoT industry. The statistical slide covers information about time period 2022-2027, Compound Annual Growth Rate CAGR and key insights.
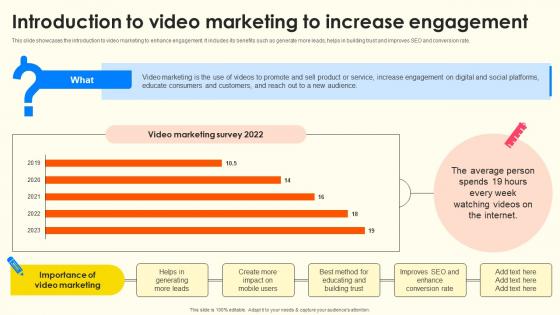
Introduction To Video Marketing To Increase School Enrollment Enhancement Strategy SS V
This slide showcases the introduction to video marketing to enhance engagement. It includes its benefits such as generate more leads, helps in building trust and improves SEO and conversion rate. Formulating a presentation can take up a lot of effort and time, so the content and message should always be the primary focus. The visuals of the PowerPoint can enhance the presenters message, so our Introduction To Video Marketing To Increase School Enrollment Enhancement Strategy SS V was created to help save time. Instead of worrying about the design, the presenter can concentrate on the message while our designers work on creating the ideal templates for whatever situation is needed. Slidegeeks has experts for everything from amazing designs to valuable content, we have put everything into Introduction To Video Marketing To Increase School Enrollment Enhancement Strategy SS V This slide showcases the introduction to video marketing to enhance engagement. It includes its benefits such as generate more leads, helps in building trust and improves SEO and conversion rate.
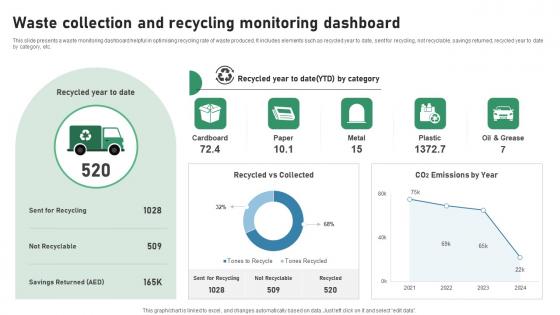
Waste Collection And Recycling Monitoring Dashboard IOT Applications In Smart Waste IoT SS V
This slide presents a waste monitoring dashboard helpful in optimising recycling rate of waste produced. It includes elements such as recycled year to date, sent for recycling, not recyclable, savings returned, recycled year to date by category, etc. Slidegeeks is here to make your presentations a breeze with Waste Collection And Recycling Monitoring Dashboard IOT Applications In Smart Waste IoT SS V With our easy-to-use and customizable templates, you can focus on delivering your ideas rather than worrying about formatting. With a variety of designs to choose from, you are sure to find one that suits your needs. And with animations and unique photos, illustrations, and fonts, you can make your presentation pop. So whether you are giving a sales pitch or presenting to the board, make sure to check out Slidegeeks first This slide presents a waste monitoring dashboard helpful in optimising recycling rate of waste produced. It includes elements such as recycled year to date, sent for recycling, not recyclable, savings returned, recycled year to date by category, etc.
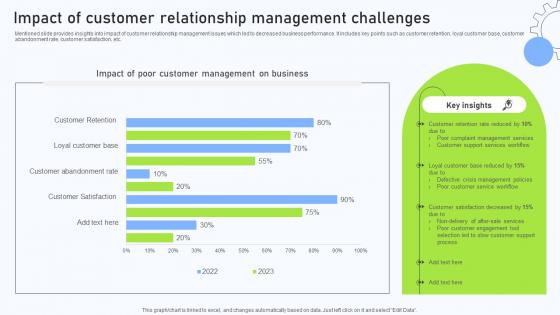
Relationship Management Automation Impact Of Customer Relationship Management
Mentioned slide provides insights into impact of customer relationship management issues which led to decreased business performance. It includes key points such as customer retention, loyal customer base, customer abandonment rate, customer satisfaction, etc. Are you in need of a template that can accommodate all of your creative concepts This one is crafted professionally and can be altered to fit any style. Use it with Google Slides or PowerPoint. Include striking photographs, symbols, depictions, and other visuals. Fill, move around, or remove text boxes as desired. Test out color palettes and font mixtures. Edit and save your work, or work with colleagues. Download Relationship Management Automation Impact Of Customer Relationship Management and observe how to make your presentation outstanding. Give an impeccable presentation to your group and make your presentation unforgettable. Mentioned slide provides insights into impact of customer relationship management issues which led to decreased business performance. It includes key points such as customer retention, loyal customer base, customer abandonment rate, customer satisfaction, etc.
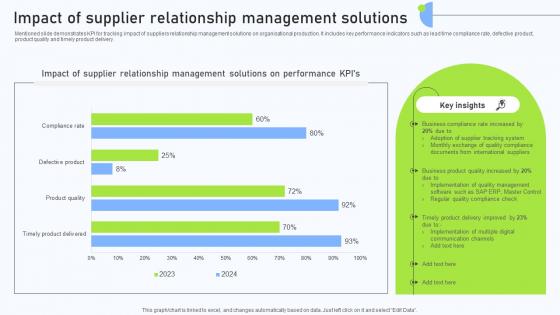
Relationship Management Automation Impact Of Supplier Relationship Management
Mentioned slide demonstrates KPI for tracking impact of suppliers relationship management solutions on organisational production. It includes key performance indicators such as lead time compliance rate, defective product, product quality and timely product delivery. Formulating a presentation can take up a lot of effort and time, so the content and message should always be the primary focus. The visuals of the PowerPoint can enhance the presenters message, so our Relationship Management Automation Impact Of Supplier Relationship Management was created to help save time. Instead of worrying about the design, the presenter can concentrate on the message while our designers work on creating the ideal templates for whatever situation is needed. Slidegeeks has experts for everything from amazing designs to valuable content, we have put everything into Relationship Management Automation Impact Of Supplier Relationship Management Mentioned slide demonstrates KPI for tracking impact of suppliers relationship management solutions on organisational production. It includes key performance indicators such as lead time compliance rate, defective product, product quality and timely product delivery.

Post Digitalization Analysing The Impact On Retail Optimizing Retail Operations With Digital DT SS V
This slide help analyses the improving performance of key performance indicators of retail companies after successful digitalization. It includes online sales growth, cart abandonment rate, customer complaints, inventory inaccuracy, time-to-market, supply chain efficiency, foot traffic, and marketing ROI.This Post Digitalization Analysing The Impact On Retail Optimizing Retail Operations With Digital DT SS V is perfect for any presentation, be it in front of clients or colleagues. It is a versatile and stylish solution for organizing your meetings. The Post Digitalization Analysing The Impact On Retail Optimizing Retail Operations With Digital DT SS V features a modern design for your presentation meetings. The adjustable and customizable slides provide unlimited possibilities for acing up your presentation. Slidegeeks has done all the homework before launching the product for you. So, do not wait, grab the presentation templates today This slide help analyses the improving performance of key performance indicators of retail companies after successful digitalization. It includes online sales growth, cart abandonment rate, customer complaints, inventory inaccuracy, time-to-market, supply chain efficiency, foot traffic, and marketing ROI.
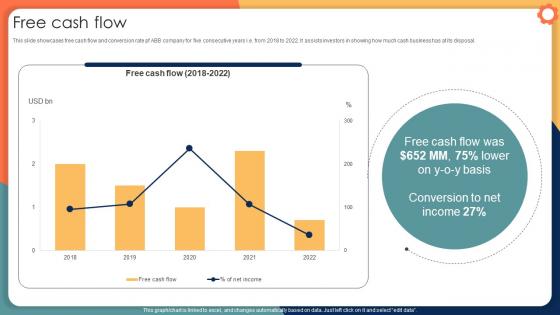
Free Cash Flow Engineering Solution Provider Company Profile CP SS V
This slide showcases free cash flow and conversion rate pf ABB company for five consecutive years i.e. from 2018 to 2022. It assists investors in showing how much cash business has at its disposal. Are you in need of a template that can accommodate all of your creative concepts This one is crafted professionally and can be altered to fit any style. Use it with Google Slides or PowerPoint. Include striking photographs, symbols, depictions, and other visuals. Fill, move around, or remove text boxes as desired. Test out color palettes and font mixtures. Edit and save your work, or work with colleagues. Download Free Cash Flow Engineering Solution Provider Company Profile CP SS V and observe how to make your presentation outstanding. Give an impeccable presentation to your group and make your presentation unforgettable. This slide showcases free cash flow and conversion rate pf ABB company for five consecutive years i.e. from 2018 to 2022. It assists investors in showing how much cash business has at its disposal.
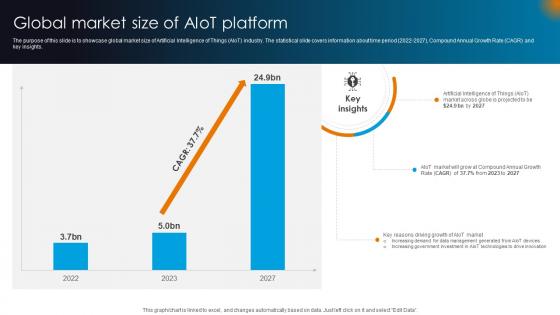
Integrating AI With IoT Global Market Size Of AIoT Platform IoT SS V
The purpose of this slide is to showcase global market size of Artificial Intelligence of Things AIoT industry. The statistical slide covers information about time period 2022-2027, Compound Annual Growth Rate CAGR and key insights. Formulating a presentation can take up a lot of effort and time, so the content and message should always be the primary focus. The visuals of the PowerPoint can enhance the presenters message, so our Integrating AI With IoT Global Market Size Of AIoT Platform IoT SS V was created to help save time. Instead of worrying about the design, the presenter can concentrate on the message while our designers work on creating the ideal templates for whatever situation is needed. Slidegeeks has experts for everything from amazing designs to valuable content, we have put everything into Integrating AI With IoT Global Market Size Of AIoT Platform IoT SS V. The purpose of this slide is to showcase global market size of Artificial Intelligence of Things AIoT industry. The statistical slide covers information about time period 2022-2027, Compound Annual Growth Rate CAGR and key insights.
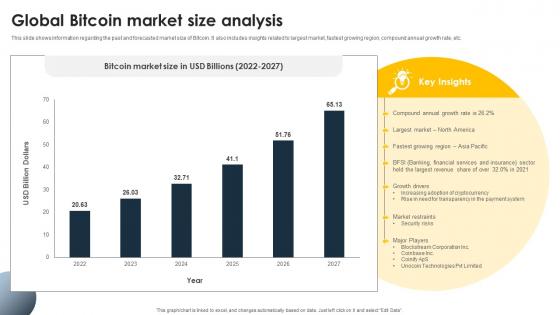
Complete Beginners Guide Global Bitcoin Market Size Analysis Fin SS V
This slide shows information regarding the past and forecasted market size of Bitcoin. It also includes insights related to largest market, fastest growing region, compound annual growth rate, etc. Formulating a presentation can take up a lot of effort and time, so the content and message should always be the primary focus. The visuals of the PowerPoint can enhance the presenters message, so our Complete Beginners Guide Global Bitcoin Market Size Analysis Fin SS V was created to help save time. Instead of worrying about the design, the presenter can concentrate on the message while our designers work on creating the ideal templates for whatever situation is needed. Slidegeeks has experts for everything from amazing designs to valuable content, we have put everything into Complete Beginners Guide Global Bitcoin Market Size Analysis Fin SS V. This slide shows information regarding the past and forecasted market size of Bitcoin. It also includes insights related to largest market, fastest growing region, compound annual growth rate, etc.
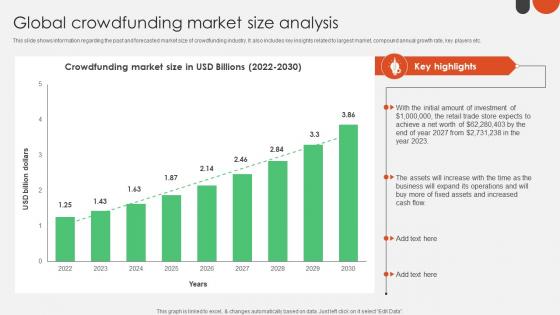
Global Crowdfunding Market Size Analysis Crowdfunding For Nonprofits To Support Fin SS V
This slide shows information regarding the past and forecasted market size of crowdfunding industry. It also includes key insights related to largest market, compound annual growth rate, key players etc. Formulating a presentation can take up a lot of effort and time, so the content and message should always be the primary focus. The visuals of the PowerPoint can enhance the presenters message, so our Global Crowdfunding Market Size Analysis Crowdfunding For Nonprofits To Support Fin SS V was created to help save time. Instead of worrying about the design, the presenter can concentrate on the message while our designers work on creating the ideal templates for whatever situation is needed. Slidegeeks has experts for everything from amazing designs to valuable content, we have put everything into Global Crowdfunding Market Size Analysis Crowdfunding For Nonprofits To Support Fin SS V This slide shows information regarding the past and forecasted market size of crowdfunding industry. It also includes key insights related to largest market, compound annual growth rate, key players etc.
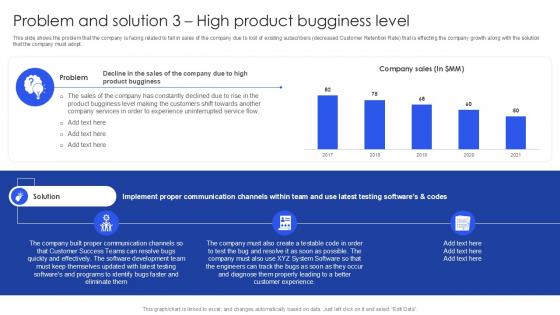
Problem And Solution 3 High Product Bugginess Level PPT Example SS
This slide shows the problem that the company is facing related to fall in sales of the company due to lost of existing subscribers decreased Customer Retention Rate that is effecting the company growth along with the solution that the company must adopt. Coming up with a presentation necessitates that the majority of the effort goes into the content and the message you intend to convey. The visuals of a PowerPoint presentation can only be effective if it supplements and supports the story that is being told. Keeping this in mind our experts created Problem And Solution 3 High Product Bugginess Level PPT Example SS to reduce the time that goes into designing the presentation. This way, you can concentrate on the message while our designers take care of providing you with the right template for the situation. This slide shows the problem that the company is facing related to fall in sales of the company due to lost of existing subscribers decreased Customer Retention Rate that is effecting the company growth along with the solution that the company must adopt.
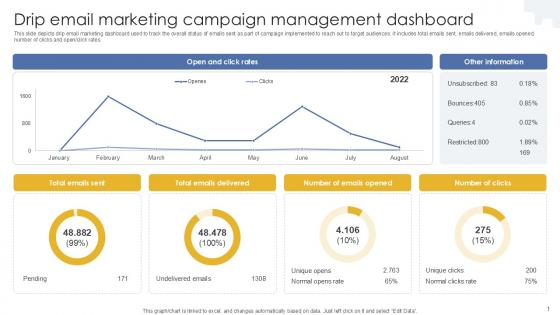
Drip Email Marketing Campaign Management Dashboard PPT Presentation MKT SS V
This slide depicts drip email marketing dashboard used to track the overall status of emails sent as part of campaign implemented to reach out to target audiences. It includes total emails sent, emails delivered, emails opened, number of clicks and open click rates. Present like a pro with Drip Email Marketing Campaign Management Dashboard PPT Presentation MKT SS V. Create beautiful presentations together with your team, using our easy-to-use presentation slides. Share your ideas in real-time and make changes on the fly by downloading our templates. So whether you are in the office, on the go, or in a remote location, you can stay in sync with your team and present your ideas with confidence. With Slidegeeks presentation got a whole lot easier. Grab these presentations today. This slide depicts drip email marketing dashboard used to track the overall status of emails sent as part of campaign implemented to reach out to target audiences. It includes total emails sent, emails delivered, emails opened, number of clicks and open click rates.

Dashboard To Evaluate Top Performing Comprehensive Guide To Wholesale Ppt Presentation
This slide showcases dashboard which helps track sales representatives performance by assessing cold calling KPIs. it provides information regarding KPIs such as conversion rates, no. of items sold. No. of deals converted, value generated etc. Coming up with a presentation necessitates that the majority of the effort goes into the content and the message you intend to convey. The visuals of a PowerPoint presentation can only be effective if it supplements and supports the story that is being told. Keeping this in mind our experts created Dashboard To Evaluate Top Performing Comprehensive Guide To Wholesale Ppt Presentation to reduce the time that goes into designing the presentation. This way, you can concentrate on the message while our designers take care of providing you with the right template for the situation. This slide showcases dashboard which helps track sales representatives performance by assessing cold calling KPIs. it provides information regarding KPIs such as conversion rates, no. of items sold. No. of deals converted, value generated etc.
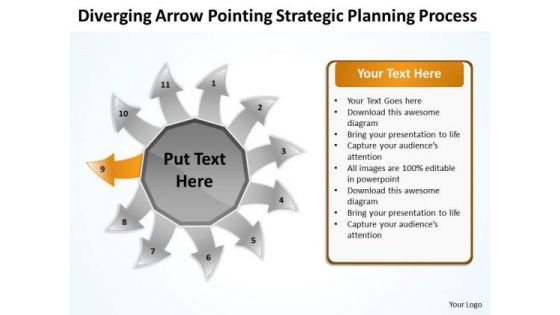
Strategic Planning Process Ppt Relative Circular Flow Arrow Diagram PowerPoint Template
We present our strategic planning process ppt Relative Circular Flow Arrow Diagram PowerPoint template.Download our Arrows PowerPoint Templates because you are the Champion of your team shall anoint. Download our Circle Charts PowerPoint Templates because very often it is important to reflect on the basics. Present our Shapes PowerPoint Templates because you can come forth with the plans you have so carefully laid out. Download our Business PowerPoint Templates because you have secured a name for yourself in the domestic market. Now the time is right to spread your reach to other countries. Download our Flow Charts PowerPoint Templates because generation of sales is the core of any business.Use these PowerPoint slides for presentations relating to ahead, aim, aqua, arrow, back, backward, blue, circle, colorful, converge, converging, course, direction, diverge, diverging, green, header, illustration, left, move, movement, orange, orientation, point, red, right, ring, round, trend, vector, way, yellow. The prominent colors used in the PowerPoint template are Orange, Gray, Black. Presenters tell us our strategic planning process ppt Relative Circular Flow Arrow Diagram PowerPoint template are Festive. The feedback we get is that our colorful PowerPoint templates and PPT Slides will impress their bosses and teams. Presenters tell us our strategic planning process ppt Relative Circular Flow Arrow Diagram PowerPoint template are Dynamic. You can be sure our back PowerPoint templates and PPT Slides are Spectacular. People tell us our strategic planning process ppt Relative Circular Flow Arrow Diagram PowerPoint template are Royal. PowerPoint presentation experts tell us our backward PowerPoint templates and PPT Slides are Endearing. Select the best slide with our Strategic Planning Process Ppt Relative Circular Flow Arrow Diagram PowerPoint Template. Download without worries with our money back guaranteee.
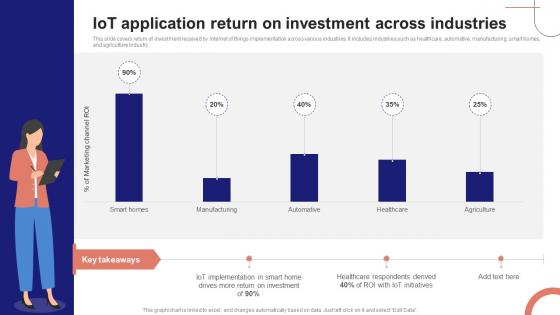
IoT Device Management Fundamentals IoT Application Return On Investment Across Industries IoT Ss V
This slide covers return of investment received by internet of things implementation across various industries. It includes industries such as healthcare, automotive, manufacturing, smart homes, and agriculture industry. The best PPT templates are a great way to save time, energy, and resources. Slidegeeks have 100 percent editable powerpoint slides making them incredibly versatile. With these quality presentation templates, you can create a captivating and memorable presentation by combining visually appealing slides and effectively communicating your message. Download IoT Device Management Fundamentals IoT Application Return On Investment Across Industries IoT SS V from Slidegeeks and deliver a wonderful presentation. This slide covers return of investment received by internet of things implementation across various industries. It includes industries such as healthcare, automotive, manufacturing, smart homes, and agriculture industry.
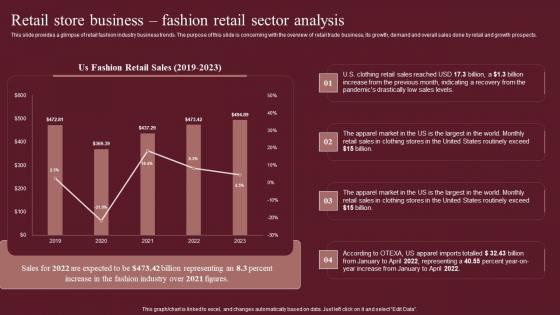
Retail Store Business Fashion Retail Sector Analysis Fashion Business Plan Information Pdf
This slide provides a glimpse of retail fashion industry business trends. The purpose of this slide is concerning with the overview of retail trade business, its growth, demand and overall sales done by retail and growth prospects. Slidegeeks has constructed Retail Store Business Fashion Retail Sector Analysis Fashion Business Plan Information Pdf after conducting extensive research and examination. These presentation templates are constantly being generated and modified based on user preferences and critiques from editors. Here, you will find the most attractive templates for a range of purposes while taking into account ratings and remarks from users regarding the content. This is an excellent jumping-off point to explore our content and will give new users an insight into our top-notch PowerPoint Templates. This slide provides a glimpse of retail fashion industry business trends. The purpose of this slide is concerning with the overview of retail trade business, its growth, demand and overall sales done by retail and growth prospects.
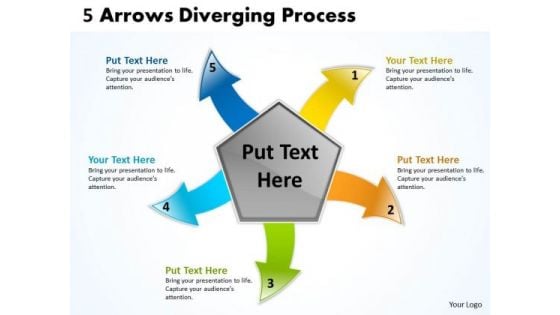
5 Arrows Diverging Concept Process Pie Network PowerPoint Slides
We present our 5 arrows diverging concept process Pie Network PowerPoint Slides.Present our Arrows PowerPoint Templates because it unravels each one for your audience while setting key timelines as you go along. Present our Circle Charts PowerPoint Templates because our PowerPoint Templates and Slides will give your ideas the shape. Use our Shapes PowerPoint Templates because they are the tools that helped most of us evolve. Download our Business PowerPoint Templates because you are ready to flap your wings and launch off. All poised are you to touch the sky with glory. Download and present our Flow Charts PowerPoint Templates because It will Raise the bar of your Thoughts. They are programmed to take you to the next level.Use these PowerPoint slides for presentations relating to arrow, back, background, black, blackboard, blue, board, children, circle, classroom, collection, color, computer, connection, design, direction, drawn, education, element, frame, graphic, green, hand, horizontal, icon, information, internet, office, orange, paint, pointer, pointing, purple, red, round, school, set, sign, symbol, template, vector, web, website, white, whiteboard, wood, yellow. The prominent colors used in the PowerPoint template are Yellow, Orange, Green. Presenters tell us our 5 arrows diverging concept process Pie Network PowerPoint Slides are second to none. You can be sure our black PowerPoint templates and PPT Slides are Vintage. Professionals tell us our 5 arrows diverging concept process Pie Network PowerPoint Slides will generate and maintain the level of interest you desire. They will create the impression you want to imprint on your audience. People tell us our background PowerPoint templates and PPT Slides are Fun. People tell us our 5 arrows diverging concept process Pie Network PowerPoint Slides are Bright. Professionals tell us our circle PowerPoint templates and PPT Slides are Luxuriant. Succeed admirably with our 5 Arrows Diverging Concept Process Pie Network PowerPoint Slides. Download without worries with our money back guaranteee.
Performance Enhancement Plan Social Media Performance Tracking Professional Pdf
The following slide showcases a dashboard to track and measure social media platforms performance. It includes key elements such as website traffic, social media referral rate, site revenue, social media site revenue, etc. Presenting this PowerPoint presentation, titled Performance Enhancement Plan Social Media Performance Tracking Professional Pdf, with topics curated by our researchers after extensive research. This editable presentation is available for immediate download and provides attractive features when used. Download now and captivate your audience. Presenting this Performance Enhancement Plan Social Media Performance Tracking Professional Pdf. Our researchers have carefully researched and created these slides with all aspects taken into consideration. This is a completely customizable Performance Enhancement Plan Social Media Performance Tracking Professional Pdf that is available for immediate downloading. Download now and make an impact on your audience. Highlight the attractive features available with our PPTs. The following slide showcases a dashboard to track and measure social media platforms performance. It includes key elements such as website traffic, social media referral rate, site revenue, social media site revenue, etc.
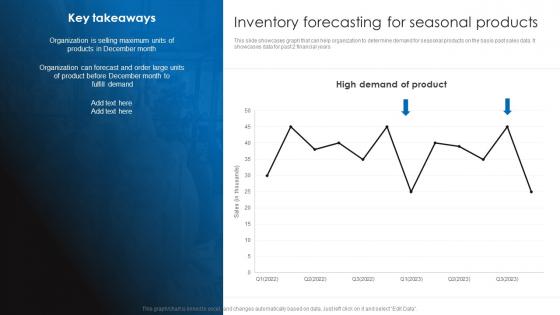
Inventory Forecasting For Seasonal Products Retail Stock Administration Strategies Template Pdf
This slide showcases graph that can help organization to determine demand for seasonal products on the basis past sales data. It showcases data for past 2 financial years.Slidegeeks has constructed Inventory Forecasting For Seasonal Products Retail Stock Administration Strategies Template Pdf after conducting extensive research and examination. These presentation templates are constantly being generated and modified based on user preferences and critiques from editors. Here, you will find the most attractive templates for a range of purposes while taking into account ratings and remarks from users regarding the content. This is an excellent jumping-off point to explore our content and will give new users an insight into our top-notch PowerPoint Templates. This slide showcases graph that can help organization to determine demand for seasonal products on the basis past sales data. It showcases data for past 2 financial years.


 Continue with Email

 Home
Home


