Cost Chart
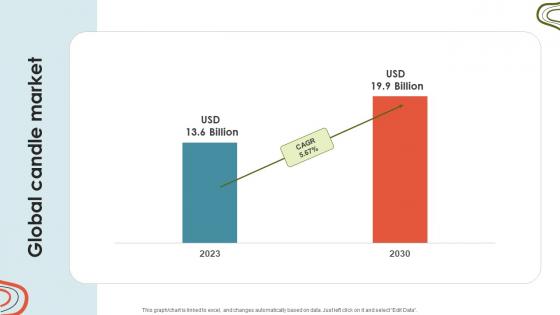
Candle Business Venture Global Candle Market BP SS V
Make sure to capture your audiences attention in your business displays with our gratis customizable Candle Business Venture Global Candle Market BP SS V. These are great for business strategies, office conferences, capital raising or task suggestions. If you desire to acquire more customers for your tech business and ensure they stay satisfied, create your own sales presentation with these plain slides. Our Candle Business Venture Global Candle Market BP SS V are topically designed to provide an attractive backdrop to any subject. Use them to look like a presentation pro.
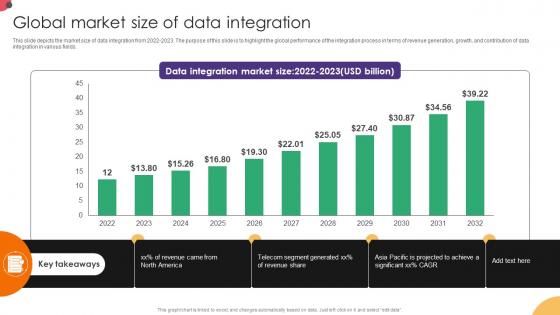
Global Market Size Of Data Integration Data Integration Strategies For Business
This slide depicts the market size of data integration from 2022-2023. The purpose of this slide is to highlight the global performance of the integration process in terms of revenue generation, growth, and contribution of data integration in various fields. This Global Market Size Of Data Integration Data Integration Strategies For Business from Slidegeeks makes it easy to present information on your topic with precision. It provides customization options, so you can make changes to the colors, design, graphics, or any other component to create a unique layout. It is also available for immediate download, so you can begin using it right away. Slidegeeks has done good research to ensure that you have everything you need to make your presentation stand out. Make a name out there for a brilliant performance. This slide depicts the market size of data integration from 2022-2023. The purpose of this slide is to highlight the global performance of the integration process in terms of revenue generation, growth, and contribution of data integration in various fields.

The Digital Project Managers Project Change Management Kpi Dashboard
This slide represents KPI dashboard to effectively track and monitor effectiveness of changes implemented in organizational projects. It includes details related to KPIs such as changes investigated, submitted, approved, declined, etc. This The Digital Project Managers Project Change Management Kpi Dashboard from Slidegeeks makes it easy to present information on your topic with precision. It provides customization options, so you can make changes to the colors, design, graphics, or any other component to create a unique layout. It is also available for immediate download, so you can begin using it right away. Slidegeeks has done good research to ensure that you have everything you need to make your presentation stand out. Make a name out there for a brilliant performance. This slide represents KPI dashboard to effectively track and monitor effectiveness of changes implemented in organizational projects. It includes details related to KPIs such as changes investigated, submitted, approved, declined, etc.
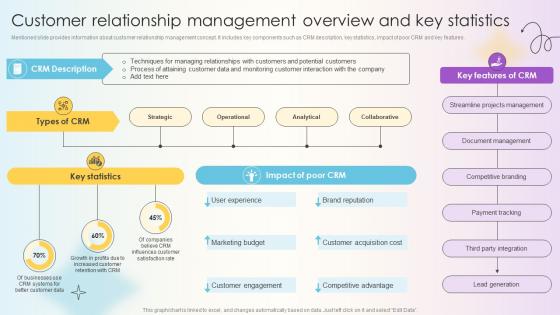
Managing Technical And Non Customer Relationship Management Overview And Key
Mentioned slide provides information about customer relationship management concept. It includes key components such as CRM description, key statistics, impact of poor CRM and key features. Make sure to capture your audiences attention in your business displays with our gratis customizable Managing Technical And Non Customer Relationship Management Overview And Key. These are great for business strategies, office conferences, capital raising or task suggestions. If you desire to acquire more customers for your tech business and ensure they stay satisfied, create your own sales presentation with these plain slides. Mentioned slide provides information about customer relationship management concept. It includes key components such as CRM description, key statistics, impact of poor CRM and key features.
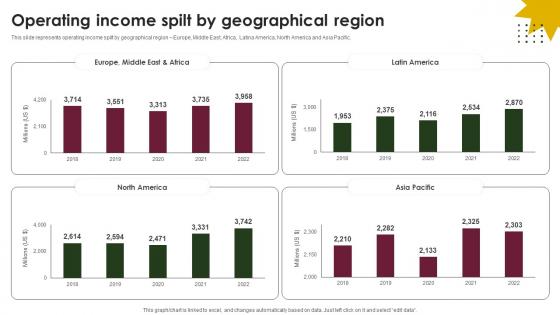
Operating Income Spilt By Geographical Region Beverage Company Profile CP SS V
This slide represents operating income spilt by geographical region Europe, Middle East, Africa, Latina America, North America and Asia Pacific.Make sure to capture your audiences attention in your business displays with our gratis customizable Operating Income Spilt By Geographical Region Beverage Company Profile CP SS V. These are great for business strategies, office conferences, capital raising or task suggestions. If you desire to acquire more customers for your tech business and ensure they stay satisfied, create your own sales presentation with these plain slides. This slide represents operating income spilt by geographical region Europe, Middle East, Africa, Latina America, North America and Asia Pacific.
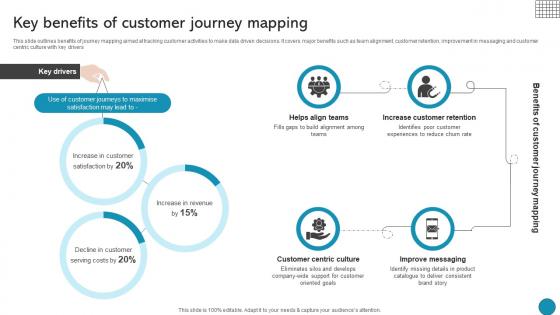
Key Benefits Of Customer Journey Mapping Driving Business Success Integrating Product
This slide outlines benefits of journey mapping aimed at tracking customer activities to make data driven decisions. It covers major benefits such as team alignment, customer retention, improvement in messaging and customer centric culture with key drivers Take your projects to the next level with our ultimate collection of Key Benefits Of Customer Journey Mapping Driving Business Success Integrating Product. Slidegeeks has designed a range of layouts that are perfect for representing task or activity duration, keeping track of all your deadlines at a glance. Tailor these designs to your exact needs and give them a truly corporate look with your own brand colors they will make your projects stand out from the rest This slide outlines benefits of journey mapping aimed at tracking customer activities to make data driven decisions. It covers major benefits such as team alignment, customer retention, improvement in messaging and customer centric culture with key drivers
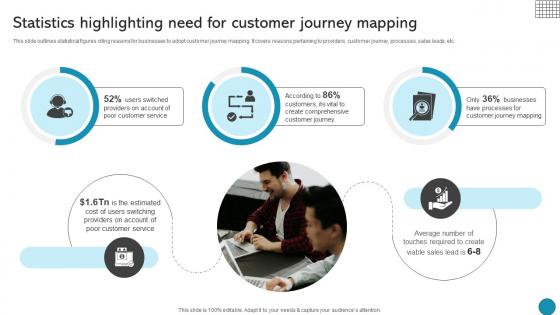
Statistics Highlighting Need For Customer Journey Driving Business Success Integrating Product
This slide outlines statistical figures citing reasons for businesses to adopt customer journey mapping. It covers reasons pertaining to providers, customer journey, processes, sales leads, etc. Make sure to capture your audiences attention in your business displays with our gratis customizable Statistics Highlighting Need For Customer Journey Driving Business Success Integrating Product. These are great for business strategies, office conferences, capital raising or task suggestions. If you desire to acquire more customers for your tech business and ensure they stay satisfied, create your own sales presentation with these plain slides. This slide outlines statistical figures citing reasons for businesses to adopt customer journey mapping. It covers reasons pertaining to providers, customer journey, processes, sales leads, etc.
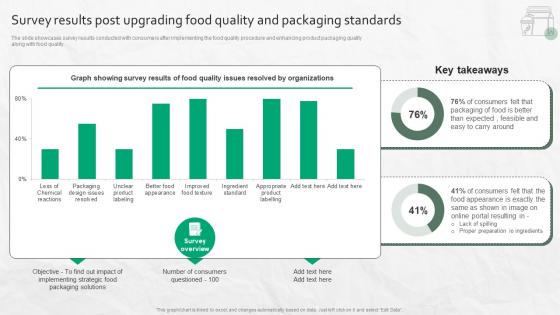
Survey Results Post Upgrading Food Quality And Packaging Standards
The slide showcases survey results conducted with consumers after implementing the food quality procedure and enhancing product packaging quality along with food quality. Do you have an important presentation coming up Are you looking for something that will make your presentation stand out from the rest Look no further than Survey Results Post Upgrading Food Quality And Packaging Standards. With our professional designs, you can trust that your presentation will pop and make delivering it a smooth process. And with Slidegeeks, you can trust that your presentation will be unique and memorable. So why wait Grab Survey Results Post Upgrading Food Quality And Packaging Standards today and make your presentation stand out from the rest The slide showcases survey results conducted with consumers after implementing the food quality procedure and enhancing product packaging quality along with food quality.
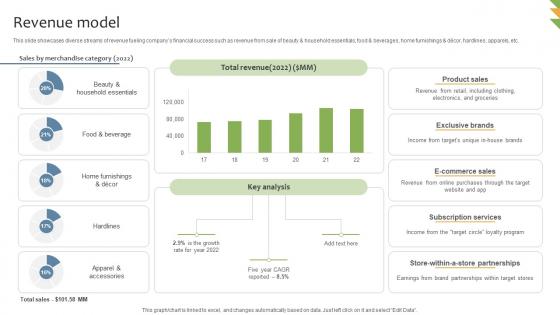
Revenue Model General Merchandising Store Business Model BMC SS V
This slide showcases diverse streams of revenue fueling companys financial success such as revenue from sale of beauty and household essentials, food and beverages, home furnishings and decor, hardlines, apparels, etc. Presenting this PowerPoint presentation, titled Revenue Model General Merchandising Store Business Model BMC SS V, with topics curated by our researchers after extensive research. This editable presentation is available for immediate download and provides attractive features when used. Download now and captivate your audience. Presenting this Revenue Model General Merchandising Store Business Model BMC SS V. Our researchers have carefully researched and created these slides with all aspects taken into consideration. This is a completely customizable Revenue Model General Merchandising Store Business Model BMC SS V that is available for immediate downloading. Download now and make an impact on your audience. Highlight the attractive features available with our PPTs. This slide showcases diverse streams of revenue fueling companys financial success such as revenue from sale of beauty and household essentials, food and beverages, home furnishings and decor, hardlines, apparels, etc.
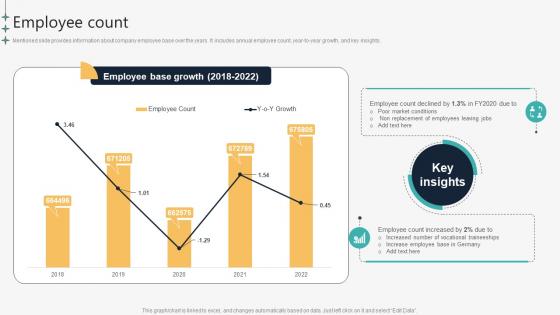
Employee Count Automotive Manufacturing Company Profile CP SS V
Mentioned slide provides information about company employee base over the years. It includes annual employee count, year-to-year growth, and key insights.Do you have an important presentation coming up Are you looking for something that will make your presentation stand out from the rest Look no further than Employee Count Automotive Manufacturing Company Profile CP SS V. With our professional designs, you can trust that your presentation will pop and make delivering it a smooth process. And with Slidegeeks, you can trust that your presentation will be unique and memorable. So why wait Grab Employee Count Automotive Manufacturing Company Profile CP SS V today and make your presentation stand out from the rest Mentioned slide provides information about company employee base over the years. It includes annual employee count, year-to-year growth, and key insights.
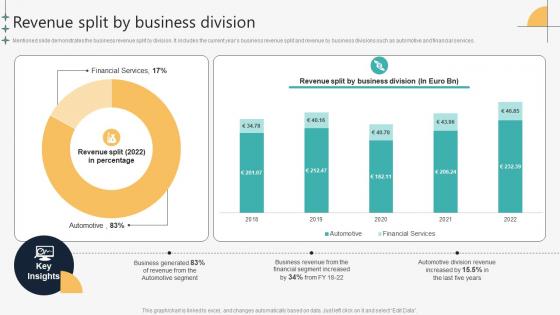
Revenue Split By Business Division Automotive Manufacturing Company Profile CP SS V
Mentioned slide demonstrates the business revenue split by division. It includes the current years business revenue split and revenue by business divisions such as automotive and financial services.Take your projects to the next level with our ultimate collection of Revenue Split By Business Division Automotive Manufacturing Company Profile CP SS V. Slidegeeks has designed a range of layouts that are perfect for representing task or activity duration, keeping track of all your deadlines at a glance. Tailor these designs to your exact needs and give them a truly corporate look with your own brand colors they will make your projects stand out from the rest Mentioned slide demonstrates the business revenue split by division. It includes the current years business revenue split and revenue by business divisions such as automotive and financial services.
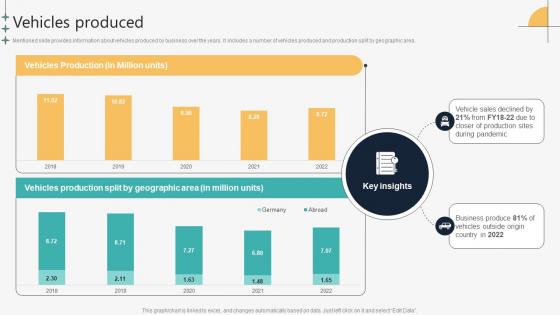
Vehicles Produced Automotive Manufacturing Company Profile CP SS V
Mentioned slide provides information about vehicles produced by business over the years. It includes a number of vehicles produced and production split by geographic area.Do you have an important presentation coming up Are you looking for something that will make your presentation stand out from the rest Look no further than Vehicles Produced Automotive Manufacturing Company Profile CP SS V. With our professional designs, you can trust that your presentation will pop and make delivering it a smooth process. And with Slidegeeks, you can trust that your presentation will be unique and memorable. So why wait Grab Vehicles Produced Automotive Manufacturing Company Profile CP SS V today and make your presentation stand out from the rest Mentioned slide provides information about vehicles produced by business over the years. It includes a number of vehicles produced and production split by geographic area.
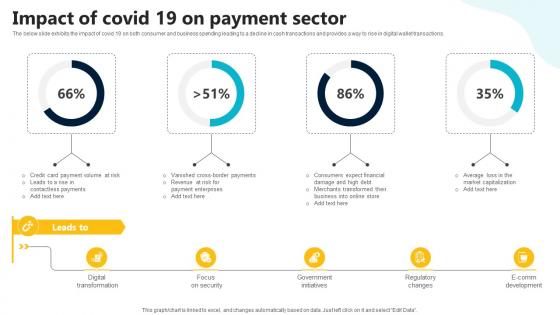
Impact Of Covid 19 On Payment Sector In Depth Guide To Digital Wallets Fin SS V
The below slide exhibits the impact of covid 19 on both consumer and business spending leading to a decline in cash transactions and provides a way to rise in digital wallet transactions. Presenting this PowerPoint presentation, titled Impact Of Covid 19 On Payment Sector In Depth Guide To Digital Wallets Fin SS V, with topics curated by our researchers after extensive research. This editable presentation is available for immediate download and provides attractive features when used. Download now and captivate your audience. Presenting this Impact Of Covid 19 On Payment Sector In Depth Guide To Digital Wallets Fin SS V. Our researchers have carefully researched and created these slides with all aspects taken into consideration. This is a completely customizable Impact Of Covid 19 On Payment Sector In Depth Guide To Digital Wallets Fin SS V that is available for immediate downloading. Download now and make an impact on your audience. Highlight the attractive features available with our PPTs. The below slide exhibits the impact of covid 19 on both consumer and business spending leading to a decline in cash transactions and provides a way to rise in digital wallet transactions.
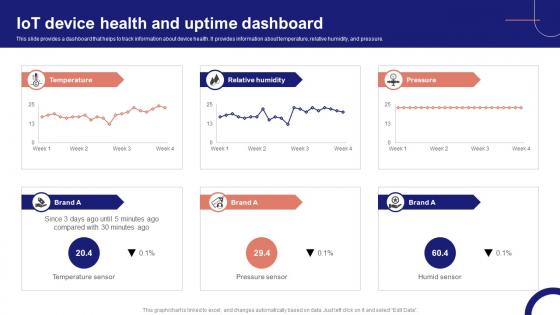
IoT Device Management Fundamentals IoT Device Health And Uptime Dashboard IoT Ss V
This slide provides a dashboard that helps to track information about device health. It provides information about temperature, relative humidity, and pressure. Take your projects to the next level with our ultimate collection of IoT Device Management Fundamentals IoT Device Health And Uptime Dashboard IoT SS V. Slidegeeks has designed a range of layouts that are perfect for representing task or activity duration, keeping track of all your deadlines at a glance. Tailor these designs to your exact needs and give them a truly corporate look with your own brand colors they will make your projects stand out from the rest This slide provides a dashboard that helps to track information about device health. It provides information about temperature, relative humidity, and pressure.
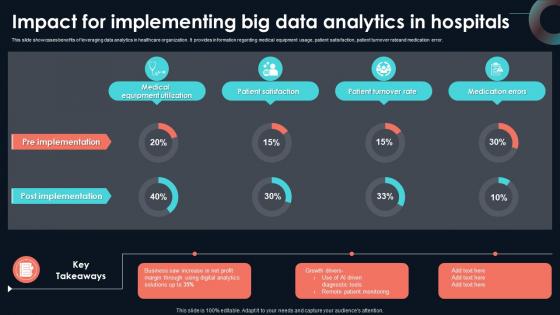
Impact For Implementing Big Data Analytics Developing Strategic Insights Using Big Data Analytics SS V
This slide showcases benefits of leveraging data analytics in healthcare organization. It provides information regarding medical equipment usage, patient satisfaction, patient turnover rateand medication error. Take your projects to the next level with our ultimate collection of Impact For Implementing Big Data Analytics Developing Strategic Insights Using Big Data Analytics SS V. Slidegeeks has designed a range of layouts that are perfect for representing task or activity duration, keeping track of all your deadlines at a glance. Tailor these designs to your exact needs and give them a truly corporate look with your own brand colors they will make your projects stand out from the rest This slide showcases benefits of leveraging data analytics in healthcare organization. It provides information regarding medical equipment usage, patient satisfaction, patient turnover rateand medication error.
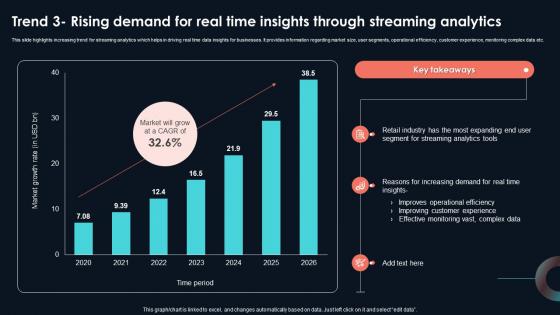
Trend 3 Rising Demand For Real Time Insights Developing Strategic Insights Using Big Data Analytics SS V
This slide highlights increasing trend for streaming analytics which helps in driving real time data insights for businesses. It provides information regarding market size, user segments, operational efficiency, customer experience, monitoring complex data etc. Take your projects to the next level with our ultimate collection of Trend 3 Rising Demand For Real Time Insights Developing Strategic Insights Using Big Data Analytics SS V. Slidegeeks has designed a range of layouts that are perfect for representing task or activity duration, keeping track of all your deadlines at a glance. Tailor these designs to your exact needs and give them a truly corporate look with your own brand colors they will make your projects stand out from the rest This slide highlights increasing trend for streaming analytics which helps in driving real time data insights for businesses. It provides information regarding market size, user segments, operational efficiency, customer experience, monitoring complex data etc.
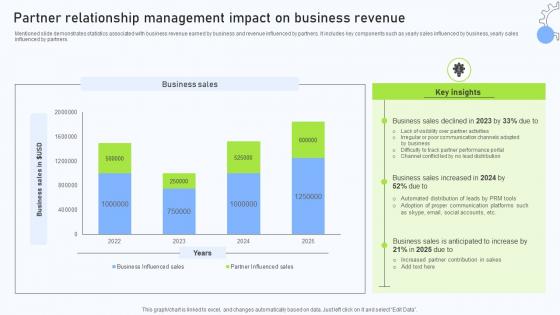
Relationship Management Automation Partner Relationship Management Impact
Mentioned slide demonstrates statistics associated with business revenue earned by business and revenue influenced by partners. It includes key components such as yearly sales influenced by business, yearly sales influenced by partners. Presenting this PowerPoint presentation, titled Relationship Management Automation Partner Relationship Management Impact, with topics curated by our researchers after extensive research. This editable presentation is available for immediate download and provides attractive features when used. Download now and captivate your audience. Presenting this Relationship Management Automation Partner Relationship Management Impact. Our researchers have carefully researched and created these slides with all aspects taken into consideration. This is a completely customizable Relationship Management Automation Partner Relationship Management Impact that is available for immediate downloading. Download now and make an impact on your audience. Highlight the attractive features available with our PPTs. Mentioned slide demonstrates statistics associated with business revenue earned by business and revenue influenced by partners. It includes key components such as yearly sales influenced by business, yearly sales influenced by partners.
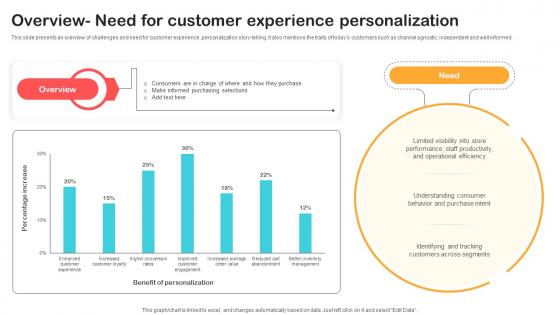
Overview Need For Customer Experience Personalization Optimizing Retail Operations With Digital DT SS V
This slide presents an overview of challenges and need for customer experience ,personalization story-telling. It also mentions the traits of todays customers such as channel agnostic, independent and well informed.Make sure to capture your audiences attention in your business displays with our gratis customizable Overview Need For Customer Experience Personalization Optimizing Retail Operations With Digital DT SS V. These are great for business strategies, office conferences, capital raising or task suggestions. If you desire to acquire more customers for your tech business and ensure they stay satisfied, create your own sales presentation with these plain slides. This slide presents an overview of challenges and need for customer experience ,personalization story-telling. It also mentions the traits of todays customers such as channel agnostic, independent and well informed.
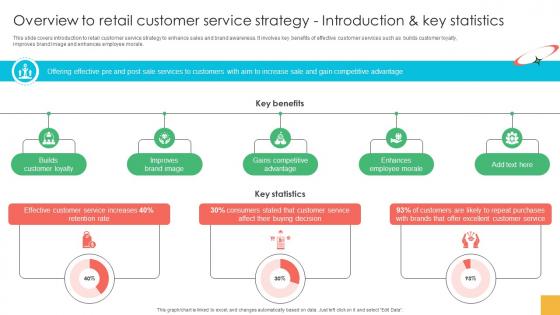
Marketing Strategies For Effective Overview To Retail Customer Service Strategy
This slide covers introduction to retail customer service strategy to enhance sales and brand awareness. It involves key benefits of effective customer services such as builds customer loyalty,improves brand image and enhances employee morale. Presenting this PowerPoint presentation, titled Marketing Strategies For Effective Overview To Retail Customer Service Strategy, with topics curated by our researchers after extensive research. This editable presentation is available for immediate download and provides attractive features when used. Download now and captivate your audience. Presenting this Marketing Strategies For Effective Overview To Retail Customer Service Strategy. Our researchers have carefully researched and created these slides with all aspects taken into consideration. This is a completely customizable Marketing Strategies For Effective Overview To Retail Customer Service Strategy that is available for immediate downloading. Download now and make an impact on your audience. Highlight the attractive features available with our PPTs. This slide covers introduction to retail customer service strategy to enhance sales and brand awareness. It involves key benefits of effective customer services such as builds customer loyalty,improves brand image and enhances employee morale.
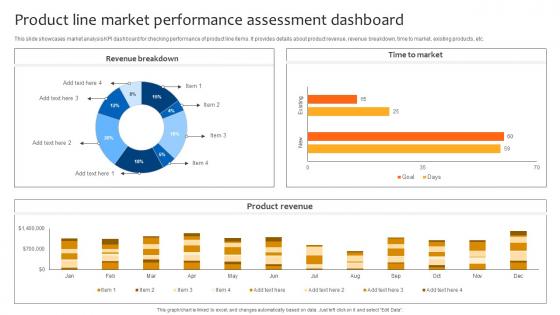
Deploying Strategies For Business Product Line Market Performance Assessment Dashboard Strategy SS V
This slide showcases market analysis KPI dashboard for checking performance of product line items. It provides details about product revenue, revenue breakdown, time to market, existing products, etc. Take your projects to the next level with our ultimate collection of Deploying Strategies For Business Product Line Market Performance Assessment Dashboard Strategy SS V. Slidegeeks has designed a range of layouts that are perfect for representing task or activity duration, keeping track of all your deadlines at a glance. Tailor these designs to your exact needs and give them a truly corporate look with your own brand colors they will make your projects stand out from the rest This slide showcases market analysis KPI dashboard for checking performance of product line items. It provides details about product revenue, revenue breakdown, time to market, existing products, etc.
Unlocking Potential IoTs Application Dashboard For Tracking IoT Devices Performance IoT SS V
This slide provides a dashboard for monitoring IoT devices that enhance agricultural practices. It incorporates IoT sensors to measure water tank capacity, Live crop monitoring, temperature and humidity measurements, control sprinklers, etc. Make sure to capture your audiences attention in your business displays with our gratis customizable Unlocking Potential IoTs Application Dashboard For Tracking IoT Devices Performance IoT SS V. These are great for business strategies, office conferences, capital raising or task suggestions. If you desire to acquire more customers for your tech business and ensure they stay satisfied, create your own sales presentation with these plain slides. This slide provides a dashboard for monitoring IoT devices that enhance agricultural practices. It incorporates IoT sensors to measure water tank capacity, Live crop monitoring, temperature and humidity measurements, control sprinklers, etc.
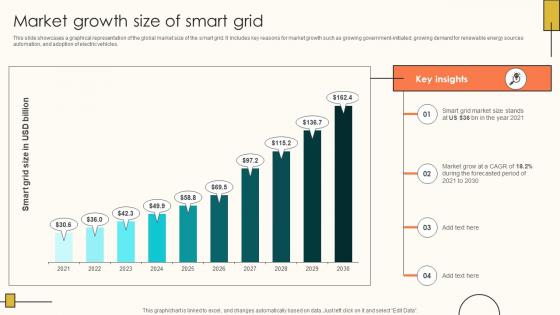
Market Growth Size Of Smart Grid Internet Of Things Solutions To Enhance Energy IoT SS V
This slide showcases a graphical representation of the global market size of the smart grid. It Includes key reasons for market growth such as growing government-initiated, growing demand for renewable energy sources automation, and adoption of electric vehicles. Take your projects to the next level with our ultimate collection of Market Growth Size Of Smart Grid Internet Of Things Solutions To Enhance Energy IoT SS V. Slidegeeks has designed a range of layouts that are perfect for representing task or activity duration, keeping track of all your deadlines at a glance. Tailor these designs to your exact needs and give them a truly corporate look with your own brand colors they will make your projects stand out from the rest This slide showcases a graphical representation of the global market size of the smart grid. It Includes key reasons for market growth such as growing government-initiated, growing demand for renewable energy sources automation, and adoption of electric vehicles.
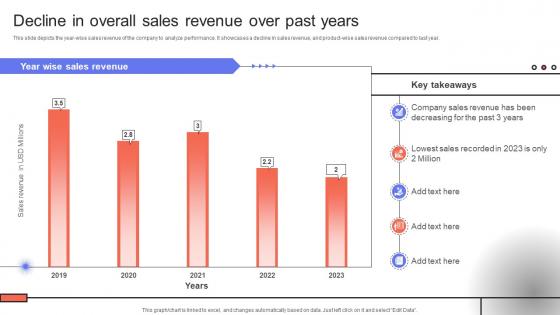
Trade Event Tactics To Boost Decline In Overall Sales Revenue Over Past Years SA SS V
This slide depicts the year-wise sales revenue of the company to analyze performance. It showcases a decline in sales revenue, and product-wise sales revenue compared to last year. Do you have an important presentation coming up Are you looking for something that will make your presentation stand out from the rest Look no further than Trade Event Tactics To Boost Decline In Overall Sales Revenue Over Past Years SA SS V. With our professional designs, you can trust that your presentation will pop and make delivering it a smooth process. And with Slidegeeks, you can trust that your presentation will be unique and memorable. So why wait Grab Trade Event Tactics To Boost Decline In Overall Sales Revenue Over Past Years SA SS V today and make your presentation stand out from the rest This slide depicts the year-wise sales revenue of the company to analyze performance. It showcases a decline in sales revenue, and product-wise sales revenue compared to last year.

Trade Event Tactics To Boost Sales Introduction To Sales Networking Sources To Increase SA SS V
This slide exhibits an overview of lead generation and sales networking expansion channels to attain new customers, including trade shows, exhibitions, referrals, industry events, etc. Do you have an important presentation coming up Are you looking for something that will make your presentation stand out from the rest Look no further than Trade Event Tactics To Boost Sales Introduction To Sales Networking Sources To Increase SA SS V. With our professional designs, you can trust that your presentation will pop and make delivering it a smooth process. And with Slidegeeks, you can trust that your presentation will be unique and memorable. So why wait Grab Trade Event Tactics To Boost Sales Introduction To Sales Networking Sources To Increase SA SS V today and make your presentation stand out from the rest This slide exhibits an overview of lead generation and sales networking expansion channels to attain new customers, including trade shows, exhibitions, referrals, industry events, etc.
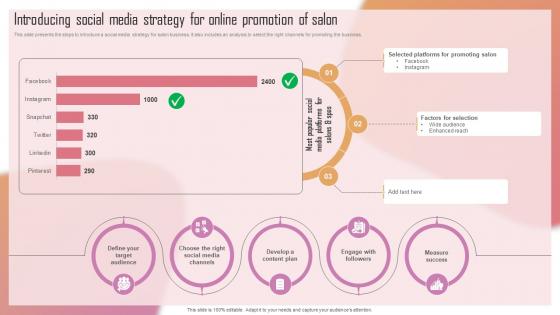
Customizing The Salon Experience Introducing Social Media Strategy For Online Promotion Strategy SS V
This slide presents the steps to introduce a social media strategy for salon business. It also includes an analysis to select the right channels for promoting the business. Take your projects to the next level with our ultimate collection of Customizing The Salon Experience Introducing Social Media Strategy For Online Promotion Strategy SS V. Slidegeeks has designed a range of layouts that are perfect for representing task or activity duration, keeping track of all your deadlines at a glance. Tailor these designs to your exact needs and give them a truly corporate look with your own brand colors they will make your projects stand out from the rest This slide presents the steps to introduce a social media strategy for salon business. It also includes an analysis to select the right channels for promoting the business.
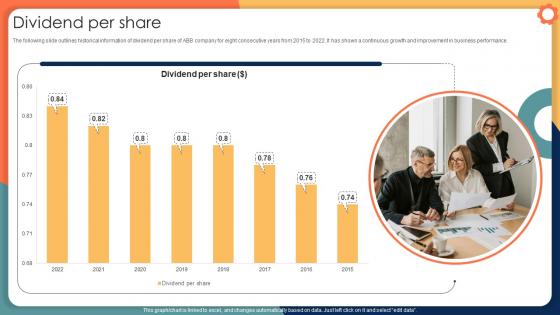
Dividend Per Share Engineering Solution Provider Company Profile CP SS V
The following slide outlines historical information of dividend per share of ABB company for eight consecutive years from 2015 to 2022. It has shown a continuous growth and improvement in business performance. Do you have an important presentation coming up Are you looking for something that will make your presentation stand out from the rest Look no further than Dividend Per Share Engineering Solution Provider Company Profile CP SS V. With our professional designs, you can trust that your presentation will pop and make delivering it a smooth process. And with Slidegeeks, you can trust that your presentation will be unique and memorable. So why wait Grab Dividend Per Share Engineering Solution Provider Company Profile CP SS V today and make your presentation stand out from the rest The following slide outlines historical information of dividend per share of ABB company for eight consecutive years from 2015 to 2022. It has shown a continuous growth and improvement in business performance.
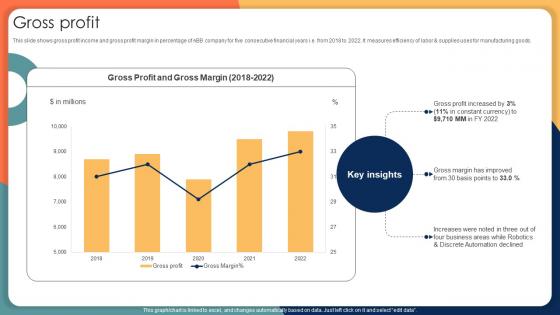
Gross Profit Engineering Solution Provider Company Profile CP SS V
This slide shows gross profit income and gross profit margin in percentage of ABB company for five consecutive financial years i.e. from 2018 to 2022. It measures efficiency of labor and supplies uses for manufacturing goods. Make sure to capture your audiences attention in your business displays with our gratis customizable Gross Profit Engineering Solution Provider Company Profile CP SS V. These are great for business strategies, office conferences, capital raising or task suggestions. If you desire to acquire more customers for your tech business and ensure they stay satisfied, create your own sales presentation with these plain slides. This slide shows gross profit income and gross profit margin in percentage of ABB company for five consecutive financial years i.e. from 2018 to 2022. It measures efficiency of labor and supplies uses for manufacturing goods.
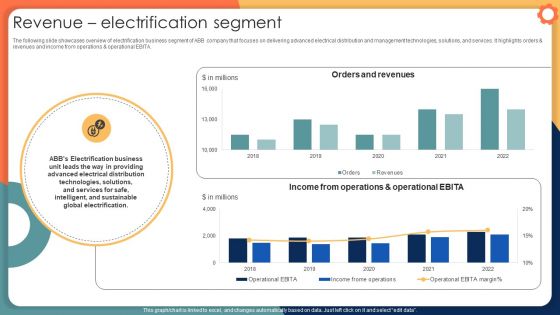
Revenue Electrification Segment Engineering Solution Provider Company Profile CP SS V
The following slide showcases overview of electrification business segment of ABB company that focuses on delivering advanced electrical distribution and management technologies, solutions, and services. It highlights orders and revenues and income from operations and operational EBITA. Presenting this PowerPoint presentation, titled Revenue Electrification Segment Engineering Solution Provider Company Profile CP SS V, with topics curated by our researchers after extensive research. This editable presentation is available for immediate download and provides attractive features when used. Download now and captivate your audience. Presenting this Revenue Electrification Segment Engineering Solution Provider Company Profile CP SS V. Our researchers have carefully researched and created these slides with all aspects taken into consideration. This is a completely customizable Revenue Electrification Segment Engineering Solution Provider Company Profile CP SS V that is available for immediate downloading. Download now and make an impact on your audience. Highlight the attractive features available with our PPTs. The following slide showcases overview of electrification business segment of ABB company that focuses on delivering advanced electrical distribution and management technologies, solutions, and services. It highlights orders and revenues and income from operations and operational EBITA.
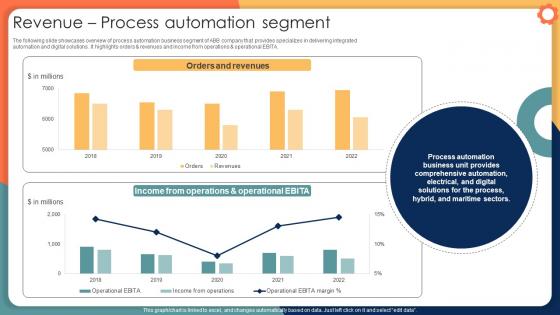
Revenue Process Automation Segment Engineering Solution Provider Company Profile CP SS V
The following slide showcases overview of process automation business segment of ABB company that provides specializes in delivering integrated automation and digital solutions . It highlights orders and revenues and income from operations and operational EBITA. This Revenue Process Automation Segment Engineering Solution Provider Company Profile CP SS V from Slidegeeks makes it easy to present information on your topic with precision. It provides customization options, so you can make changes to the colors, design, graphics, or any other component to create a unique layout. It is also available for immediate download, so you can begin using it right away. Slidegeeks has done good research to ensure that you have everything you need to make your presentation stand out. Make a name out there for a brilliant performance. The following slide showcases overview of process automation business segment of ABB company that provides specializes in delivering integrated automation and digital solutions . It highlights orders and revenues and income from operations and operational EBITA.
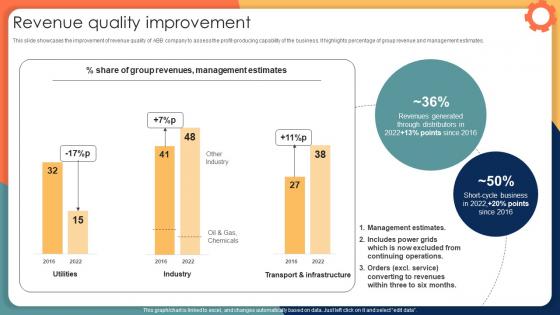
Revenue Quality Improvement Engineering Solution Provider Company Profile CP SS V
This slide showcases the improvement of revenue quality of ABB company to assess the profit-producing capability of the business. It highlights percentage of group revenue and management estimates. Take your projects to the next level with our ultimate collection of Revenue Quality Improvement Engineering Solution Provider Company Profile CP SS V. Slidegeeks has designed a range of layouts that are perfect for representing task or activity duration, keeping track of all your deadlines at a glance. Tailor these designs to your exact needs and give them a truly corporate look with your own brand colors they will make your projects stand out from the rest This slide showcases the improvement of revenue quality of ABB company to assess the profit-producing capability of the business. It highlights percentage of group revenue and management estimates.
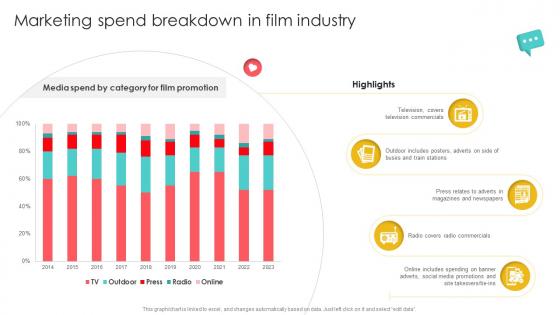
Marketing Channels For Movie Marketing Spend Breakdown In Film Industry Strategy SS V
This Marketing Channels For Movie Marketing Spend Breakdown In Film Industry Strategy SS V from Slidegeeks makes it easy to present information on your topic with precision. It provides customization options, so you can make changes to the colors, design, graphics, or any other component to create a unique layout. It is also available for immediate download, so you can begin using it right away. Slidegeeks has done good research to ensure that you have everything you need to make your presentation stand out. Make a name out there for a brilliant performance. Our Marketing Channels For Movie Marketing Spend Breakdown In Film Industry Strategy SS V are topically designed to provide an attractive backdrop to any subject. Use them to look like a presentation pro.
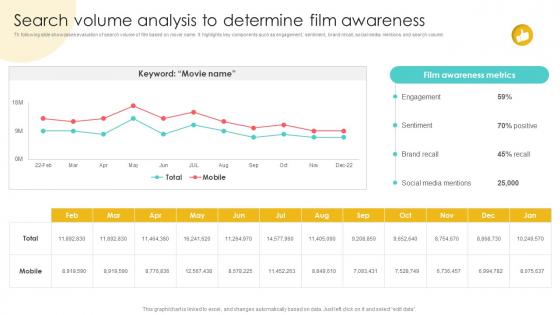
Marketing Channels For Movie Search Volume Analysis To Determine Film Awareness Strategy SS V
Th following slide showcases evaluation of search volume of film based on movie name. It highlights key components such as engagement, sentiment, brand recall, social media mentions and search volume. Do you have an important presentation coming up Are you looking for something that will make your presentation stand out from the rest Look no further than Marketing Channels For Movie Search Volume Analysis To Determine Film Awareness Strategy SS V. With our professional designs, you can trust that your presentation will pop and make delivering it a smooth process. And with Slidegeeks, you can trust that your presentation will be unique and memorable. So why wait Grab Marketing Channels For Movie Search Volume Analysis To Determine Film Awareness Strategy SS V today and make your presentation stand out from the rest Th following slide showcases evaluation of search volume of film based on movie name. It highlights key components such as engagement, sentiment, brand recall, social media mentions and search volume.
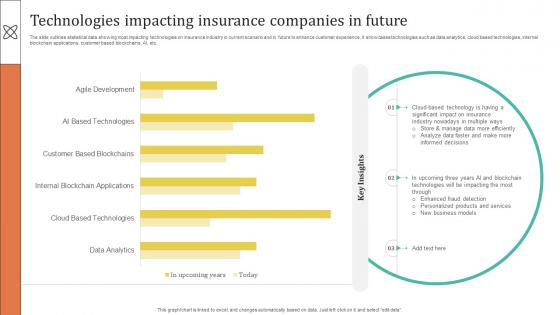
Improving Customer Satisfaction Technologies Impacting Insurance Companies In Future
The slide outlines statistical data showing most impacting technologies on insurance industry in current scenario and in future to enhance customer experience, It showcases technologies such as data analytics, cloud based technologies, internal blockchain applications, customer based blockchains, AI, etc. Make sure to capture your audiences attention in your business displays with our gratis customizable Improving Customer Satisfaction Technologies Impacting Insurance Companies In Future. These are great for business strategies, office conferences, capital raising or task suggestions. If you desire to acquire more customers for your tech business and ensure they stay satisfied, create your own sales presentation with these plain slides. The slide outlines statistical data showing most impacting technologies on insurance industry in current scenario and in future to enhance customer experience, It showcases technologies such as data analytics, cloud based technologies, internal blockchain applications, customer based blockchains, AI, etc.
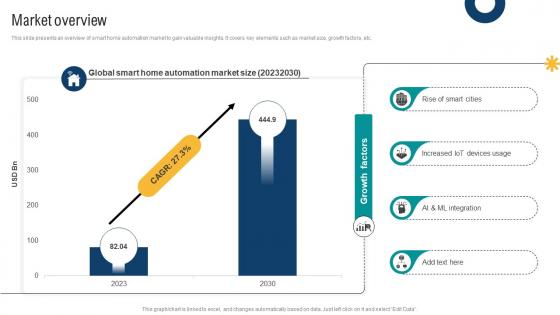
Market Overview Smart Home Startup GTM Strategy GTM SS V
This slide presents an overview of smart home automation market to gain valuable insights. It covers key elements such as market size, growth factors, etc.Do you have an important presentation coming up Are you looking for something that will make your presentation stand out from the rest Look no further than Market Overview Smart Home Startup GTM Strategy GTM SS V. With our professional designs, you can trust that your presentation will pop and make delivering it a smooth process. And with Slidegeeks, you can trust that your presentation will be unique and memorable. So why wait Grab Market Overview Smart Home Startup GTM Strategy GTM SS V today and make your presentation stand out from the rest This slide presents an overview of smart home automation market to gain valuable insights. It covers key elements such as market size, growth factors, etc.
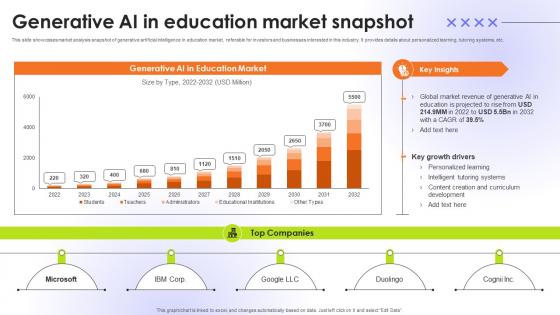
Generative AI In Education Market Snapshot Educational Transformation Through AI SS V
This slide showcases market analysis snapshot of generative artificial intelligence in education market, referable for investors and businesses interested in this industry. It provides details about personalized learning, tutoring systems, etc. Take your projects to the next level with our ultimate collection of Generative AI In Education Market Snapshot Educational Transformation Through AI SS V. Slidegeeks has designed a range of layouts that are perfect for representing task or activity duration, keeping track of all your deadlines at a glance. Tailor these designs to your exact needs and give them a truly corporate look with your own brand colors they will make your projects stand out from the rest This slide showcases market analysis snapshot of generative artificial intelligence in education market, referable for investors and businesses interested in this industry. It provides details about personalized learning, tutoring systems, etc.
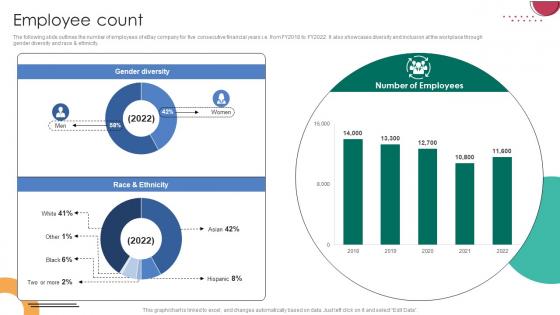
Employee Count C2C Ecommerce Platform Company Profile CP SS V
The following slide outlines the number of employees of eBay company for five consecutive financial years i.e. from FY2018 to FY2022. It also showcases diversity and inclusion at the workplace through gender diversity and race and ethnicity.Do you have an important presentation coming up Are you looking for something that will make your presentation stand out from the rest Look no further than Employee Count C2C Ecommerce Platform Company Profile CP SS V. With our professional designs, you can trust that your presentation will pop and make delivering it a smooth process. And with Slidegeeks, you can trust that your presentation will be unique and memorable. So why wait Grab Employee Count C2C Ecommerce Platform Company Profile CP SS V today and make your presentation stand out from the rest The following slide outlines the number of employees of eBay company for five consecutive financial years i.e. from FY2018 to FY2022. It also showcases diversity and inclusion at the workplace through gender diversity and race and ethnicity.
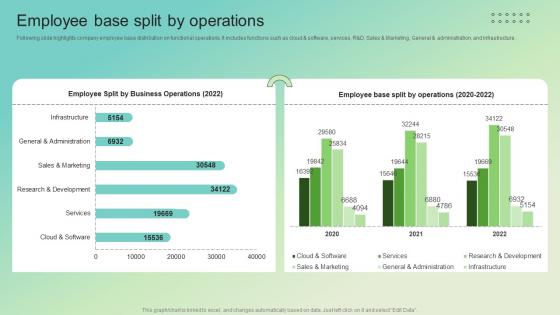
Employee Base Split By Operations Enterprise Software Solution Providing Company Profile CP SS V
Following slide highlights company employee base distribution on functional operations. It includes functions such as cloud and software, services, RandD, Sales and Marketing, General and administration, and infrastructure. Make sure to capture your audiences attention in your business displays with our gratis customizable Employee Base Split By Operations Enterprise Software Solution Providing Company Profile CP SS V. These are great for business strategies, office conferences, capital raising or task suggestions. If you desire to acquire more customers for your tech business and ensure they stay satisfied, create your own sales presentation with these plain slides. Following slide highlights company employee base distribution on functional operations. It includes functions such as cloud and software, services, RandD, Sales and Marketing, General and administration, and infrastructure.
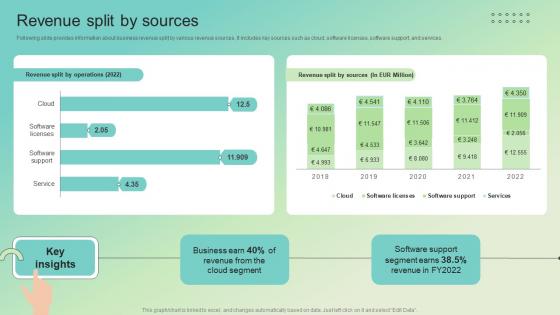
Revenue Split By Sources Enterprise Software Solution Providing Company Profile CP SS V
Following slide provides information about business revenue split by various revenue sources, It includes key sources such as cloud, software licenses, software support, and services.Do you have an important presentation coming up Are you looking for something that will make your presentation stand out from the rest Look no further than Revenue Split By Sources Enterprise Software Solution Providing Company Profile CP SS V. With our professional designs, you can trust that your presentation will pop and make delivering it a smooth process. And with Slidegeeks, you can trust that your presentation will be unique and memorable. So why wait Grab Revenue Split By Sources Enterprise Software Solution Providing Company Profile CP SS V today and make your presentation stand out from the rest Following slide provides information about business revenue split by various revenue sources, It includes key sources such as cloud, software licenses, software support, and services.
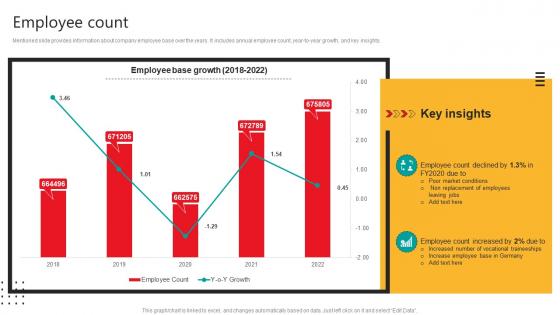
Employee Count Automobile Development Company Profile CP SS V
Mentioned slide provides information about company employee base over the years. It includes annual employee count, year-to-year growth, and key insights.Do you have an important presentation coming up Are you looking for something that will make your presentation stand out from the rest Look no further than Employee Count Automobile Development Company Profile CP SS V. With our professional designs, you can trust that your presentation will pop and make delivering it a smooth process. And with Slidegeeks, you can trust that your presentation will be unique and memorable. So why wait Grab Employee Count Automobile Development Company Profile CP SS V today and make your presentation stand out from the rest Mentioned slide provides information about company employee base over the years. It includes annual employee count, year-to-year growth, and key insights.
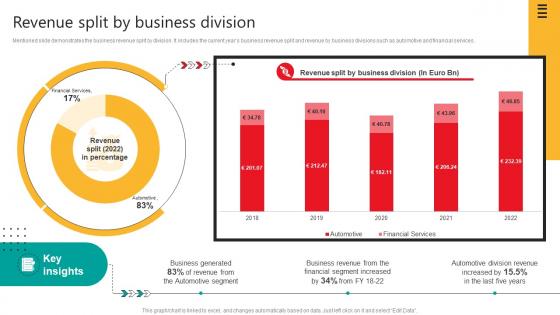
Revenue Split By Business Division Automobile Development Company Profile CP SS V
Mentioned slide demonstrates the business revenue split by division. It includes the current years business revenue split and revenue by business divisions such as automotive and financial services.Take your projects to the next level with our ultimate collection of Revenue Split By Business Division Automobile Development Company Profile CP SS V. Slidegeeks has designed a range of layouts that are perfect for representing task or activity duration, keeping track of all your deadlines at a glance. Tailor these designs to your exact needs and give them a truly corporate look with your own brand colors they will make your projects stand out from the rest Mentioned slide demonstrates the business revenue split by division. It includes the current years business revenue split and revenue by business divisions such as automotive and financial services.
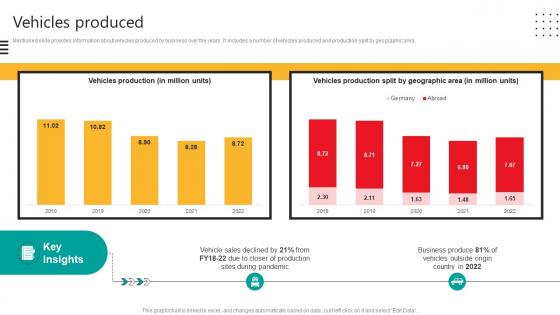
Vehicles Produced Automobile Development Company Profile CP SS V
Mentioned slide provides information about vehicles produced by business over the years. It includes a number of vehicles produced and production split by geographic area.Do you have an important presentation coming up Are you looking for something that will make your presentation stand out from the rest Look no further than Vehicles Produced Automobile Development Company Profile CP SS V. With our professional designs, you can trust that your presentation will pop and make delivering it a smooth process. And with Slidegeeks, you can trust that your presentation will be unique and memorable. So why wait Grab Vehicles Produced Automobile Development Company Profile CP SS V today and make your presentation stand out from the rest Mentioned slide provides information about vehicles produced by business over the years. It includes a number of vehicles produced and production split by geographic area.
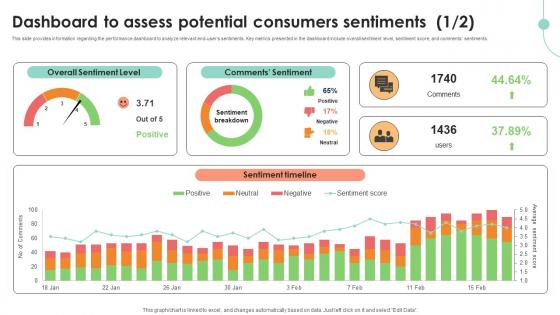
Dashboard To Assess Potential Consumers Decoding User Emotions In Depth Exploration AI SS V
This slide provides information regarding the performance dashboard to analyze relevant end-users sentiments. Key metrics presented in the dashboard include overall sentiment level, sentiment score, and comments sentiments. Do you have an important presentation coming up Are you looking for something that will make your presentation stand out from the rest Look no further than Dashboard To Assess Potential Consumers Decoding User Emotions In Depth Exploration AI SS V. With our professional designs, you can trust that your presentation will pop and make delivering it a smooth process. And with Slidegeeks, you can trust that your presentation will be unique and memorable. So why wait Grab Dashboard To Assess Potential Consumers Decoding User Emotions In Depth Exploration AI SS V today and make your presentation stand out from the rest This slide provides information regarding the performance dashboard to analyze relevant end-users sentiments. Key metrics presented in the dashboard include overall sentiment level, sentiment score, and comments sentiments.
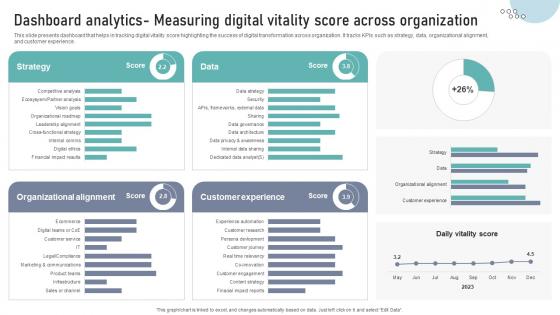
Dashboard Analytics Measuring Digital Vitality Score Across Organization DT SS V
This slide presents dashboard that helps in tracking digital vitality score highlighting the success of digital transformation across organization. It tracks KPIs such as strategy, data, organizational alignment,and customer experience.Make sure to capture your audiences attention in your business displays with our gratis customizable Dashboard Analytics Measuring Digital Vitality Score Across Organization DT SS V. These are great for business strategies, office conferences, capital raising or task suggestions. If you desire to acquire more customers for your tech business and ensure they stay satisfied, create your own sales presentation with these plain slides. This slide presents dashboard that helps in tracking digital vitality score highlighting the success of digital transformation across organization. It tracks KPIs such as strategy, data, organizational alignment,and customer experience.
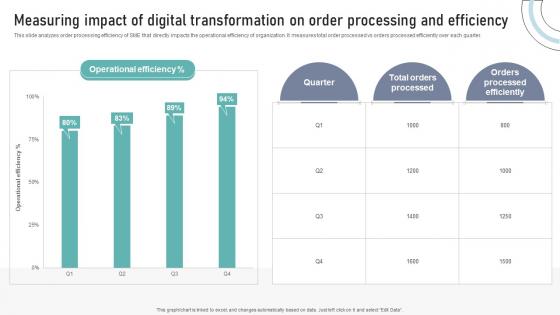
Measuring Impact Of Digital Transformation On Order Processing And Efficiency DT SS V
This slide analyzes order processing efficiency of SME that directly impacts the operational efficiency of organization. It measures total order processed vs orders processed efficiently over each quarter.Do you have an important presentation coming up Are you looking for something that will make your presentation stand out from the rest Look no further than Measuring Impact Of Digital Transformation On Order Processing And Efficiency DT SS V. With our professional designs, you can trust that your presentation will pop and make delivering it a smooth process. And with Slidegeeks, you can trust that your presentation will be unique and memorable. So why wait Grab Measuring Impact Of Digital Transformation On Order Processing And Efficiency DT SS V today and make your presentation stand out from the rest This slide analyzes order processing efficiency of SME that directly impacts the operational efficiency of organization. It measures total order processed vs orders processed efficiently over each quarter.
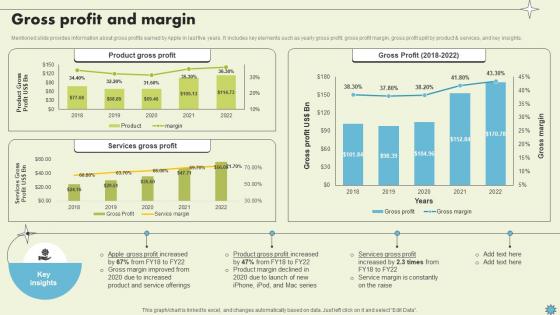
Gross Profit And Margin Consumer Electronics Company Profile CP SS V
Mentioned slide provides information about gross profits earned by Apple in last five years. It includes key elements such as yearly gross profit, gross profit margin, gross profit split by product and services, and key insights.Take your projects to the next level with our ultimate collection of Gross Profit And Margin Consumer Electronics Company Profile CP SS V. Slidegeeks has designed a range of layouts that are perfect for representing task or activity duration, keeping track of all your deadlines at a glance. Tailor these designs to your exact needs and give them a truly corporate look with your own brand colors they will make your projects stand out from the rest Mentioned slide provides information about gross profits earned by Apple in last five years. It includes key elements such as yearly gross profit, gross profit margin, gross profit split by product and services, and key insights.
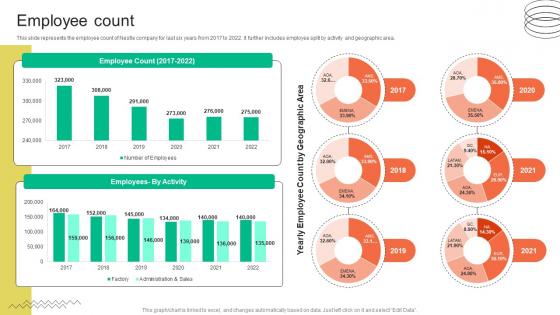
Employee Count FMCG Provider Company Profile CP SS V
This slide represents the employee count of Nestle company for last six years from 2017 to 2022. It further includes employee split by activity and geographic area. Do you have an important presentation coming up Are you looking for something that will make your presentation stand out from the rest Look no further than Employee Count FMCG Provider Company Profile CP SS V. With our professional designs, you can trust that your presentation will pop and make delivering it a smooth process. And with Slidegeeks, you can trust that your presentation will be unique and memorable. So why wait Grab Employee Count FMCG Provider Company Profile CP SS V today and make your presentation stand out from the rest This slide represents the employee count of Nestle company for last six years from 2017 to 2022. It further includes employee split by activity and geographic area.
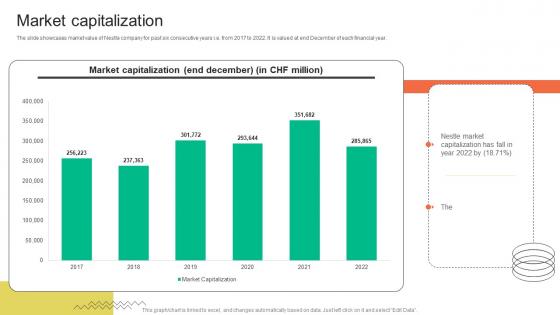
Market Capitalization FMCG Provider Company Profile CP SS V
The slide showcases market value of Nestle company for past six consecutive years i.e. from 2017 to 2022. It is valued at end December of each financial year. Make sure to capture your audiences attention in your business displays with our gratis customizable Market Capitalization FMCG Provider Company Profile CP SS V. These are great for business strategies, office conferences, capital raising or task suggestions. If you desire to acquire more customers for your tech business and ensure they stay satisfied, create your own sales presentation with these plain slides. The slide showcases market value of Nestle company for past six consecutive years i.e. from 2017 to 2022. It is valued at end December of each financial year.
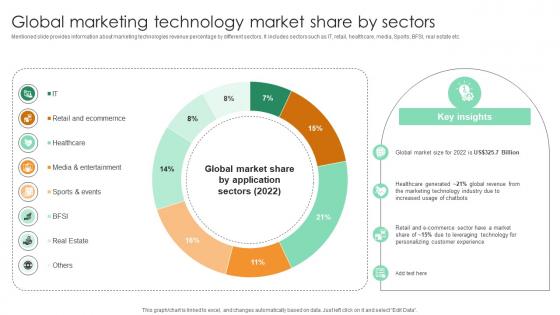
Global Marketing Technology Market Share By Sectors Comprehensive Guide For Marketing Technology
Mentioned slide provides information about marketing technologies revenue percentage by different sectors. It includes sectors such as IT, retail, healthcare, media, Sports, BFSI, real estate etc. This Global Marketing Technology Market Share By Sectors Comprehensive Guide For Marketing Technology from Slidegeeks makes it easy to present information on your topic with precision. It provides customization options, so you can make changes to the colors, design, graphics, or any other component to create a unique layout. It is also available for immediate download, so you can begin using it right away. Slidegeeks has done good research to ensure that you have everything you need to make your presentation stand out. Make a name out there for a brilliant performance. Mentioned slide provides information about marketing technologies revenue percentage by different sectors. It includes sectors such as IT, retail, healthcare, media, Sports, BFSI, real estate etc.
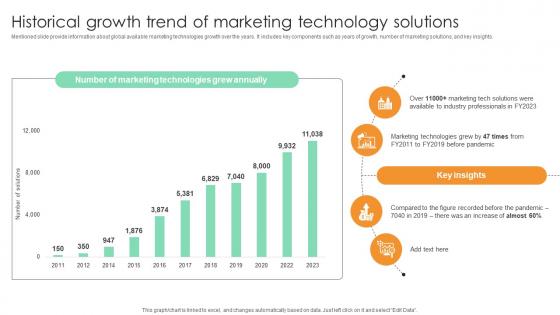
Historical Growth Trend Of Marketing Technology Comprehensive Guide For Marketing Technology
Mentioned slide provide information about global available marketing technologies growth over the years. It includes key components such as years of growth, number of marketing solutions, and key insights. Take your projects to the next level with our ultimate collection of Historical Growth Trend Of Marketing Technology Comprehensive Guide For Marketing Technology. Slidegeeks has designed a range of layouts that are perfect for representing task or activity duration, keeping track of all your deadlines at a glance. Tailor these designs to your exact needs and give them a truly corporate look with your own brand colors they will make your projects stand out from the rest Mentioned slide provide information about global available marketing technologies growth over the years. It includes key components such as years of growth, number of marketing solutions, and key insights.

Key Components Of Credit Score For Card Approval Swipe Smartly A Practical Guide Fin SS V
This slide shows details about various components included in credit score which can be used by individuals to get more understanding about it. These components are payment history, credit utilization, length of credit history, etc. Presenting this PowerPoint presentation, titled Key Components Of Credit Score For Card Approval Swipe Smartly A Practical Guide Fin SS V, with topics curated by our researchers after extensive research. This editable presentation is available for immediate download and provides attractive features when used. Download now and captivate your audience. Presenting this Key Components Of Credit Score For Card Approval Swipe Smartly A Practical Guide Fin SS V. Our researchers have carefully researched and created these slides with all aspects taken into consideration. This is a completely customizable Key Components Of Credit Score For Card Approval Swipe Smartly A Practical Guide Fin SS V that is available for immediate downloading. Download now and make an impact on your audience. Highlight the attractive features available with our PPTs. This slide shows details about various components included in credit score which can be used by individuals to get more understanding about it. These components are payment history, credit utilization, length of credit history, etc.
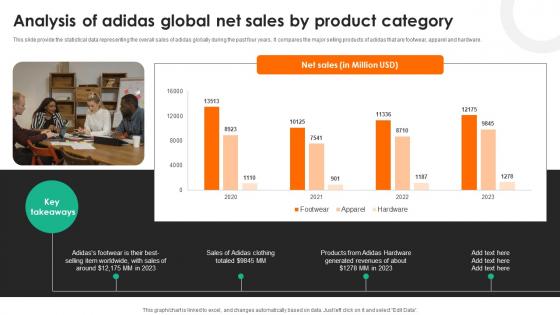
Evaluating Adidas Branding Analysis Of Adidas Global Net Sales By Product Category Strategy SS V
This slide provide the statistical data representing the overall sales of Adidas globally during the past four years. It compares the major selling products of Adidas that are footwear, apparel and hardware. Make sure to capture your audiences attention in your business displays with our gratis customizable Evaluating Adidas Branding Analysis Of Adidas Global Net Sales By Product Category Strategy SS V. These are great for business strategies, office conferences, capital raising or task suggestions. If you desire to acquire more customers for your tech business and ensure they stay satisfied, create your own sales presentation with these plain slides. This slide provide the statistical data representing the overall sales of Adidas globally during the past four years. It compares the major selling products of Adidas that are footwear, apparel and hardware.
Dashboard Analysis For Tracking Agricultural Tasks Adopting Sustainable Farming Techniques
This slide showcases the KPIs that would help to track the improvements with adoption of new sustainable agriculture practices. It includes current tasks, crops, harvest, todays weather, summary, etc. Take your projects to the next level with our ultimate collection of Dashboard Analysis For Tracking Agricultural Tasks Adopting Sustainable Farming Techniques. Slidegeeks has designed a range of layouts that are perfect for representing task or activity duration, keeping track of all your deadlines at a glance. Tailor these designs to your exact needs and give them a truly corporate look with your own brand colors they will make your projects stand out from the rest This slide showcases the KPIs that would help to track the improvements with adoption of new sustainable agriculture practices. It includes current tasks, crops, harvest, todays weather, summary, etc.
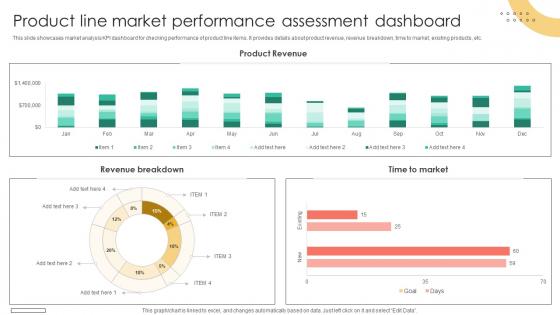
Brand Extension Techniques Product Line Market Performance Assessment Dashboard Strategy SS V
This slide showcases market analysis KPI dashboard for checking performance of product line items. It provides details about product revenue, revenue breakdown, time to market, existing products, etc. This Brand Extension Techniques Product Line Market Performance Assessment Dashboard Strategy SS V from Slidegeeks makes it easy to present information on your topic with precision. It provides customization options, so you can make changes to the colors, design, graphics, or any other component to create a unique layout. It is also available for immediate download, so you can begin using it right away. Slidegeeks has done good research to ensure that you have everything you need to make your presentation stand out. Make a name out there for a brilliant performance. This slide showcases market analysis KPI dashboard for checking performance of product line items. It provides details about product revenue, revenue breakdown, time to market, existing products, etc.

Global Telemedicine Market Segmentation Analysis Remote Healthcare Services IR SS V
This slide represents the market segmentation analysis by type, component, and application for the year 2022. It includes tele-hospital, tele-home, product, service, telepathology, teleradiology, etc. Do you have an important presentation coming up Are you looking for something that will make your presentation stand out from the rest Look no further than Global Telemedicine Market Segmentation Analysis Remote Healthcare Services IR SS V. With our professional designs, you can trust that your presentation will pop and make delivering it a smooth process. And with Slidegeeks, you can trust that your presentation will be unique and memorable. So why wait Grab Global Telemedicine Market Segmentation Analysis Remote Healthcare Services IR SS V today and make your presentation stand out from the rest This slide represents the market segmentation analysis by type, component, and application for the year 2022. It includes tele-hospital, tele-home, product, service, telepathology, teleradiology, etc.
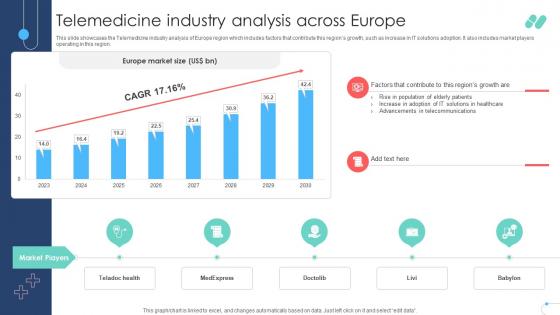
Telemedicine Industry Analysis Across Europe Remote Healthcare Services IR SS V
This slide showcases the Telemedicine industry analysis of Europe region which includes factors that contribute this regions growth, such as increase in IT solutions adoption. It also includes market players operating in this region. This Telemedicine Industry Analysis Across Europe Remote Healthcare Services IR SS V from Slidegeeks makes it easy to present information on your topic with precision. It provides customization options, so you can make changes to the colors, design, graphics, or any other component to create a unique layout. It is also available for immediate download, so you can begin using it right away. Slidegeeks has done good research to ensure that you have everything you need to make your presentation stand out. Make a name out there for a brilliant performance. This slide showcases the Telemedicine industry analysis of Europe region which includes factors that contribute this regions growth, such as increase in IT solutions adoption. It also includes market players operating in this region.

Telemedicine Industry Analysis Across Latin America Remote Healthcare Services IR SS V
This slide showcases the Telemedicine industry analysis of Latin America region which includes factors that contribute this regions growth such as increasing aging population. It also includes market players operating in this region. Take your projects to the next level with our ultimate collection of Telemedicine Industry Analysis Across Latin America Remote Healthcare Services IR SS V. Slidegeeks has designed a range of layouts that are perfect for representing task or activity duration, keeping track of all your deadlines at a glance. Tailor these designs to your exact needs and give them a truly corporate look with your own brand colors they will make your projects stand out from the rest This slide showcases the Telemedicine industry analysis of Latin America region which includes factors that contribute this regions growth such as increasing aging population. It also includes market players operating in this region.
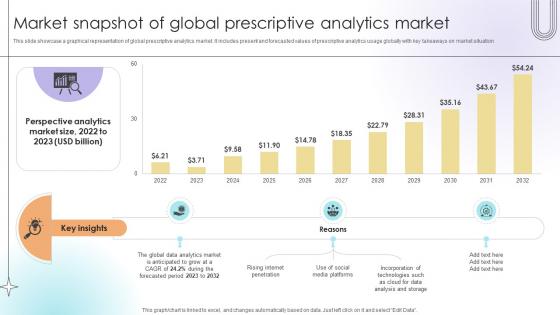
Market Snapshot Of Global Prescriptive Analytics Market Data Analytics SS V
This slide showcase a graphical representation of global prescriptive analytics market. It includes present and forecasted values of prescriptive analytics usage globally with key takeaways on market situation.Make sure to capture your audiences attention in your business displays with our gratis customizable Market Snapshot Of Global Prescriptive Analytics Market Data Analytics SS V. These are great for business strategies, office conferences, capital raising or task suggestions. If you desire to acquire more customers for your tech business and ensure they stay satisfied, create your own sales presentation with these plain slides. This slide showcase a graphical representation of global prescriptive analytics market. It includes present and forecasted values of prescriptive analytics usage globally with key takeaways on market situation.

Segmentation Of Global Prescriptive Analytics Market Data Analytics SS V
This slide provides an overview of market segmentation of prescriptive analytics at a global level. It covers segmentation analysis based on region, data type, component and deployment with key takeaways.Take your projects to the next level with our ultimate collection of Segmentation Of Global Prescriptive Analytics Market Data Analytics SS V. Slidegeeks has designed a range of layouts that are perfect for representing task or activity duration, keeping track of all your deadlines at a glance. Tailor these designs to your exact needs and give them a truly corporate look with your own brand colors they will make your projects stand out from the rest This slide provides an overview of market segmentation of prescriptive analytics at a global level. It covers segmentation analysis based on region, data type, component and deployment with key takeaways.
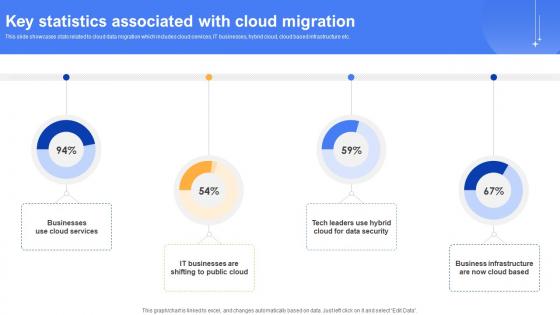
Effective Data Migration Key Statistics Associated With Cloud Migration
This slide showcases stats related to cloud data migration which includes cloud services, IT businesses, hybrid cloud, cloud based infrastructure etc. Presenting this PowerPoint presentation, titled Effective Data Migration Key Statistics Associated With Cloud Migration, with topics curated by our researchers after extensive research. This editable presentation is available for immediate download and provides attractive features when used. Download now and captivate your audience. Presenting this Effective Data Migration Key Statistics Associated With Cloud Migration. Our researchers have carefully researched and created these slides with all aspects taken into consideration. This is a completely customizable Effective Data Migration Key Statistics Associated With Cloud Migration that is available for immediate downloading. Download now and make an impact on your audience. Highlight the attractive features available with our PPTs. This slide showcases stats related to cloud data migration which includes cloud services, IT businesses, hybrid cloud, cloud based infrastructure etc.
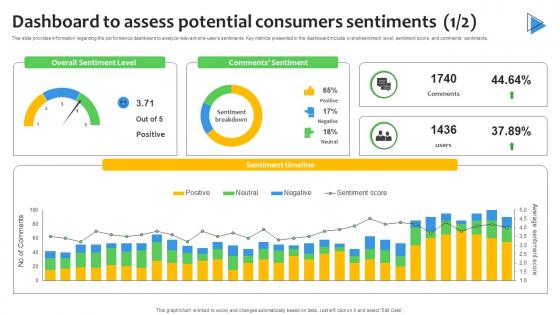
Dashboard To Assess Potential Consumers Sentiment Analysis Demystified Understanding AI SS V
This slide provides information regarding the performance dashboard to analyze relevant end-users sentiments. Key metrics presented in the dashboard include overall sentiment level, sentiment score, and comments sentiments. Do you have an important presentation coming up Are you looking for something that will make your presentation stand out from the rest Look no further than Dashboard To Assess Potential Consumers Sentiment Analysis Demystified Understanding AI SS V. With our professional designs, you can trust that your presentation will pop and make delivering it a smooth process. And with Slidegeeks, you can trust that your presentation will be unique and memorable. So why wait Grab Dashboard To Assess Potential Consumers Sentiment Analysis Demystified Understanding AI SS V today and make your presentation stand out from the rest This slide provides information regarding the performance dashboard to analyze relevant end-users sentiments. Key metrics presented in the dashboard include overall sentiment level, sentiment score, and comments sentiments.


 Continue with Email

 Home
Home


