Cost Chart

Stock Chart Ppt PowerPoint Presentation Layouts Outfit
This is a stock chart ppt powerpoint presentation layouts outfit. This is a two stage process. The stages in this process are close, high, volume, low, open.
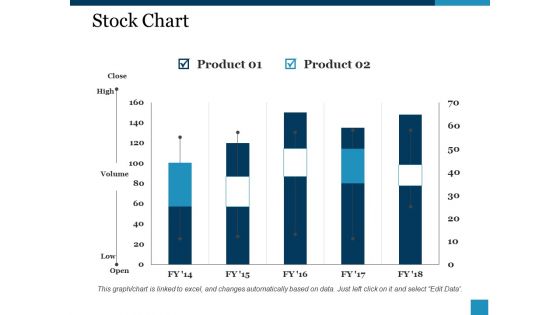
Stock Chart Ppt PowerPoint Presentation Guide
This is a stock chart ppt powerpoint presentation guide. This is a two stage process. The stages in this process are product, close, high, volume, low.
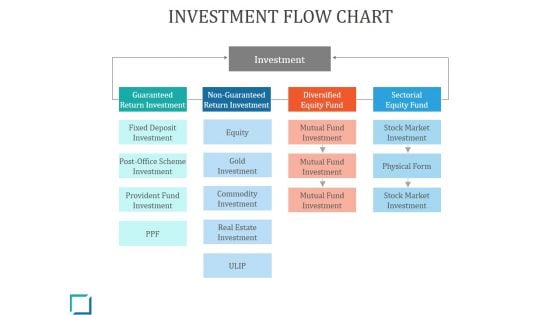
Investment Flow Chart Ppt PowerPoint Presentation Themes
This is a investment flow chart ppt powerpoint presentation themes. This is a five stage process. The stages in this process are investment, equity, gold investment, physical form, provident fund investment.
Stock Chart Ppt PowerPoint Presentation Icon Microsoft
This is a stock chart ppt powerpoint presentation icon microsoft. This is a five stage process. The stages in this process are product, high, volume, low.
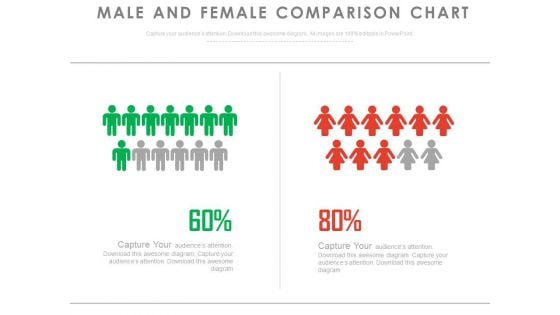
Male Female Ratio Compare Chart Powerpoint Slides
This PPT slide displays compare chart of male and female population ratio. This PowerPoint template can be customized as per requirements of business education or any other theme.
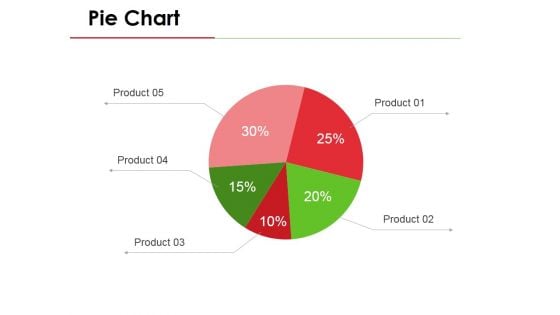
Pie Chart Ppt PowerPoint Presentation Ideas Mockup
This is a pie chart ppt powerpoint presentation ideas mockup. This is a five stage process. The stages in this process are business, marketing, process, planning, strategy.
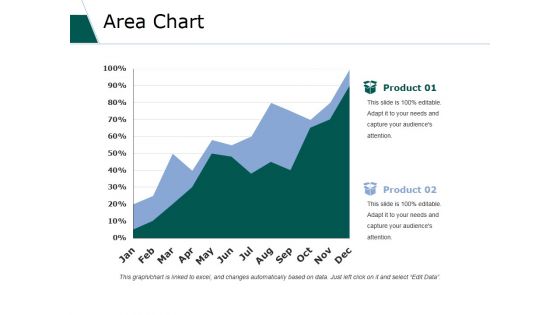
Area Chart Ppt PowerPoint Presentation Outline Microsoft
This is a area chart ppt powerpoint presentation outline microsoft. This is a two stage process. The stages in this process are business, marketing, strategy, planning, growth.
Area Chart Ppt PowerPoint Presentation Icon Good
This is a area chart ppt powerpoint presentation icon good. This is a two stage process. The stages in this process are business, marketing, growth, planning, strategy.

Win Loss Analysis Chart Powerpoint Presentation Templates
This is a win loss analysis chart powerpoint presentation templates. This is a two stage process. The stages in this process are business, management, marketing, sales, funnel.
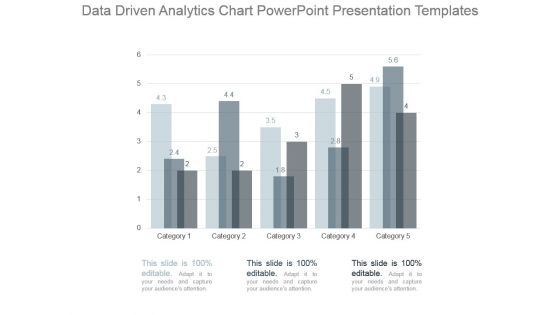
Data Driven Analytics Chart Powerpoint Presentation Templates
This is a data driven analytics chart powerpoint presentation templates. This is a five stage process. The stages in this process are category.
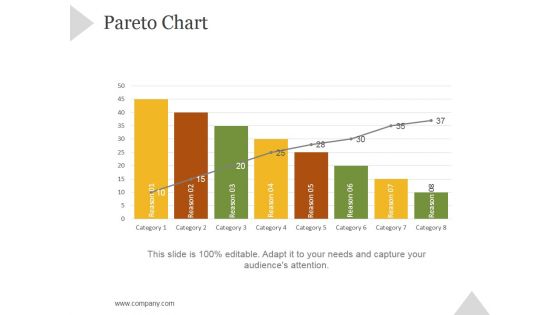
Pareto Chart Ppt PowerPoint Presentation Shapes
This is a pareto chart ppt powerpoint presentation shapes. This is a eight stage process. The stages in this process are business, strategy, marketing, success, growth strategy.
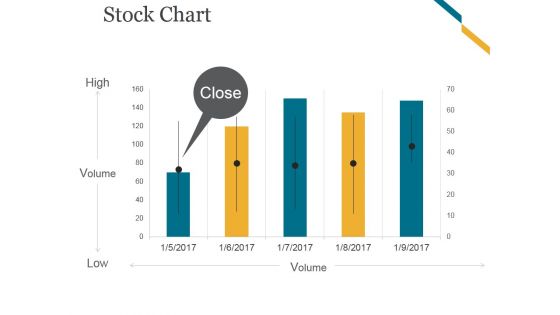
Stock Chart Ppt PowerPoint Presentation Infographics
This is a stock chart ppt powerpoint presentation infographics. This is a five stage process. The stages in this process are high, volume, low.
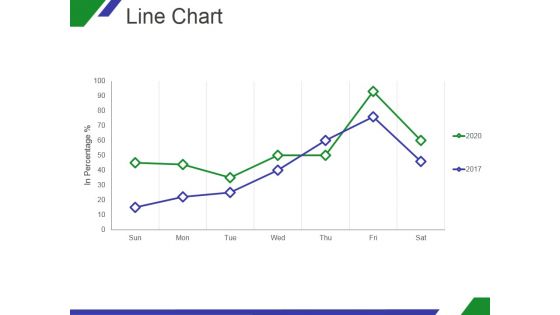
Line Chart Ppt PowerPoint Presentation Shapes
This is a line chart ppt powerpoint presentation shapes. This is a two stage process. The stages in this process are growth, in percentage, sun, mon, tue, wed.
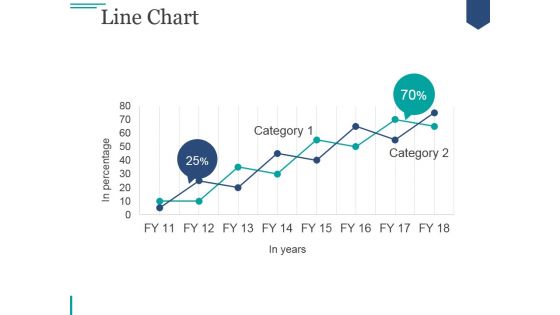
Line Chart Ppt PowerPoint Presentation Tips
This is a line chart ppt powerpoint presentation tips. This is a two stage process. The stages in this process are business, marketing, strategy, success, growth.

Stock Chart Ppt PowerPoint Presentation Topics
This is a stock chart ppt powerpoint presentation topics. This is a five stage process. The stages in this process are high, volume, low, volume.
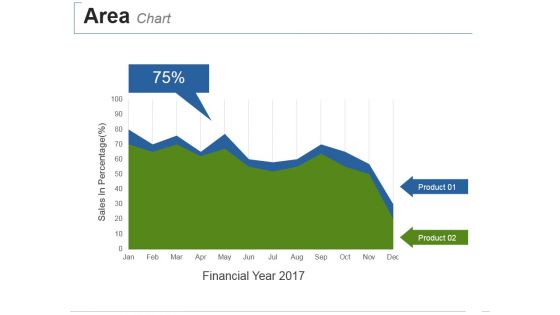
Area Chart Ppt PowerPoint Presentation Summary Deck
This is a area chart ppt powerpoint presentation summary deck. This is a two stage process. The stages in this process are sales in percentage, financial year.
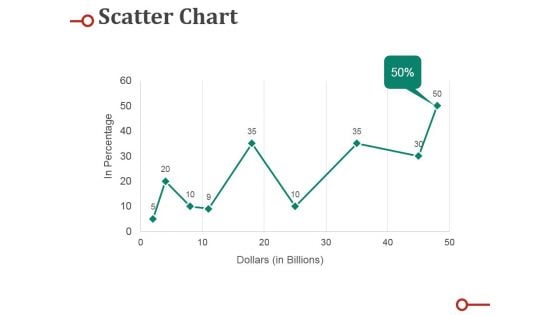
Scatter Chart Ppt PowerPoint Presentation Professional Deck
This is a scatter chart ppt powerpoint presentation professional deck. This is a nine stage process. The stages in this process are percentage, business, marketing, graph, line.
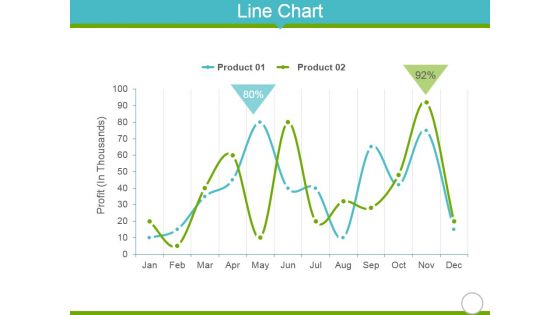
Line Chart Ppt Powerpoint Presentation Portfolio Clipart
This is a line chart ppt powerpoint presentation portfolio clipart. This is a two stage process. The stages in this process are jan, feb, mar, apr, may, jun.
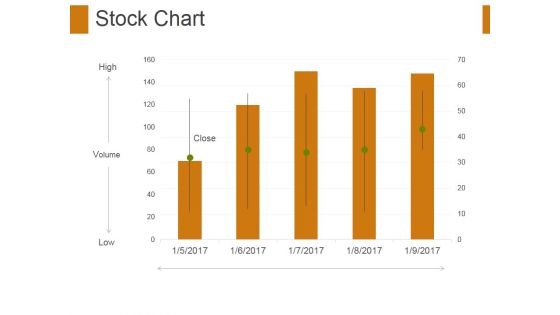
Stock Chart Ppt PowerPoint Presentation Gallery Files
This is a stock chart ppt powerpoint presentation gallery files. This is a five stage process. The stages in this process are high, volume, low, close.
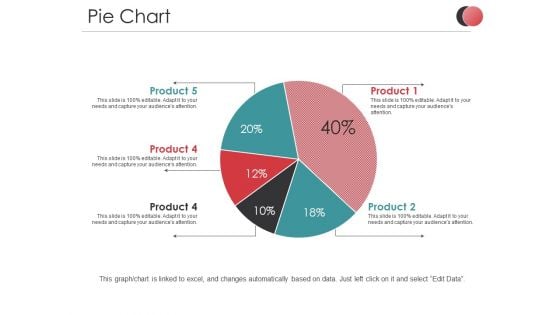
Pie Chart Ppt PowerPoint Presentation Slides Files
This is a pie chart ppt powerpoint presentation slides files. This is a five stage process. The stages in this process are product, percentage, business, marketing, process.
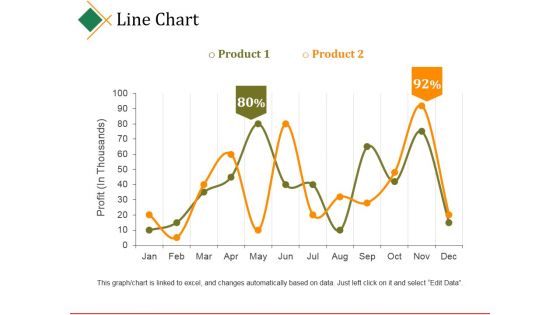
Line Chart Ppt PowerPoint Presentation Portfolio Shapes
This is a line chart ppt powerpoint presentation portfolio shapes. This is a two stage process. The stages in this process are profit, product, business, marketing, graph.
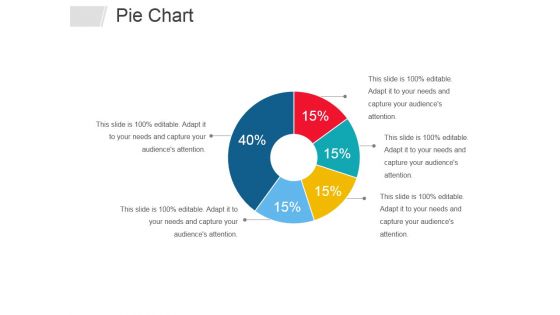
Pie Chart Ppt PowerPoint Presentation Infographics Templates
This is a pie chart ppt powerpoint presentation infographics templates. This is a five stage process. The stages in this process are business, percentage, management, process.
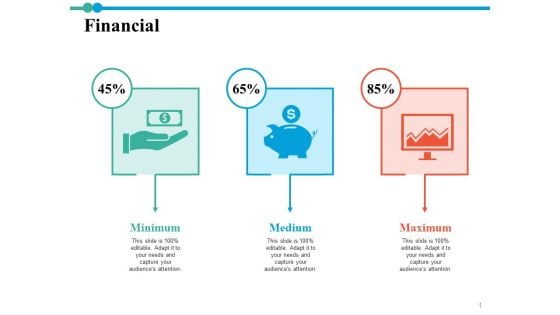
Financial Chart Ppt PowerPoint Presentation Outline Show
This is a financial chart ppt powerpoint presentation outline show. This is three stage process. The stages in this process are financial, minimum, medium, maximum.
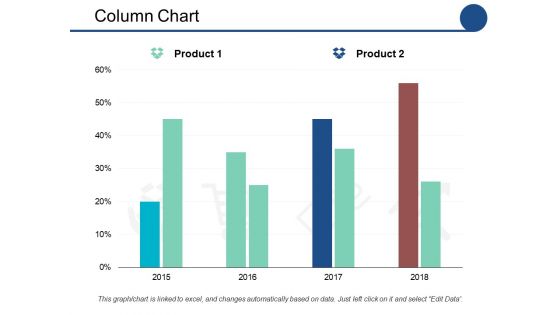
Column Chart Ppt PowerPoint Presentation Show Outfit
This is a column chart ppt powerpoint presentation show outfit. This is a two stage process. The stages in this process are product, percentage, marketing.
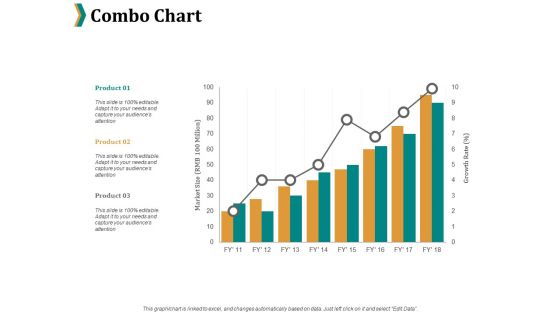
Combo Chart Ppt PowerPoint Presentation File Example
This is a combo chart ppt powerpoint presentation file example. This is a three stage process. The stages in this process are product, percentage, marketing, business, management.
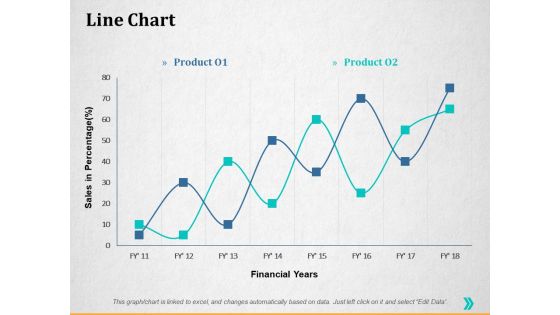
Line Chart Ppt PowerPoint Presentation Summary Guidelines
This is a line chart ppt powerpoint presentation summary guidelines. This is a two stage process. The stages in this process are percentage, product, business, management, marketing.
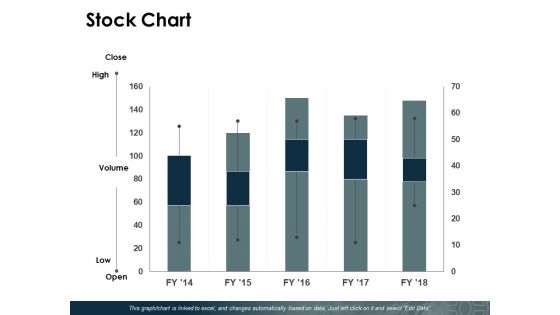
Stock Chart Ppt PowerPoint Presentation Show Pictures
This is a stock chart ppt powerpoint presentation show pictures. This is a five stage process. The stages in this process are product, percentage, management, marketing.

Pie Chart Ppt PowerPoint Presentation Model Smartart
This is a pie chart ppt powerpoint presentation model smartart. This is a five stage process. The stages in this process are management, marketing, business, percentage, product.
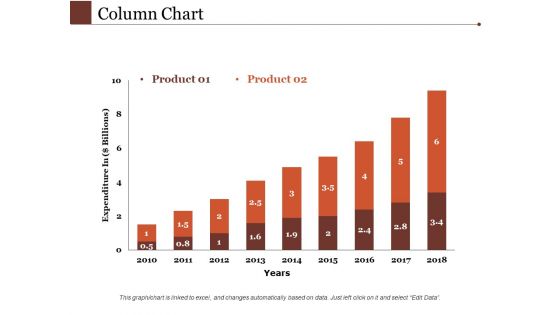
Column Chart Ppt PowerPoint Presentation Gallery Templates
This is a column chart ppt powerpoint presentation gallery templates. This is a two stage process. The stages in this process are management, marketing, business, percentage.
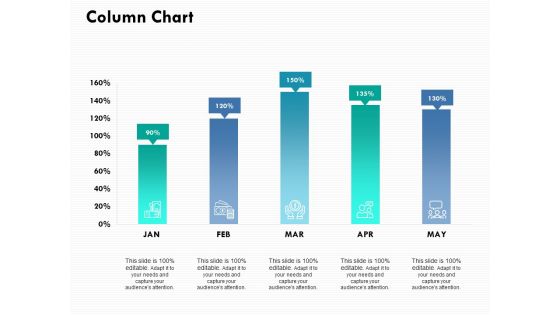
Column Chart Ppt PowerPoint Presentation Ideas Example
This is a column chart ppt powerpoint presentation ideas example. This is a five stage process. The stages in this process are percentage, product, management, marketing.
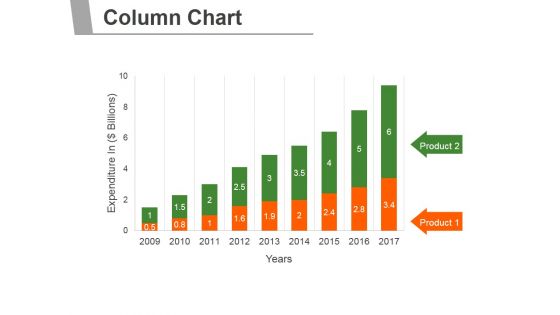
Column Chart Ppt PowerPoint Presentation Introduction
This is a column chart ppt powerpoint presentation introduction. This is a nine stage process. The stages in this process are business, marketing, management, growth, timeline.
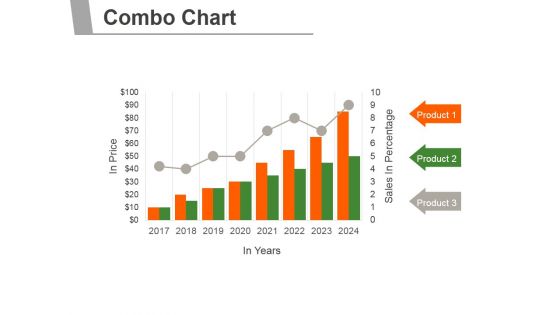
Combo Chart Ppt PowerPoint Presentation Inspiration
This is a combo chart ppt powerpoint presentation inspiration. This is a eight stage process. The stages in this process are business, marketing, management, growth, timeline.
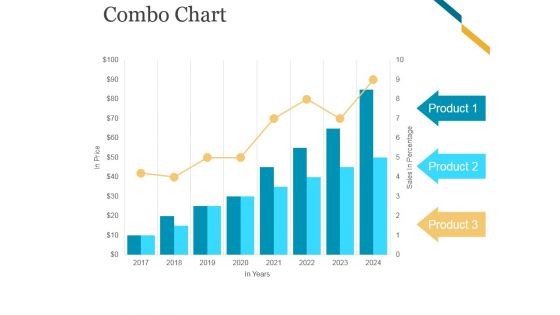
Combo Chart Ppt PowerPoint Presentation Files
This is a combo chart ppt powerpoint presentation files. This is a eight stage process. The stages in this process are business, marketing, growth, timeline, graph.
Data Maturity Assessment Chart Icon Demonstration PDF
Persuade your audience using this Data Maturity Assessment Chart Icon Demonstration PDF. This PPT design covers three stages, thus making it a great tool to use. It also caters to a variety of topics including Data Maturity, Assessment Chart Icon. Download this PPT design now to present a convincing pitch that not only emphasizes the topic but also showcases your presentation skills.
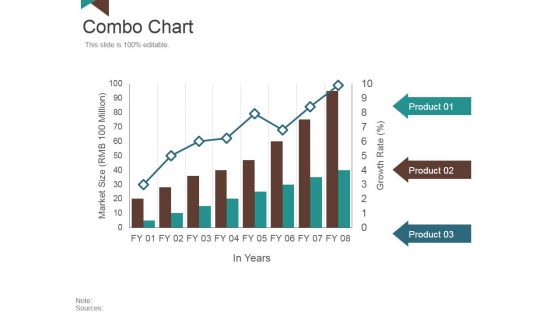
Combo Chart Ppt PowerPoint Presentation Inspiration Images
This is a combo chart ppt powerpoint presentation inspiration images. This is a three stage process. The stages in this process are market size, in years, growth rate, product.
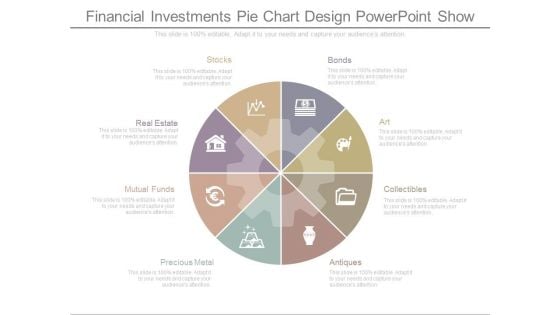
Financial Investments Pie Chart Design Powerpoint Show
This is a financial investments pie chart design powerpoint show. This is a eight stage process. The stages in this process are stocks, real estate, mutual funds, precious metal, bonds, art, collectibles, antiques.
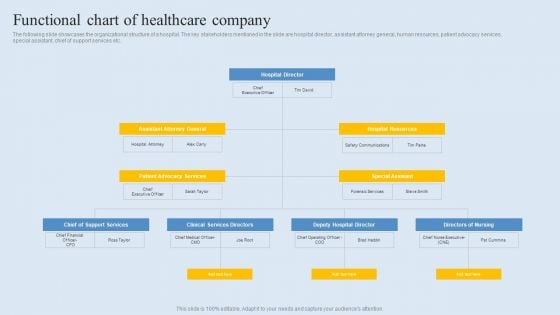
Functional Chart Of Healthcare Company Ideas PDF
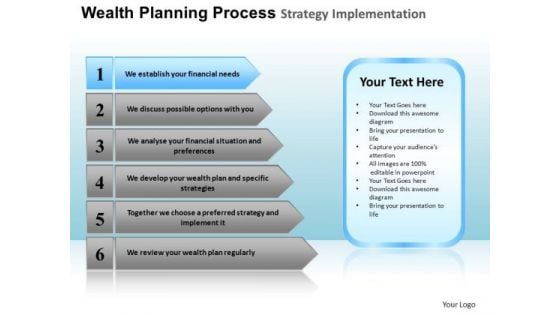
PowerPoint Slidelayout Chart Wealth Planning Ppt Theme
PowerPoint Slidelayout Chart wealth planning PPT Theme-These high quality powerpoint pre-designed slides and powerpoint templates have been carefully created by our professional team to help you impress your audience. All slides have been created and are 100% editable in powerpoint. Each and every property of any graphic - color, size, orientation, shading, outline etc. can be modified to help you build an effective powerpoint presentation. Any text can be entered at any point in the powerpoint template or slide. Simply DOWNLOAD, TYPE and PRESENT! Be a change management expert with our PowerPoint Slidelayout Chart Wealth Planning Ppt Theme. They will make you look good.
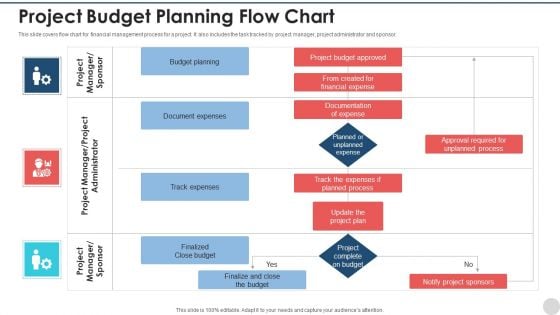
Project Budget Planning Flow Chart Inspiration PDF
This slide covers flow chart for financial management process for a project. It also includes the task tracked by project manager, project administrator and sponsor. Showcasing this set of slides titled project budget planning flow chart inspiration pdf. The topics addressed in these templates are budget planning, document expenses, track expenses, finalized close budget. All the content presented in this PPT design is completely editable. Download it and make adjustments in color, background, font etc. as per your unique business setting.
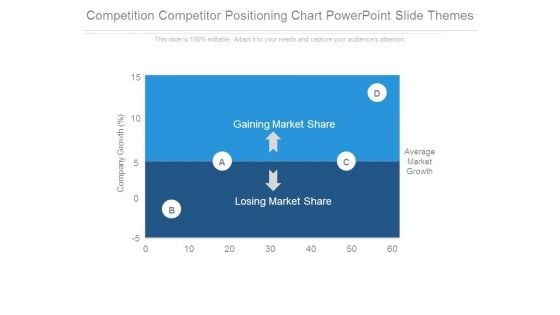
Competition Competitor Positioning Chart Powerpoint Slide Themes
This is a competition competitor positioning chart powerpoint slide themes. This is a four stage process. The stages in this process are gaining market share, losing market share, average market growth, company growth.
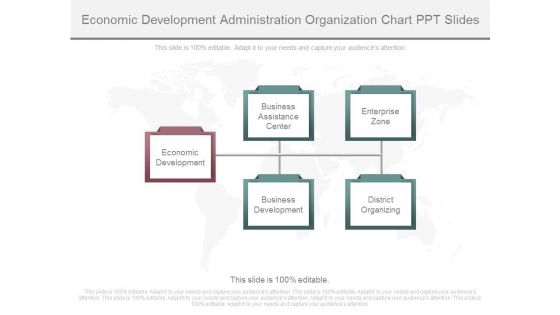
Economic Development Administration Organization Chart Ppt Slides
This is a economic development administration organization chart ppt slides. This is a five stage process. The stages in this process are economic development, business assistance center, business development, enterprise zone, district organizing.
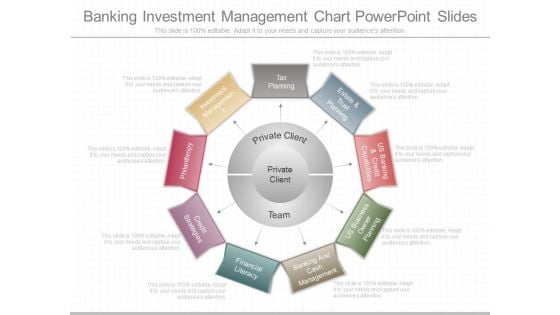
Banking Investment Management Chart Powerpoint Slides
This is a banking investment management chart powerpoint slides. This is a nine stage process. The stages in this process are tax planning, estate and trust planning, us banking and credit capabilities, us business owner planning, banking and cash management, financial literacy, credit strategies, philanthropy, investment management, private client, private client, team.
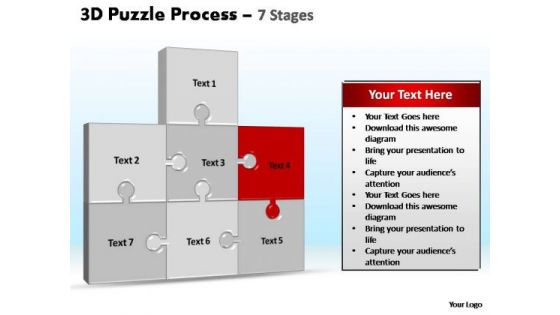
PowerPoint Backgrounds Chart Puzzle Process Ppt Design
PowerPoint_Backgrounds_Chart_puzzle_process_PPT_Design Power Point-These amazing PowerPoint pre-designed slides and PowerPoint templates have been carefully created by our team of experts to help you impress your audience. Our stunning collection of Powerpoint slides are 100% editable and can easily fit in any PowerPoint presentations. By using these animations and graphics in PowerPoint and you can easily make professional presentations. Any text can be entered at any point in the PowerPoint template or slide. Just DOWNLOAD our awesome PowerPoint templates and you are ready to go. Endure setbacks with our PowerPoint Backgrounds Chart Puzzle Process Ppt Design. Download without worries with our money back guaranteee.
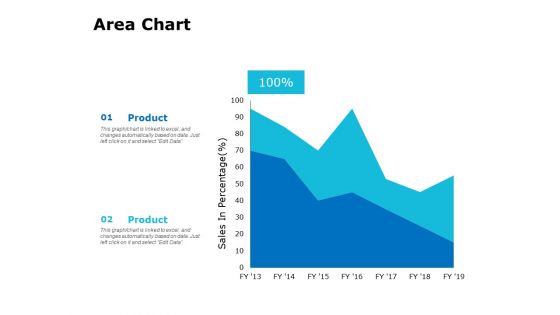
Area Chart Ppt PowerPoint Presentation Layouts Slide
Presenting this set of slides with name area chart ppt powerpoint presentation layouts slide. The topics discussed in these slide is area chart. This is a completely editable PowerPoint presentation and is available for immediate download. Download now and impress your audience.
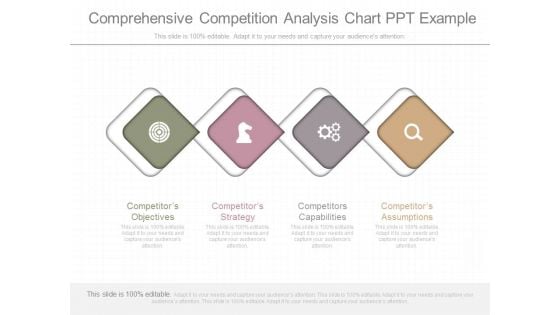
Comprehensive Competition Analysis Chart Ppt Example
This is a comprehensive competition analysis chart ppt example. This is a four stage process. The stages in this process are competitors objectives, competitors strategy, competitors capabilities, competitors assumptions.
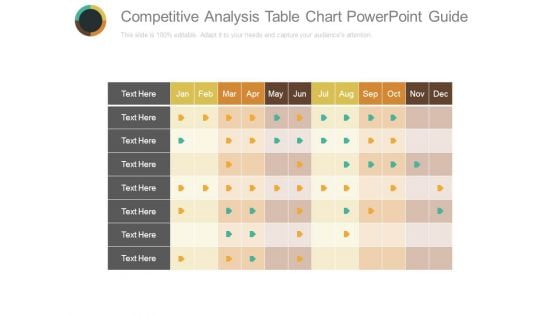
Competitive Analysis Table Chart Powerpoint Guide
This is a competitive analysis table chart powerpoint guide. This is a twelve stage process. The stages in this process are jan,feb, mar, apr, may, jun, jul, aug, sep, oct, nov, dec.
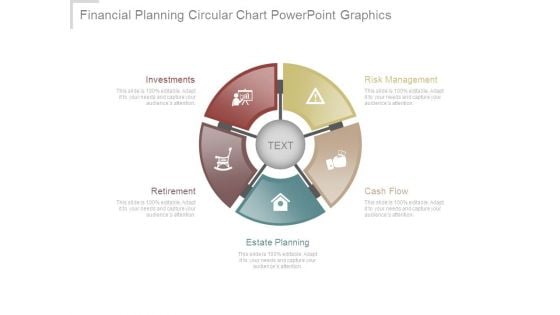
Financial Planning Circular Chart Powerpoint Graphics
This is a financial planning circular chart powerpoint graphics. This is a five stage process. The stages in this process are risk management, cash flow, estate planning, retirement, investments.
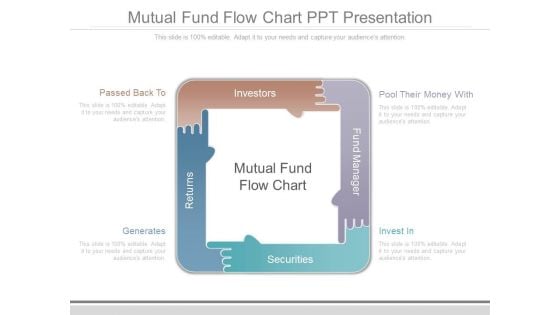
Mutual Fund Flow Chart Ppt Presentation
This is a mutual fund flow chart ppt presentation. This is a four stage process. The stages in this process are passed back to, generates, pool their money with, invest in, returns, securities, fund manager, investors.
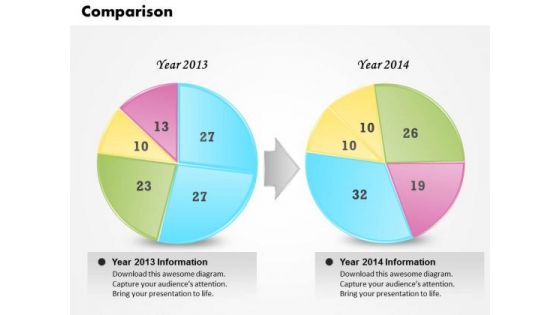
Business Framework PowerPoint Chart Variations PowerPoint Presentation
This image slide displays comparison chart template. This innovative image slide has been designed with pie charts to represent yearly progress. This image slide is 100% editable. You may change color, size and orientation of any icon to your liking. This image slide may be used in school, business and social presentations. Make your presentations interesting using this image slide.
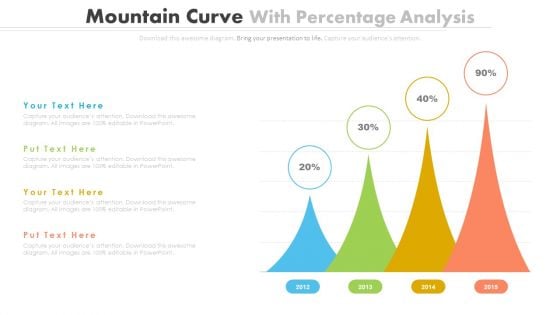
Percentage Data Growth Chart Powerpoint Slides
This PowerPoint template has been designed with percentage data growth chart. Download this PPT chart to depict financial ratio analysis. This PowerPoint slide is of great help in the business sector to make realistic presentations and provides effective way of presenting your newer thoughts.

Ppt Linear Chart 7 Stages5 PowerPoint Templates
PPT linear chart 7 stages5 PowerPoint Templates-Use this 3d Arrow PPT slide to show the sequence of events in a story or describe the steps to be taken in a process. This image has been conceived to enable you to emphatically communicate your ideas in Counsel teams with our Ppt Linear Chart 7 Stages5 PowerPoint Templates. Download without worries with our money back guaranteee.
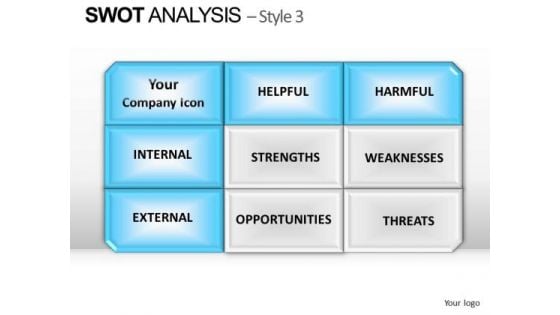
PowerPoint Template Chart Swot Analysis Ppt Designs
PowerPoint Template Chart SWOT Analysis PPT Designs.pptx-These high quality powerpoint pre-designed slides and powerpoint templates have been carefully created by our professional team to help you impress your audience. All slides have been created and are 100% editable in powerpoint. Each and every property of any graphic - color, size, orientation, shading, outline etc. can be modified to help you build an effective powerpoint presentation. Any text can be entered at any point in the powerpoint template or slide. Simply DOWNLOAD, TYPE and PRESENT! Dispatch your thoughts on our PowerPoint Template Chart Swot Analysis Ppt Designs. They will take them the farthest possible.
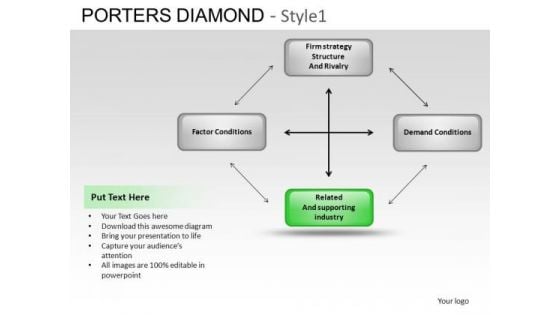
PowerPoint Backgrounds Chart Porters Diamond Ppt Template
PowerPoint Backgrounds Chart Porters Diamond PPT Template--These high quality powerpoint pre-designed slides and powerpoint templates have been carefully created by our professional team to help you impress your audience. All slides have been created and are 100% editable in powerpoint. Each and every property of any graphic - color, size, orientation, shading, outline etc. can be modified to help you build an effective powerpoint presentation. Any text can be entered at any point in the powerpoint template or slide. Simply DOWNLOAD, TYPE and PRESENT! Use our PowerPoint Backgrounds Chart Porters Diamond Ppt Template and be carefree. They will bear the brunt for you.
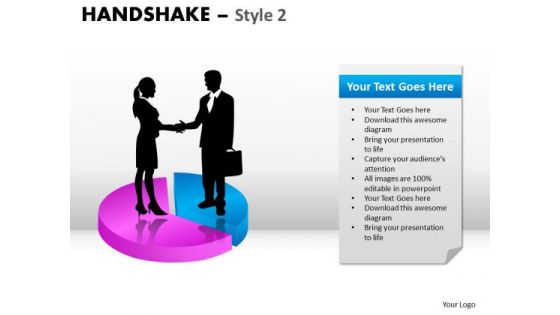
PowerPoint Design Chart Handshake Ppt Slides
PowerPoint Design Chart Handshake PPT Slides-These high quality, editable pre-designed powerpoint slides have been carefully created by our professional team to help you impress your audience. Each graphic in every slide is vector based and is 100% editable in powerpoint. Each and every property of any slide - color, size, shading etc can be modified to build an effective powerpoint presentation. Use these slides to convey complex business concepts in a simplified manner. Any text can be entered at any point in the powerpoint slide. Simply DOWNLOAD, TYPE and PRESENT! Address baseless allegations with our PowerPoint Design Chart Handshake Ppt Slides. Give appropriate answers to clear all doubts.
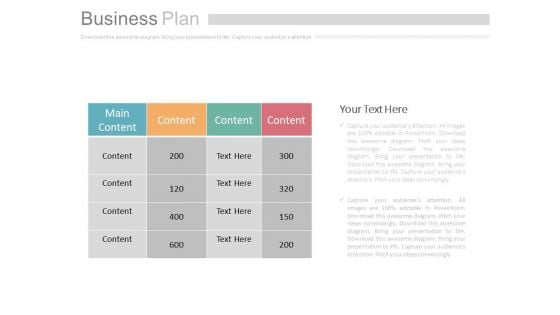
Table Chart For Business Plan Powerpoint Slides
Table chart has been used to design this power point template. This diagram may be used to display business plan. Download this template to leave permanent impression on your audience.
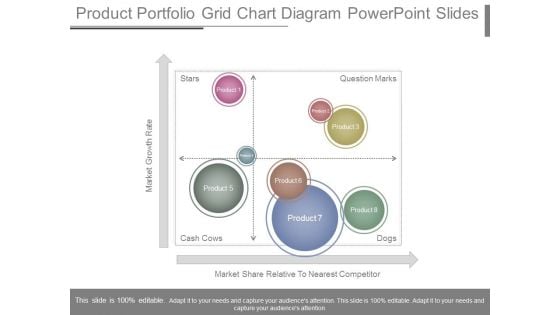
Product Portfolio Grid Chart Diagram Powerpoint Slides
This is a product portfolio grid chart diagram powerpoint slides. This is a four stage process. The stages in this process are market growth rate, market share relative to nearest competitor, stars, cash cows, dogs, question marks, product.
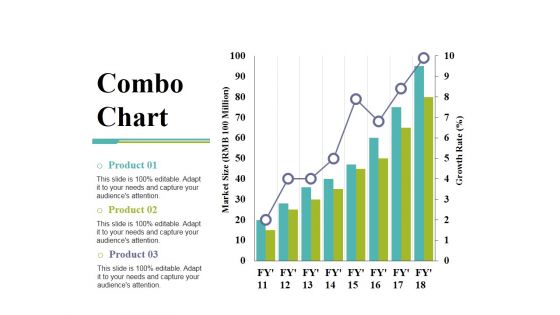
Combo Chart Ppt PowerPoint Presentation Show Deck
This is a combo chart ppt powerpoint presentation show deck. This is a three stage process. The stages in this process are growth rate, market size, product, bar graph, growth.
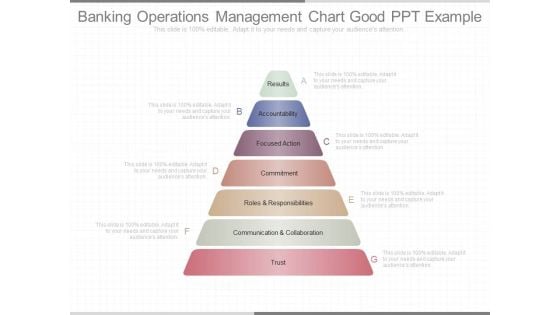
Banking Operations Management Chart Good Ppt Example
This is a banking operations management chart good ppt example. This is a seven stage process. The stages in this process are results, accountability, focused action, commitment, roles and responsibilities, communication and collaboration, trust.
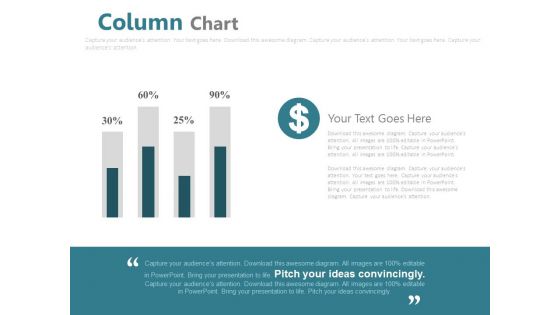
Column Chart For Financial Analysis Powerpoint Slides
This PowerPoint template has been designed with graphics of column chart with percentage values. You may use this business slide design for topics like financial analysis and planning. This PPT slide is powerful tool to describe your ideas.
Combo Chart Ppt PowerPoint Presentation Icon Slide
This is a combo chart ppt powerpoint presentation icon slide. This is a three stage process. The stages in this process are growth rate, market size, graph, business, marketing.


 Continue with Email

 Home
Home


