Cost Chart
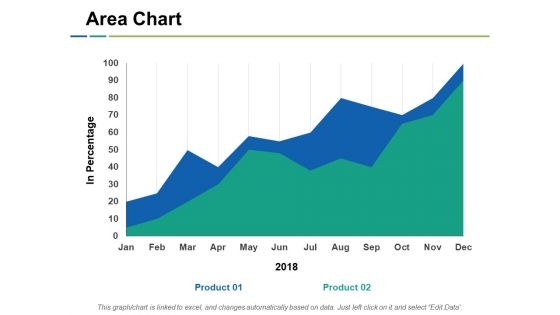
Area Chart Ppt PowerPoint Presentation Model Slide Portrait
This is a area chart ppt powerpoint presentation model slide portrait. This is a two stage process. The stages in this process are area chart, financial, business, marketing, planning, strategy.
Column Chart Analysis Ppt PowerPoint Presentation Icon Structure
This is a column chart analysis ppt powerpoint presentation icon structure. This is a three stage process. The stages in this process are column chart, finance, marketing, management, investment.
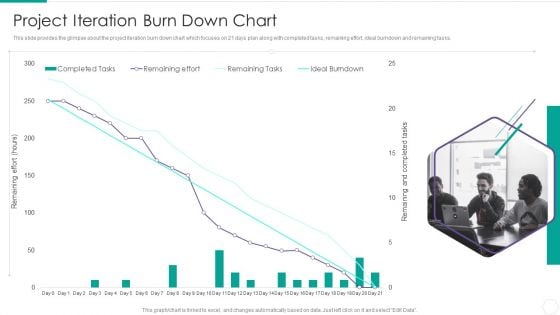
Quantitative Risk Assessment Project Iteration Burn Down Chart Sample PDF
This slide provides the glimpse about the project iteration burn down chart which focuses on 21 days plan along with completed tasks, remaining effort, ideal burndown and remaining tasks. Deliver an awe inspiring pitch with this creative Quantitative Risk Assessment Project Iteration Burn Down Chart Sample PDF bundle. Topics like Project Iteration Burn Down Chart can be discussed with this completely editable template. It is available for immediate download depending on the needs and requirements of the user.
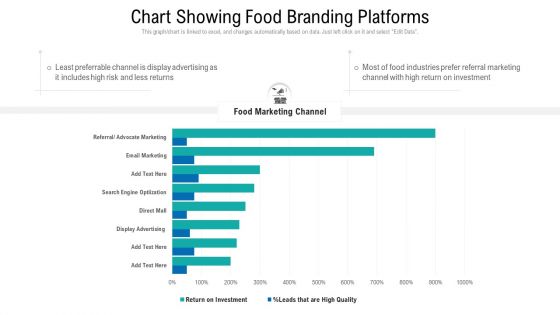
Chart Showing Food Branding Platforms Ppt Summary Gridlines PDF
This graph or chart is linked to excel, and changes automatically based on data. Just left click on it and select Edit Data. Showcasing this set of slides titled chart showing food branding platforms ppt summary gridlines pdf. The topics addressed in these templates are chart showing food branding platforms. All the content presented in this PPT design is completely editable. Download it and make adjustments in color, background, font etc. as per your unique business setting.

Area Chart Product Percentage Ppt PowerPoint Presentation Infographic Template Slide
This is a area chart product percentage ppt powerpoint presentation infographic template slide. This is a four stage process. The stages in this process are area chart, finance, marketing, management, investment.
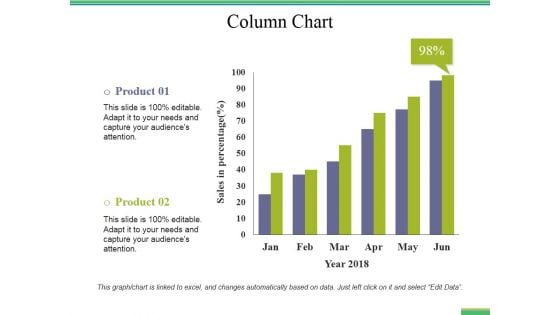
Column Chart Ppt PowerPoint Presentation Pictures Visual Aids
This is a column chart ppt powerpoint presentation pictures visual aids. This is a two stage process. The stages in this process are column chart, business, finance, marketing, analysis, investment.
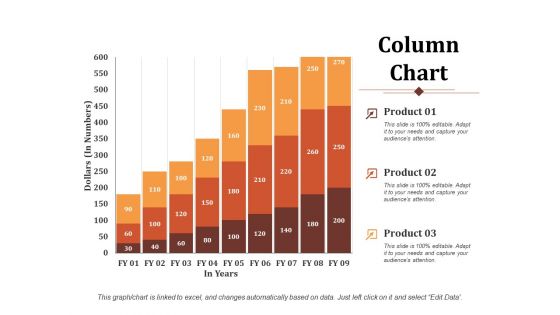
Column Chart Business Analysis Ppt PowerPoint Presentation Outline Example Introduction
This is a column chart business analysis ppt powerpoint presentation outline example introduction. This is a three stage process. The stages in this process are column chart, finance, marketing, management, investment.

Area Chart Percentage Ppt PowerPoint Presentation Portfolio Pictures
This is a area chart percentage ppt powerpoint presentation portfolio pictures. This is a three stage process. The stages in this process are area chart, finance, marketing, management, investment.
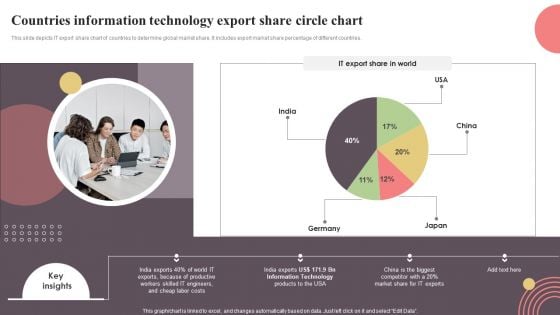
Countries Information Technology Export Share Circle Chart Inspiration PDF
This slide depicts IT export share chart of countries to determine global market share. It includes export market share percentage of different countries. Pitch your topic with ease and precision using this Countries Information Technology Export Share Circle Chart Inspiration PDF. This layout presents information on Countries Information Technology, Export Share Circle Chart. It is also available for immediate download and adjustment. So, changes can be made in the color, design, graphics or any other component to create a unique layout.
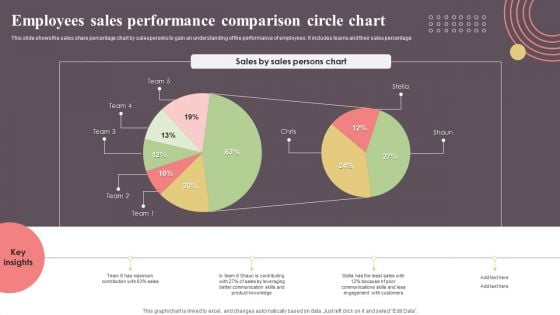
Employees Sales Performance Comparison Circle Chart Topics PDF
This slide shows the sales share percentage chart by salespersons to gain an understanding of the performance of employees. It includes teams and their sales percentage. Pitch your topic with ease and precision using this Employees Sales Performance Comparison Circle Chart Topics PDF. This layout presents information on Employees Sales Performance, Comparison Circle Chart. It is also available for immediate download and adjustment. So, changes can be made in the color, design, graphics or any other component to create a unique layout.
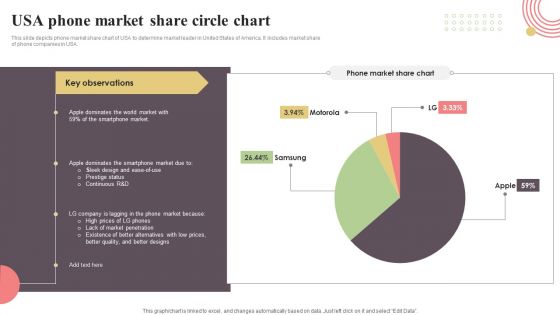
USA Phone Market Share Circle Chart Sample PDF
This slide depicts phone market share chart of USA to determine market leader in United States of America. It includes market share of phone companies in USA. Pitch your topic with ease and precision using this USA Phone Market Share Circle Chart Sample PDF. This layout presents information on USA Phone Market, Share Circle Chart. It is also available for immediate download and adjustment. So, changes can be made in the color, design, graphics or any other component to create a unique layout.
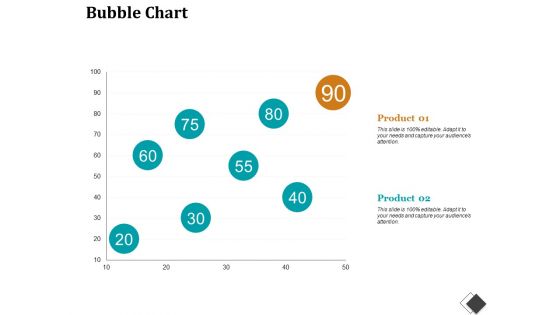
Bubble Chart Enterprise Model Canvas Ppt PowerPoint Presentation File Structure
This is a bubble chart enterprise model canvas ppt powerpoint presentation file structure. This is a two stage process. The stages in this process are bubble chart, finance, marketing, strategy, analysis, investment.
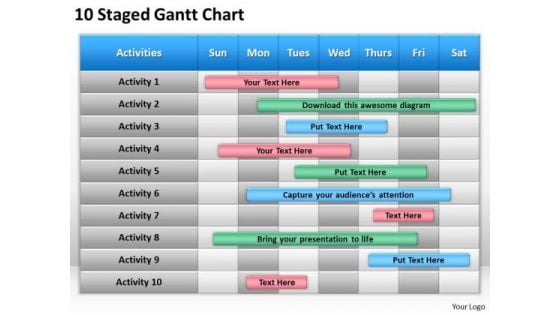
Consulting PowerPoint Template Gantt Chart Ppt Templates Backgrounds For Slides
Our consulting PowerPoint template gantt chart ppt templates backgrounds for slides help to make a draft. They give you a good place to start. Break the deadlock with our Competition PowerPoint Templates. Let the words start to flow. Assert your capability with our Advertising PowerPoint Templates. Give your thoughts that decisive touch. Break it down factor by factor. Our Consulting PowerPoint Template Gantt Chart Ppt Templates Backgrounds For Slides address each concern with diligence.
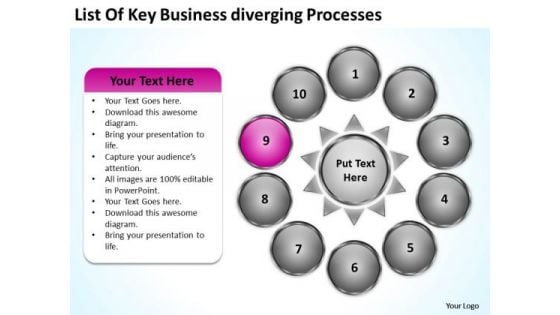
Nine Stages Diverging Factors Flow Chart Circular Diagram PowerPoint Templates
We present our nine stages diverging factors flow chart Circular Diagram PowerPoint templates.Download our Ring Charts PowerPoint Templates because the basic stages are in place, you need to build upon them with our PowerPoint templates. Download and present our Process and Flows PowerPoint Templates because brilliant ideas are your forte. Download and present our Circle charts PowerPoint Templates because you can Refine them all as you take them through the numerous filtering stages of the funnel of your quality control process. Download our Arrows PowerPoint Templates because this template contains the material to highlight the key issues of your presentation. Download our Success PowerPoint Templates because you have come up with a brilliant breakthrough idea. you can also visualise the interest it will generate.Use these PowerPoint slides for presentations relating to Arrow, blue, business, chart, check,circle, concept, control, creative, cycle,design, development, diagram, do,engineering, evaluate, flow, glossy,graphic, green, idea, infographic, life,lifecycle, management, marketing,method, model, pdca, plan, plan,docheckact, process, quality, red,research, software, spiral, step, strategy,success, system. The prominent colors used in the PowerPoint template are Pink, White, Gray. People tell us our nine stages diverging factors flow chart Circular Diagram PowerPoint templates look good visually. Customers tell us our chart PowerPoint templates and PPT Slides are Precious. Professionals tell us our nine stages diverging factors flow chart Circular Diagram PowerPoint templates are Beautiful. Presenters tell us our chart PowerPoint templates and PPT Slides will help you be quick off the draw. Just enter your specific text and see your points hit home. Use our nine stages diverging factors flow chart Circular Diagram PowerPoint templates are Spectacular. Presenters tell us our concept PowerPoint templates and PPT Slides are Second to none. Form plans with our Nine Stages Diverging Factors Flow Chart Circular Diagram PowerPoint Templates. Download without worries with our money back guaranteee.
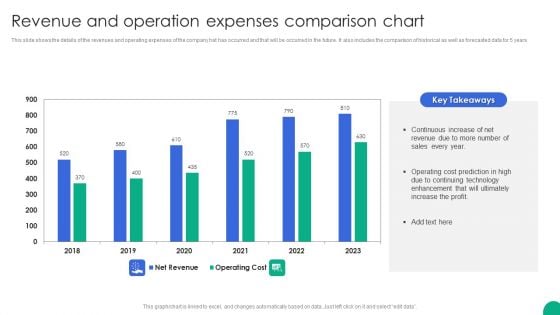
Revenue And Operation Expenses Comparison Chart Slides PDF
This slide shows the details of the revenues and operating expenses of the company hat has occurred and that will be occurred in the future. It also includes the comparison of historical as well as forecasted data for 5 years.Showcasing this set of slides titled Revenue And Operation Expenses Comparison Chart Slides PDF. The topics addressed in these templates are Continuous Increase, Operating Cost, Enhancement Ultimately. All the content presented in this PPT design is completely editable. Download it and make adjustments in color, background, font etc. as per your unique business setting.
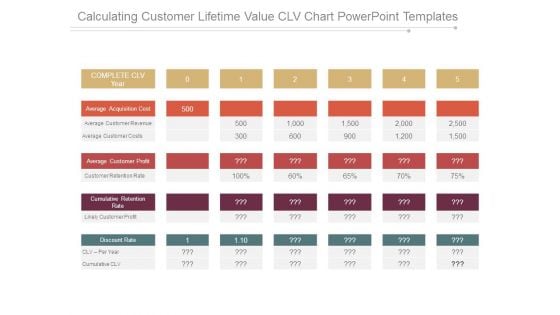
Calculating Customer Lifetime Value Clv Chart Powerpoint Templates
This is a calculating customer lifetime value clv chart powerpoint templates. This is a five stage process. The stages in this process are complete clv year, average acquisition cost, average customer revenue, average customer costs, average customer profit, customer retention rate, cumulative retention rate, likely customer profit, discount rate, clv per year, cumulative clv.
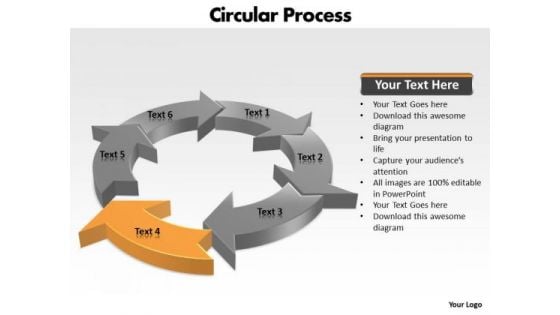
Ppt Components Of Circular PowerPoint Menu Template Process Chart Templates
PPT components of circular powerpoint menu template process chart Templates-This circular flow diagram can helps to illustrate the economic exchange that takes place in the building of wealth. Clarity of thought has been the key to your growth. Use our template to illustrate your ability.-PPT components of circular powerpoint menu template process chart Templates-Arrow, Chart, Circular, Color, Colorful, Connect, Connection, Design, Diagram, Finance, Graphic, Group, Growth, Icon, Illustration, Marketing, Pieces, Process, Recycle, Recycling, Round, Set, Strategy, Symbol, Wheel Consult experts with our Ppt Components Of Circular PowerPoint Menu Template Process Chart Templates. Download without worries with our money back guaranteee.
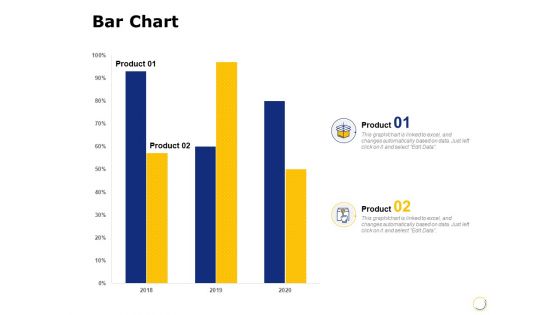
Bar Chart Finance Ppt PowerPoint Presentation Model Files
Presenting this set of slides with name bar chart finance ppt powerpoint presentation model files. The topics discussed in these slide is bar chart. This is a completely editable PowerPoint presentation and is available for immediate download. Download now and impress your audience.
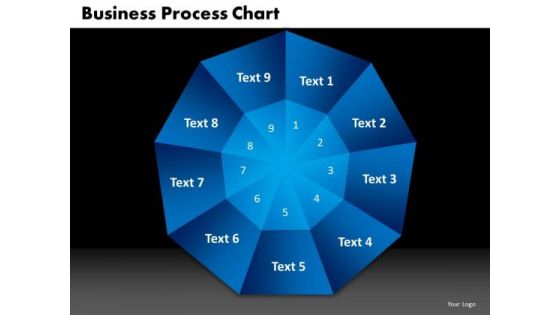
PowerPoint Slide Designs Process Chart Business Ppt Designs
PowerPoint Slide Designs Process Chart Business PPT Designs-The Circle of Life - a concept emmbedded in our minds and hence easy to comprehend. Life and Business is made up of processes comprising stages that flow from one to another. An excellent graphic to attract the attention of and understanding by your audience to improve earnings-PowerPoint Slide Designs Process Chart Business PPT Designs-This ppt can be used for presentations relating to-Arrow, Bond, Business, Button, Buying, Career, Change, Chart, Children, Circle, College, Death, Diagram, Education, Financial, Future, Graphic, House, Illustration, Investing, Investment, Marriage, Menu, Personal, Plan, Process Put your thoughts on the anvil. Fashion them with our PowerPoint Slide Designs Process Chart Business Ppt Designs.
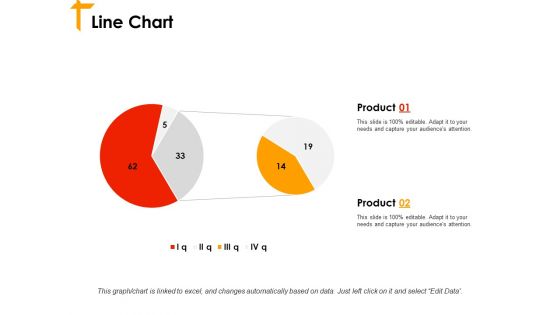
Line Chart Ppt PowerPoint Presentation Styles Format Ideas
This is a line chart ppt powerpoint presentation styles format ideas. This is a two stage process. The stages in this process are line chart, financial, business, planning, marketing, management.
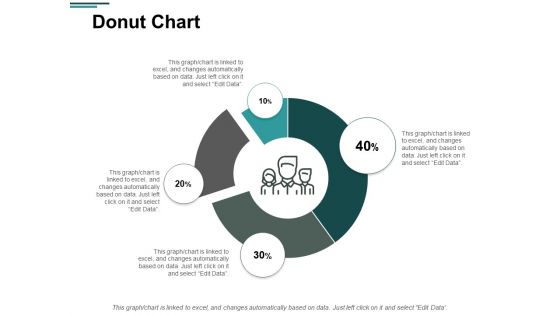
Donut Chart Finance Management Ppt PowerPoint Presentation Layouts Design Templates
Presenting this set of slides with name donut chart finance management ppt powerpoint presentation layouts design templates. The topics discussed in these slides are donut chart, finance, marketing, management, analysis. This is a completely editable PowerPoint presentation and is available for immediate download. Download now and impress your audience.
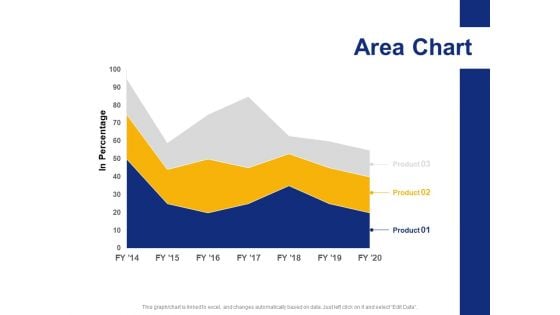
Area Chart Finance Ppt PowerPoint Presentation Infographic Template Graphics Download
Presenting this set of slides with name area chart finance ppt powerpoint presentation infographic template graphics download. The topics discussed in these slide is area chart. This is a completely editable PowerPoint presentation and is available for immediate download. Download now and impress your audience.
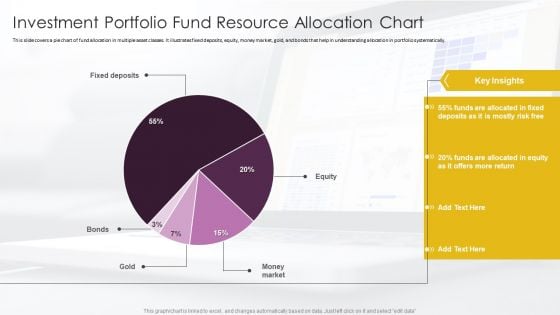
Investment Portfolio Fund Resource Allocation Chart Summary PDF
This slide covers a pie chart of fund allocation in multiple asset classes. It illustrates fixed deposits, equity, money market, gold, and bonds that help in understanding allocation in portfolio systematically. Showcasing this set of slides titled Investment Portfolio Fund Resource Allocation Chart Summary PDF. The topics addressed in these templates are Money Market, Equity, Fixed Deposits. All the content presented in this PPT design is completely editable. Download it and make adjustments in color, background, font etc. as per your unique business setting.
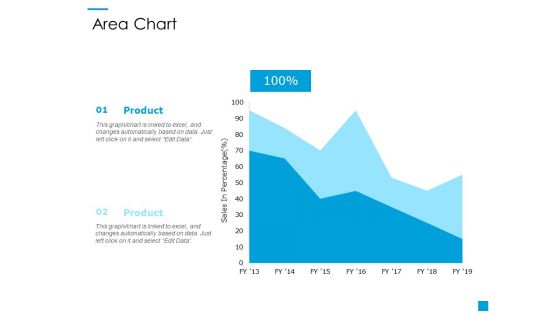
Area Chart Finance Ppt PowerPoint Presentation Model Shapes
Presenting this set of slides with name area chart finance ppt powerpoint presentation model shapes. The topics discussed in these slide is area chart. This is a completely editable PowerPoint presentation and is available for immediate download. Download now and impress your audience.
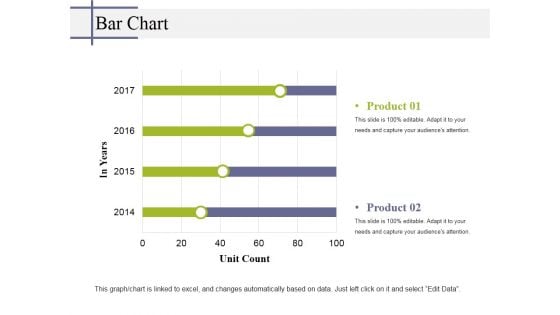
Bar Chart Ppt PowerPoint Presentation Infographic Template Tips
This is a bar chart ppt powerpoint presentation infographic template tips. This is a two stage process. The stages in this process are bar chart, finance, marketing, strategy, business.
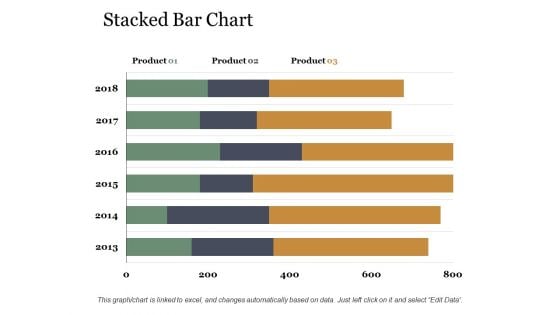
Stacked Bar Chart Ppt PowerPoint Presentation Portfolio Templates
This is a stacked bar chart ppt powerpoint presentation portfolio templates. This is a three stage process. The stages in this process are stacked bar chart, product, year, business, finance.
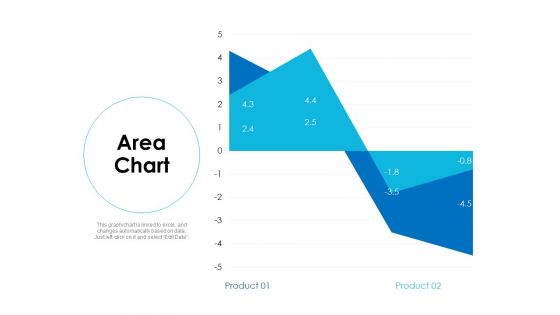
Area Chart Analysis Ppt Powerpoint Presentation Infographics Aids
Presenting this set of slides with name area chart analysis ppt powerpoint presentation infographics aids. The topics discussed in these slides are area chart, finance, marketing, investment, analysis. This is a completely editable PowerPoint presentation and is available for immediate download. Download now and impress your audience.
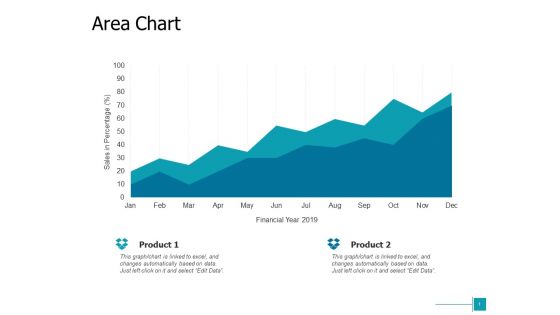
Area Chart Analysis Ppt Powerpoint Presentation Model Layout Ideas
Presenting this set of slides with name area chart analysis ppt powerpoint presentation model layout ideas. The topics discussed in these slides are area chart, finance, marketing, investment, analysis. This is a completely editable PowerPoint presentation and is available for immediate download. Download now and impress your audience.
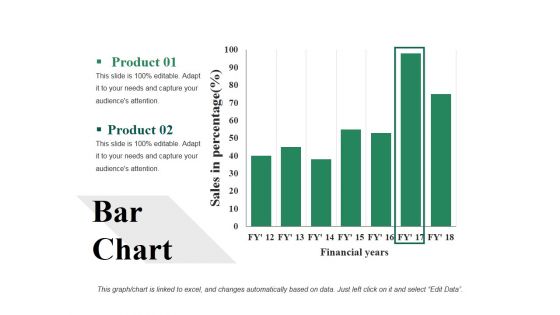
Bar Chart Ppt PowerPoint Presentation Visual Aids Backgrounds
This is a bar chart ppt powerpoint presentation visual aids backgrounds. This is a two stage process. The stages in this process are bar chart, analysis, strategy, finance, business.
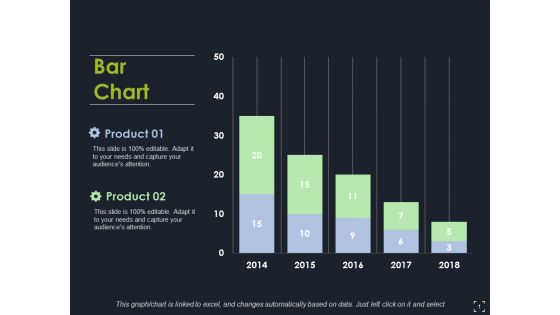
Bar Chart Ppt PowerPoint Presentation Model Clipart Images
This is a bar chart ppt powerpoint presentation model clipart images. This is a two stage process. The stages in this process are bar chart, finance, marketing, strategy, analysis.

Combo Chart Ppt PowerPoint Presentation Infographic Template Themes
This is a combo chart ppt powerpoint presentation infographic template themes. This is a eight stage process. The stages in this process are combo chart, finance, marketing, strategy, analysis, business.
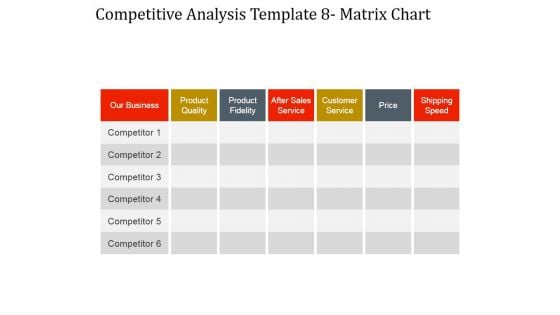
Competitive Analysis Matrix Chart Ppt PowerPoint Presentation Gallery
This is a competitive analysis matrix chart ppt powerpoint presentation gallery. This is a seven stage process. The stages in this process are our business, product quality, product fidelity, after sales service, customer service, price, shipping speed.
Scatter Bubble Chart Ppt PowerPoint Presentation Icon Templates
This is a scatter bubble chart ppt powerpoint presentation icon templates. This is a eight stage process. The stages in this process are business, finance, management, scatter chart, marketing.
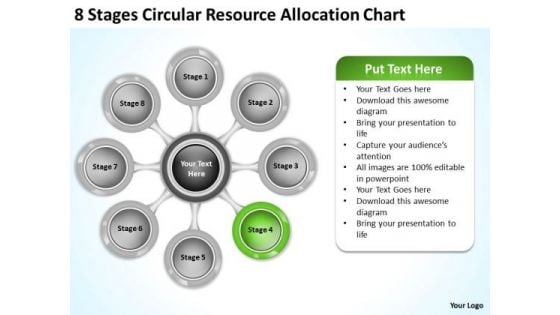
Business Planning Strategy Resource Allocation Chart Level Definition
We present our business planning strategy resource allocation chart level definition.Download and present our Process and Flows PowerPoint Templates because Our PowerPoint Templates and Slides will let you Leave a lasting impression to your audiences. They possess an inherent longstanding recall factor. Use our Circle Charts PowerPoint Templates because Our PowerPoint Templates and Slides are endowed to endure. Ideas conveyed through them will pass the test of time. Download our Ring Charts PowerPoint Templates because Our PowerPoint Templates and Slides has conjured up a web of all you need with the help of our great team. Use them to string together your glistening ideas. Download our Flow Charts PowerPoint Templates because Our PowerPoint Templates and Slides will let your words and thoughts hit bullseye everytime. Use our Marketing PowerPoint Templates because Our PowerPoint Templates and Slides are aesthetically designed to attract attention. We gaurantee that they will grab all the eyeballs you need.Use these PowerPoint slides for presentations relating to Abstract, arrows, business, central, centralized, chart, circle, circular,circulation, concept, conceptual, converging, design, diagram, eight, executive,icon, idea, illustration, management, map, mapping, mba, model, numbers,organization, outwards, pointing, procedure, process, radial, radiating,relationship, resource, sequence, sequential, square, strategy. The prominent colors used in the PowerPoint template are Green lime, Gray, White. Stop your audience's blank gaze. Get them interestedwith our Business Planning Strategy Resource Allocation Chart Level Definition. You'll deliver your best presentation yet.
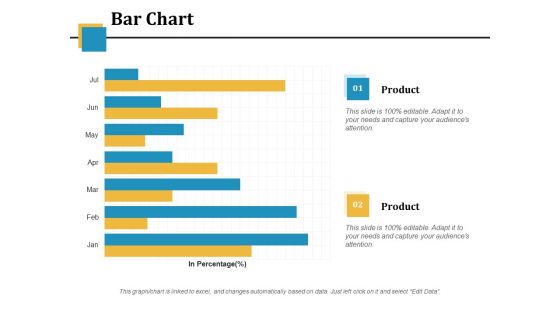
Bar Chart Ppt PowerPoint Presentation Infographic Template Picture
This is a bar chart ppt powerpoint presentation infographic template picture. This is a two stage process. The stages in this process are financial, in percentage, business, marketing, bar chart.
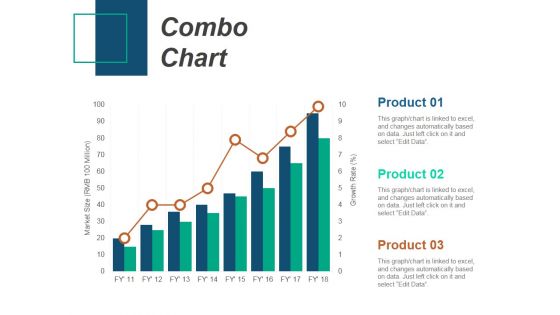
Combo Chart Ppt PowerPoint Presentation Summary Background Image
This is a combo chart ppt powerpoint presentation summary background image. This is a three stage process. The stages in this process are combo chart, product, growth rate, market size.
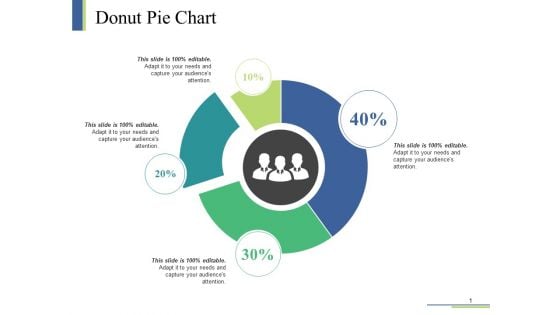
Donut Pie Chart Ppt PowerPoint Presentation Visual Aids Infographic Template
This is a donut pie chart ppt powerpoint presentation visual aids infographic template. This is a four stage process. The stages in this process are donut pie chart, finance, planning, management, marketing.
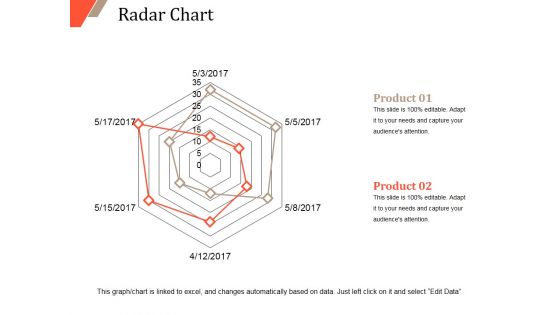
Radar Chart Ppt PowerPoint Presentation Portfolio Design Templates
This is a radar chart ppt powerpoint presentation portfolio design templates. This is a two stage process. The stages in this process are radar chart, product, finance, marketing, strategy, business.
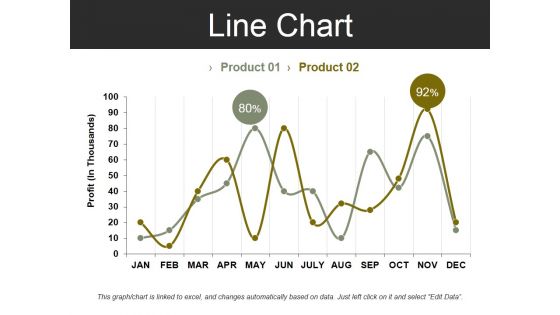
Line Chart Template 2 Ppt PowerPoint Presentation Summary Design Inspiration
This is a line chart template 2 ppt powerpoint presentation summary design inspiration. This is a two stage process. The stages in this process are profit, business, marketing, finance, chart.

Column Chart Ppt PowerPoint Presentation Infographic Template Slides
This is a column chart ppt powerpoint presentation infographic template slides. This is a two stage process. The stages in this process are column chart, finance, marketing, strategy, business.
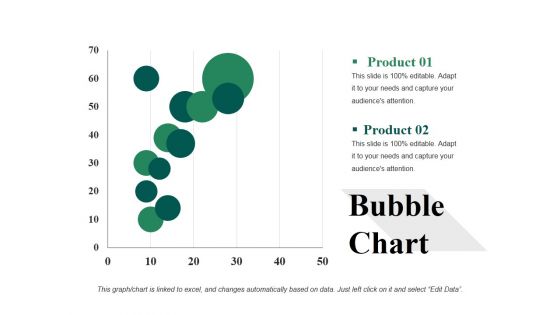
Bubble Chart Ppt PowerPoint Presentation Infographic Template Example 2015
This is a bubble chart ppt powerpoint presentation infographic template example 2015. This is a two stage process. The stages in this process are analysis, strategy, finance, business, bubble chart.
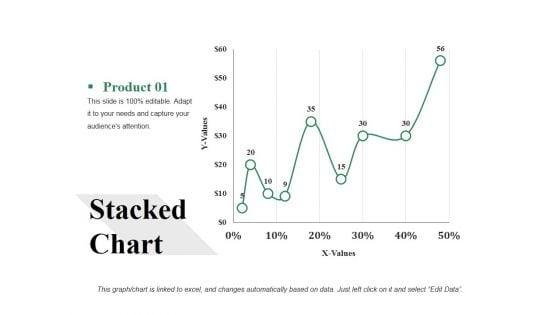
Stacked Chart Ppt PowerPoint Presentation Gallery Infographic Template
This is a stacked chart ppt powerpoint presentation gallery infographic template. This is a one stage process. The stages in this process are stacked chart, finance, analysis, marketing, business.
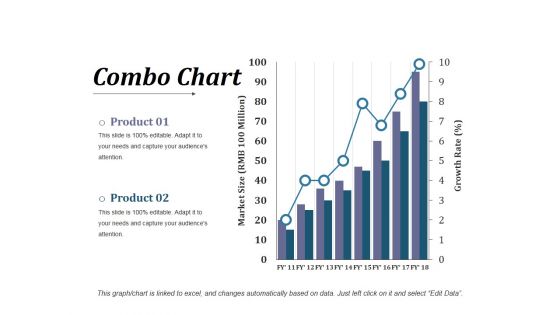
Combo Chart Ppt PowerPoint Presentation Infographic Template Visuals
This is a combo chart ppt powerpoint presentation infographic template visuals. This is a three stage process. The stages in this process are business, finance, strategy, analysis, combo chart.
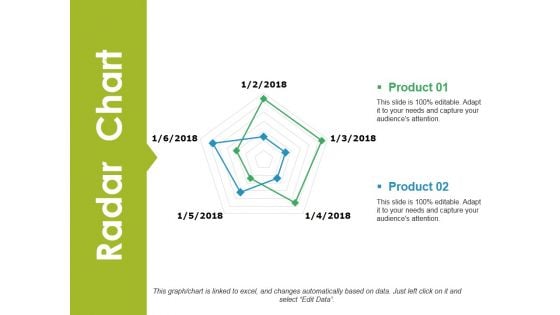
Radar Chart Ppt PowerPoint Presentation Infographic Template Tips
This is a radar chart ppt powerpoint presentation infographic template tips. This is a two stage process. The stages in this process are radar chart, business, finance, analysis, strategy.
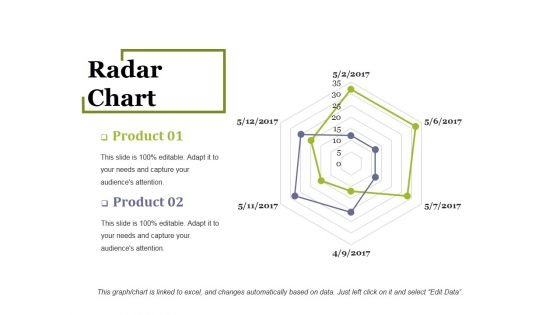
Radar Chart Ppt PowerPoint Presentation Infographic Template Outline
This is a radar chart ppt powerpoint presentation infographic template outline. This is a two stage process. The stages in this process are radar chart, finance, analysis, management, business.
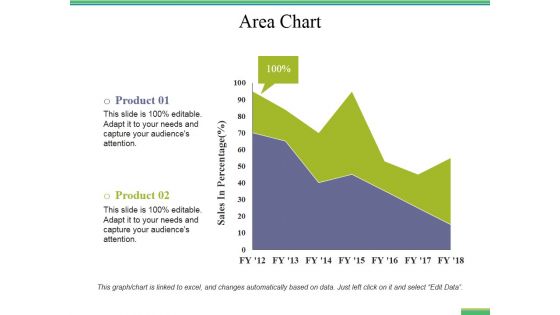
Area Chart Ppt PowerPoint Presentation Portfolio Graphics Template
This is a area chart ppt powerpoint presentation portfolio graphics template. This is a two stage process. The stages in this process are area chart, finance, analysis, business, marketing.
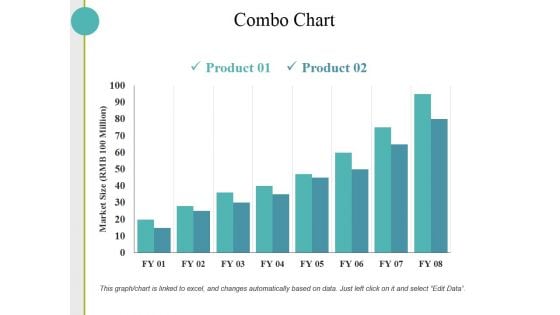
Combo Chart Ppt PowerPoint Presentation Layouts Design Templates
This is a combo chart ppt powerpoint presentation layouts design templates. This is a two stage process. The stages in this process are combo chart, finance, marketing, strategy, analysis, business.
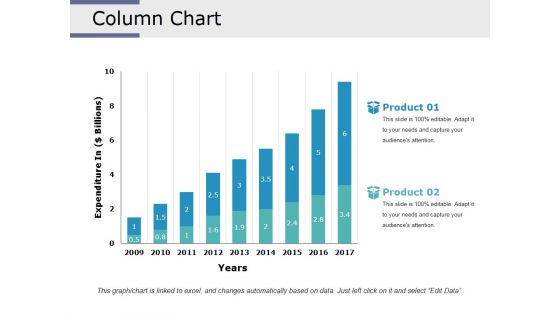
Column Chart Ppt PowerPoint Presentation Infographic Template Designs Download
This is a column chart ppt powerpoint presentation infographic template designs download. This is a two stage process. The stages in this process are column chart, analysis, finance, marketing, strategy, business.
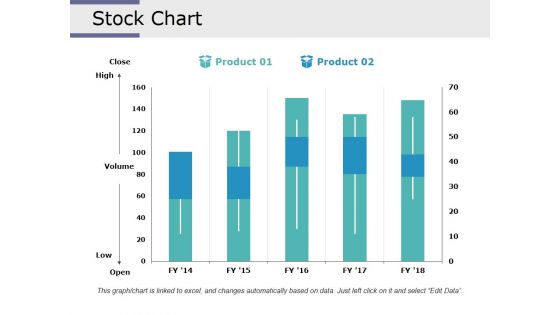
Stock Chart Ppt PowerPoint Presentation Infographic Template Design Inspiration
This is a stock chart ppt powerpoint presentation infographic template design inspiration. This is a two stage process. The stages in this process are stock chart, finance, analysis, business, marketing.
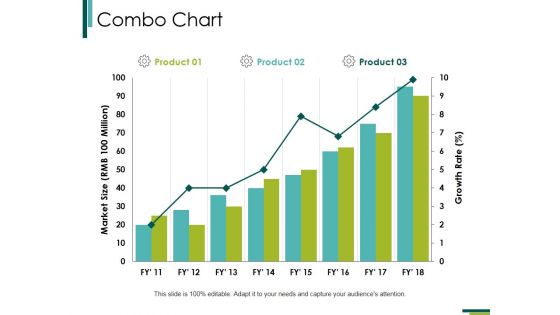
Combo Chart Ppt PowerPoint Presentation Infographic Template Slide Portrait
This is a combo chart ppt powerpoint presentation infographic template slide portrait. This is a three stage process. The stages in this process are combo chart, finance, marketing, strategy, business, growth.
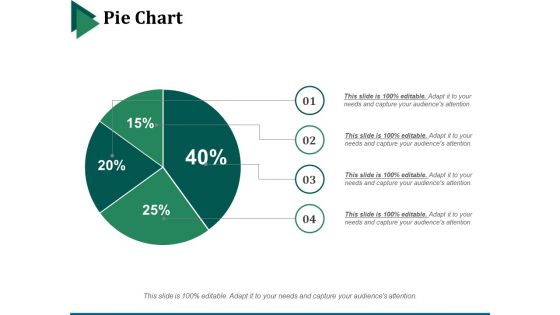
Pie Chart Ppt PowerPoint Presentation Infographic Template Backgrounds
This is a pie chart ppt powerpoint presentation infographic template backgrounds. This is a four stage process. The stages in this process are pie chart, marketing, strategy, finance, analysis.
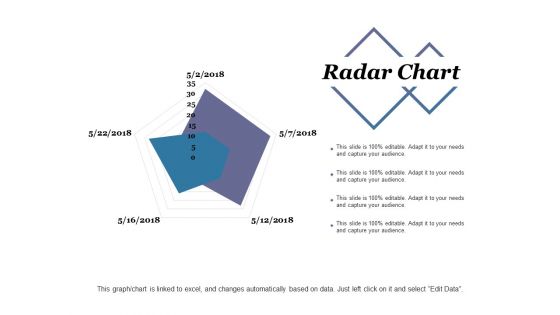
Radar Chart Ppt PowerPoint Presentation Infographic Template Sample
This is a radar chart ppt powerpoint presentation infographic template sample. This is a two stage process. The stages in this process are radar chart, finance, marketing, strategy, analysis.
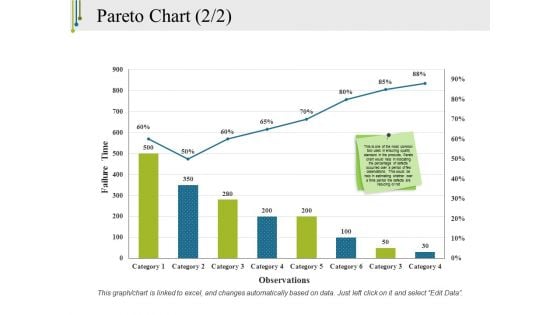
Pareto Chart Template 2 Ppt PowerPoint Presentation Outline Model
This is a pareto chart template 2 ppt powerpoint presentation outline model. This is a eight stage process. The stages in this process are pareto chart, finance, marketing, strategy, analysis.
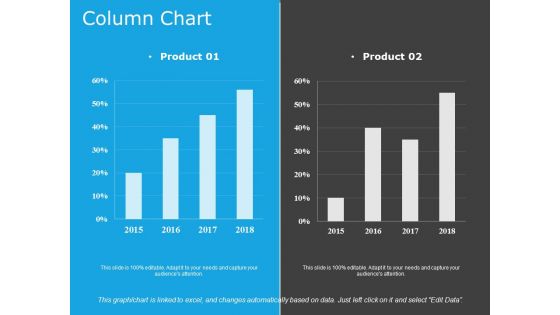
Column Chart Template 1 Ppt PowerPoint Presentation Portfolio Format
This is a column chart template 1 ppt powerpoint presentation portfolio format. This is a two stage process. The stages in this process are column chart, finance, marketing, strategy, business.
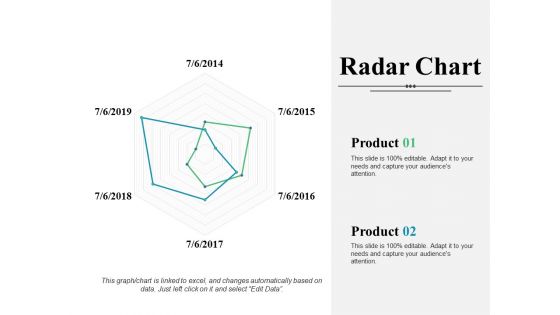
Radar Chart Ppt PowerPoint Presentation Infographic Template Introduction
This is a radar chart ppt powerpoint presentation infographic template introduction. This is a two stage process. The stages in this process are radar chart, finance, marketing, strategy, analysis, business.

Area Chart Ppt PowerPoint Presentation Infographic Template Designs
This is a area chart ppt powerpoint presentation infographic template designs. This is a two stage process. The stages in this process are area chart, finance, marketing, strategy, business.
Rader Chart Ppt PowerPoint Presentation Icon Graphic Tips
This is a rader chart ppt powerpoint presentation icon graphic tips. This is a two stage process. The stages in this process are rader chart, finance, analysis, business, marketing.
Rader Chart Ppt PowerPoint Presentation Icon Slide Portrait
This is a rader chart ppt powerpoint presentation icon slide portrait. This is a two stage process. The stages in this process are rader chart, business, analysis, finance, marketing.
Column Chart Ppt PowerPoint Presentation Icon Clipart Images
This is a column chart ppt powerpoint presentation icon clipart images. This is a two stage process. The stages in this process are column chart, finance, marketing, strategy, business.
Scatter Bubble Chart Ppt PowerPoint Presentation Model Icon
This is a scatter bubble chart ppt powerpoint presentation model icon. This is a three stage process. The stages in this process are finance, business, management, marketing, chart and graph.


 Continue with Email

 Home
Home


