Cost Chart
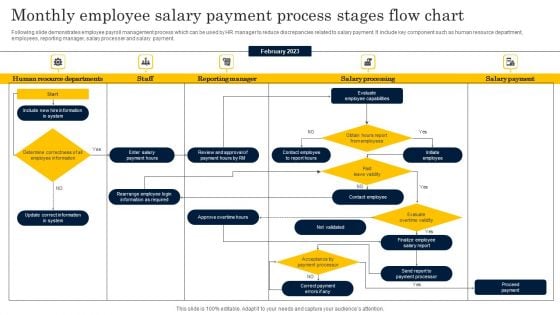
Monthly Employee Salary Payment Process Stages Flow Chart Structure PDF
Following slide demonstrates employee payroll management process which can be used by HR manager to reduce discrepancies related to salary payment. It include key component such as human resource department, employees, reporting manager, salary processer and salary payment. Presenting Monthly Employee Salary Payment Process Stages Flow Chart Structure PDF to dispense important information. This template comprises one stages. It also presents valuable insights into the topics including Human Resource Departments, Reporting Manager, Salary Processing . This is a completely customizable PowerPoint theme that can be put to use immediately. So, download it and address the topic impactfully.
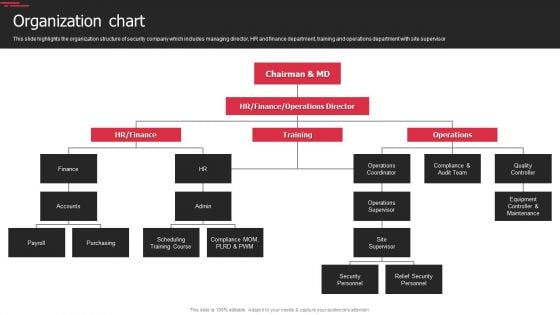
Security Agency Business Profile Organization Chart Topics PDF
This slide highlights the organization structure of security company which includes managing director, HR and finance department, training and operations department with site supervisor. This is a Security Agency Business Profile Organization Chart Topics PDF template with various stages. Focus and dispense information on six stages using this creative set, that comes with editable features. It contains large content boxes to add your information on topics like Operations Supervisor, Security Personnel, Relief Security Personnel. You can also showcase facts, figures, and other relevant content using this PPT layout. Grab it now.
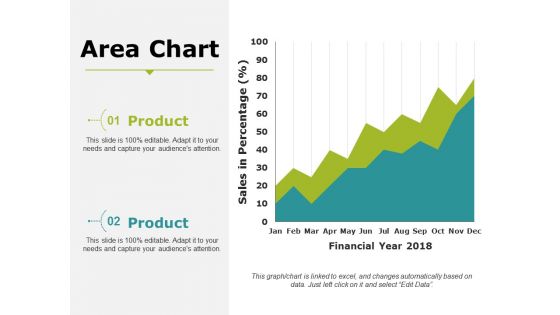
Area Chart Ppt PowerPoint Presentation Infographic Template Portrait
This is a area chart ppt powerpoint presentation infographic template portrait. This is a two stage process. The stages in this process are business, marketing, strategy, planning, finance.
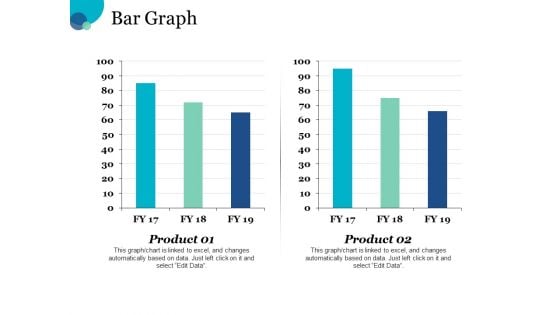
Bar Graph Chart Ppt PowerPoint Presentation Portfolio Templates
This is a bar graph chart ppt powerpoint presentation portfolio templates. This is a two stage process. The stages in this process are financial, minimum, medium, maximum.
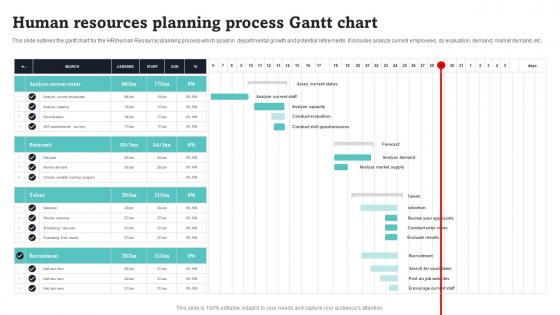
Human Resources Planning Process Gantt Chart Portrait Pdf
This slide outlines the gantt chart for the HRhuman Resource planning process which assist in departmental growth and potential retirements. It includes analyze current employees, do evaluation, demand, market demand, etc. Pitch your topic with ease and precision using this Human Resources Planning Process Gantt Chart Portrait Pdf. This layout presents information on Analyze Current Status, Forecast, Talent. It is also available for immediate download and adjustment. So, changes can be made in the color, design, graphics or any other component to create a unique layout. This slide outlines the gantt chart for the HRhuman Resource planning process which assist in departmental growth and potential retirements. It includes analyze current employees, do evaluation, demand, market demand, etc.
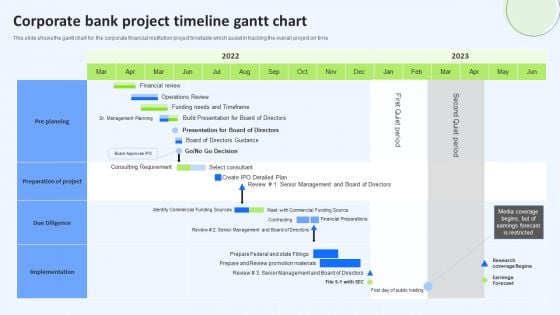
Corporate Bank Project Timeline Gantt Chart Infographics PDF
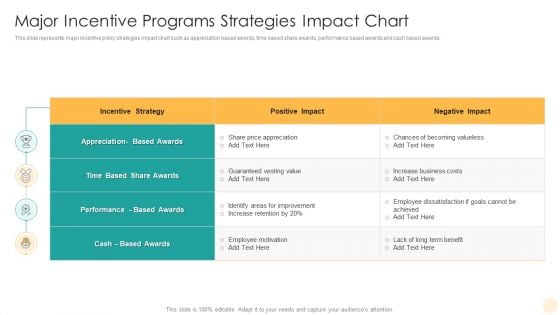
Major Incentive Programs Strategies Impact Chart Pictures PDF
This slide represents major incentive policy strategies impact chart such as appreciation based awards, time based share awards, performance based awards and cash based awards. Showcasing this set of slides titled Major Incentive Programs Strategies Impact Chart Pictures PDF. The topics addressed in these templates are Incentive Strategy, Share Price Appreciation, Employee Motivation. All the content presented in this PPT design is completely editable. Download it and make adjustments in color, background, font etc. as per your unique business setting.
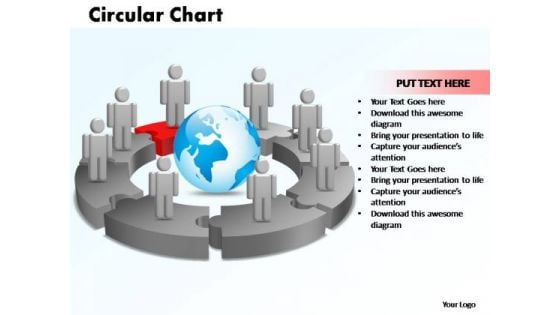
PowerPoint Designs Circular Chart With Globe Ppt Layouts
PowerPoint Designs Circular Chart With Globe PPT Layouts-The Circle of Life - a concept emmbedded in our minds and hence easy to comprehend. Life and Business is made up of processes comprising stages that flow from one to another. An excellent graphic to attract the attention of and understanding by your audience to improve earnings.-PowerPoint Designs Circular Chart With Globe PPT Layouts Crush your competition with our PowerPoint Designs Circular Chart With Globe Ppt Layouts. Just download, type and present.
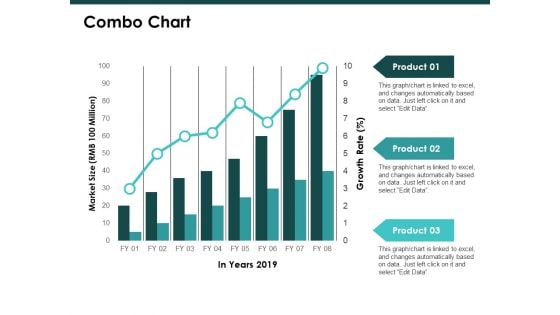
Combo Chart Graph Ppt PowerPoint Presentation Inspiration Template
This is a combo chart graph ppt powerpoint presentation inspiration template. This is a three stage process. The stages in this process are finance, marketing, management, investment, analysis.
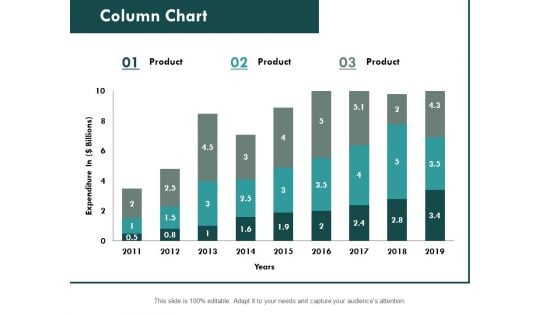
Column Chart Graph Ppt PowerPoint Presentation Slides File Formats
This is a combo chart bar ppt powerpoint presentation slides portfolio. This is a three stage process. The stages in this process are finance, marketing, analysis, investment, million.
Column Chart Marketing Ppt Powerpoint Presentation Icon Diagrams
This is a column chart marketing ppt powerpoint presentation icon diagrams. This is a three stage process. The stages in this process are finance, marketing, management, investment, analysis.
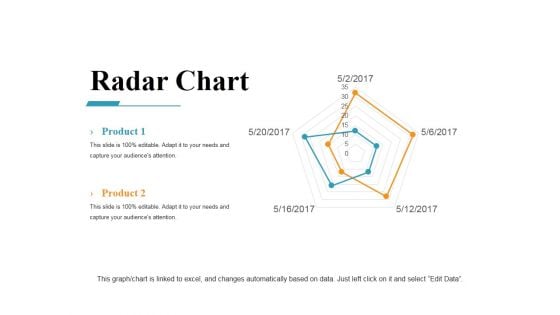
Radar Chart Ppt PowerPoint Presentation Ideas Master Slide
This is a radar chart ppt powerpoint presentation ideas master slide. This is a five stage process. The stages in this process are radar, business, marketing, strategy, finance.
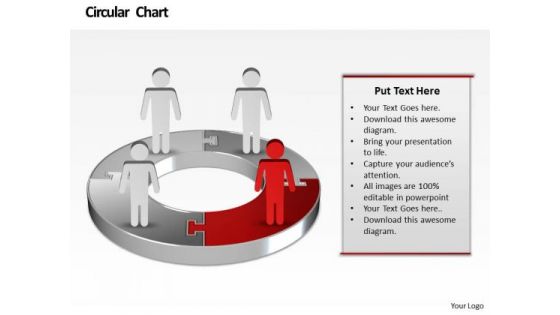
Ppt Illustration Of Financial Pie Chart Marketing Presentation PowerPoint Templates
PPT illustration of financial pie chart marketing presentation powerpoint Templates-You have the people in place, selected the team leaders and all are raring to go. You have the plans ready for them to absorb and understand. Educate your team with your thoughts and logic. -PPT illustration of financial pie chart marketing presentation powerpoint Templates-Abstract, Access, Arrow, Background, Business, Chart, Circle, Concept, Conceptual, Connection, Corporate, Creative, Cycle, Design, Different, Element, Empty, Form, Frame, Graphic, Group, Idea, Illustration, Part, Piece, Place, Process, Red, Shapes, Solution, Special, Speech, Strategy, Symbol Our Ppt Illustration Of Financial Pie Chart Marketing Presentation PowerPoint Templates can be aesthetically appealing. Expose your audience to the art of beauty.
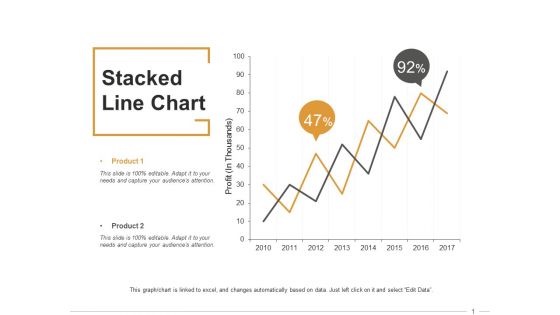
Stacked Line Chart Ppt PowerPoint Presentation Inspiration Format
This is a stacked line chart ppt powerpoint presentation inspiration format. This is a two stage process. The stages in this process are finance, marketing, management, investment, analysis.
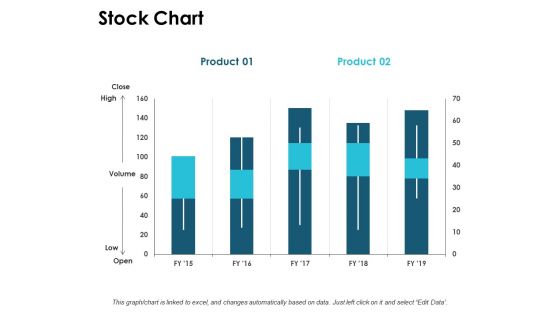
Stock Chart Graph Ppt PowerPoint Presentation Ideas Demonstration
This is a stock chart graph ppt powerpoint presentation ideas demonstration. This is a three stage process. The stages in this process are finance, marketing, management, investment, analysis.
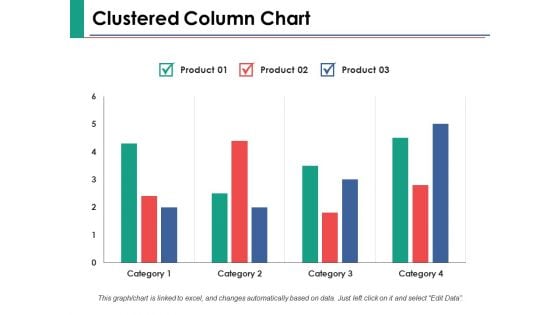
Clustered Column Chart Ppt PowerPoint Presentation Show Samples
This is a clustered column chart ppt powerpoint presentation show samples. This is a three stage process. The stages in this process are finance, marketing, management, investment, analysis.
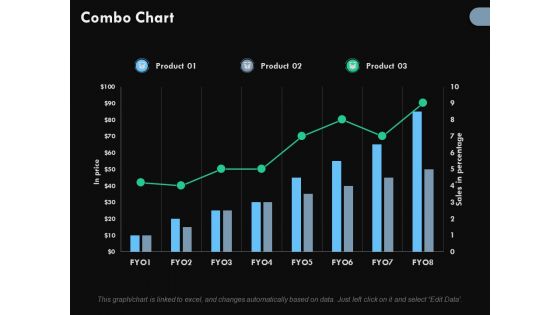
Combo Chart Ppt PowerPoint Presentation Infographic Template Maker
This is a combo chart ppt powerpoint presentation infographic template maker. This is a three stage process. The stages in this process are business, finance, growth, investment, marketing.
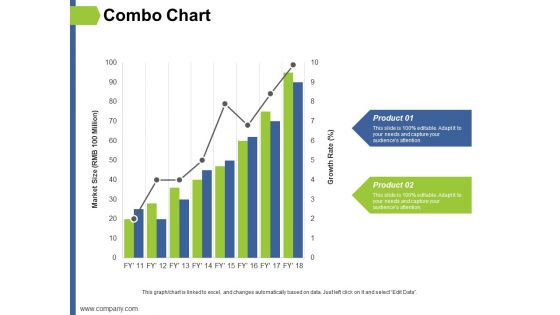
Combo Chart Ppt PowerPoint Presentation Layouts Example Topics
This is a combo chart ppt powerpoint presentation layouts example topics. This is a two stage process. The stages in this process are finance, marketing, management, investment, analysis.
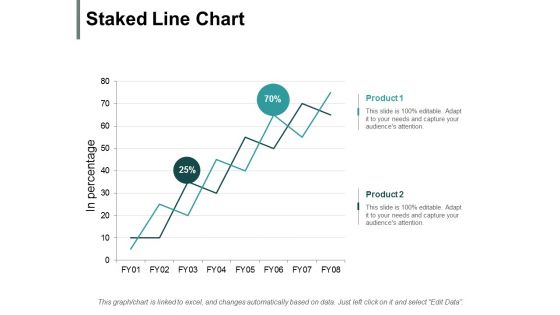
Staked Line Chart Ppt PowerPoint Presentation Ideas Influencers
This is a staked line chart ppt powerpoint presentation ideas influencers. This is a two stage process. The stages in this process are finance, marketing, management, investment, analysis.
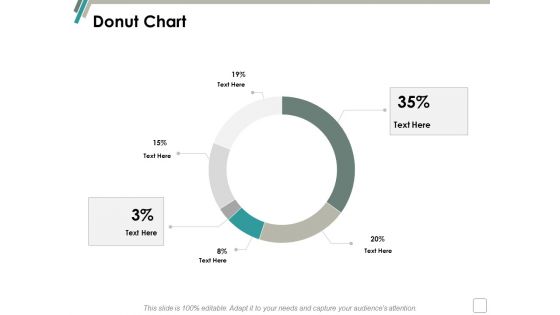
Donut Chart Management Ppt Powerpoint Presentation Slides Aids
This is a donut chart management ppt powerpoint presentation slides aids. This is a six stage process. The stages in this process are finance, marketing, management, investment, analysis.
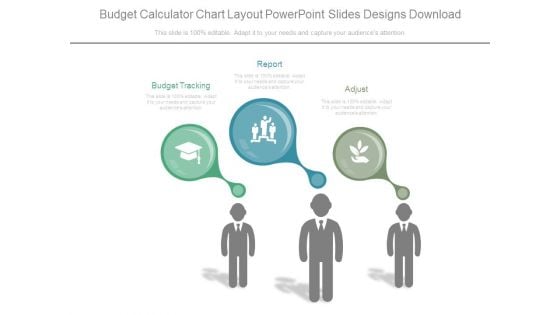
Budget Calculator Chart Layout Powerpoint Slides Designs Download
This is a budget calculator chart layout powerpoint slides designs download. This is a three stage process. The stages in this process are budget tracking, report, adjust.
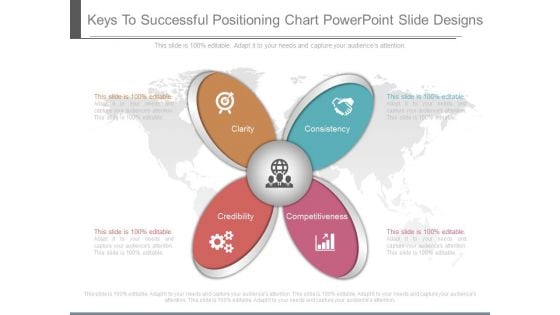
Keys To Successful Positioning Chart Powerpoint Slide Designs
This is a keys to successful positioning chart powerpoint slide designs. This is a four stage process. The stages in this process are clarity, consistency, credibility, competitiveness.
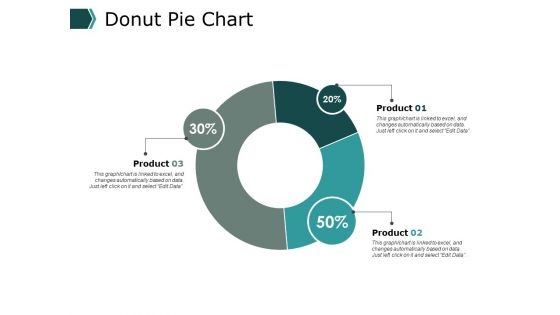
Donut Pie Chart Ppt PowerPoint Presentation Model Deck
This is a donut pie chart ppt powerpoint presentation model deck. This is a three stage process. The stages in this process are finance, marketing, management, investment, analysis.
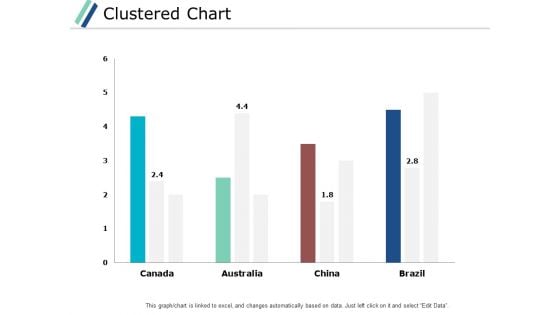
Clustered Chart Graph Ppt PowerPoint Presentation Gallery Backgrounds
This is a clustered chart graph ppt powerpoint presentation gallery backgrounds. This is a three stage process. The stages in this process are finance, marketing, analysis, investment, million.
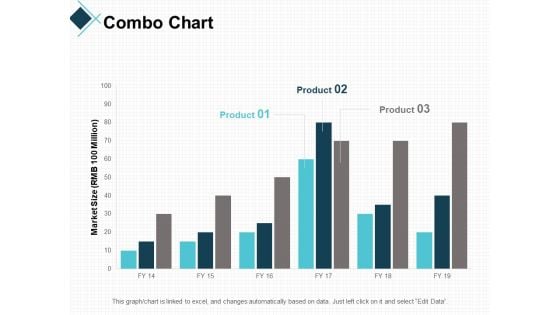
Combo Chart Graph Ppt PowerPoint Presentation Professional Guidelines
This is a combo chart graph ppt powerpoint presentation professional guidelines. This is a three stage process. The stages in this process are finance, marketing, analysis, investment, million.
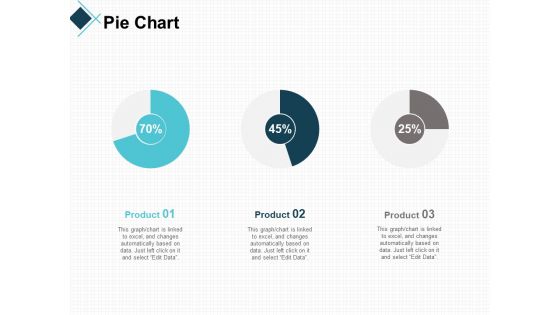
Pie Chart Bar Ppt PowerPoint Presentation Layouts Examples
This is a pie chart bar ppt powerpoint presentation layouts examples. This is a three stage process. The stages in this process are finance, marketing, analysis, investment, million.
Modern Marketing Concepts 3d Team Meeting Budget Pie Chart Characters
Good Camaraderie Is A Key To Teamwork. Our modern marketing concepts 3d team meeting budget pie chart characters Powerpoint Templates Can Be A Cementing Force.
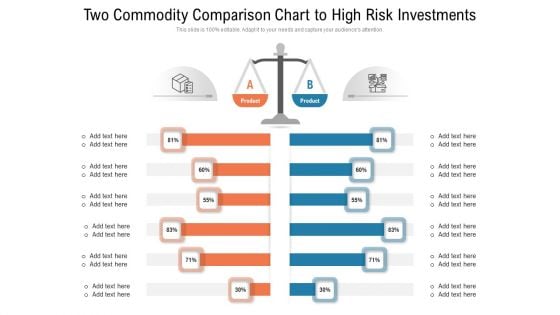
Two Commodity Comparison Chart To High Risk Investments Designs PDF
Presenting two commodity comparison chart to high risk investments designs pdf to dispense important information. This template comprises two stages. It also presents valuable insights into the topics including two commodity comparison chart to high risk investments. This is a completely customizable PowerPoint theme that can be put to use immediately. So, download it and address the topic impactfully.
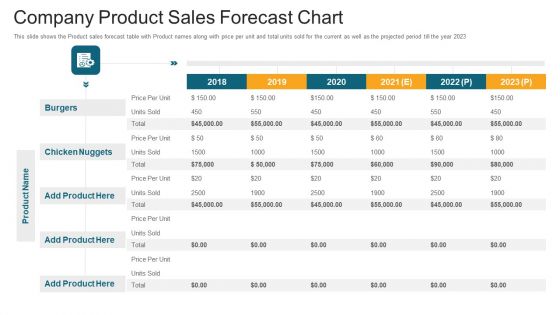
Company Product Sales Forecast Chart Ppt File Slide Portrait PDF
This slide shows the Product sales forecast table with Product names along with price per unit and total units sold for the current as well as the projected period till the year 2023. Deliver an awe inspiring pitch with this creative company product sales forecast chart ppt file slide portrait pdf bundle. Topics like company product sales forecast chart can be discussed with this completely editable template. It is available for immediate download depending on the needs and requirements of the user.
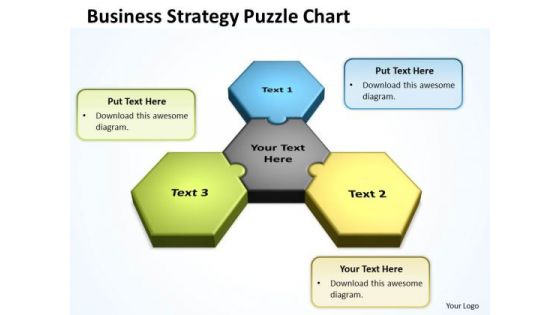
Business Finance Strategy Development Business Chart Marketing Diagram
Document The Process On Our Business Finance Strategy Development Business Chart Marketing Diagram Powerpoint Templates. Make A Record Of Every Detail.
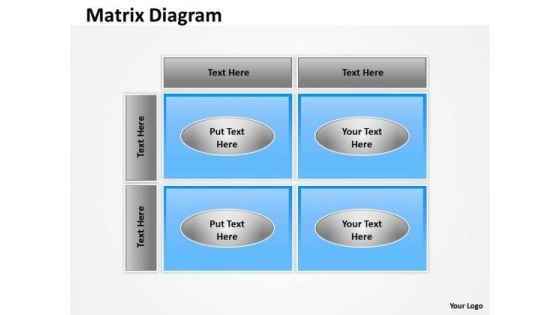
Business Finance Strategy Development Arrangement Chart Diagram Sales Diagram
Put In A Dollop Of Our Business Finance Strategy Development Arrangement Chart Diagram Sales Diagram Powerpoint Templates. Give Your Thoughts A Distinctive Flavor.
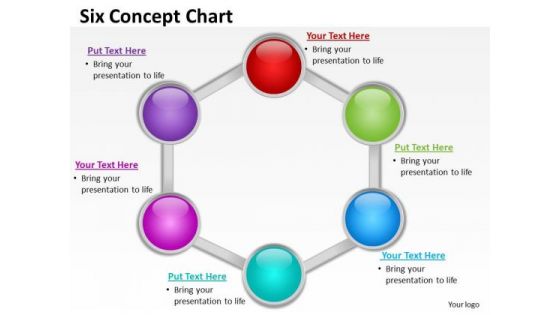
Sales Diagram Six Concept Diagrams Chart Business Finance Strategy Development
Your Listeners Will Never Doodle. Our Sales Diagram Six Concept Diagrams Chart Business Finance Strategy Development Powerpoint Templates Will Hold Their Concentration.
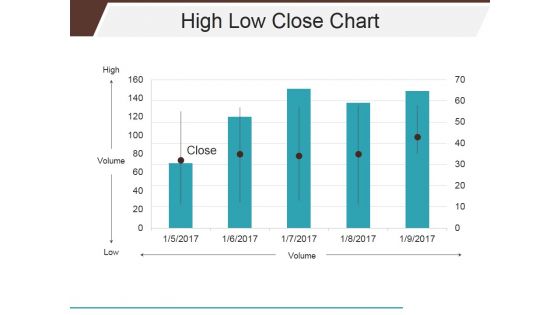
High Low Close Chart Ppt PowerPoint Presentation Infographics Shapes
This is a high low close chart ppt powerpoint presentation infographics shapes. This is a five stage process. The stages in this process are close, volume, high, low.
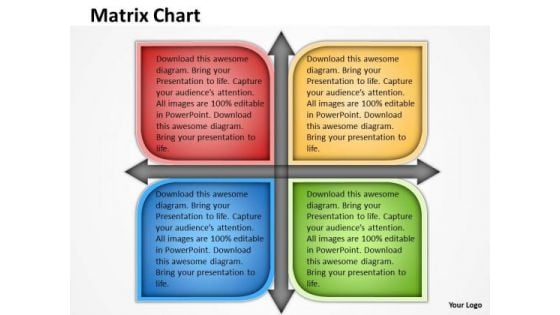
Business Finance Strategy Development Matrix Chart Business Diagram
Get The Domestics Right With Our Business Finance Strategy Development Matrix Chart Business Diagram Powerpoint Templates. Create The Base For Thoughts To Grow.
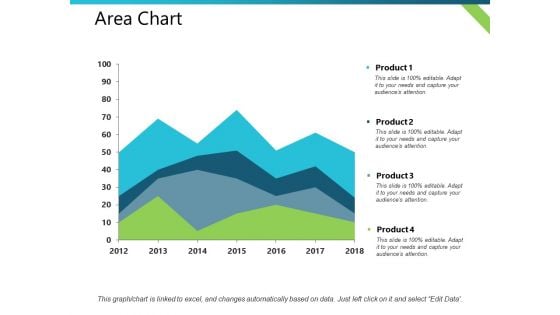
Area Chart Product Finance Ppt PowerPoint Presentation Guide
This is a area chart product finance ppt powerpoint presentation guide. This is a four stage process. The stages in this process are business, management, financial, marketing, sales.
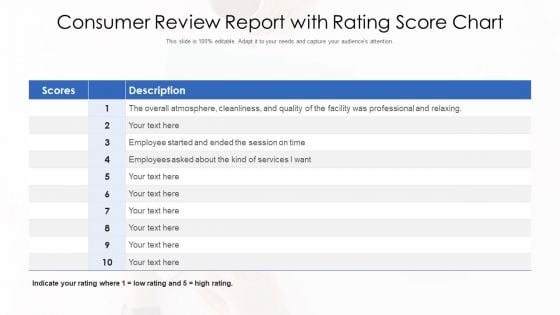
Consumer Review Report With Rating Score Chart Ppt Slide PDF
Pitch your topic with ease and precision using this consumer review report with rating score chart ppt slide pdf. This layout presents information on consumer review report with rating score chart. It is also available for immediate download and adjustment. So, changes can be made in the color, design, graphics or any other component to create a unique layout.
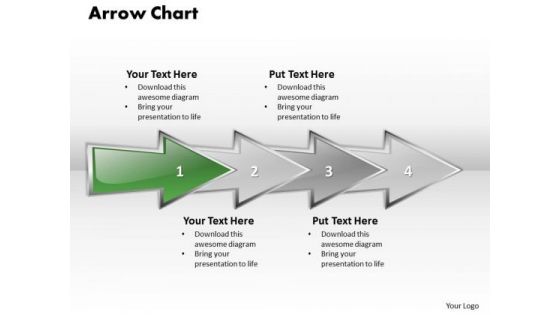
Ppt Linear Abstraction Arrow Gantt Chart PowerPoint Template Templates
PPT linear abstraction arrow gantt chart powerpoint template Templates-You have the ideas and plans on how to go about it. Use this diagram to illustrate your method step by step and interlock the whole process in the minds of your team and motivate them to cross all barriers.-PPT linear abstraction arrow gantt chart powerpoint template Templates-analysis, arrow, background, business, chart, communication, concept, construction, delivery, design, development, engineering, fabrication, feasibiliti, generated, growth, idea, industry, making, production, products, science, sequence, shape Crush your competition with our Ppt Linear Abstraction Arrow Gantt Chart PowerPoint Template Templates. Just download, type and present.
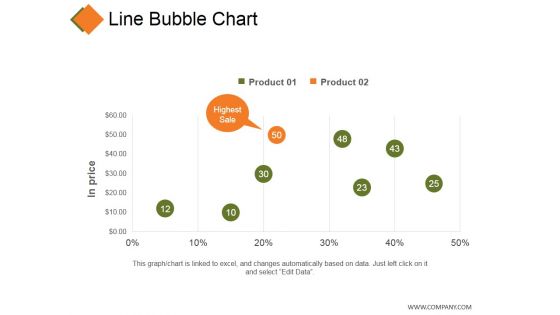
Line Bubble Chart Ppt PowerPoint Presentation Professional Infographic Template
This is a line bubble chart ppt powerpoint presentation professional infographic template. This is a five stage process. The stages in this process are product, in price, highest sale, business, finance.
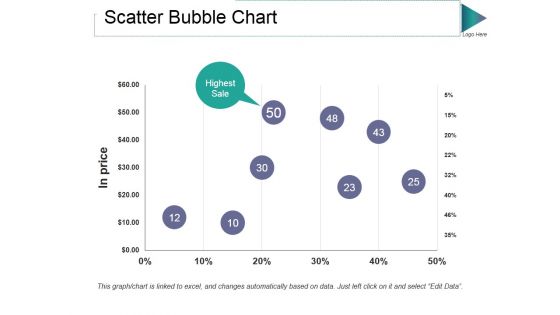
Scatter Bubble Chart Ppt PowerPoint Presentation Gallery Guidelines
This is a scatter bubble chart ppt powerpoint presentation gallery guidelines. This is a one stage process. The stages in this process are in price, highest sale, percentage, finance, business.
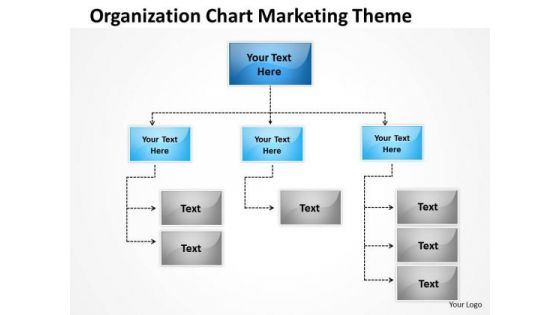
Organization Chart Marketing Theme Ppt Linear Flow Rate PowerPoint Slides
We present our organization chart marketing theme ppt linear flow rate PowerPoint Slides.Use our Advertising PowerPoint Templates because You are working at that stage with an air of royalty. Let our PowerPoint Templates and Slides be the jewels in your crown. Download and present our Competition PowerPoint Templates because our PowerPoint Templates and Slides are the string of your bow. Fire of your ideas and conquer the podium. Use our Boxes PowerPoint Templates because These PowerPoint Templates and Slides will give the updraft to your ideas. See them soar to great heights with ease. Use our Process and Flows PowerPoint Templates because Our PowerPoint Templates and Slides will let you Hit the right notes. Watch your audience start singing to your tune. Download and present our Business PowerPoint Templates because You aspire to touch the sky with glory. Let our PowerPoint Templates and Slides provide the fuel for your ascent.Use these PowerPoint slides for presentations relating to Chart, flow, organization, flowchart, box, vector, chain, information, 3d, network, isolated, program, business, blank, plan, concept, arrow, sign, teamwork, symbol, organisation, diagram, circle, graphic, process, workflow, technology, shape, management, graph, connection, solution, design, colorful, empty, procedure, connect, organize, background, work, structure, block. The prominent colors used in the PowerPoint template are Blue, Gray, Black. Cut the cloth with our Organization Chart Marketing Theme Ppt Linear Flow Rate PowerPoint Slides. Make your thoughts the fashion of the day.
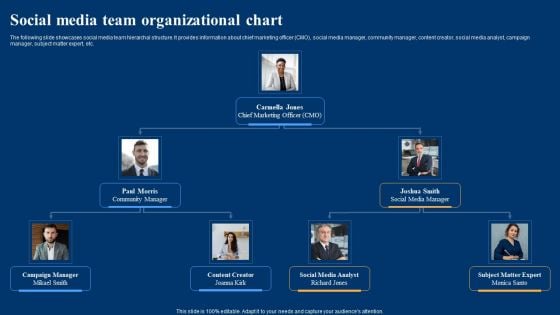
Optimizing Social Networks Social Media Team Organizational Chart Brochure PDF
The following slide showcases social media team hierarchal structure. It provides information about chief marketing officer CMO, social media manager, community manager, content creator, social media analyst, campaign manager, subject matter expert, etc. Slidegeeks has constructed Optimizing Social Networks Social Media Team Organizational Chart Brochure PDF after conducting extensive research and examination. These presentation templates are constantly being generated and modified based on user preferences and critiques from editors. Here, you will find the most attractive templates for a range of purposes while taking into account ratings and remarks from users regarding the content. This is an excellent jumping-off point to explore our content and will give new users an insight into our top-notch PowerPoint Templates.
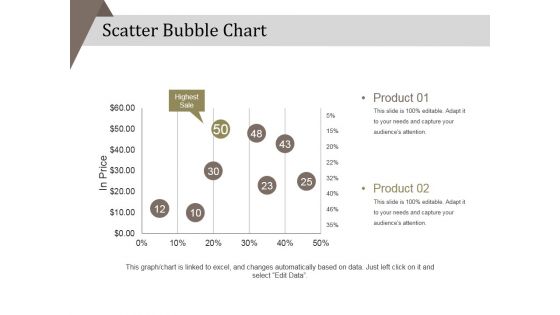
Scatter Bubble Chart Ppt PowerPoint Presentation Diagram Ppt
This is a scatter bubble chart ppt powerpoint presentation diagram ppt. This is a two stage process. The stages in this process are product, in price, highest sale, percentage, business, marketing.
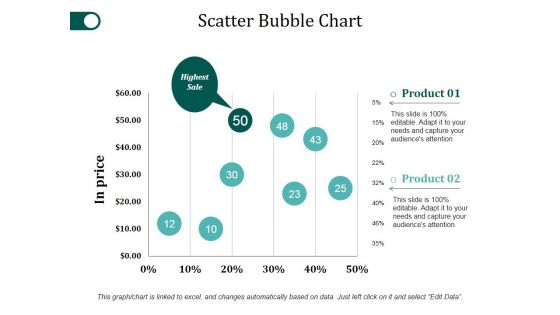
Scatter Bubble Chart Ppt PowerPoint Presentation Styles Objects
This is a scatter bubble chart ppt powerpoint presentation styles objects. This is a two stage process. The stages in this process are product, in price, highest sale, percentage, finance.
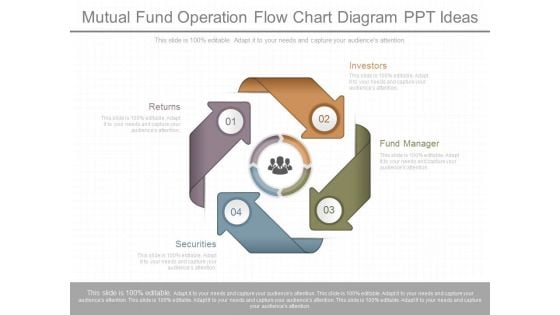
Mutual Fund Operation Flow Chart Diagram Ppt Ideas
This is a mutual fund operation flow chart diagram ppt ideas. This is a four stage process. The stages in this process are returns, securities, investors, fund manager.
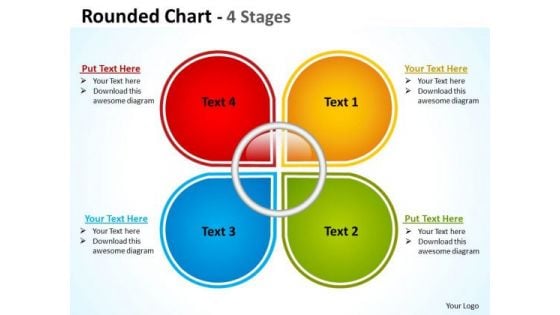
Marketing Diagram Rounded Chart With 4 Stages Strategic Management
Your Grasp Of Economics Is Well Known. Help Your Audience Comprehend Issues With Our Marketing Diagram Rounded Chart With 4 Stages Strategic Management Powerpoint Templates.
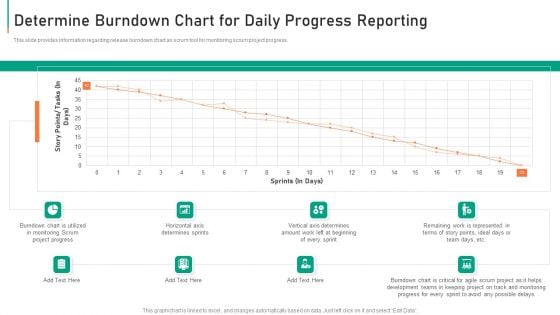
Determine Burndown Chart For Daily Progress Reporting Diagrams PDF
This slide provides information regarding release burndown chart as scrum tool for monitoring scrum project progress. Deliver and pitch your topic in the best possible manner with this determine burndown chart for daily progress reporting diagrams pdf. Use them to share invaluable insights on determine burndown chart for daily progress reporting and impress your audience. This template can be altered and modified as per your expectations. So, grab it now.
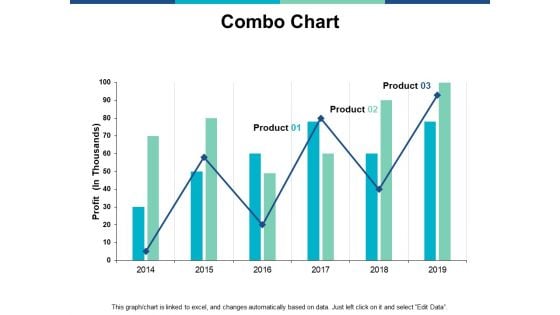
Combo Chart Graph Ppt PowerPoint Presentation Infographics Guide
This is a combo chart graph ppt powerpoint presentation infographics guide. This is a two stage process. The stages in this process are marketing, business, management, planning, strategy.
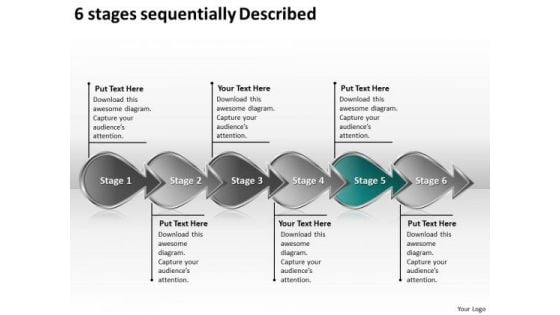
6 Stages Sequentially Described Strategic Planning Flow Chart PowerPoint Slides
We present our 6 stages sequentially described strategic planning flow chart PowerPoint Slides.Download and present our Arrows PowerPoint Templates because you can Refine them all as you take them through the numerous filtering stages of the funnel of your quality control process. Use our Business PowerPoint Templates because project your ideas to you colleagues and complete the full picture. Use our Competition PowerPoint Templates because it shows various choices to be made. Present our Design PowerPoint Templates because Our PowerPoint Templates and Slides will Embellish your thoughts. They will help you illustrate the brilliance of your ideas. Use our Shapes PowerPoint Templates because Our PowerPoint Templates and Slides offer you the needful to organise your thoughts. Use them to list out your views in a logical sequence.Use these PowerPoint slides for presentations relating to arrow, arrows, block, business, chart, design, development, diagram, direction, element, flow, flowchart, graph, linear, management, organization, process, program, section, sign, solution, symbol. The prominent colors used in the PowerPoint template are Green, Gray, Black. Professionals tell us our 6 stages sequentially described strategic planning flow chart PowerPoint Slides are Romantic. The feedback we get is that our business PowerPoint templates and PPT Slides are Festive. We assure you our 6 stages sequentially described strategic planning flow chart PowerPoint Slides are Attractive. Customers tell us our chart PowerPoint templates and PPT Slides will make you look like a winner. Presenters tell us our 6 stages sequentially described strategic planning flow chart PowerPoint Slides are Fun. People tell us our business PowerPoint templates and PPT Slides are topically designed to provide an attractive backdrop to any subject. Go aerial with our 6 Stages Sequentially Described Strategic Planning Flow Chart PowerPoint Slides. Give them a bird's eye view of the conditions.
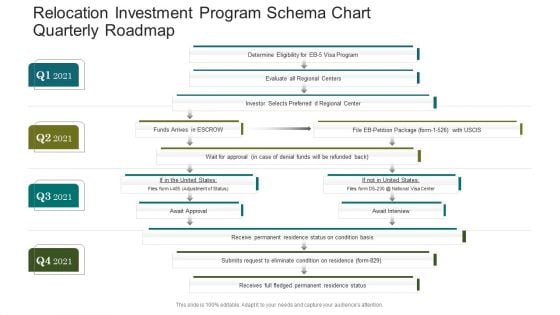
Relocation Investment Program Schema Chart Quarterly Roadmap Diagrams
Presenting the relocation investment program schema chart quarterly roadmap diagrams. The template includes a roadmap that can be used to initiate a strategic plan. Not only this, the PowerPoint slideshow is completely editable and you can effortlessly modify the font size, font type, and shapes according to your needs. This PPT slide can be easily reached in standard screen and widescreen aspect ratios. The set is also available in various formats like PDF, PNG, and JPG. So download and use it multiple times as per your knowledge.
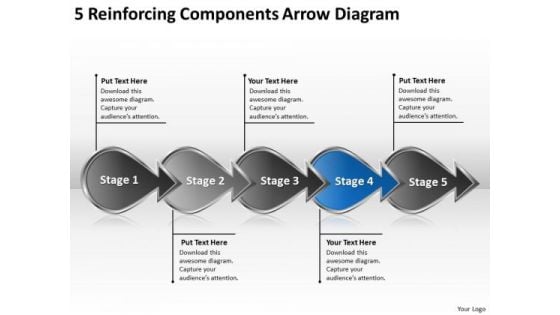
5 Reinforcing Components Arrow Diagram Chart Business Prototyping PowerPoint Slides
We present our 5 reinforcing components arrow diagram chart business prototyping PowerPoint Slides.Use our Arrows PowerPoint Templates because it shows the pyramid which is a symbol of the desire to reach the top in a steady manner. Present our Business PowerPoint Templates because watch the excitement levels rise as they realise their worth. Download and present our Competition PowerPoint Templates because you know your business and have a vision for it. Use our Design PowerPoint Templates because your business and plans for its growth consist of processes that are highly co-related. Download and present our Shapes PowerPoint Templates because the atmosphere in the worplace is electric.Use these PowerPoint slides for presentations relating to arrow, arrows, block, business, chart, design, development, diagram, direction, element, flow, flowchart, graph, linear, management, organization, process, program, section, sign, solution, symbol. The prominent colors used in the PowerPoint template are Blue, Gray, Black. Professionals tell us our 5 reinforcing components arrow diagram chart business prototyping PowerPoint Slides are Efficacious. The feedback we get is that our block PowerPoint templates and PPT Slides are Appealing. We assure you our 5 reinforcing components arrow diagram chart business prototyping PowerPoint Slides are designed by professionals Customers tell us our chart PowerPoint templates and PPT Slides are Fantastic. Presenters tell us our 5 reinforcing components arrow diagram chart business prototyping PowerPoint Slides are Fun. People tell us our block PowerPoint templates and PPT Slides are Nice. Be a cross-functional expertise with our 5 Reinforcing Components Arrow Diagram Chart Business Prototyping PowerPoint Slides. They will make you look good.
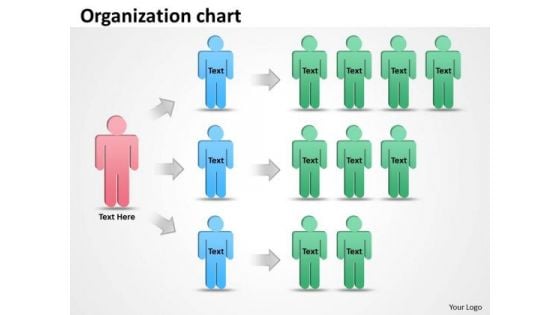
Business Finance Strategy Development Organization Staff Chart Business Cycle Diagram
Your Grasp Of Economics Is Well Known. Help Your Audience Comprehend Issues With Our Business Finance Strategy Development Organization staff chart Business Cycle Diagram Powerpoint Templates. Strike A Bargain With Our Business Finance Strategy Development Organization staff chart Business Cycle Diagram Powerpoint Templates. Your Thoughts Will Get A Winning Deal.
E Commerce Flow Chart Ppt PowerPoint Presentation Icon Gallery PDF
Presenting E Commerce Flow Chart Ppt PowerPoint Presentation Icon Gallery PDF to dispense important information. This template comprises one stages. It also presents valuable insights into the topics including E Commerce, Flow Chart. This is a completely customizable PowerPoint theme that can be put to use immediately. So, download it and address the topic impactfully.
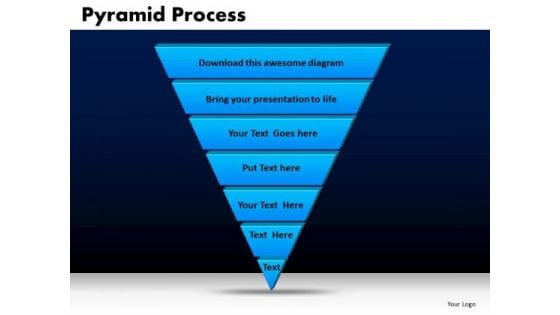
Business Triangles PowerPoint Templates Chart Pyramid Process Ppt Slides
Business Triangles PowerPoint Templates Chart Pyramid Process PPT Slides-A Pyramid Diagram may be defined as representation of data in the form of a triangle separated by horizontal lines. The widest section may contain the general topic while the narrowest section may contain a much more specific topic. -Business Triangles PowerPoint Templates Chart Pyramid Process PPT Slides-This template can be used for presentations relating to 3d, Bar, Business, Chart, Class, Conceptual, Corner, FInance, Graph, Graphic, Hierarchy, Investment, Layer, Level, Performance, Planner, Priority, Progress, Pyramid, Render, Status, Strategy, System, Triangle Earn the credits you do deserve. Answer the critics with our Business Triangles PowerPoint Templates Chart Pyramid Process Ppt Slides.
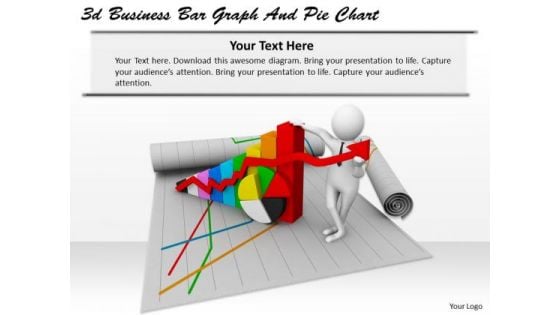
Business Intelligence Strategy 3d Bar Graph And Pie Chart Characters
Establish Your Dominion With Our Business Intelligence Strategy 3D Bar Graph And Pie Chart Characters Powerpoint Templates. Rule The Stage With Your Thoughts.
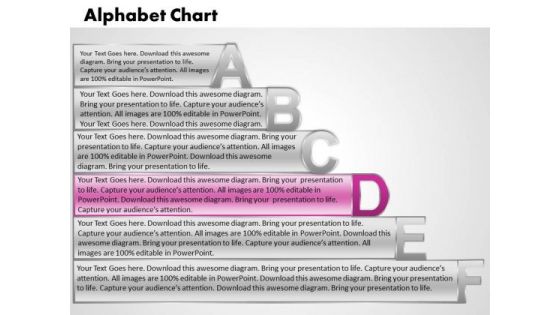
Ppt Alphabet Chart With Textboxes Business Plan PowerPoint Process Templates
PPT alpahabet chart with textboxes business plan powerpoint Process Templates-Use this Amazing PowerPoint Diagram which shows the different way to represent your text and make your Presentation more interesting and impressive to watch for Audiences.-PPT alpahabet chart with textboxes business plan powerpoint Process Templates Orient teams with our Ppt Alphabet Chart With Textboxes Business Plan PowerPoint Process Templates. Download without worries with our money back guaranteee.
Financial Planning With Investment Chart Vector Icon Inspiration PDF
Persuade your audience using this financial planning with investment chart vector icon inspiration pdf. This PPT design covers three stages, thus making it a great tool to use. It also caters to a variety of topics including financial planning with investment chart vector icon. Download this PPT design now to present a convincing pitch that not only emphasizes the topic but also showcases your presentation skills.
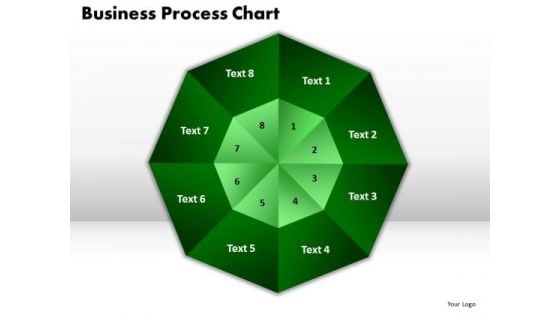
PowerPoint Template Business Process Chart Marketing Ppt Slides
PowerPoint Template Business Process Chart Marketing PPT Slides-The template offers an excellent background to build up the various stages of your business process. This PowerPoint Process Chart shows the eight Different Layers which are to be followed in any business. This Business Diagram can be used in Marketing, Banking, and Management etc. This Diagram explains eight different topics.-PowerPoint Template Business Process Chart Marketing PPT Slides Implement plans with our PowerPoint Template Business Process Chart Marketing Ppt Slides. Download without worries with our money back guaranteee.
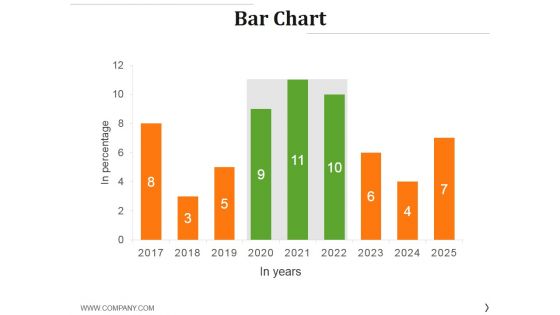
Bar Chart Ppt PowerPoint Presentation Styles Graphics Example
This is a bar chart ppt powerpoint presentation styles graphics example. This is a nine stage process. The stages in this process are graph, growth, success, business, finance.
Best Practice For Project Management Chart Ppt Icons
This is a best practice for project management chart ppt icons. This is a four stage process. The stages in this process are risk management, scope, communication, budget.
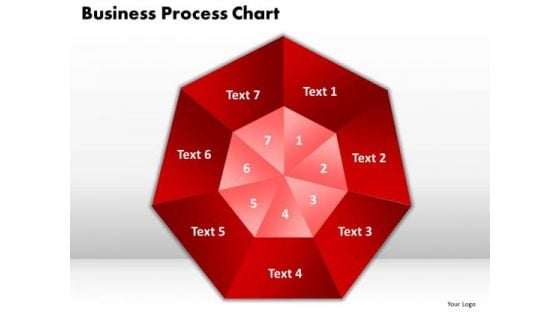
PowerPoint Process Business Process Chart Marketing Ppt Slides
PowerPoint Process Business Process Chart Marketing PPT Slides-This PowerPoint Diagram shows the seven Different Layers which should be followed in Business, Marketing and Finance. This Diagram is useful to represent seven different topics along with their Description.-PowerPoint Process Business Process Chart Marketing PPT Slides With our PowerPoint Process Business Process Chart Marketing Ppt Slides you will never be fed up. Each one is more attractive than the other.


 Continue with Email

 Home
Home


