Cost Chart
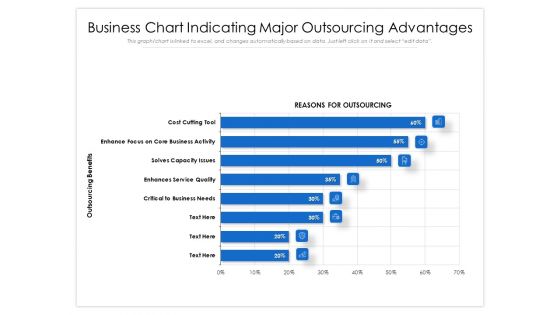
Business Chart Indicating Major Outsourcing Advantages Ppt PowerPoint Presentation File Template PDF
Showcasing this set of slides titled business chart indicating major outsourcing advantages ppt powerpoint presentation file template pdf. The topics addressed in these templates are cost, business, service. All the content presented in this PPT design is completely editable. Download it and make adjustments in color, background, font etc. as per your unique business setting.
Cash Market Investor Deck Organization Chart Diagram Of The Company Services Ppt Professional Icon PDF
The slide provides the diagram which shows ownership structure holding and subsidiary companies of the company. The structure includes holding company, sister subsidiaries and subsidiaries of our company. This is a cash market investor deck organization chart diagram of the company services ppt professional icon pdf template with various stages. Focus and dispense information on three stages using this creative set, that comes with editable features. It contains large content boxes to add your information on topics like services provider, investment company, asset management solutions, insurance operations. You can also showcase facts, figures, and other relevant content using this PPT layout. Grab it now.
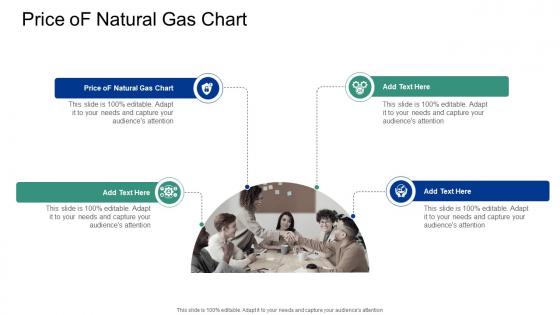
Price Of Natural Gas Chart In Powerpoint And Google Slides Cpb
Presenting our innovatively designed set of slides titled Price Of Natural Gas Chart In Powerpoint And Google Slides Cpb. This completely editable PowerPoint graphic exhibits Price Of Natural Gas Chart that will help you convey the message impactfully. It can be accessed with Google Slides and is available in both standard screen and widescreen aspect ratios. Apart from this, you can download this well structured PowerPoint template design in different formats like PDF, JPG, and PNG. So, click the download button now to gain full access to this PPT design. Our Price Of Natural Gas Chart In Powerpoint And Google Slides Cpb are topically designed to provide an attractive backdrop to any subject. Use them to look like a presentation pro.
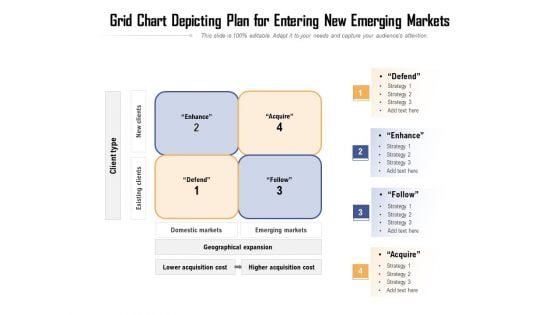
Grid Chart Depicting Plan For Entering New Emerging Markets Ppt PowerPoint Presentation File Slides PDF
Presenting grid chart depicting plan for entering new emerging markets ppt powerpoint presentation file slides pdf to dispense important information. This template comprises four stages. It also presents valuable insights into the topics including geographical expansion, acquisition, cost. This is a completely customizable PowerPoint theme that can be put to use immediately. So, download it and address the topic impactfully.
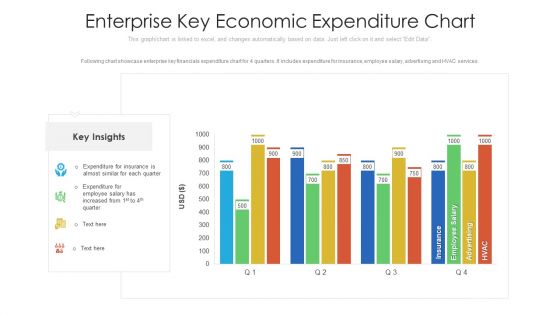
Enterprise Key Economic Expenditure Chart Ppt PowerPoint Presentation File Designs Download PDF
Following chart showcase enterprise key financials expenditure chart for 4 quarters. It includes expenditure for insurance, employee salary, advertising and HVAC services. Pitch your topic with ease and precision using this enterprise key economic expenditure chart ppt powerpoint presentation file designs download pdf. This layout presents information on enterprise key economic expenditure chart. It is also available for immediate download and adjustment. So, changes can be made in the color, design, graphics or any other component to create a unique layout.
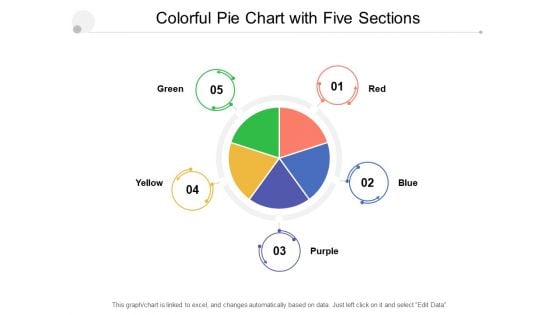
Colorful Pie Chart With Five Sections Ppt PowerPoint Presentation Show Example File
Presenting this set of slides with name colorful pie chart with five sections ppt powerpoint presentation show example file. The topics discussed in these slides are pie chart, finance, donut chart. This is a completely editable PowerPoint presentation and is available for immediate download. Download now and impress your audience.
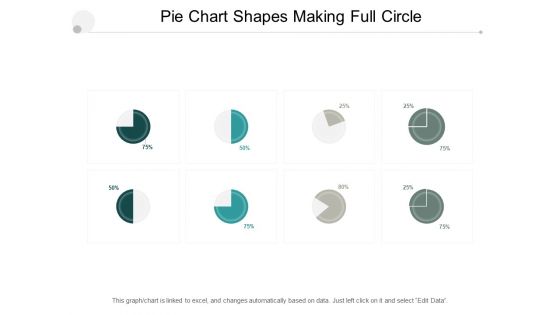
Pie Chart Shapes Making Full Circle Ppt PowerPoint Presentation Ideas Example Introduction
Presenting this set of slides with name pie chart shapes making full circle ppt powerpoint presentation ideas example introduction. The topics discussed in these slides are pie chart, finance, donut chart. This is a completely editable PowerPoint presentation and is available for immediate download. Download now and impress your audience.

Developing A Right Pricing Strategy For Business Organization Chart Ppt Pictures Portrait PDF
Presenting developing a right pricing strategy for business organization chart ppt pictures portrait pdf to provide visual cues and insights. Share and navigate important information on four stages that need your due attention. This template can be used to pitch topics like organization chart, department head, manager. In addtion, this PPT design contains high-resolution images, graphics, etc, that are easily editable and available for immediate download.
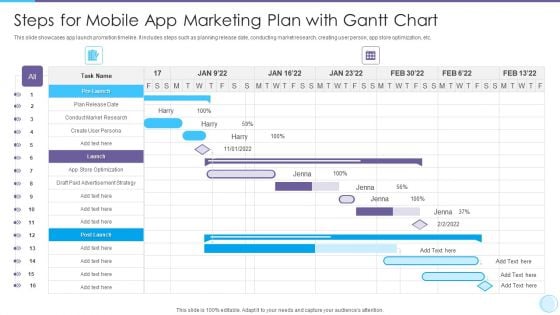
Steps For Mobile App Marketing Plan With Gantt Chart Rules PDF
Your complex projects can be managed and organized simultaneously using this detailed Steps For Mobile App Marketing Plan With Gantt Chart Rules PDF template. Track the milestones, tasks, phases, activities, and subtasks to get an updated visual of your project. Share your planning horizon and release plan with this well crafted presentation template. This exemplary template can be used to plot various dependencies to distinguish the tasks in the pipeline and their impact on the schedules and deadlines of the project. Apart from this, you can also share this visual presentation with your team members and stakeholders. It a resourceful tool that can be incorporated into your business structure. Therefore, download and edit it conveniently to add the data and statistics as per your requirement
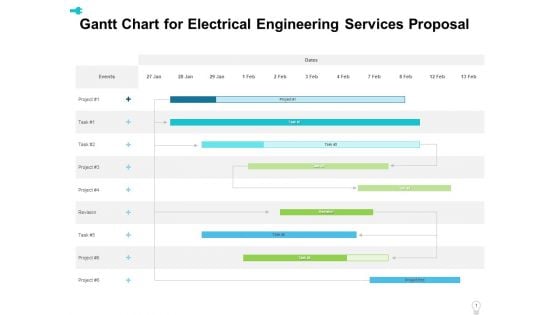
Gantt Chart For Electrical Engineering Services Proposal Ppt Layouts Layout PDF
Your complex projects can be managed and organized simultaneously using this detailed gantt chart for electrical engineering services proposal ppt layouts layout pdf template. Track the milestones, tasks, phases, activities, and subtasks to get an updated visual of your project. Share your planning horizon and release plan with this well-crafted presentation template. This exemplary template can be used to plot various dependencies to distinguish the tasks in the pipeline and their impact on the schedules and deadlines of the project. Apart from this, you can also share this visual presentation with your team members and stakeholders. It a resourceful tool that can be incorporated into your business structure. Therefore, download and edit it conveniently to add the data and statistics as per your requirement.
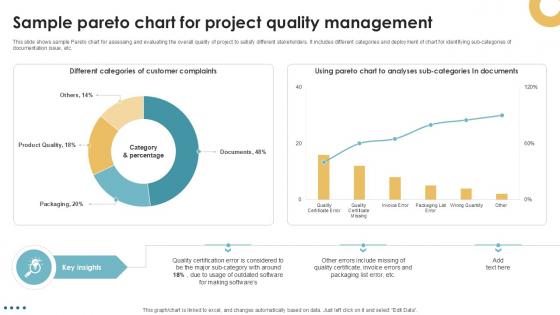
Sample Pareto Chart For Project Quality Management Executing Quality Ppt Slides PM SS V
This slide shows sample Pareto chart for assessing and evaluating the overall quality of project to satisfy different stakeholders. It includes different categories and deployment of chart for identifying sub categories of documentation issue, etc. Find highly impressive Sample Pareto Chart For Project Quality Management Executing Quality Ppt Slides PM SS V on Slidegeeks to deliver a meaningful presentation. You can save an ample amount of time using these presentation templates. No need to worry to prepare everything from scratch because Slidegeeks experts have already done a huge research and work for you. You need to download Sample Pareto Chart For Project Quality Management Executing Quality Ppt Slides PM SS V for your upcoming presentation. All the presentation templates are 100 percent editable and you can change the color and personalize the content accordingly. Download now This slide shows sample Pareto chart for assessing and evaluating the overall quality of project to satisfy different stakeholders. It includes different categories and deployment of chart for identifying sub categories of documentation issue, etc.
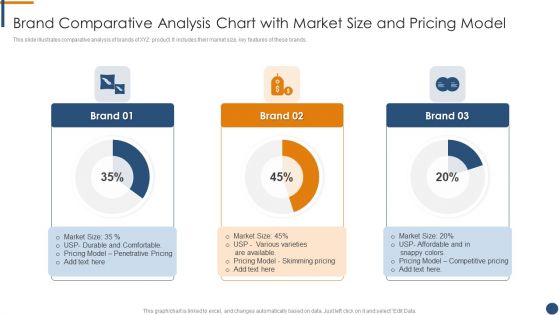
Brand Comparative Analysis Chart With Market Size And Pricing Model Pictures PDF
This slide illustrates comparative analysis of brands of XYZ product. It includes their market size, key features of these brands.Showcasing this set of slides titled Brand Comparative Analysis Chart With Market Size And Pricing Model Pictures PDF. The topics addressed in these templates are Pricing Model, Competitive Pricing, Market Size. All the content presented in this PPT design is completely editable. Download it and make adjustments in color, background, font etc. as per your unique business setting.
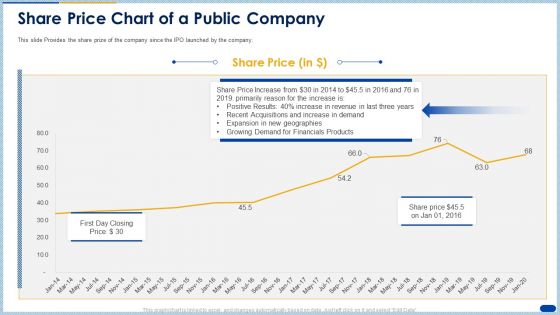
Raising Capital Banking Organizations Post Initial Offering Share Price Chart Of A Public Company Slides PDF
This slide Provides the share prize of the company since the IPO launched by the company. Deliver an awe inspiring pitch with this creative raising capital banking organizations post initial offering share price chart of a public company slides pdf bundle. Topics like growing demand, financials products, revenue can be discussed with this completely editable template. It is available for immediate download depending on the needs and requirements of the user.
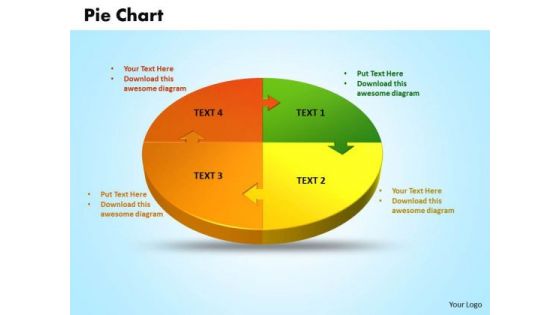
Business Editable PowerPoint Templates Business 3d Jigsaw Circular Pie Chart Ppt Slides
Business Chart PowerPoint Templates Business 3d jigsaw circular pie chart PPT Slides-PowerPoint Template shows Pie Chart with four sectors \\ Part of a series. -Business Chart PowerPoint Templates Business 3d jigsaw circular pie chart PPT Slides-This ppt can be used for concepts relating to-chart, circular, graph, growth, investment, isolated, market, numbers, percentage, pie, piece, plan, presentation, render, report, results, slice, statistics, stock, success and business. Our Business Editable PowerPoint Templates Business 3d Jigsaw Circular Pie Chart Ppt Slides ensure approval. Your ideas will fit the bill.
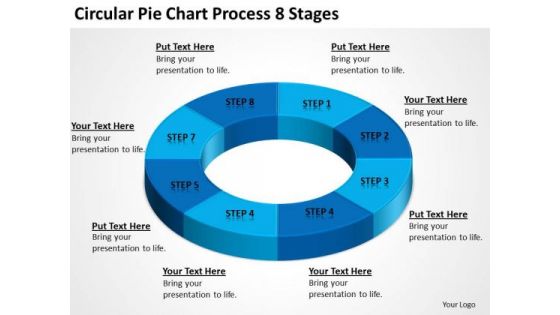
Circular Pie Chart Process 8 Stages Online Business Plan PowerPoint Templates
We present our circular pie chart process 8 stages online business plan PowerPoint templates.Use our Circle Charts PowerPoint Templates because Our PowerPoint Templates and Slides will let you meet your Deadlines. Download our Ring Charts PowerPoint Templates because Our PowerPoint Templates and Slides come in all colours, shades and hues. They help highlight every nuance of your views. Present our Shapes PowerPoint Templates because Our PowerPoint Templates and Slides are aesthetically designed to attract attention. We gaurantee that they will grab all the eyeballs you need. Download and present our Process and Flows PowerPoint Templates because Our PowerPoint Templates and Slides will let you meet your Deadlines. Use our Business PowerPoint Templates because It will mark the footprints of your journey. Illustrate how they will lead you to your desired destination.Use these PowerPoint slides for presentations relating to direction, market, percent, forward, target, achievement, flow, business, process diagram, concept, arrow, sign, success, symbol, percentage sign, arrow circle, diagram, value, percentage, finance, process, element, goal, marketing, green energy, development, price, abstract, team, management, graph, cycle, icon, chart, project, up, growth, motion, moving, company, competition, progress, profit, increase, investment, aim, financial, upwards, communication. The prominent colors used in the PowerPoint template are Blue, Blue navy, Black. Our Circular Pie Chart Process 8 Stages Online Business Plan PowerPoint Templates will be a charming discovery. They are both colorful and cute.
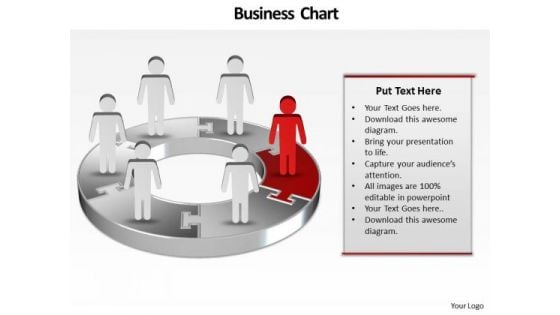
Ppt Illustration Of 3d PowerPoint Bar Chart With Standing Business People Templates
PPT illustration of 3d powerpoint bar chart with standing business people Templates-Develop competitive advantage with our above template which contains a diagram of one pie chart with cartoon men on it.This structure of our templates allows you to effectively highlight the key issues concerning to your business.-PPT illustration of 3d powerpoint bar chart with standing business people Templates-Adult, Art, Background, Business, Career, Chart, Communication, Concept, Conference, Corporate, Creative, Design, Economy, Executive, Finance, Group, Growth, Idea, Illustration, Leadership, Meeting, New, Occupation, Office, People, Person, Progress, Silhouette, Space, Speaking, Standing, Success You have been given an exacting task. Plan your approach with our Ppt Illustration Of 3d PowerPoint Bar Chart With Standing Business People Templates.
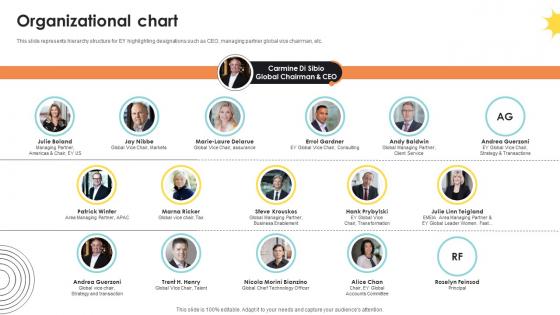
Organizational Chart Professional Services And Tax Advisory Company Profile CP SS V
This slide represents hierarchy structure for EY highlighting designations such as CEO, managing partner global vice chairman, etc.Make sure to capture your audiences attention in your business displays with our gratis customizable Organizational Chart Professional Services And Tax Advisory Company Profile CP SS V. These are great for business strategies, office conferences, capital raising or task suggestions. If you desire to acquire more customers for your tech business and ensure they stay satisfied, create your own sales presentation with these plain slides. This slide represents hierarchy structure for EY highlighting designations such as CEO, managing partner global vice chairman, etc.
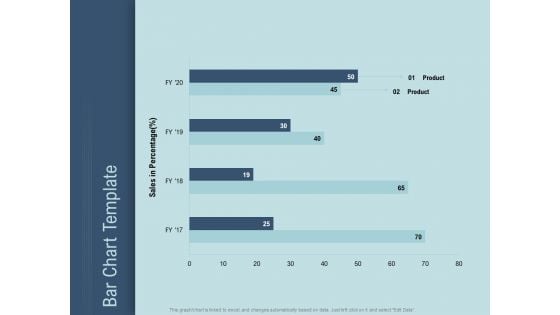
Determine Right Pricing Strategy New Product Bar Chart Template Ppt Portfolio Format PDF
Presenting this set of slides with name determine right pricing strategy new product bar chart template ppt portfolio format pdf. The topics discussed in these slides are product 1, product 2. This is a completely editable PowerPoint presentation and is available for immediate download. Download now and impress your audience.
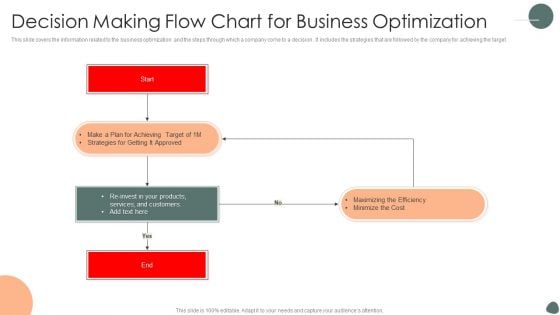
Decision Making Flow Chart For Business Optimization Ppt Show Images PDF
This slide covers the information related to the business optimization and the steps through which a company come to a decision . It includes the strategies that are followed by the company for achieving the target. Persuade your audience using this Decision Making Flow Chart For Business Optimization Ppt Show Images PDF. This PPT design covers one stages, thus making it a great tool to use. It also caters to a variety of topics including Services, And Customers, Product, Minimize Cost. Download this PPT design now to present a convincing pitch that not only emphasizes the topic but also showcases your presentation skills.
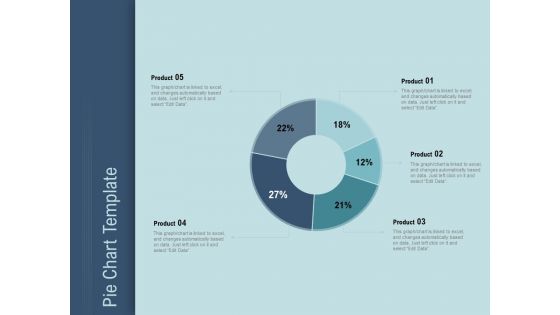
Determine Right Pricing Strategy New Product Pie Chart Template Ppt Summary Format Ideas PDF
Presenting this set of slides with name determine right pricing strategy new product pie chart template ppt summary format ideas pdf. The topics discussed in these slides are product 1, product 5. This is a completely editable PowerPoint presentation and is available for immediate download. Download now and impress your audience.
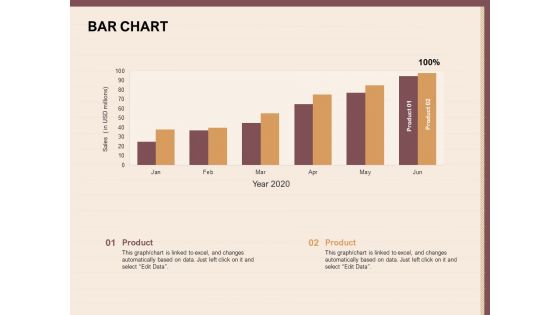
Best Practices For Increasing Lead Conversion Rates Bar Chart Ppt Model Example Introduction PDF
Presenting this set of slides with name best practices for increasing lead conversion rates bar chart ppt model example introduction pdf. The topics discussed in these slide is bar chart. This is a completely editable PowerPoint presentation and is available for immediate download. Download now and impress your audience.

Goal Pie Chart Concept Business PowerPoint Templates And PowerPoint Themes 0712
Goal Pie Chart Concept Business PowerPoint Templates And PowerPoint Themes 0712-Microsoft Powerpoint Templates and Background with pie chart concept Lecture teams with our Goal Pie Chart Concept Business PowerPoint Templates And PowerPoint Themes 0712. Download without worries with our money back guaranteee.
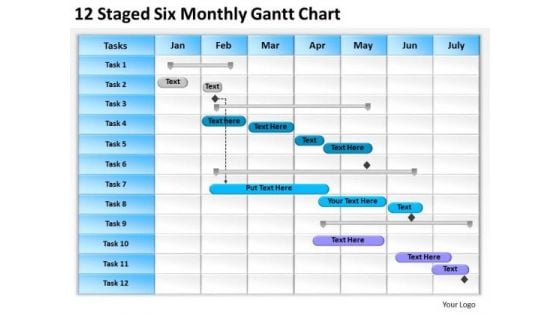
Business PowerPoint Template 12 Staged Six Monthly Gantt Chart Ppt Slides
Our Business powerpoint template 12 staged six monthly gantt chart ppt Slides make good beasts of burden. Place all your demands on them. Deliver the right dose with our Competition PowerPoint Templates. Your ideas will get the correct illumination. Your abilities have been lying dormant. Awaken them with our Org Charts PowerPoint Templates. Our Business PowerPoint Template 12 Staged Six Monthly Gantt Chart Ppt Slides are like a dictionary. They will have the right words for you.
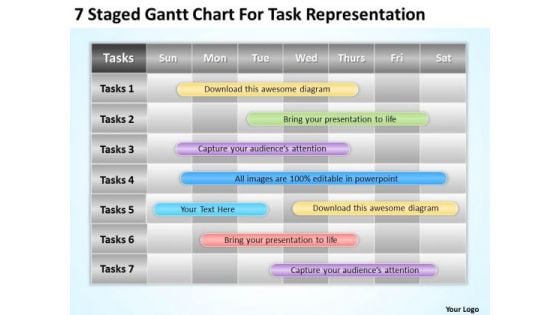
Strategy PowerPoint Template 7 Staged Gantt Chart For Task Representation Ppt Slides
Draw the debate to a close. Arrive at conclusions with our strategy powerpoint template 7 staged gantt chart for task representation ppt Slides. Make your dreams a reality with our Competition PowerPoint Templates. Your ideas will begin to take shape. Breathe life into your dreams with our Org Charts PowerPoint Templates. Give your thoughts a tangible form. Feel like a celebrity with our Strategy PowerPoint Template 7 Staged Gantt Chart For Task Representation Ppt Slides. They ensure ample adulation.
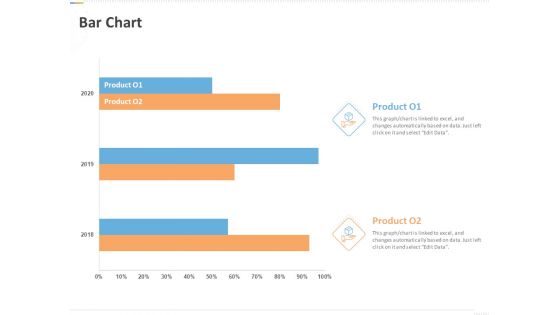
Sustainable Competitive Advantage Management Strategy Bar Chart Ppt Inspiration Microsoft PDF
Presenting this set of slides with name sustainable competitive advantage management strategy bar chart ppt inspiration microsoft pdf. The topics discussed in these slide is bar chart. This is a completely editable PowerPoint presentation and is available for immediate download. Download now and impress your audience.
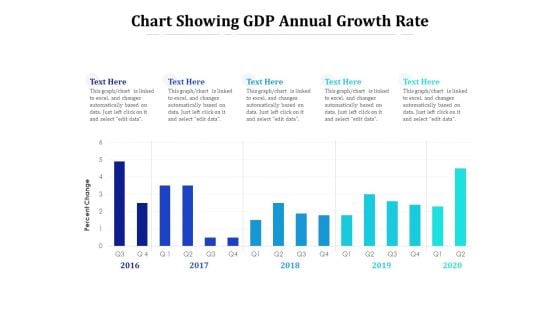
Chart Showing GDP Annual Growth Rate Ppt PowerPoint Presentation File Introduction PDF
Presenting this set of slides with name chart showing gdp annual growth rate ppt powerpoint presentation file introduction pdf. The topics discussed in these slides are chart showing gdp annual growth rate, 2016 to 2020. This is a completely editable PowerPoint presentation and is available for immediate download. Download now and impress your audience.
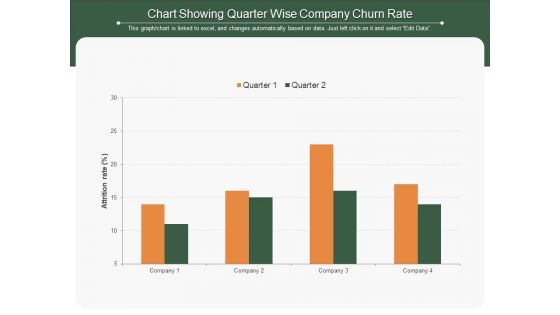
Chart Showing Quarter Wise Company Churn Rate Ppt PowerPoint Presentation Outline Slides PDF
Presenting this set of slides with name chart showing quarter wise company churn rate ppt powerpoint presentation outline slides pdf. The topics discussed in these slide is chart showing quarter wise company churn rate. This is a completely editable PowerPoint presentation and is available for immediate download. Download now and impress your audience.

Line Chart Showing Employee Attrition Rate Ppt PowerPoint Presentation Ideas Graphic Images
Presenting this set of slides with name line chart showing employee attrition rate ppt powerpoint presentation ideas graphic images. The topics discussed in these slide is line chart showing employee attrition rate. This is a completely editable PowerPoint presentation and is available for immediate download. Download now and impress your audience.
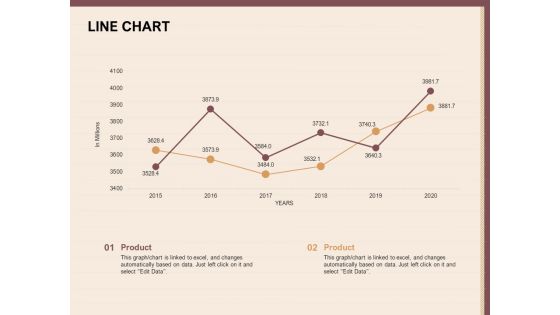
Best Practices For Increasing Lead Conversion Rates Line Chart Ppt Professional Show PDF
Presenting this set of slides with name best practices for increasing lead conversion rates line chart ppt professional show pdf. The topics discussed in these slide is line chart. This is a completely editable PowerPoint presentation and is available for immediate download. Download now and impress your audience.
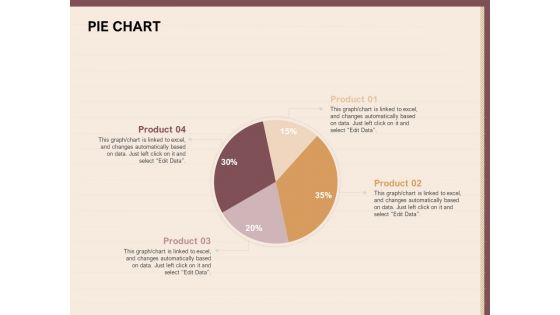
Best Practices For Increasing Lead Conversion Rates Pie Chart Ppt Pictures Slideshow PDF
Presenting this set of slides with name best practices for increasing lead conversion rates pie chart ppt pictures slideshow pdf. The topics discussed in these slide is pie chart. This is a completely editable PowerPoint presentation and is available for immediate download. Download now and impress your audience.
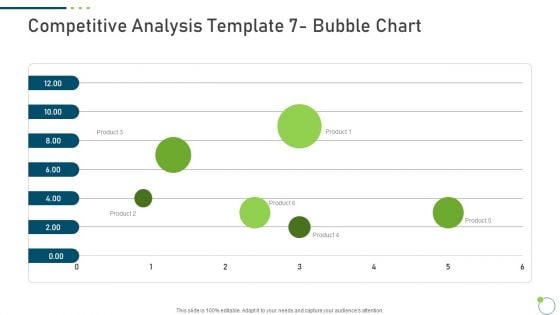
Investor Pitch Deck New Venture Capital Raising Competitive Analysis Template 7 Bubble Chart Rules PDF
Deliver and pitch your topic in the best possible manner with this investor pitch deck new venture capital raising competitive analysis template 7 bubble chart rules pdf. Use them to share invaluable insights on competitive analysis bubble chart and impress your audience. This template can be altered and modified as per your expectations. So, grab it now.
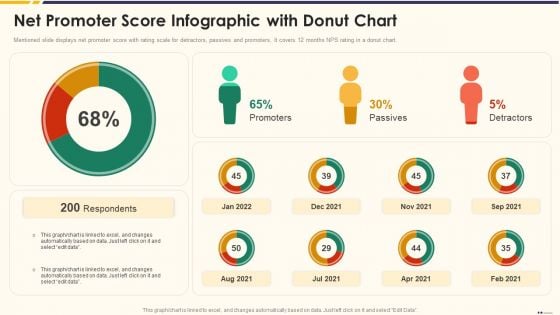
Promotion Standard Practices Tools And Templates Net Promoter Score Infographic With Donut Chart Inspiration PDF
Mentioned slide displays net promoter score with rating scale for detractors, passives and promoters, It covers 12 months NPS rating in a donut chart.Deliver an awe inspiring pitch with this creative promotion standard practices tools and templates net promoter score infographic with donut chart inspiration pdf bundle. Topics like net promoter score infographic with donut chart can be discussed with this completely editable template. It is available for immediate download depending on the needs and requirements of the user.
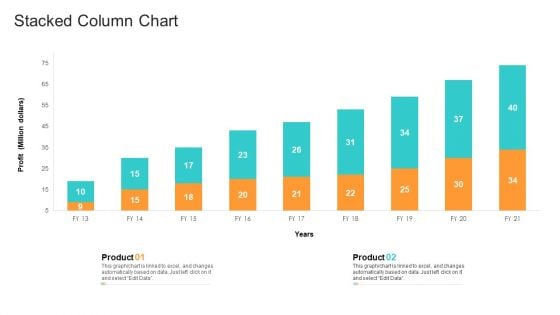
Utilization Of Current Techniques To Improve Efficiency Case Competition Stacked Column Chart Information PDF
Deliver and pitch your topic in the best possible manner with this utilization of current techniques to improve efficiency case competition stacked column chart information pdf. Use them to share invaluable insights on stacked column chart and impress your audience. This template can be altered and modified as per your expectations. So, grab it now.
Sustainable Competitive Advantage Management Strategy Pie Chart Ppt Ideas Icons PDF
Presenting this set of slides with name sustainable competitive advantage management strategy pie chart ppt ideas icons pdf. The topics discussed in these slide is pie chart. This is a completely editable PowerPoint presentation and is available for immediate download. Download now and impress your audience.
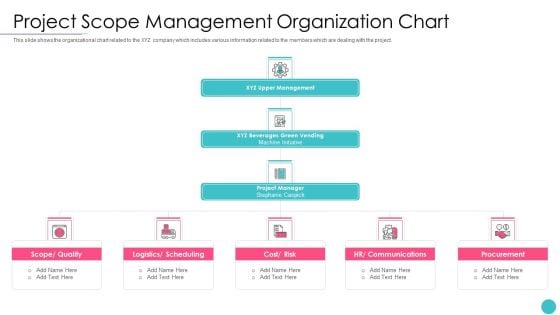
Effective Project Management With Key Milestones Project Scope Management Organization Chart Diagrams PDF
This slide shows the organizational chart related to the XYZ company which includes various information related to the members which are dealing with the project. Presenting effective project management with key milestones project scope management organization chart diagrams pdf to provide visual cues and insights. Share and navigate important information on four stages that need your due attention. This template can be used to pitch topics like cost, risk, quality, procurement. In addtion, this PPT design contains high resolution images, graphics, etc, that are easily editable and available for immediate download.
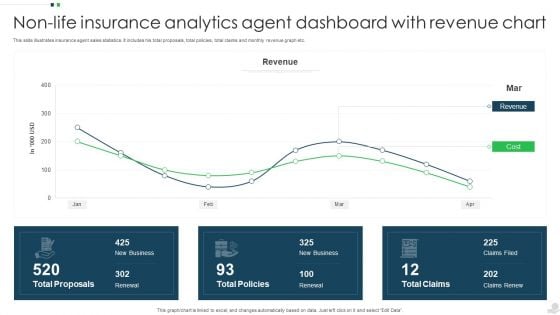
Non Life Insurance Analytics Agent Dashboard With Revenue Chart Infographics PDF
This slide illustrates insurance agent sales statistics. It includes his total proposals, total policies, total claims and monthly revenue graph etc. Showcasing this set of slides titled Non Life Insurance Analytics Agent Dashboard With Revenue Chart Infographics PDF. The topics addressed in these templates are Revenue, Cost, Total Proposals. All the content presented in this PPT design is completely editable. Download it and make adjustments in color, background, font etc. as per your unique business setting.
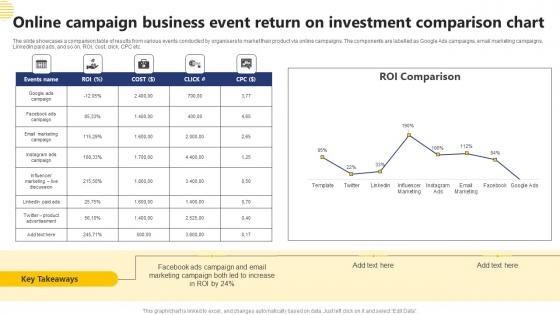
Online Campaign Business Event Return On Investment Comparison Chart Demonstration Pdf
The slide showcases a comparison table of results from various events conducted by organisers to market their product via online campaigns. The components are labelled as Google Ads campaigns, email marketing campaigns, LinkedIn paid ads, and so on. ROI, cost, click, CPC etc. Pitch your topic with ease and precision using this Online Campaign Business Event Return On Investment Comparison Chart Demonstration Pdf This layout presents information on Google Ads Campaign, Email Marketing Campaign It is also available for immediate download and adjustment. So, changes can be made in the color, design, graphics or any other component to create a unique layout. The slide showcases a comparison table of results from various events conducted by organisers to market their product via online campaigns. The components are labelled as Google Ads campaigns, email marketing campaigns, LinkedIn paid ads, and so on. ROI, cost, click, CPC etc.
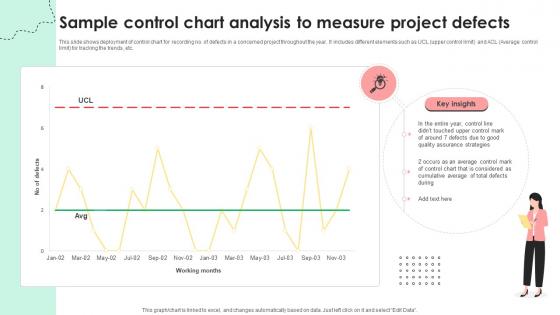
Administering Quality Assurance Sample Control Chart Analysis To Measure Project Defects PM SS V
This slide shows deployment of control chart for recording no. of defects in a concerned project throughout the year. It includes different elements such as UCL upper control limit and ACL Average control limit for tracking the trends, etc. From laying roadmaps to briefing everything in detail, our templates are perfect for you. You can set the stage with your presentation slides. All you have to do is download these easy-to-edit and customizable templates. Administering Quality Assurance Sample Control Chart Analysis To Measure Project Defects PM SS V will help you deliver an outstanding performance that everyone would remember and praise you for. Do download this presentation today. This slide shows deployment of control chart for recording no. of defects in a concerned project throughout the year. It includes different elements such as UCL upper control limit and ACL Average control limit for tracking the trends, etc.
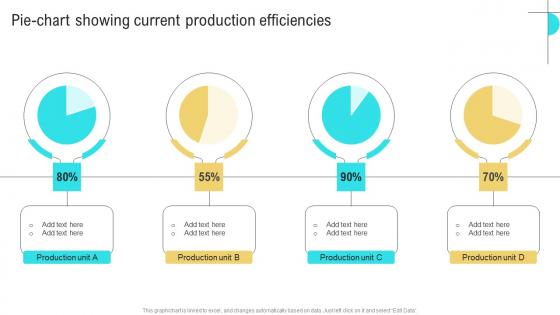
Pie Chart Showing Current Business Performance Optimization New Operations Strategy Portrait Pdf
Here you can discover an assortment of the finest PowerPoint and Google Slides templates. With these templates, you can create presentations for a variety of purposes while simultaneously providing your audience with an eye catching visual experience. Download Pie Chart Showing Current Business Performance Optimization New Operations Strategy Portrait Pdf to deliver an impeccable presentation. These templates will make your job of preparing presentations much quicker, yet still, maintain a high level of quality. Slidegeeks has experienced researchers who prepare these templates and write high quality content for you. Later on, you can personalize the content by editing the Pie Chart Showing Current Business Performance Optimization New Operations Strategy Portrait Pdf. Our Pie Chart Showing Current Business Performance Optimization New Operations Strategy Portrait Pdf are topically designed to provide an attractive backdrop to any subject. Use them to look like a presentation pro.
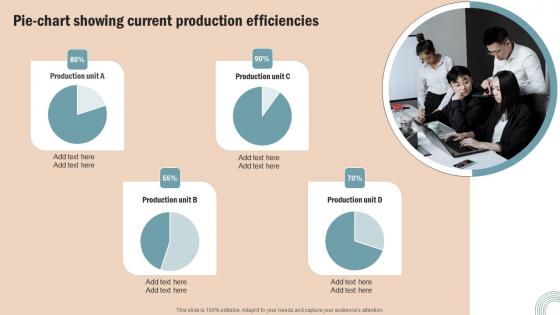
Pie Chart Showing Current Operations Strategy Improve Business Productivity Clipart Pdf
Here you can discover an assortment of the finest PowerPoint and Google Slides templates. With these templates, you can create presentations for a variety of purposes while simultaneously providing your audience with an eye catching visual experience. Download Pie Chart Showing Current Operations Strategy Improve Business Productivity Clipart Pdf to deliver an impeccable presentation. These templates will make your job of preparing presentations much quicker, yet still, maintain a high level of quality. Slidegeeks has experienced researchers who prepare these templates and write high quality content for you. Later on, you can personalize the content by editing the Pie Chart Showing Current Operations Strategy Improve Business Productivity Clipart Pdf. Our Pie Chart Showing Current Operations Strategy Improve Business Productivity Clipart Pdf are topically designed to provide an attractive backdrop to any subject. Use them to look like a presentation pro.
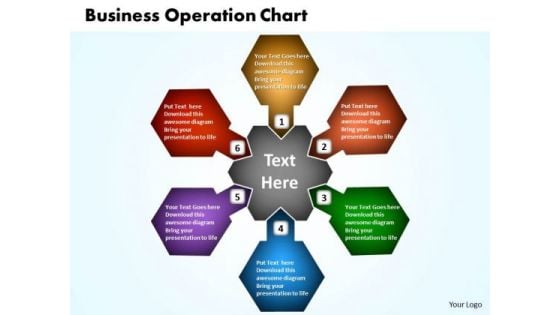
Business Process PowerPoint Templates Business The Circular Operation Process Chart Ppt Slides
Business Process PowerPoint Templates Business The Circular Operation Process Chart PPT Slides-Use this Circular Operation Chart Diagram in Business Presentations. This PowerPoint diagram can be used for information flow, business process automation, business process re-engineering and other business related issues.-Business Process PowerPoint Templates Business The Circular Operation Process Chart PPT Slides Achieve strong & sustainable productivity gains with our Business Process PowerPoint Templates Business The Circular Operation Process Chart Ppt Slides. They will make you look good.
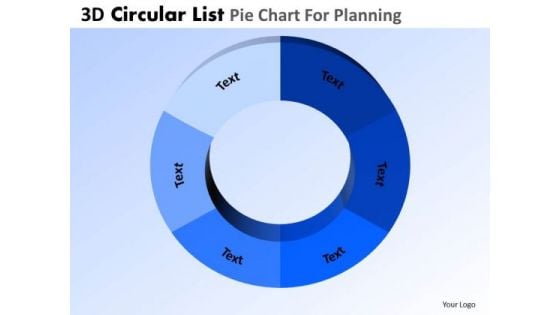
PowerPoint Design Executive Competition 3d Cycle Chart List Ppt Presentation Designs
PowerPoint Design Executive Competition 3d Cycle Chart list PPT Presentation Designs-These high quality powerpoint pre-designed slides and powerpoint templates have been carefully created by our professional team to help you impress your audience. All slides have been created and are 100% editable in powerpoint. Each and every property of any graphic - color, size, orientation, shading, outline etc. can be modified to help you build an effective powerpoint presentation. Any text can be entered at any point in the powerpoint template or slide. Simply DOWNLOAD, TYPE and PRESENT! Troubleshoot problems with our PowerPoint Design Executive Competition 3d Cycle Chart List Ppt Presentation Designs. Download without worries with our money back guaranteee.
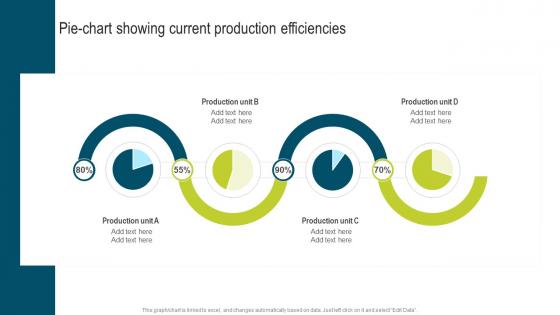
Pie Chart Showing Current Production Developing Extensive Plan For Operational Guidelines Pdf
Take your projects to the next level with our ultimate collection of Pie Chart Showing Current Production Developing Extensive Plan For Operational Guidelines Pdf. Slidegeeks has designed a range of layouts that are perfect for representing task or activity duration, keeping track of all your deadlines at a glance. Tailor these designs to your exact needs and give them a truly corporate look with your own brand colors they well make your projects stand out from the rest. Our Pie Chart Showing Current Production Developing Extensive Plan For Operational Guidelines Pdf are topically designed to provide an attractive backdrop to any subject. Use them to look like a presentation pro.
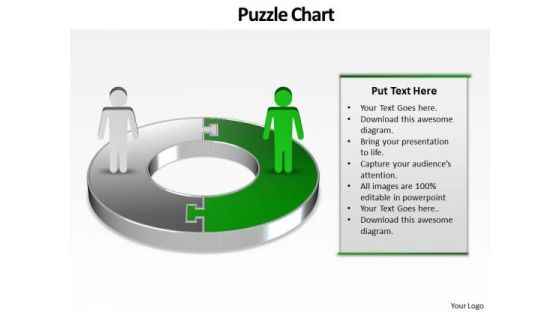
Ppt Green PowerPoint Slide Man On Circular Gantt Chart Template Templates
PPT green powerpoint slide man on circular gantt chart template Templates-This PowerPoint Diagram shows you the Circular way to represent Business components or losses in Business related Activities. This PowerPoint Diagram can be use in Investor presentations for Initial Public Offerings, Annual general meetings and financial seminars.-PPT green powerpoint slide man on circular gantt chart template Templates-abstract, accounting, background, business, businessman, chart, company, connection, corporate, diagram, earnings, finance, forecast, graph, growth, investment, management, network, people, profit, progress, puzzle, shapes, team, technology, vector, wealth Fight down jealousies with our Ppt Green PowerPoint Slide Man On Circular Gantt Chart Template Templates. Make everyone feel equal with your words.
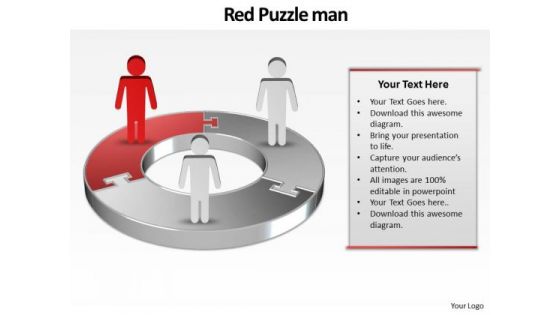
Ppt Red World Business Layouts People Stand On Circular Chart PowerPoint Templates
PPT red world business layouts people stand on circular chart PowerPoint Templates-This 3D PowerPoint Diagram shows the Three interconnected stages represented by first Red Quadrant. It signifies the concept of aspect, attribute, bearing, complexion, component, differentia, disposition, distinction, earmark, essence, essential etc.-PPT red world business layouts people stand on circular chart PowerPoint Templates-abstract, accounting, background, business, businessman, chart, company, connection, corporate, diagram, earnings, finance, forecast, graph, growth, investment, management, network, people, profit, progress, puzzle, shapes, team, technology, vector, wealth Make a powerful statement with our Ppt Red World Business Layouts People Stand On Circular Chart PowerPoint Templates. You'll always stay ahead of the game.
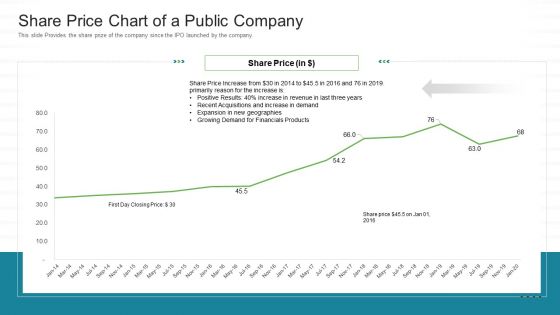
Investor Pitch Stock Market Launch Financial Institutions Share Price Chart Of A Public Company Sample PDF
This slide Provides the share prize of the company since the IPO launched by the company. Deliver and pitch your topic in the best possible manner with this investor pitch stock market launch financial institutions share price chart of a public company sample pdf. Use them to share invaluable insights on growing demand, financials products, share price and impress your audience. This template can be altered and modified as per your expectations. So, grab it now.
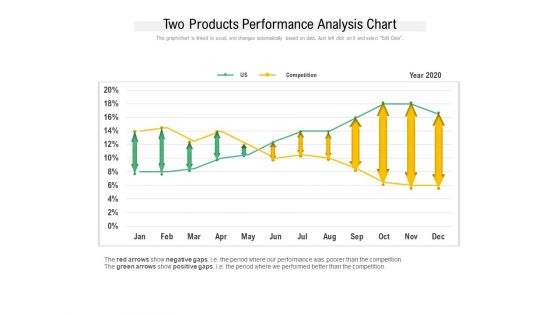
Two Products Performance Analysis Chart Ppt PowerPoint Presentation Layouts Aids PDF
Showcasing this set of slides titled two products performance analysis chart ppt powerpoint presentation layouts aids pdf. The topics addressed in these templates are competition, year 2020, two products performance, analysis chart. All the content presented in this PPT design is completely editable. Download it and make adjustments in color, background, font etc. as per your unique business setting.
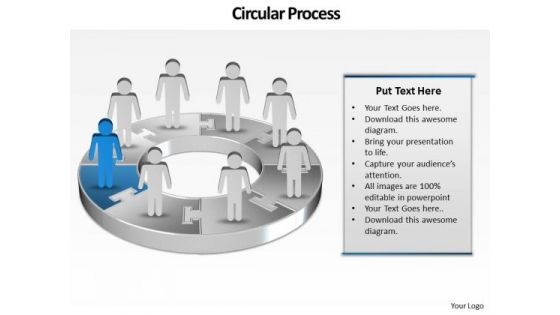
Ppt Group Of People Pie Chart Person Presentation Standing Blue Piece PowerPoint Templates
PPT group of people pie chart person presentation standing blue piece PowerPoint Templates-This PowerPoint Diagram shows the Round Description of steps which are involved in development Process. It includes Eight Steps. You can change color, size and orientation of any icon to your liking.-PPT group of people pie chart person presentation standing blue piece PowerPoint Templates-arrow, bar, business, businessman, candidate, cartoon, character, chart, circle, circular, client, communication, company, concept, diagram, finance, growth, human, illustration, increase, information, marketing, person, presentation, process, profit, sales, stats, success, target Expound your logic on our Ppt Group Of People Pie Chart Person Presentation Standing Blue Piece PowerPoint Templates. Let them in on your chain of thought.
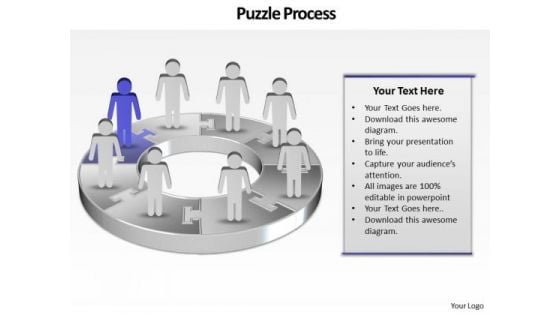
Ppt Group Of People Pie Chart Person Standing Purple Piece PowerPoint Templates
PPT group of people pie chart person standing purple piece PowerPoint Templates-This continual illustration of procedure graphic is a visual representation of your information and ideas. Use this diagram as a method of graphically representing the flow of data as an information processing system.-PPT group of people pie chart person standing purple piece PowerPoint Templates-arrow, bar, business, businessman, candidate, cartoon, character, chart, circle, circular, client, communication, company, concept, diagram, finance, growth, human, illustration, increase, information, marketing, person, presentation, process, profit, sales, stats, success, target Establish your command over the subject. Display your awareness with our Ppt Group Of People Pie Chart Person Standing Purple Piece PowerPoint Templates.
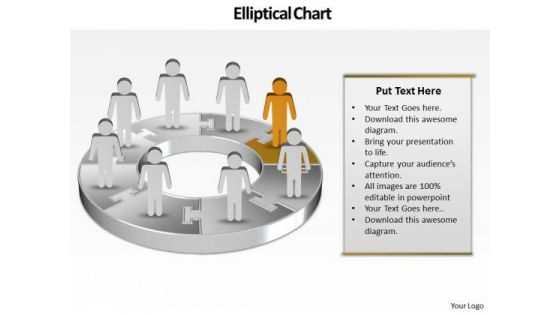
Ppt Team Work Person Presentation Standing Orange Piece Of Chart PowerPoint Templates
PPT team work person presentation standing orange piece of chart PowerPoint Templates-Use this graphical approach to represent global business issues such as financial data, stock market Exchange, increase in sales, corporate presentations and more. Create captivating presentations to deliver comparative and weighted arguments.-PPT team work person presentation standing orange piece of chart PowerPoint Templates-arrow, bar, business, businessman, candidate, cartoon, character, chart, circle, circular, client, communication, company, concept, diagram, finance, financial, flow, growth, human, illustration, increase, information, iteration, man, market, marketing, process, processing, profit, sales, statistics, stats, success, target Bounce back with our Ppt Team Work Person Presentation Standing Orange Piece Of Chart PowerPoint Templates. You will come out on top.
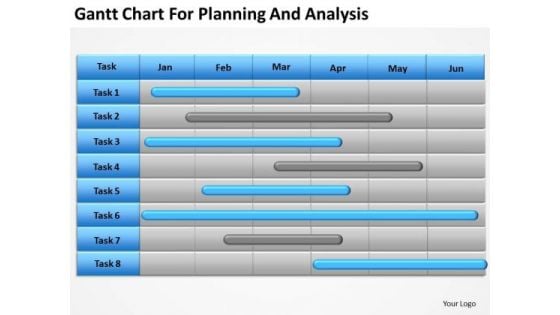
Business PowerPoint Template Gantt Chart For Planning And Analysis Ppt Templates
Our Business powerpoint template gantt chart for planning and analysis ppt templates heighten concentration. Your audience will be on the edge. Get an edge with our Competition PowerPoint Templates. They give you advantage plus. Edit your work with our Org Charts PowerPoint Templates. They will help you give the final form. String your bow with our Business PowerPoint Template Gantt Chart For Planning And Analysis Ppt Templates. Give your thoughts the power to fly.
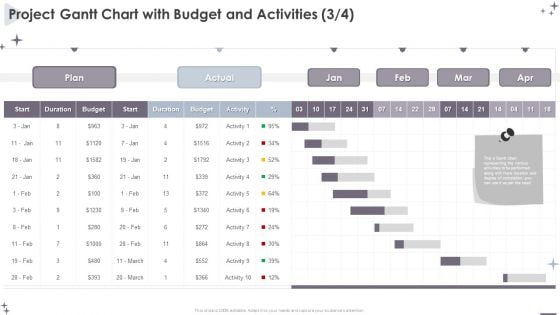
Project Administration Bundle Project Gantt Chart With Budget And Activities Infographics PDF
Your complex projects can be managed and organized simultaneously using this detailed Project Administration Bundle Project Gantt Chart With Budget And Activities Infographics PDF template. Track the milestones, tasks, phases, activities, and subtasks to get an updated visual of your project. Share your planning horizon and release plan with this well crafted presentation template. This exemplary template can be used to plot various dependencies to distinguish the tasks in the pipeline and their impact on the schedules and deadlines of the project. Apart from this, you can also share this visual presentation with your team members and stakeholders. It a resourceful tool that can be incorporated into your business structure. Therefore, download and edit it conveniently to add the data and statistics as per your requirement.
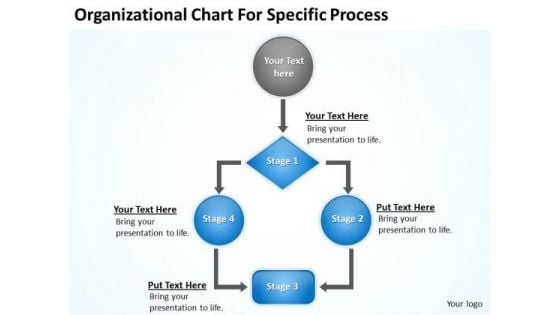
Organizational Chart For Specific Procee Ppt Business Plan Form PowerPoint Slides
We present our organizational chart for specific procee ppt business plan form PowerPoint Slides.Download our Process and Flows PowerPoint Templates because You are an avid believer in ethical practices. Highlight the benefits that accrue with our PowerPoint Templates and Slides. Use our Business PowerPoint Templates because Our PowerPoint Templates and Slides provide you with a vast range of viable options. Select the appropriate ones and just fill in your text. Present our Success PowerPoint Templates because you can Add colour to your speech with our PowerPoint Templates and Slides. Your presentation will leave your audience speechless. Download our Flow Charts PowerPoint Templates because It can be used to Set your controls for the heart of the sun. Our PowerPoint Templates and Slides will be the propellant to get you there. Download our Shapes PowerPoint Templates because You canTake a leap off the starting blocks with our PowerPoint Templates and Slides. They will put you ahead of the competition in quick time.Use these PowerPoint slides for presentations relating to Process, flow, business, chart, grow, financials, corporate, profitability, income, contracts, success, presentation, management, graph, prices, organizational, share, reports, professional, company, organization. The prominent colors used in the PowerPoint template are Gray, Blue, White. Expect great things with our Organizational Chart For Specific Procee Ppt Business Plan Form PowerPoint Slides. You will come out on top.
Sustainable Energy Resources Column Chart Ppt PowerPoint Presentation Icon Infographic Template PDF
This graph or chart is linked to excel, and changes automatically based on data. Just left click on it and select Edit Data. Deliver and pitch your topic in the best possible manner with this Sustainable Energy Resources Column Chart Ppt PowerPoint Presentation Icon Infographic Template PDF. Use them to share invaluable insights on Column Chart, 2017 To 2022 and impress your audience. This template can be altered and modified as per your expectations. So, grab it now.
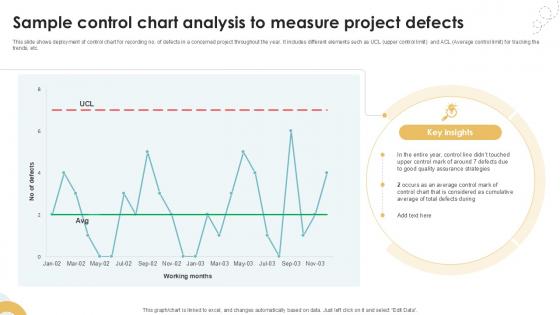
Sample Control Chart Analysis To Measure Project Executing Quality Ppt Sample PM SS V
This slide shows deployment of control chart for recording no. of defects in a concerned project throughout the year. It includes different elements such as UCL upper control limit and ACL Average control limit for tracking the trends, etc. Do you have an important presentation coming up Are you looking for something that will make your presentation stand out from the rest Look no further than Sample Control Chart Analysis To Measure Project Executing Quality Ppt Sample PM SS V. With our professional designs, you can trust that your presentation will pop and make delivering it a smooth process. And with Slidegeeks, you can trust that your presentation will be unique and memorable. So why wait Grab Sample Control Chart Analysis To Measure Project Executing Quality Ppt Sample PM SS V today and make your presentation stand out from the rest This slide shows deployment of control chart for recording no. of defects in a concerned project throughout the year. It includes different elements such as UCL upper control limit and ACL Average control limit for tracking the trends, etc.
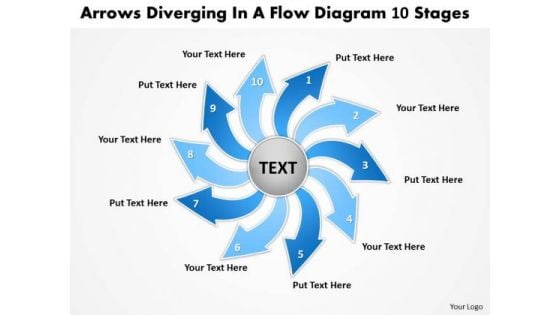
Arrows Diverging Flow Diagram 10 Stages Ppt Pie Chart PowerPoint Templates
We present our arrows diverging flow diagram 10 stages ppt Pie Chart PowerPoint templates.Download our Arrows PowerPoint Templates because you have some great folks working with you, thinking with you. Use our Circle Charts PowerPoint Templates because it depicts Rolling along while gathering profits along the way is the aim. Download our Shapes PowerPoint Templates because they will Amplify your views and plans for getting ahead and then the manner in which you intend staying ahead. Present our Business PowerPoint Templates because your ideas too are pinpointedly focused on you goals. Download our Flow Charts PowerPoint Templates because if making a mark is your obsession, then let others get Obsessed with you.Use these PowerPoint slides for presentations relating to 3d, abstract, achievement, aim, arrow, blue, business, chart, circle, color, communication, competition, concept, creative, design, different, direction, education, element, financial, first, forward, graphic, gray, group, growth, high, icon, illustration, isolated, leader, leadership, line, motion, moving, path, progress, race, sales, sign, success, symbol, target, team, teamwork, turn, up, way, win, winner. The prominent colors used in the PowerPoint template are Blue, Blue light, Gray. Presenters tell us our arrows diverging flow diagram 10 stages ppt Pie Chart PowerPoint templates are Fashionable. You can be sure our chart PowerPoint templates and PPT Slides will make the presenter successul in his career/life. Professionals tell us our arrows diverging flow diagram 10 stages ppt Pie Chart PowerPoint templates are Bold. People tell us our circle PowerPoint templates and PPT Slides are Beautiful. People tell us our arrows diverging flow diagram 10 stages ppt Pie Chart PowerPoint templates will make the presenter look like a pro even if they are not computer savvy. Professionals tell us our business PowerPoint templates and PPT Slides are Whimsical. Arrive with a bang with our Arrows Diverging Flow Diagram 10 Stages Ppt Pie Chart PowerPoint Templates. They assure you an explosive entry.
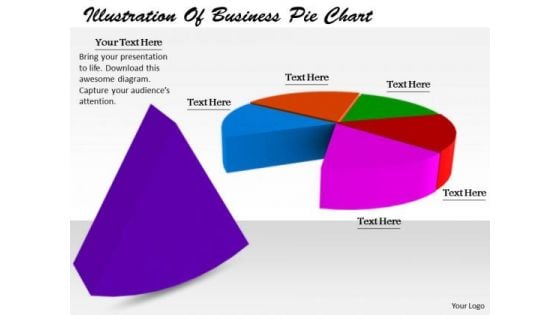
Stock Photo Business Strategy Execution Illustration Of Pie Chart Stock Photos
Plan For All Contingencies With Our Stock Photo Business Strategy Execution Illustration Of Pie Chart Stock Photos Powerpoint Templates. Douse The Fire Before It Catches. Generate Camaraderie With Our Pie Charts Powerpoint Templates. Good Wishes Will Come Raining Down.

Business Diagram 3d Lock With Pie Chart And Text Boxes For Business PowerPoint Slide
This Power Point diagram has been crafted with pie chart in shape of lock. It contains diagram of lock pie chart to compare and present data in an effective manner. Use this diagram to build professional presentations for your viewers.

Bar Graph And Pie Chart Marketing PowerPoint Templates And PowerPoint Themes 0612
Bar Graph And Pie Chart Marketing PowerPoint Templates And PowerPoint Themes 0612-Microsoft Powerpoint Templates and Background with bar and pie chart Our Bar Graph And Pie Chart Marketing PowerPoint Templates And PowerPoint Themes 0612 have a festive effect. The audience will celebrate your ideas.
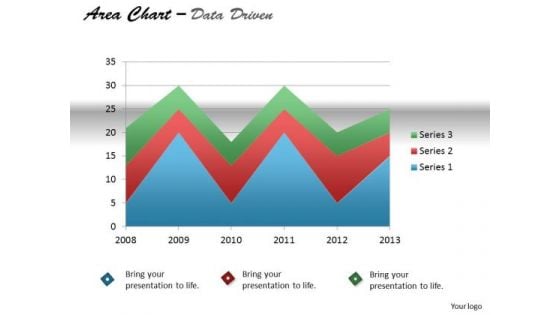
Quantitative Data Analysis Driven Display Series With Area Chart PowerPoint Slides Templates
Our quantitative data analysis driven display series with area chart powerpoint slides Templates Enjoy Drama. They Provide Entertaining Backdrops.


 Continue with Email

 Home
Home


