Cost Dashboard
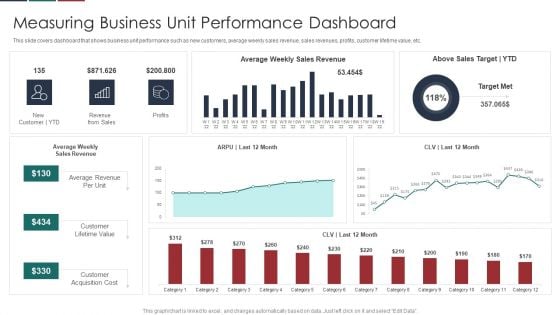
Deliver Efficiency Innovation Measuring Business Unit Performance Dashboard Background PDF
This slide covers dashboard that shows business unit performance such as new customers, average weekly sales revenue, sales revenues, profits, customer lifetime value, etc. Deliver an awe inspiring pitch with this creative Deliver Efficiency Innovation Measuring Business Unit Performance Dashboard Background PDF bundle. Topics like Customer Lifetime Value, Customer Acquisition Cost, Average Revenue Per Unit, Above Sales Target YTD can be discussed with this completely editable template. It is available for immediate download depending on the needs and requirements of the user.
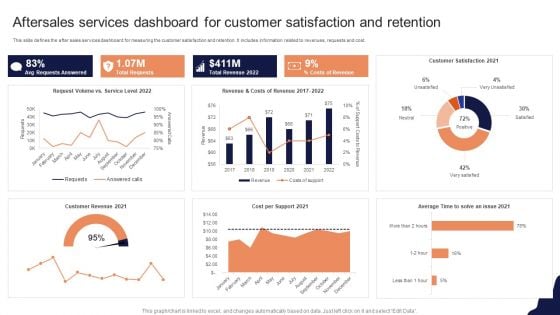
Aftersales Services Dashboard For Customer Satisfaction And Retention Template PDF
This slide defines the after sales services dashboard for measuring the customer satisfaction and retention. It includes information related to revenues, requests and cost.Showcasing this set of slides titled Aftersales Services Dashboard For Customer Satisfaction And Retention Template PDF The topics addressed in these templates are Requests Answered, Total Requests, Customer Satisfaction All the content presented in this PPT design is completely editable. Download it and make adjustments in color, background, font etc. as per your unique business setting.
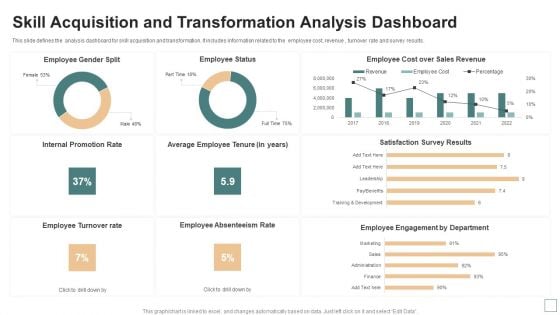
Skill Acquisition And Transformation Analysis Dashboard Themes PDF
This slide defines the analysis dashboard for skill acquisition and transformation. It includes information related to the employee cost, revenue , turnover rate and survey results. Showcasing this set of slides titled Skill Acquisition And Transformation Analysis Dashboard Themes PDF. The topics addressed in these templates are Internal Promotion Rate, Employee Turnover Rate, Average Employee Tenure. All the content presented in this PPT design is completely editable. Download it and make adjustments in color, background, font etc. as per your unique business setting.
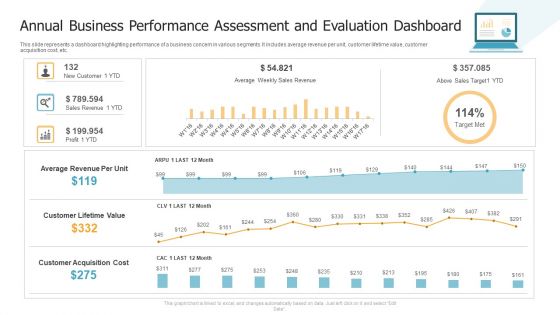
Annual Business Performance Assessment And Evaluation Dashboard Brochure PDF
This slide represents a dashboard highlighting performance of a business concern in various segments. It includes average revenue per unit, customer lifetime value, customer acquisition cost, etc. Showcasing this set of slides titled Annual Business Performance Assessment And Evaluation Dashboard Brochure PDF. The topics addressed in these templates are Profit, Sales Revenue, New Customer. All the content presented in this PPT design is completely editable. Download it and make adjustments in color, background, font etc. as per your unique business setting.
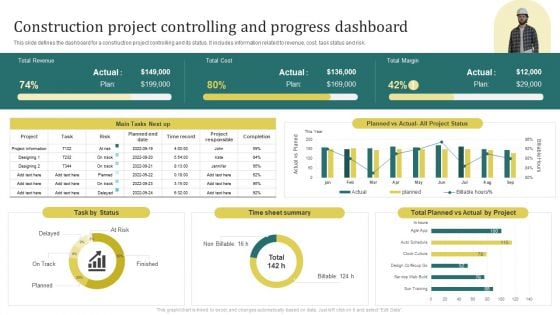
Construction Project Controlling And Progress Dashboard Slides PDF
This slide defines the dashboard for a construction project controlling and its status. It includes information related to revenue, cost, task status and risk.Showcasing this set of slides titled Construction Project Controlling And Progress Dashboard Slides PDF. The topics addressed in these templates are Time Sheet Summary, Project Responsible, Total Planned. All the content presented in this PPT design is completely editable. Download it and make adjustments in color, background, font etc. as per your unique business setting.
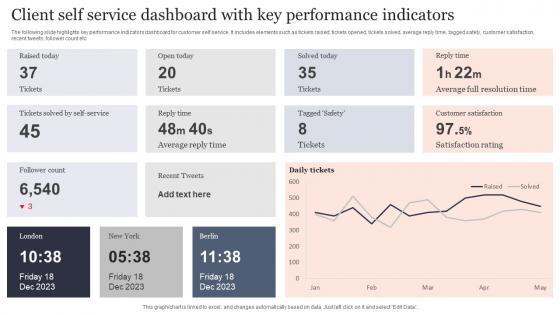
Client Self Service Dashboard With Key Performance Indicators Pictures Pdf
The following slide highlights key performance indicators dashboard for customer self service. It includes elements such as tickets raised, tickets opened, tickets solved, average reply time, tagged safety, customer satisfaction, recent tweets, follower count etc. Showcasing this set of slides titled Client Self Service Dashboard With Key Performance Indicators Pictures Pdf. The topics addressed in these templates are Open Today, Reply Time. All the content presented in this PPT design is completely editable. Download it and make adjustments in color, background, font etc. as per your unique business setting. The following slide highlights key performance indicators dashboard for customer self service. It includes elements such as tickets raised, tickets opened, tickets solved, average reply time, tagged safety, customer satisfaction, recent tweets, follower count etc.
Property Flipping Expenses And Profit Tracking Dashboard Ppt Good PDF
This slide covers dashboard to estimate multiple expenses incurred and profits earned by property flipping. It includes elements such repair costs, after repair value, rehab profits, purchase price, total amount of investment Made, etc. Showcasing this set of slides titled Property Flipping Expenses And Profit Tracking Dashboard Ppt Good PDF. The topics addressed in these templates are Repair Costs, Loan Amount, Down Payment. All the content presented in this PPT design is completely editable. Download it and make adjustments in color, background, font etc. as per your unique business setting.
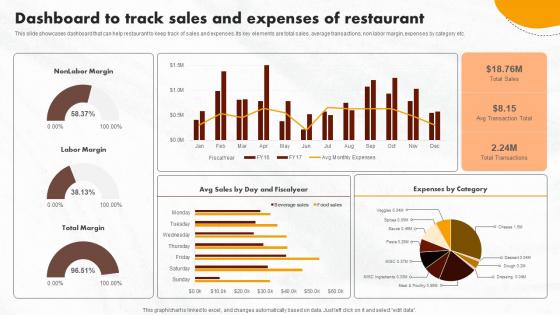
Online Promotional Activities Dashboard To Track Sales Sample Pdf
This slide showcases dashboard that can help restaurant to keep track of sales and expenses. Its key elements are total sales, average transactions, non labor margin, expenses by category etc. Are you in need of a template that can accommodate all of your creative concepts This one is crafted professionally and can be altered to fit any style. Use it with Google Slides or PowerPoint. Include striking photographs, symbols, depictions, and other visuals. Fill, move around, or remove text boxes as desired. Test out color palettes and font mixtures. Edit and save your work, or work with colleagues. Download Online Promotional Activities Dashboard To Track Sales Sample Pdf and observe how to make your presentation outstanding. Give an impeccable presentation to your group and make your presentation unforgettable. This slide showcases dashboard that can help restaurant to keep track of sales and expenses. Its key elements are total sales, average transactions, non labor margin, expenses by category etc.
Project Dashboard For Tracking Schedule Management Techniques PPT Presentation
This slide presents project dashboard for tracking task status or phases of project, that would help to monitor progress. It includes information on ongoing phase, budget, risks, pending tasks etc. Presenting this PowerPoint presentation, titled Project Dashboard For Tracking Schedule Management Techniques PPT Presentation, with topics curated by our researchers after extensive research. This editable presentation is available for immediate download and provides attractive features when used. Download now and captivate your audience. Presenting this Project Dashboard For Tracking Schedule Management Techniques PPT Presentation. Our researchers have carefully researched and created these slides with all aspects taken into consideration. This is a completely customizable Project Dashboard For Tracking Schedule Management Techniques PPT Presentation that is available for immediate downloading. Download now and make an impact on your audience. Highlight the attractive features available with our PPTs. This slide presents project dashboard for tracking task status or phases of project, that would help to monitor progress. It includes information on ongoing phase, budget, risks, pending tasks etc
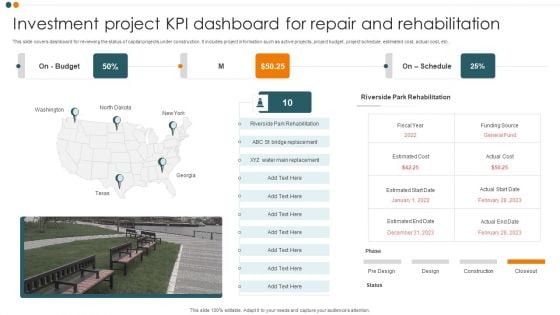
Investment Project KPI Dashboard For Repair And Rehabilitation Sample PDF
This slide covers dashboard for reviewing the status of capital projects under construction. It includes project information such as active projects, project budget, project schedule, estimated cost, actual cost, etc. Pitch your topic with ease and precision using this Investment Project KPI Dashboard For Repair And Rehabilitation Sample PDF. This layout presents information on Riverside Park Rehabilitation, Construction, Pre Design. It is also available for immediate download and adjustment. So, changes can be made in the color, design, graphics or any other component to create a unique layout.
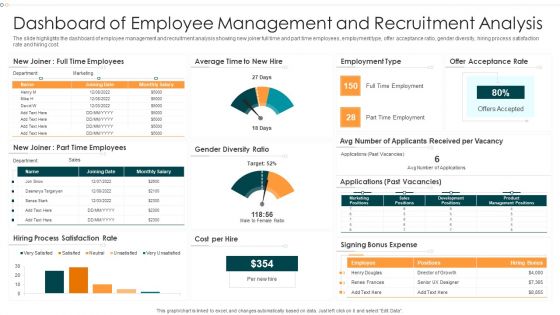
Dashboard Of Employee Management And Recruitment Analysis Infographics PDF
The slide highlights the dashboard of employee management and recruitment analysis showing new joiner full time and part time employees, employment type, offer acceptance ratio, gender diversity, hiring process satisfaction rate and hiring cost.Pitch your topic with ease and precision using this Dashboard Of Employee Management And Recruitment Analysis Infographics PDF This layout presents information on Dashboard Employee, Management, Recruitment Analysis It is also available for immediate download and adjustment. So, changes can be made in the color, design, graphics or any other component to create a unique layout.
Project Metrics Dashboard With Task Summary Icons PDF
This slide shows the project management dashboard which covers the summary of different projects with time, cost, workload, tasks and progress with workload, created verses completed tasks, time spent on managing projects, etc. Showcasing this set of slides titled Project Metrics Dashboard With Task Summary Icons PDF. The topics addressed in these templates are Project Metrics Dashboard, Task Summary. All the content presented in this PPT design is completely editable. Download it and make adjustments in color, background, font etc. as per your unique business setting.
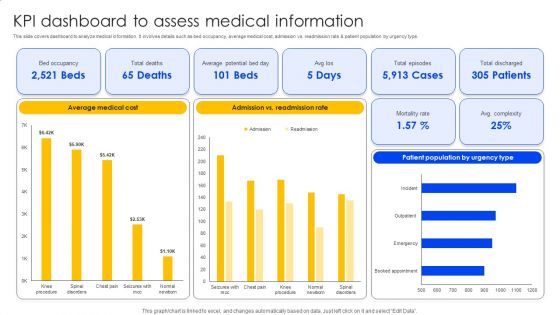
KPI Dashboard To Assess Medical Information Clipart PDF
This slide covers dashboard to analyze medical information. It involves details such as bed occupancy, average medical cost, admission vs. readmission rate and patient population by urgency type. Get a simple yet stunning designed KPI Dashboard To Assess Medical Information Clipart PDF. It is the best one to establish the tone in your meetings. It is an excellent way to make your presentations highly effective. So, download this PPT today from Slidegeeks and see the positive impacts. Our easy to edit KPI Dashboard To Assess Medical Information Clipart PDF can be your go to option for all upcoming conferences and meetings. So, what are you waiting for Grab this template today.
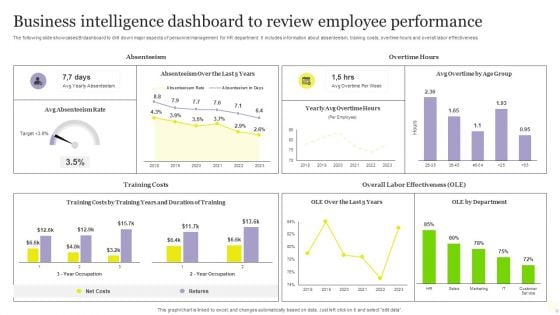
Business Intelligence Dashboard To Review Employee Performance Pictures PDF
The following slide showcases BI dashboard to drill down major aspects of personnel management for HR department. It includes information about absenteeism, training costs, overtime hours and overall labor effectiveness. Showcasing this set of slides titled Business Intelligence Dashboard To Review Employee Performance Pictures PDF. The topics addressed in these templates are Business Intelligence Dashboard, Review Employee Performance. All the content presented in this PPT design is completely editable. Download it and make adjustments in color, background, font etc. as per your unique business setting.
Dashboard Tracking Essential Kpis For Ecommerce Performance Slides PDF
This slide provides information regarding essential KPIs for ecommerce performance dashboard tracking average bounce rate, new vs. old customers, channel revenue vs. channel acquisitions costs, channel revenue vs. sales, average conversion rate, etc. Deliver an awe inspiring pitch with this creative Dashboard Tracking Essential Kpis For Ecommerce Performance Slides PDF bundle. Topics like Average Bounce Rate, Channel Acquisition Costs, Channel Revenue can be discussed with this completely editable template. It is available for immediate download depending on the needs and requirements of the user.
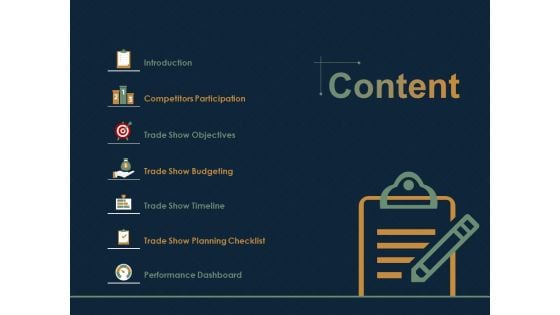
Content Performance Dashboard Ppt PowerPoint Presentation Portfolio Grid
This is a content performance dashboard ppt powerpoint presentation portfolio grid. This is a seven stage process. The stages in this process are introduction, performance dashboard, competitors participation, trade show budgeting, marketing.
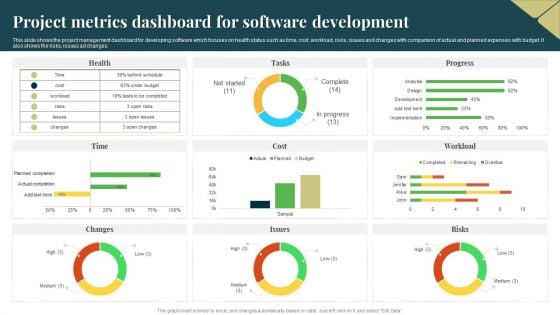
Project Metrics Dashboard For Software Development Designs PDF
This slide shows the project management dashboard for developing software which focuses on health status such as time, cost, workload, risks, issues and changes with comparison of actual and planned expenses with budget. It also shows the risks, issues ad changes. Pitch your topic with ease and precision using this Project Metrics Dashboard For Software Development Designs PDF. This layout presents information on Risks, Budget, Cost. It is also available for immediate download and adjustment. So, changes can be made in the color, design, graphics or any other component to create a unique layout.
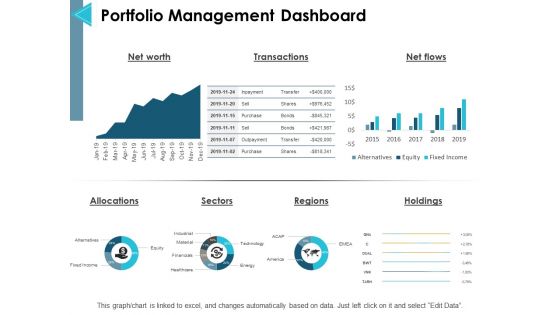
Portfolio Management Dashboard Ppt PowerPoint Presentation Summary Visual Aids
This is a portfolio management dashboard ppt powerpoint presentation summary visual aids. The topics discussed in this diagram are portfolio management dashboard, management, marketing, business, strategy. This is a completely editable PowerPoint presentation, and is available for immediate download.
Dashboard For Tracking Logistics Management Strategy Results Ideas PDF
This slide covers a dashboard for tracking the logistics operations KPIs. It includes metrics such as warehousing operating cost, perfect order rate, total shipments by areas, on time shipments, etc. Pitch your topic with ease and precision using this dashboard for tracking logistics management strategy results ideas pdf. This layout presents information on cost, warehouse, rate. It is also available for immediate download and adjustment. So, changes can be made in the color, design, graphics or any other component to create a unique layout.
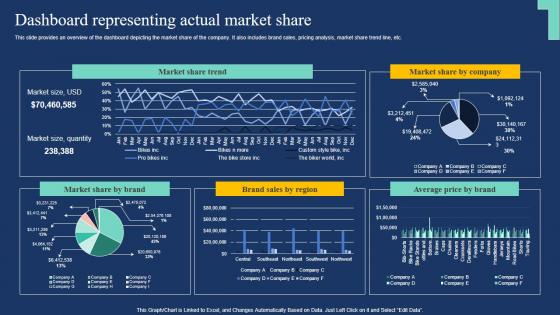
Dashboard Representing Actual Market Share Market Expansion Tactic Topics Pdf
This slide provides an overview of the dashboard depicting the market share of the company. It also includes brand sales, pricing analysis, market share trend line, etc. If your project calls for a presentation, then Slidegeeks is your go-to partner because we have professionally designed, easy-to-edit templates that are perfect for any presentation. After downloading, you can easily edit Dashboard Representing Actual Market Share Market Expansion Tactic Topics Pdf and make the changes accordingly. You can rearrange slides or fill them with different images. Check out all the handy templates This slide provides an overview of the dashboard depicting the market share of the company. It also includes brand sales, pricing analysis, market share trend line, etc.

Project Metrics Dashboard With Average Margin Sample PDF
This slide focuses on project management dashboard which covers number of active projects, average margin, revenues, costs, tasks status, resources with planned and actual efforts, available hours, tasks assignments with project deadlines, client, etc. Pitch your topic with ease and precision using this Project Metrics Dashboard With Average Margin Sample PDF. This layout presents information on Average Margin, Revenue, Cost. It is also available for immediate download and adjustment. So, changes can be made in the color, design, graphics or any other component to create a unique layout.
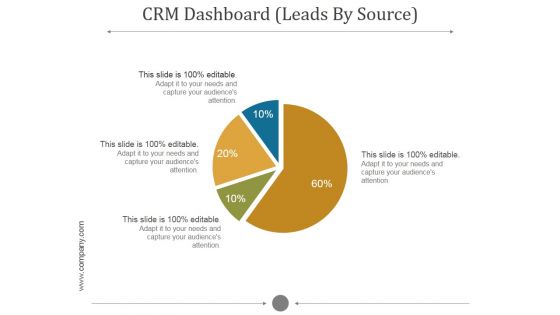
Crm Dashboard Leads By Source Ppt PowerPoint Presentation Example File
This is a crm dashboard leads by source ppt powerpoint presentation example file. This is a five stage process. The stages in this process are pie, division, finance, dashboard, percent.
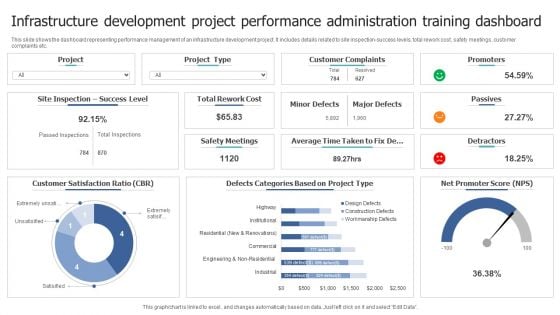
Infrastructure Development Project Performance Administration Training Dashboard Professional PDF
This slide shows the dashboard representing performance management of an infrastructure development project. It includes details related to site inspection success levels, total rework cost, safety meetings, customer complaints etc. Showcasing this set of slides titled Infrastructure Development Project Performance Administration Training Dashboard Professional PDF. The topics addressed in these templates are Customer Satisfaction Ratio, Customer Complaints, Rework Cost. All the content presented in this PPT design is completely editable. Download it and make adjustments in color, background, font etc. as per your unique business setting.
Storage Facility Productivity Tracking KPI Dashboard Graphics PDF
This slide showcases a dashboard for tracking and managing warehouse productivity to optimize logistics operations. It includes key components such as warehouse operating costs, perfect order rate, total shipments by country and on time shipments. Showcasing this set of slides titled Storage Facility Productivity Tracking KPI Dashboard Graphics PDF. The topics addressed in these templates are Warehouse Operating Costs, Perfect Order Rate, Total Shipment Country. All the content presented in this PPT design is completely editable. Download it and make adjustments in color, background, font etc. as per your unique business setting.
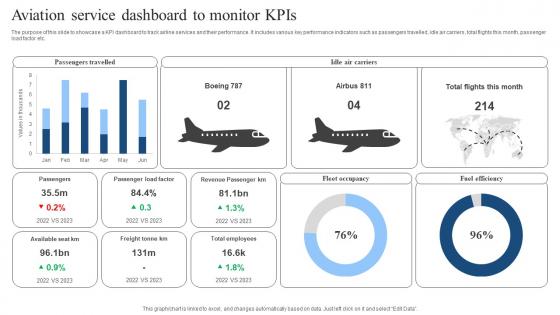
Aviation Service Dashboard To Monitor KPIs Download Pdf
The purpose of this slide to showcase a KPI dashboard to track airline services and their performance. It includes various key performance indicators such as passengers travelled, idle air carriers, total flights this month, passenger load factor etc. Pitch your topic with ease and precision using this Aviation Service Dashboard To Monitor KPIs Download Pdf. This layout presents information on Fleet Occupancy, Fuel Efficiency, Passengers Travelled. It is also available for immediate download and adjustment. So, changes can be made in the color, design, graphics or any other component to create a unique layout. The purpose of this slide to showcase a KPI dashboard to track airline services and their performance. It includes various key performance indicators such as passengers travelled, idle air carriers, total flights this month, passenger load factor etc.
Dashboard For Tracking The AQAM Effectiveness Mockup PDF
This slide illustrates the KPI dashboard used for tracking the effectiveness of agile quality assurance model. KPIs covered in the dashboard are release and quality compliance, test functions and defects. Deliver and pitch your topic in the best possible manner with this dashboard for tracking the aqam effectiveness mockup pdf. Use them to share invaluable insights on quality, application, dashboard and impress your audience. This template can be altered and modified as per your expectations. So, grab it now.
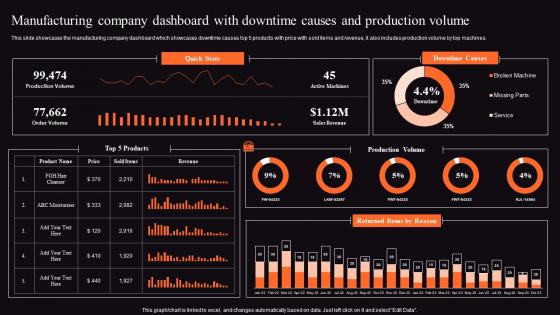
Food Processing Business Profile Manufacturing Company Dashboard Brochure Pdf
This slide showcases the manufacturing company dashboard which showcases downtime causes top 5 products with price with sold items and revenue, it also includes production volume by top machines. Do you know about Slidesgeeks Food Processing Business Profile Manufacturing Company Dashboard Brochure Pdf These are perfect for delivering any kind od presentation. Using it, create PowerPoint presentations that communicate your ideas and engage audiences. Save time and effort by using our pre designed presentation templates that are perfect for a wide range of topic. Our vast selection of designs covers a range of styles, from creative to business, and are all highly customizable and easy to edit. Download as a PowerPoint template or use them as Google Slides themes. This slide showcases the manufacturing company dashboard which showcases downtime causes top 5 products with price with sold items and revenue, it also includes production volume by top machines.
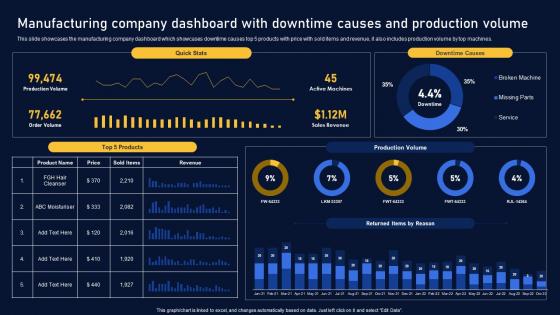
Manufacturing Company Dashboard Multinational Organization Customer Goods Diagrams Pdf
This slide showcases the manufacturing company dashboard which showcases downtime causes top 5 products with price with sold items and revenue, it also includes production volume by top machines. This modern and well arranged Manufacturing Company Dashboard Multinational Organization Customer Goods Diagrams Pdf provides lots of creative possibilities. It is very simple to customize and edit with the Powerpoint Software. Just drag and drop your pictures into the shapes. All facets of this template can be edited with Powerpoint, no extra software is necessary. Add your own material, put your images in the places assigned for them, adjust the colors, and then you can show your slides to the world, with an animated slide included. This slide showcases the manufacturing company dashboard which showcases downtime causes top 5 products with price with sold items and revenue, it also includes production volume by top machines.
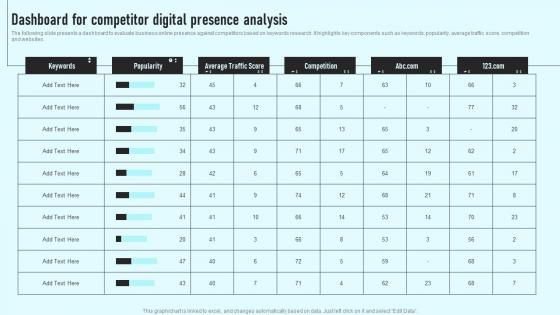
Dashboard For Competitor Digital Presence Analysis Comprehensive Guide Topics Pdf
The following slide presents a dashboard to evaluate business online presence against competitors based on keywords research. It highlights key components such as keywords, popularity, average traffic score, competition and websites. The Dashboard For Competitor Digital Presence Analysis Comprehensive Guide Topics Pdf is a compilation of the most recent design trends as a series of slides. It is suitable for any subject or industry presentation, containing attractive visuals and photo spots for businesses to clearly express their messages. This template contains a variety of slides for the user to input data, such as structures to contrast two elements, bullet points, and slides for written information. Slidegeeks is prepared to create an impression. The following slide presents a dashboard to evaluate business online presence against competitors based on keywords research. It highlights key components such as keywords, popularity, average traffic score, competition and websites.
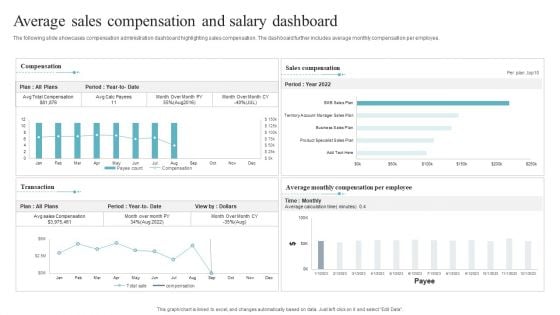
Average Sales Compensation And Salary Dashboard Introduction PDF
The following slide showcases compensation administration dashboard highlighting sales compensation. The dashboard further includes average monthly compensation per employee. Pitch your topic with ease and precision using this Average Sales Compensation And Salary Dashboard Introduction PDF. This layout presents information on Salary Dashboard, Average Sales Compensation. It is also available for immediate download and adjustment. So, changes can be made in the color, design, graphics or any other component to create a unique layout.
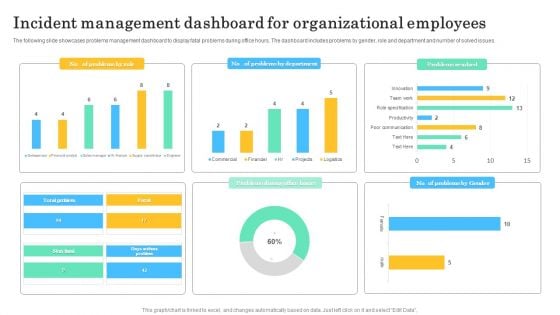
Incident Management Dashboard For Organizational Employees Infographics PDF
The following slide showcases problems management dashboard to display fatal problems during office hours. The dashboard includes problems by gender, role and department and number of solved issues. Showcasing this set of slides titled Incident Management Dashboard For Organizational Employees Infographics PDF. The topics addressed in these templates are Incident Management Dashboard, Organizational Employees. All the content presented in this PPT design is completely editable. Download it and make adjustments in color, background, font etc. as per your unique business setting.
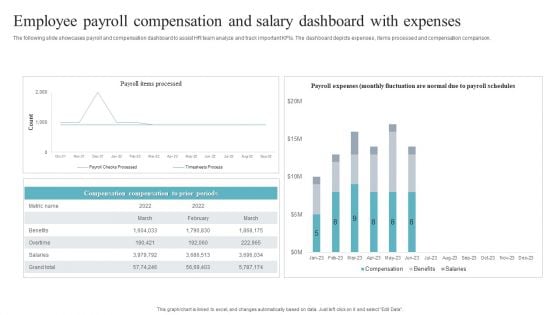
Employee Payroll Compensation And Salary Dashboard With Expenses Professional PDF
The following slide showcases payroll and compensation dashboard to assist HR team analyze and track important KPIs. The dashboard depicts expenses , items processed and compensation comparison. Showcasing this set of slides titled Employee Payroll Compensation And Salary Dashboard With Expenses Professional PDF. The topics addressed in these templates are Employee Payroll Compensation, Salary Dashboard With Expenses. All the content presented in this PPT design is completely editable. Download it and make adjustments in color, background, font etc. as per your unique business setting.
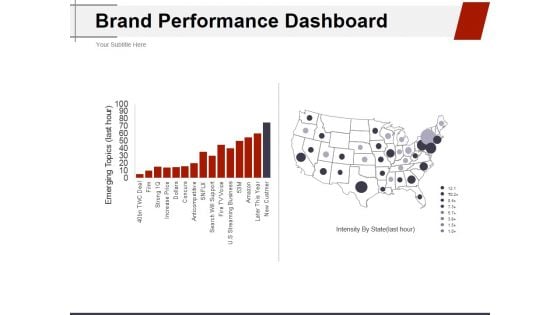
Brand Performance Dashboard Template 1 Ppt PowerPoint Presentation Microsoft
This is a brand performance dashboard template 1 ppt powerpoint presentation microsoft. This is a two stage process. The stages in this process are business, brand, performance, dashboard, marketing.
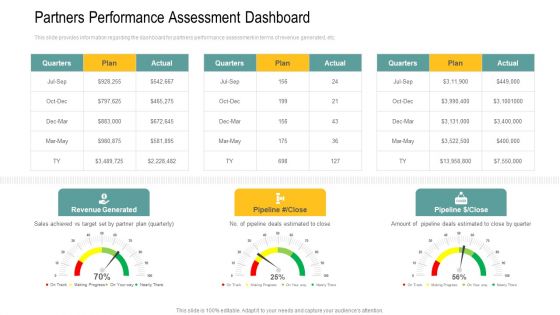
Partners Performance Assessment Dashboard Ppt Infographic Template Elements PDF
This slide provides information regarding the dashboard for partners performance assessment in terms of revenue generated, etc. Deliver an awe-inspiring pitch with this creative partners performance assessment dashboard ppt infographic template elements pdf bundle. Topics like partners performance assessment dashboard can be discussed with this completely editable template. It is available for immediate download depending on the needs and requirements of the user.
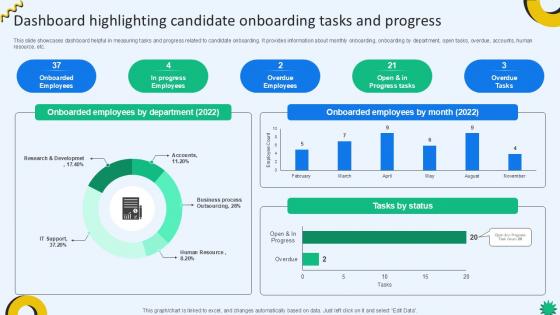
Dashboard Highlighting Candidate Cloud Recruiting Technologies PPT Sample
This slide showcases dashboard helpful in measuring tasks and progress related to candidate onboarding. It provides information about monthly onboarding, onboarding by department, open tasks, overdue, accounts, human resource, etc. Present like a pro with Dashboard Highlighting Candidate Cloud Recruiting Technologies PPT Sample. Create beautiful presentations together with your team, using our easy-to-use presentation slides. Share your ideas in real-time and make changes on the fly by downloading our templates. So whether you are in the office, on the go, or in a remote location, you can stay in sync with your team and present your ideas with confidence. With Slidegeeks presentation got a whole lot easier. Grab these presentations today. This slide showcases dashboard helpful in measuring tasks and progress related to candidate onboarding. It provides information about monthly onboarding, onboarding by department, open tasks, overdue, accounts, human resource, etc.
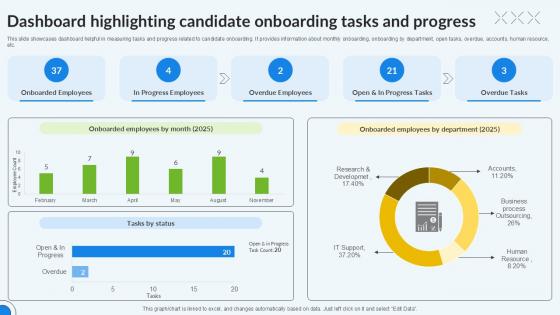
Dashboard Highlighting Candidate Enhancing Recruitment Process PPT Presentation
This slide showcases dashboard helpful in measuring tasks and progress related to candidate onboarding. It provides information about monthly onboarding, onboarding by department, open tasks, overdue, accounts, human resource, etc. Present like a pro with Dashboard Highlighting Candidate Enhancing Recruitment Process PPT Presentation. Create beautiful presentations together with your team, using our easy-to-use presentation slides. Share your ideas in real-time and make changes on the fly by downloading our templates. So whether you are in the office, on the go, or in a remote location, you can stay in sync with your team and present your ideas with confidence. With Slidegeeks presentation got a whole lot easier. Grab these presentations today. This slide showcases dashboard helpful in measuring tasks and progress related to candidate onboarding. It provides information about monthly onboarding, onboarding by department, open tasks, overdue, accounts, human resource, etc.
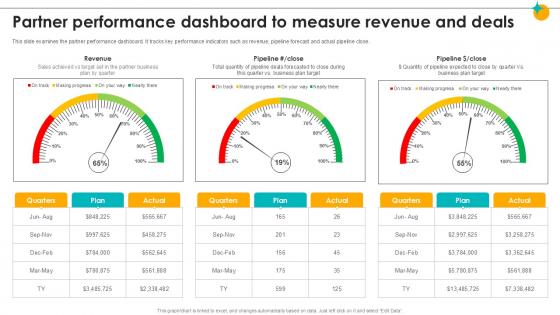
Partner Performance Dashboard To Measure Revenue Partner Relationship Ppt Template
This slide examines the partner performance dashboard. It tracks key performance indicators such as revenue, pipeline forecast and actual pipeline close. Are you in need of a template that can accommodate all of your creative concepts This one is crafted professionally and can be altered to fit any style. Use it with Google Slides or PowerPoint. Include striking photographs, symbols, depictions, and other visuals. Fill, move around, or remove text boxes as desired. Test out color palettes and font mixtures. Edit and save your work, or work with colleagues. Download Partner Performance Dashboard To Measure Revenue Partner Relationship Ppt Template and observe how to make your presentation outstanding. Give an impeccable presentation to your group and make your presentation unforgettable. This slide examines the partner performance dashboard. It tracks key performance indicators such as revenue, pipeline forecast and actual pipeline close.
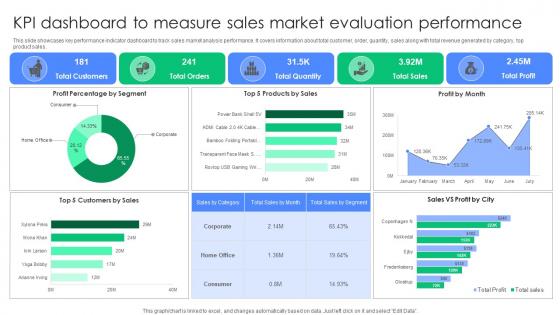
KPI Dashboard To Measure Sales Market Evaluation Performance Summary Pdf
This slide showcases key performance indicator dashboard to track sales market analysis performance. It covers information about total customer, order, quantity, sales along with total revenue generated by category, top product sales. Pitch your topic with ease and precision using this KPI Dashboard To Measure Sales Market Evaluation Performance Summary Pdf. This layout presents information on Profit Percentage Segment, Products Sales, Profit Month. It is also available for immediate download and adjustment. So, changes can be made in the color, design, graphics or any other component to create a unique layout. This slide showcases key performance indicator dashboard to track sales market analysis performance. It covers information about total customer, order, quantity, sales along with total revenue generated by category, top product sales.
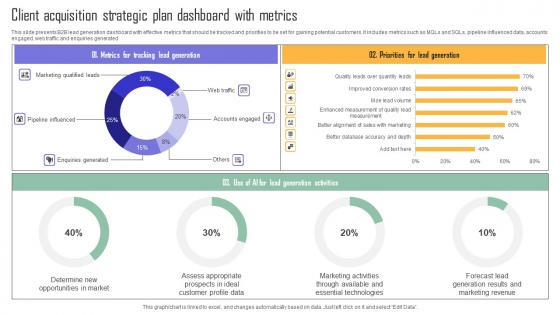
Client Acquisition Strategic Plan Dashboard With Metrics Clipart Pdf
This slide presents B2B lead generation dashboard with effective metrics that should be tracked and priorities to be set for gaining potential customers. It includes metrics such as MQLs and SQLs, pipeline influenced data, accounts engaged, web traffic and enquiries generated. Pitch your topic with ease and precision using this Client Acquisition Strategic Plan Dashboard With Metrics Clipart Pdf. This layout presents information on Priorities For Lead Generation, Tracking Lead Generation. It is also available for immediate download and adjustment. So, changes can be made in the color, design, graphics or any other component to create a unique layout. This slide presents B2B lead generation dashboard with effective metrics that should be tracked and priorities to be set for gaining potential customers. It includes metrics such as MQLs and SQLs, pipeline influenced data, accounts engaged, web traffic and enquiries generated.

Unlocking Potential Enhancing Team Management Dashboard To Track Task Completion
This slide depicts dashboard intended to track task completion rate within teams and its management. It includes data about team roles, planned vs actual tasks, task by status, total utilized work hours and task summary. This Unlocking Potential Enhancing Team Management Dashboard To Track Task Completion from Slidegeeks makes it easy to present information on your topic with precision. It provides customization options, so you can make changes to the colors, design, graphics, or any other component to create a unique layout. It is also available for immediate download, so you can begin using it right away. Slidegeeks has done good research to ensure that you have everything you need to make your presentation stand out. Make a name out there for a brilliant performance. This slide depicts dashboard intended to track task completion rate within teams and its management. It includes data about team roles, planned vs actual tasks, task by status, total utilized work hours and task summary.
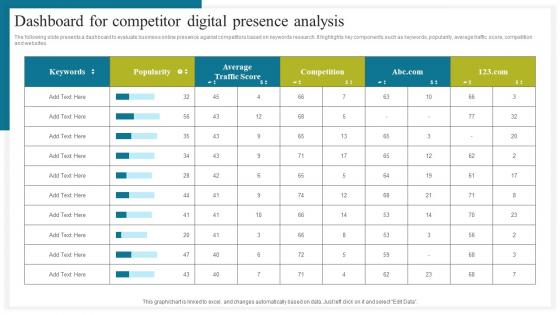
Dashboard For Competitor How To Conduct Competitive Assessment Formats Pdf
The following slide presents a dashboard to evaluate business online presence against competitors based on keywords research. It highlights key components such as keywords, popularity, average traffic score, competition and websites. The Dashboard For Competitor How To Conduct Competitive Assessment Formats Pdf is a compilation of the most recent design trends as a series of slides. It is suitable for any subject or industry presentation, containing attractive visuals and photo spots for businesses to clearly express their messages. This template contains a variety of slides for the user to input data, such as structures to contrast two elements, bullet points, and slides for written information. Slidegeeks is prepared to create an impression. The following slide presents a dashboard to evaluate business online presence against competitors based on keywords research. It highlights key components such as keywords, popularity, average traffic score, competition and websites.
Corporate Branding Performance Tracking Dashboard Strategies For Achieving Summary Pdf
This slide provides information regarding corporate branding performance tracking dashboard in terms of leads, conversion metrics, web traffic, etc. Slidegeeks is one of the best resources for PowerPoint templates. You can download easily and regulate Corporate Branding Performance Tracking Dashboard Strategies For Achieving Summary Pdf for your personal presentations from our wonderful collection. A few clicks is all it takes to discover and get the most relevant and appropriate templates. Use our Templates to add a unique zing and appeal to your presentation and meetings. All the slides are easy to edit and you can use them even for advertisement purposes. This slide provides information regarding corporate branding performance tracking dashboard in terms of leads, conversion metrics, web traffic, etc.
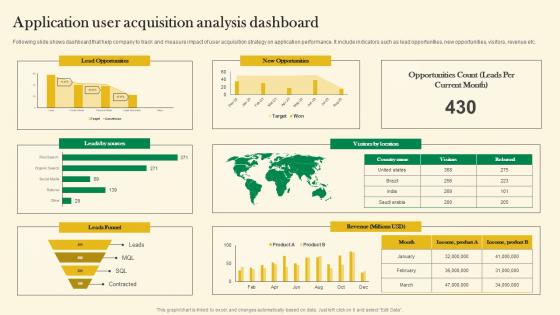
Application User Acquisition Analysis Dashboard Online Customer Acquisition Microsoft Pdf
Following slide shows dashboard that help company to track and measure impact of user acquisition strategy on application performance. It include indicators such as lead opportunities, new opportunities, visitors, revenue etc. The best PPT templates are a great way to save time, energy, and resources. Slidegeeks have 100 percent editable powerpoint slides making them incredibly versatile. With these quality presentation templates, you can create a captivating and memorable presentation by combining visually appealing slides and effectively communicating your message. Download Application User Acquisition Analysis Dashboard Online Customer Acquisition Microsoft Pdf from Slidegeeks and deliver a wonderful presentation. Following slide shows dashboard that help company to track and measure impact of user acquisition strategy on application performance. It include indicators such as lead opportunities, new opportunities, visitors, revenue etc.
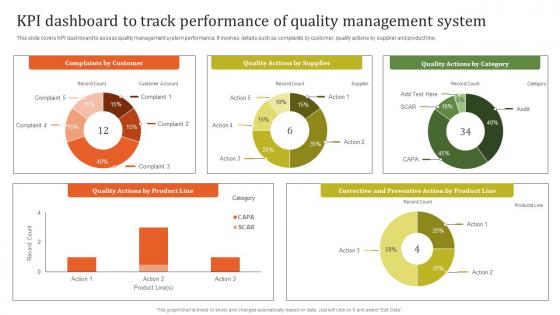
KPI Dashboard To Track Executing Effective Quality Enhancement Slides Pdf
This slide covers KPI dashboard to assess quality management system performance. It involves details such as complaints by customer, quality actions by supplier and product line. Slidegeeks is one of the best resources for PowerPoint templates. You can download easily and regulate KPI Dashboard To Track Executing Effective Quality Enhancement Slides Pdf for your personal presentations from our wonderful collection. A few clicks is all it takes to discover and get the most relevant and appropriate templates. Use our Templates to add a unique zing and appeal to your presentation and meetings. All the slides are easy to edit and you can use them even for advertisement purposes. This slide covers KPI dashboard to assess quality management system performance. It involves details such as complaints by customer, quality actions by supplier and product line.
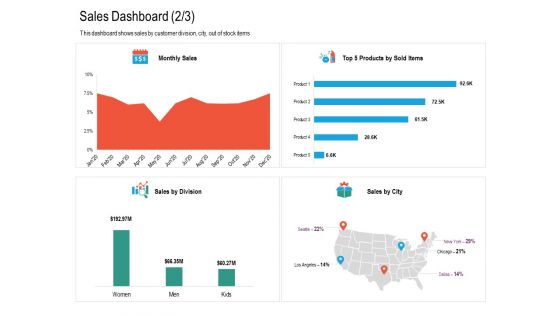
Upselling Strategies For Business Sales Dashboard Sales Structure PDF
This dashboard shows sales by customer division, city, out of stock items. Deliver an awe inspiring pitch with this creative upselling strategies for business sales dashboard sales structure pdf bundle. Topics like sales dashboard for fmcg cross selling can be discussed with this completely editable template. It is available for immediate download depending on the needs and requirements of the user.
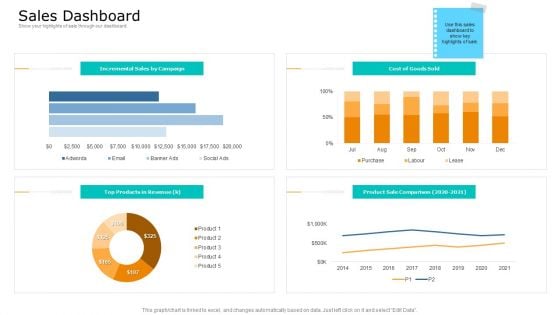
Commodity Unique Selling Proposition Sales Dashboard Pictures PDF
Show your highlights of sale through our dashboard. Deliver an awe inspiring pitch with this creative commodity unique selling proposition sales dashboard pictures pdf bundle. Topics like sales dashboard can be discussed with this completely editable template. It is available for immediate download depending on the needs and requirements of the user.
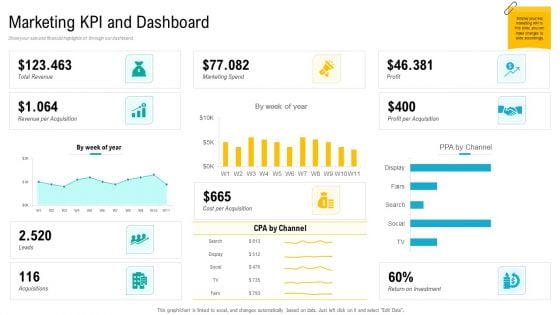
Product USP Marketing KPI And Dashboard Ppt Layouts Slides PDF
Show your sale and financial highlights of through our dashboard. Deliver an awe-inspiring pitch with this creative product usp marketing kpi and dashboard ppt layouts slides pdf bundle. Topics like marketing kpi and dashboard can be discussed with this completely editable template. It is available for immediate download depending on the needs and requirements of the user.
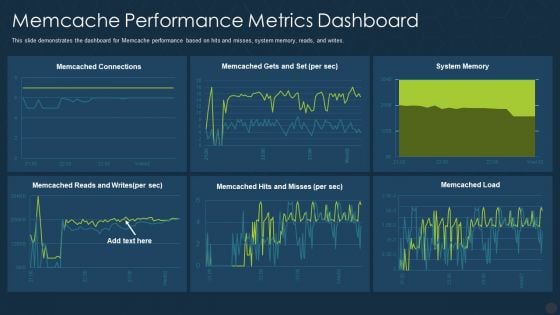
Memcache Performance Metrics Dashboard Ppt Portfolio Aids PDF
This slide demonstrates the dashboard for Memcache performance based on hits and misses, system memory, reads, and writes. Deliver an awe inspiring pitch with this creative memcache performance metrics dashboard ppt portfolio aids pdf bundle. Topics like memcache performance metrics dashboard can be discussed with this completely editable template. It is available for immediate download depending on the needs and requirements of the user.
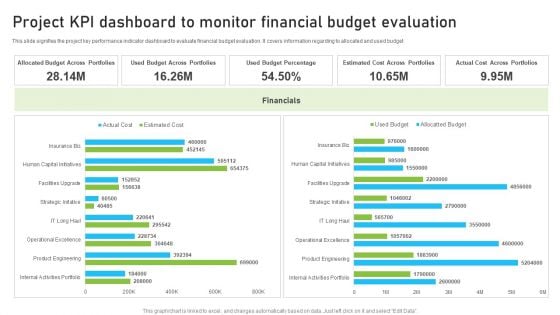
Project KPI Dashboard To Monitor Financial Budget Evaluation Demonstration PDF
This slide signifies the key performance indicator dashboard to evaluate financial estimation. It covers information regarding to expense, payable account and monthly performance. Showcasing this set of slides titled Project KPI Dashboard To Monitor Financial Budget Evaluation Demonstration PDF. The topics addressed in these templates are Project KPI Dashboard, Monitor Financial Budget Evaluation. All the content presented in this PPT design is completely editable. Download it and make adjustments in color, background, font etc. as per your unique business setting.
Strawman Project Action Plan Financial Performance Tracking Dashboard Template PDF
This slide presents the dashboard which will help firm in tracking the financial performance. This dashboard displays number of customers, vendors and revenues generated, expenses and profit incurred. Deliver an awe inspiring pitch with this creative strawman project action plan financial performance tracking dashboard template pdf bundle. Topics like performance, customers, profit can be discussed with this completely editable template. It is available for immediate download depending on the needs and requirements of the user.
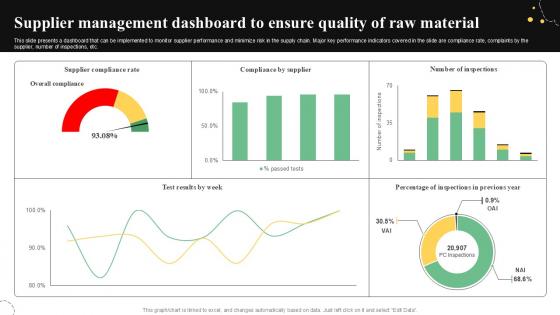
Supplier Management Dashboard Quality Control Guide For Food PPT Sample
This slide presents a dashboard that can be implemented to monitor supplier performance and minimize risk in the supply chain. Major key performance indicators covered in the slide are compliance rate, complaints by the supplier, number of inspections, etc. Present like a pro with Supplier Management Dashboard Quality Control Guide For Food PPT Sample. Create beautiful presentations together with your team, using our easy-to-use presentation slides. Share your ideas in real-time and make changes on the fly by downloading our templates. So whether you are in the office, on the go, or in a remote location, you can stay in sync with your team and present your ideas with confidence. With Slidegeeks presentation got a whole lot easier. Grab these presentations today. This slide presents a dashboard that can be implemented to monitor supplier performance and minimize risk in the supply chain. Major key performance indicators covered in the slide are compliance rate, complaints by the supplier, number of inspections, etc.
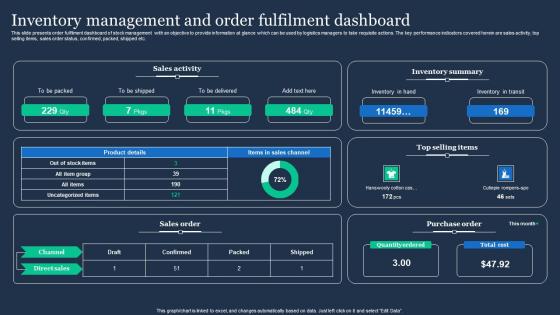
Inventory Management And Order Fulfilment Dashboard Slides Pdf
This slide presents order fulfilment dashboard of stock management with an objective to provide information at glance which can be used by logistics managers to take requisite actions. The key performance indicators covered herein are sales activity, top selling items, sales order status, confirmed, packed, shipped etc. Pitch your topic with ease and precision using this Inventory Management And Order Fulfilment Dashboard Slides Pdf. This layout presents information on Sales Activity, Inventory Summary, Sales Order. It is also available for immediate download and adjustment. So, changes can be made in the color, design, graphics or any other component to create a unique layout. This slide presents order fulfilment dashboard of stock management with an objective to provide information at glance which can be used by logistics managers to take requisite actions. The key performance indicators covered herein are sales activity, top selling items, sales order status, confirmed, packed, shipped etc.
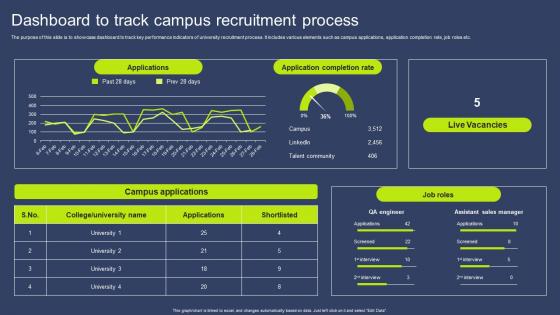
Dashboard To Track Campus Recruitment Process Clipart Pdf
The purpose of this slide is to showcase dashboard to track key performance indicators of university recruitment process. It includes various elements such as campus applications, application completion rate, job roles etc. Showcasing this set of slides titled Dashboard To Track Campus Recruitment Process Clipart Pdf. The topics addressed in these templates are Applications, Application Completion Rate, Live Vacancies. All the content presented in this PPT design is completely editable. Download it and make adjustments in color, background, font etc. as per your unique business setting. The purpose of this slide is to showcase dashboard to track key performance indicators of university recruitment process. It includes various elements such as campus applications, application completion rate, job roles etc.
Enhancing Global Presence Dashboard For Tracking Post Expansion Formats Pdf
This slide covers the dashboard for analyzing fast food business sales by region. It includes KPIs such as sales, sales target, target achievement, gross profit, gross profit margin, sales by channels, sales growth, etc.If your project calls for a presentation, then Slidegeeks is your go-to partner because we have professionally designed, easy-to-edit templates that are perfect for any presentation. After downloading, you can easily edit Enhancing Global Presence Dashboard For Tracking Post Expansion Formats Pdf and make the changes accordingly. You can rearrange slides or fill them with different images. Check out all the handy templates This slide covers the dashboard for analyzing fast food business sales by region. It includes KPIs such as sales, sales target, target achievement, gross profit, gross profit margin, sales by channels, sales growth, etc.
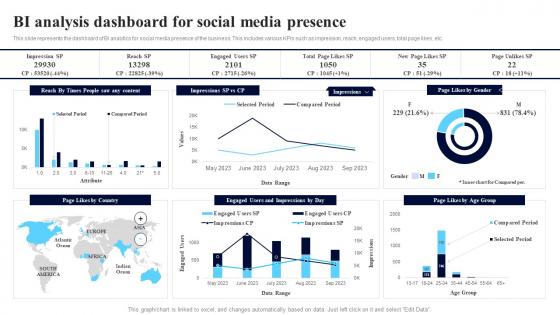
BI Analysis Dashboard For Social Media Presence Introduction Pdf
This slide represents the dashboard of BI analytics for social media presence of the business. This includes various KPIs such as impression, reach, engaged users, total page likes, etc. Pitch your topic with ease and precision using this BI Analysis Dashboard For Social Media Presence Introduction Pdf. This layout presents information on Impressions, Page Likes, Engaged Users. It is also available for immediate download and adjustment. So, changes can be made in the color, design, graphics or any other component to create a unique layout. This slide represents the dashboard of BI analytics for social media presence of the business. This includes various KPIs such as impression, reach, engaged users, total page likes, etc.
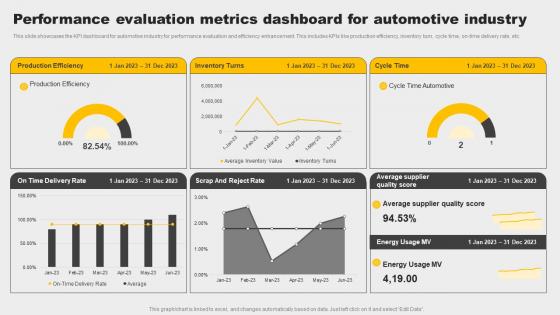
Performance Evaluation Metrics Dashboard For Automotive Industry Mockup Pdf
This slide showcases the KPI dashboard for automotive industry for performance evaluation and efficiency enhancement. This includes KPIs like production efficiency, inventory turn, cycle time, on time delivery rate, etc. Pitch your topic with ease and precision using this Performance Evaluation Metrics Dashboard For Automotive Industry Mockup Pdf. This layout presents information on Production Efficiency, Inventory Turns, Automotive Industry. It is also available for immediate download and adjustment. So, changes can be made in the color, design, graphics or any other component to create a unique layout. This slide showcases the KPI dashboard for automotive industry for performance evaluation and efficiency enhancement. This includes KPIs like production efficiency, inventory turn, cycle time, on time delivery rate, etc.
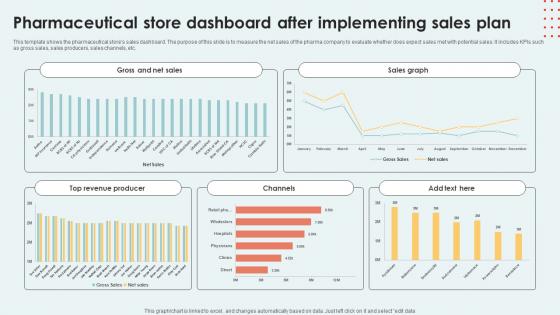
Pharmaceutical Store Dashboard After Implementing Sales Plan Inspiration Pdf
This template shows the pharmaceutical stores sales dashboard. The purpose of this slide is to measure the net sales of the pharma company to evaluate whether does expect sales met with potential sales. It includes KPIs such as gross sales, sales producers, sales channels, etc.Pitch your topic with ease and precision using this Pharmaceutical Store Dashboard After Implementing Sales Plan Inspiration Pdf This layout presents information on Gross Net Sales, Sales Graph, Top Revenue Producer It is also available for immediate download and adjustment. So, changes can be made in the color, design, graphics or any other component to create a unique layout. This template shows the pharmaceutical stores sales dashboard. The purpose of this slide is to measure the net sales of the pharma company to evaluate whether does expect sales met with potential sales. It includes KPIs such as gross sales, sales producers, sales channels, etc.
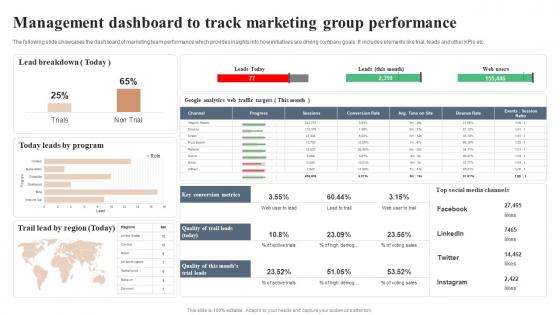
Management Dashboard To Track Marketing Group Performance Formats Pdf
The following slide showcases the dashboard of marketing team performance which provides insights into how initiatives are driving company goals. It includes elements like trial, leads and other KPIs etc. Showcasing this set of slides titled Management Dashboard To Track Marketing Group Performance Formats Pdf. The topics addressed in these templates are Lead Breakdown, Leads By Program, Lead By Region. All the content presented in this PPT design is completely editable. Download it and make adjustments in color, background, font etc. as per your unique business setting. The following slide showcases the dashboard of marketing team performance which provides insights into how initiatives are driving company goals. It includes elements like trial, leads and other KPIs etc.
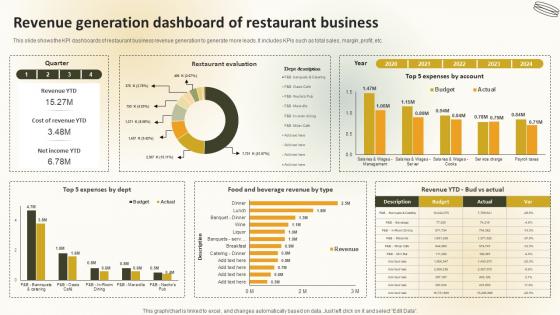
Revenue Generation Dashboard Of Restaurant Business Create An Effective Restaurant
This slide shows the KPI dashboards of restaurant business revenue generation to generate more leads. It includes KPIs such as total sales, margin,profit, etc. Present like a pro with Revenue Generation Dashboard Of Restaurant Business Create An Effective Restaurant. Create beautiful presentations together with your team, using our easy-to-use presentation slides. Share your ideas in real-time and make changes on the fly by downloading our templates. So whether you are in the office, on the go, or in a remote location, you can stay in sync with your team and present your ideas with confidence. With Slidegeeks presentation got a whole lot easier. Grab these presentations today. This slide shows the KPI dashboards of restaurant business revenue generation to generate more leads. It includes KPIs such as total sales, margin,profit, etc.

Create A Restaurant Marketing Revenue Generation Dashboard Of Restaurant
This slide shows the KPI dashboards of restaurant business revenue generation to generate more leads. It includes KPIs such as total sales, margin ,profit, etc. Present like a pro with Create A Restaurant Marketing Revenue Generation Dashboard Of Restaurant. Create beautiful presentations together with your team, using our easy-to-use presentation slides. Share your ideas in real-time and make changes on the fly by downloading our templates. So whether you are in the office, on the go, or in a remote location, you can stay in sync with your team and present your ideas with confidence. With Slidegeeks presentation got a whole lot easier. Grab these presentations today. This slide shows the KPI dashboards of restaurant business revenue generation to generate more leads. It includes KPIs such as total sales, margin ,profit, etc.


 Continue with Email

 Home
Home


