Cost Icon
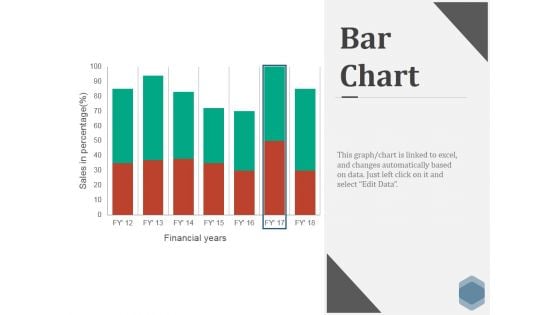
Bar Chart Ppt PowerPoint Presentation Infographics Skills
This is a bar chart ppt powerpoint presentation infographics skills. This is a seven stage process. The stages in this process are business, marketing, strategy, finance, bar.
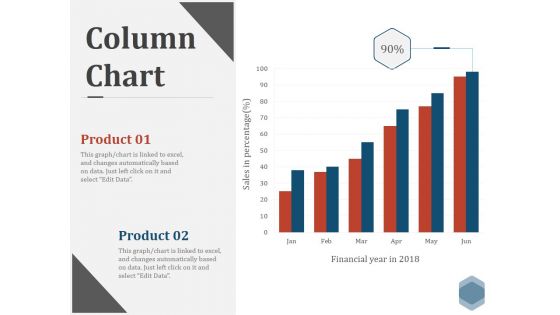
Column Chart Ppt PowerPoint Presentation File Formats
This is a column chart ppt powerpoint presentation file formats. This is a six stage process. The stages in this process are business, marketing, strategy, finance, bar.
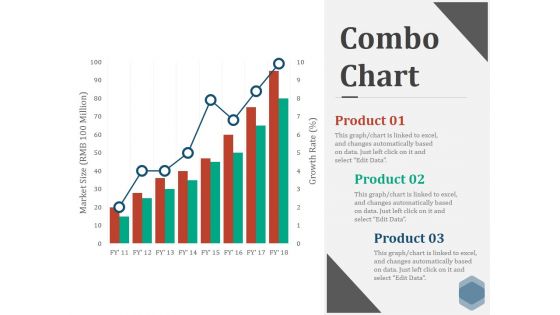
Combo Chart Ppt PowerPoint Presentation Pictures Graphics
This is a combo chart ppt powerpoint presentation pictures graphics. This is a eight stage process. The stages in this process are business, marketing, strategy, finance, bar.
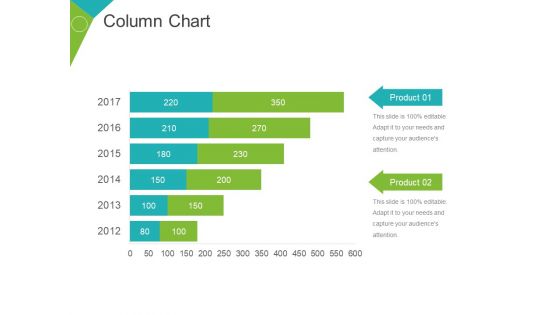
Column Chart Ppt PowerPoint Presentation Gallery
This is a column chart ppt powerpoint presentation gallery. This is a six stage process. The stages in this process are business, finance, years, product, graph.
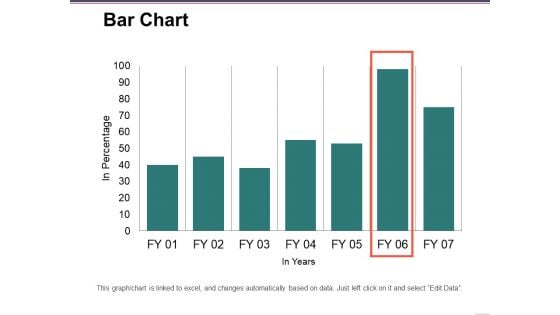
Bar Chart Ppt PowerPoint Presentation Pictures Inspiration
This is a bar chart ppt powerpoint presentation pictures inspiration. This is a seven stage process. The stages in this process are in percentage, business, marketing, finance, graph.
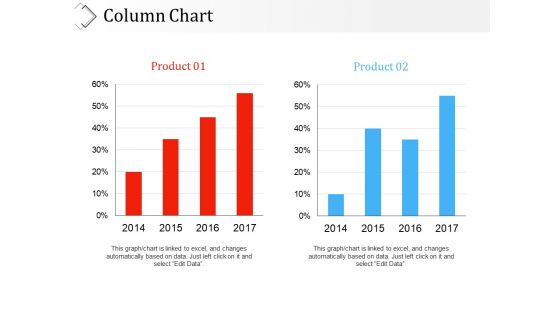
Column Chart Ppt PowerPoint Presentation Inspiration Deck
This is a column chart ppt powerpoint presentation inspiration deck. This is a two stage process. The stages in this process are years, business, marketing, graph, finance, product.
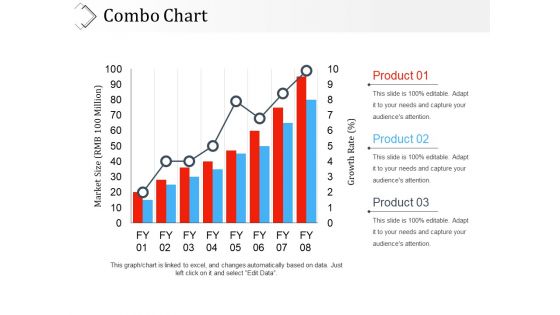
Combo Chart Ppt PowerPoint Presentation Ideas Portrait
This is a combo chart ppt powerpoint presentation ideas portrait. This is a three stage process. The stages in this process are product, business, finance, growth.
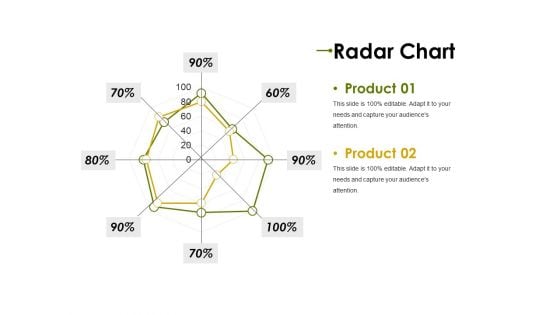
Radar Chart Ppt PowerPoint Presentation Styles Guide
This is a radar chart ppt powerpoint presentation styles guide. This is a two stage process. The stages in this process are product, graph, business, marketing, finance.
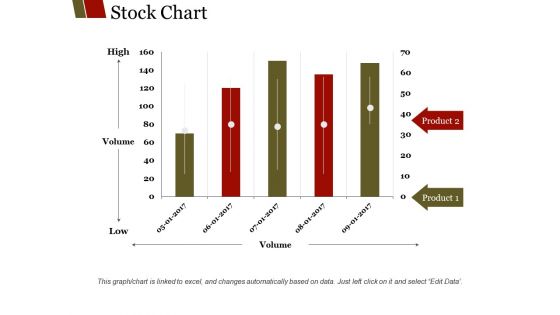
Stock Chart Ppt PowerPoint Presentation Outline Slideshow
This is a stock chart ppt powerpoint presentation outline slideshow. This is a five stage process. The stages in this process are high, volume, low, product, finance.
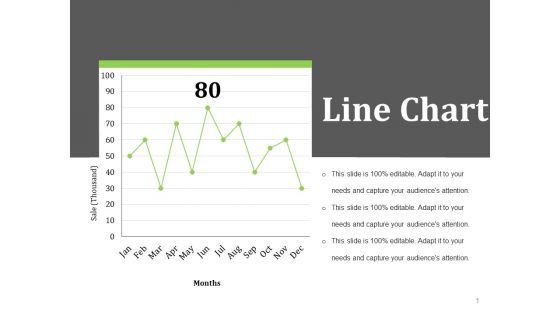
Line Chart Ppt PowerPoint Presentation Slides Template
This is a line chart ppt powerpoint presentation slides template. This is a one stage process. The stages in this process are months, sale thousand, business, marketing, finance.
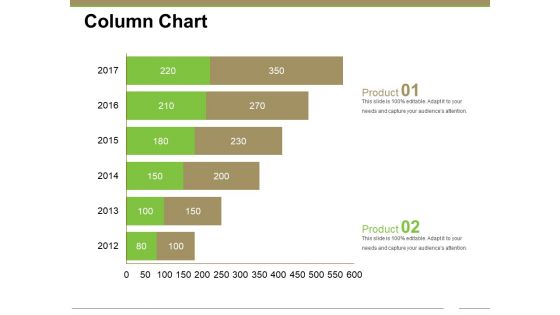
Column Chart Ppt PowerPoint Presentation Gallery Styles
This is a column chart ppt powerpoint presentation gallery styles. This is a two stage process. The stages in this process are years, graph, business, marketing, finance.
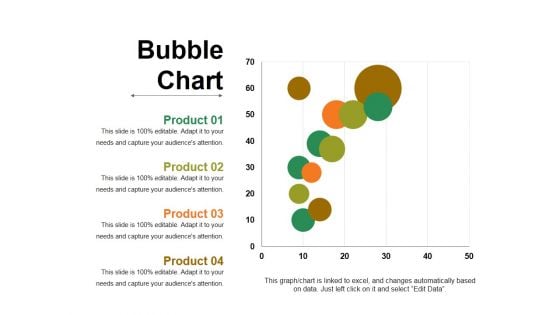
Bubble Chart Ppt PowerPoint Presentation Show Graphics
This is a bubble chart ppt powerpoint presentation show graphics. This is a four stage process. The stages in this process are business, marketing, graph, finance, strategy.
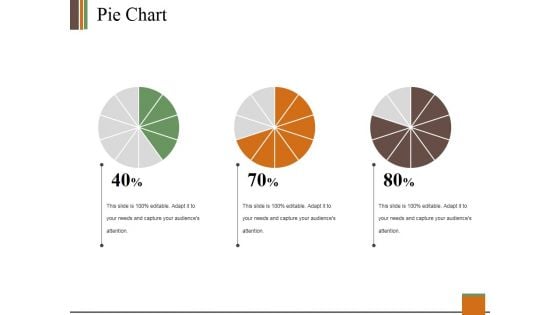
Pie Chart Ppt PowerPoint Presentation Summary Infographics
This is a pie chart ppt powerpoint presentation summary infographics. This is a three stage process. The stages in this process are pie, process, percentage, finance, business.
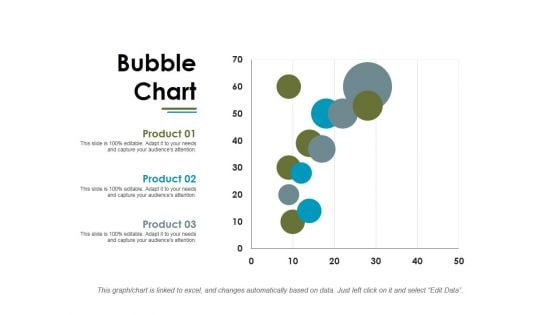
Bubble Chart Ppt PowerPoint Presentation Summary Microsoft
This is a bubble chart ppt powerpoint presentation summary microsoft. This is a three stage process. The stages in this process are business, marketing, graph, finance, planning.
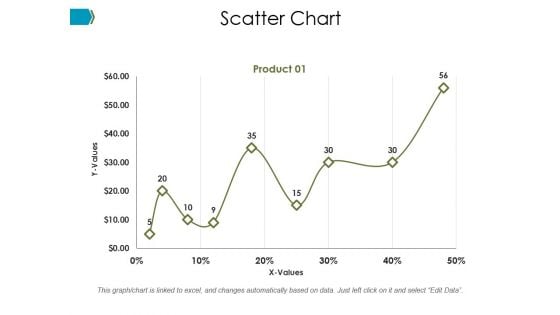
Scatter Chart Ppt PowerPoint Presentation Styles Background
This is a scatter chart ppt powerpoint presentation styles background. This is a one stage process. The stages in this process are business, marketing, strategy, finance, graph.
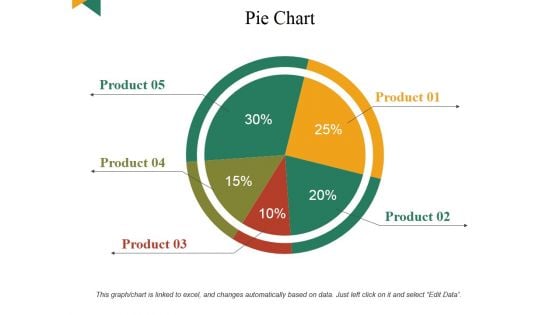
Pie Chart Ppt PowerPoint Presentation Inspiration Images
This is a pie chart ppt powerpoint presentation inspiration images. This is a five stage process. The stages in this process are business, marketing, finance, pie, planning.
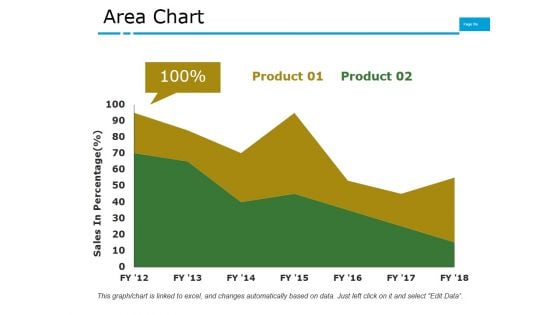
Area Chart Ppt PowerPoint Presentation Model Format
This is a area chart ppt powerpoint presentation model format. This is a two stage process. The stages in this process are business, marketing, finance, graph, growth.
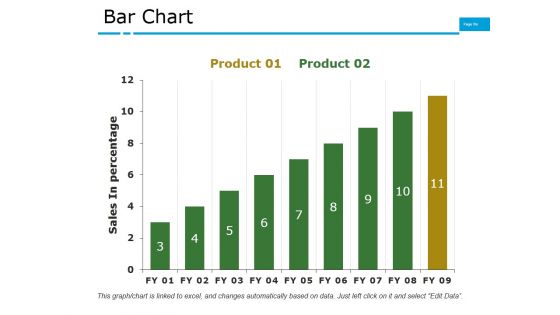
Bar Chart Ppt PowerPoint Presentation Model Influencers
This is a bar chart ppt powerpoint presentation model influencers. This is a two stage process. The stages in this process are business, marketing, finance, bar, growth.
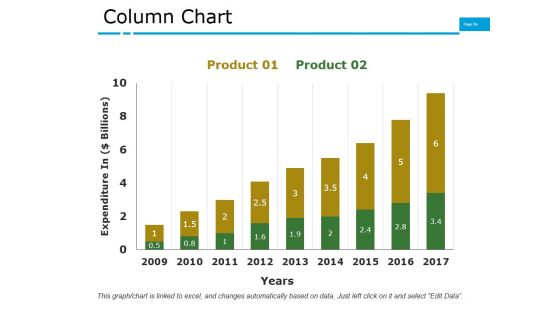
Column Chart Ppt PowerPoint Presentation Pictures Files
This is a column chart ppt powerpoint presentation pictures files. This is a nine stage process. The stages in this process are business, marketing, finance, bar, growth.
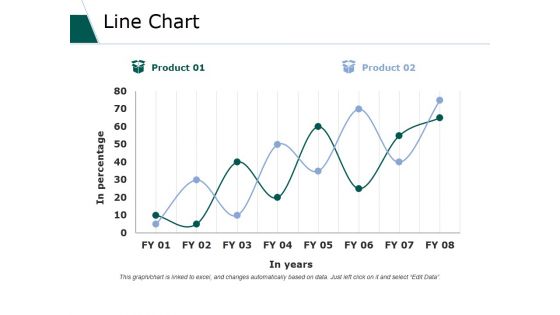
Line Chart Ppt PowerPoint Presentation Gallery Information
This is a line chart ppt powerpoint presentation gallery information. This is a two stage process. The stages in this process are business, marketing, strategy, planning, finance.
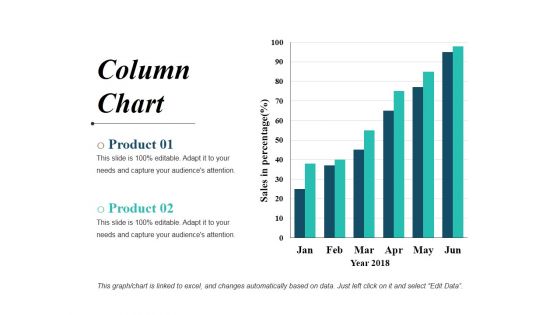
Column Chart Ppt PowerPoint Presentation Professional Layouts
This is a column chart ppt powerpoint presentation professional layouts. This is a six stage process. The stages in this process are bar graph, business, marketing, finance, planning.
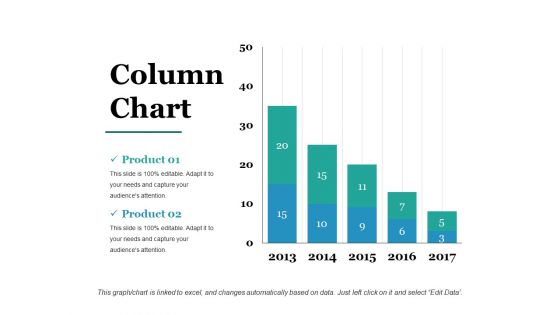
Column Chart Ppt PowerPoint Presentation Styles Picture
This is a column chart ppt powerpoint presentation styles picture. This is a five stage process. The stages in this process are years, business, marketing, graph, finance.
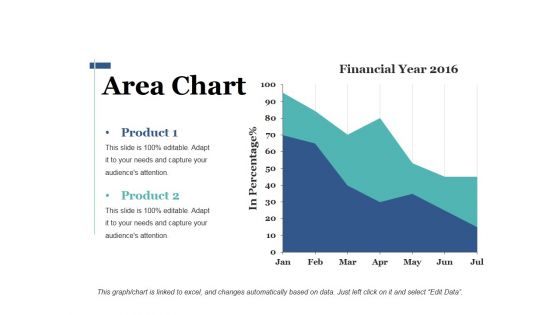
Area Chart Ppt PowerPoint Presentation Summary Sample
This is a area chart ppt powerpoint presentation summary sample. This is a two stage process. The stages in this process are business, marketing, finance, strategy, planning.
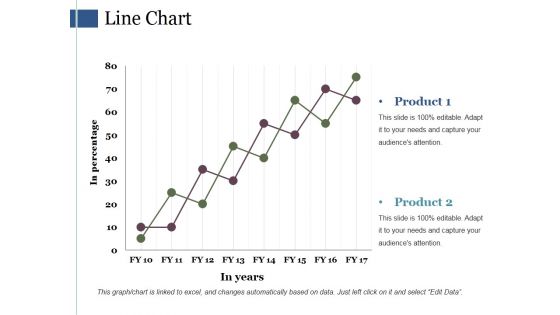
Line Chart Ppt PowerPoint Presentation Guide
This is a line chart ppt powerpoint presentation guide. This is a two stage process. The stages in this process are business, marketing, finance, strategy, planning.
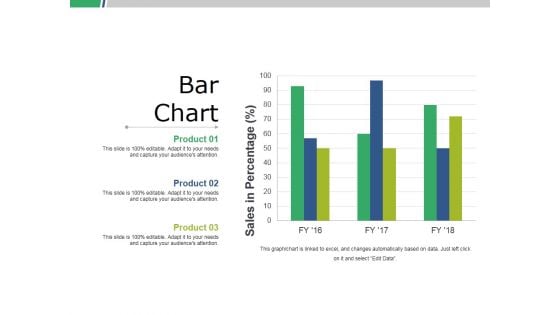
Bar Chart Ppt PowerPoint Presentation Show Slides
This is a bar chart ppt powerpoint presentation show slides. This is a three stage process. The stages in this process are business, marketing, strategy, bar, finance.

Column Chart Ppt Powerpoint Presentation Slides Ideas
This is a column chart ppt powerpoint presentation slides ideas. This is a six stage process. The stages in this process are business, finance, analysis, marketing, strategy.
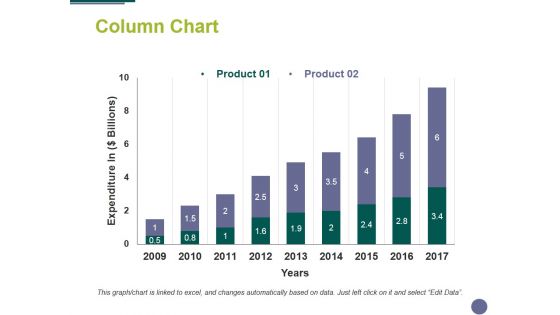
Column Chart Ppt PowerPoint Presentation Outline Clipart
This is a column chart ppt powerpoint presentation outline clipart. This is a two stage process. The stages in this process are finance, analysis, business, marketing, strategy.
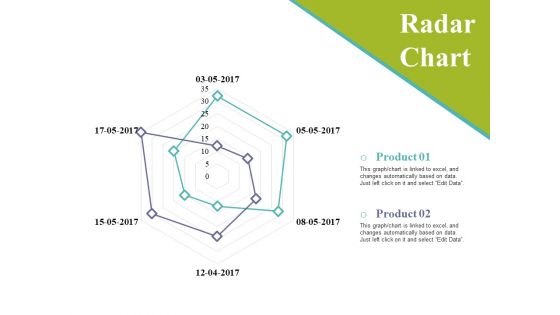
Radar Chart Ppt PowerPoint Presentation Outline Ideas
This is a radar chart ppt powerpoint presentation outline ideas. This is a two stage process. The stages in this process are business, marketing, finance, strategy, graph.
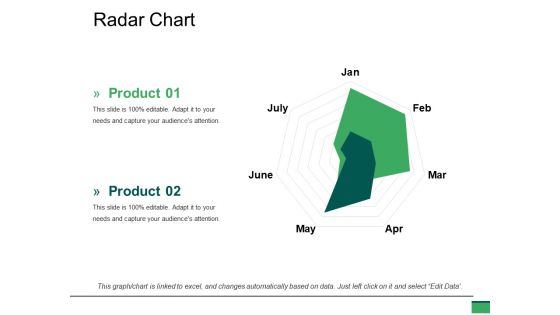
Radar Chart Ppt PowerPoint Presentation Summary Slides
This is a radar chart ppt powerpoint presentation summary slides. This is a two stage process. The stages in this process are marketing, finance, radar, business, marketing.
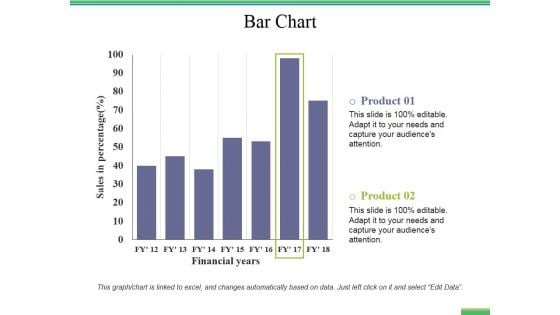
Bar Chart Ppt PowerPoint Presentation File Rules
This is a bar chart ppt powerpoint presentation file rules. This is a two stage process. The stages in this process are bar graph, finance, marketing, strategy, analysis.
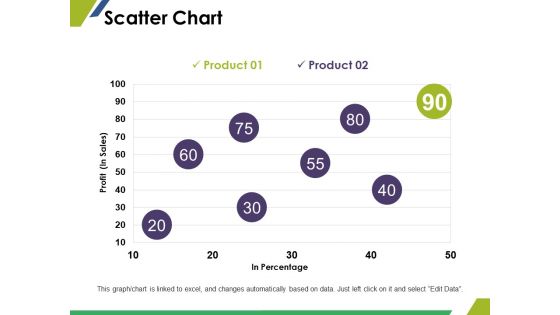
Scatter Chart Ppt PowerPoint Presentation Styles Images
This is a scatter chart ppt powerpoint presentation styles images. This is a two stage process. The stages in this process are in percentage, profit, finance, marketing, business.
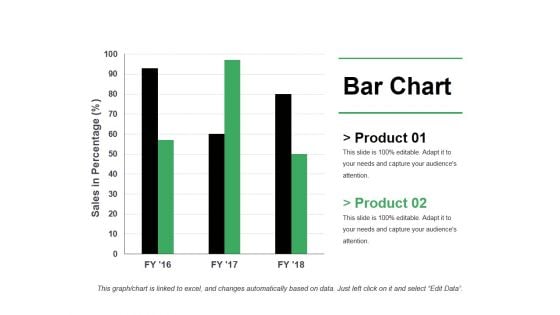
Bar Chart Ppt PowerPoint Presentation Model Professional
This is a bar chart ppt powerpoint presentation model professional. This is a three stage process. The stages in this process are business, marketing, strategy, finance, growth.
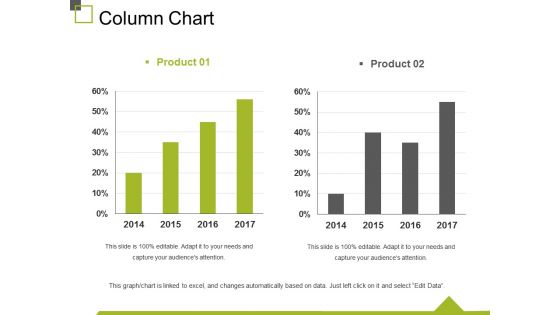
Column Chart Ppt PowerPoint Presentation Summary Slides
This is a column chart ppt powerpoint presentation summary slides. This is a two stage process. The stages in this process are finance, marketing, business, graph, years.
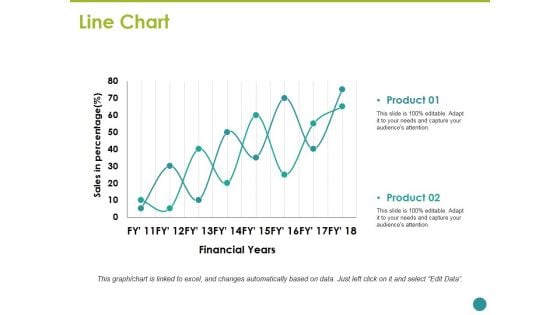
Line Chart Ppt PowerPoint Presentation Model Sample
This is a line chart ppt powerpoint presentation model sample. This is a two stage process. The stages in this process are business, marketing, planning, finance, growth.
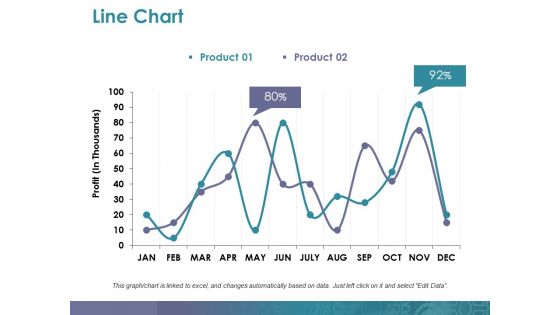
Line Chart Ppt PowerPoint Presentation Summary Rules
This is a line chart ppt powerpoint presentation summary rules. This is a two stage process. The stages in this process are profit, business, marketing, graph, finance.
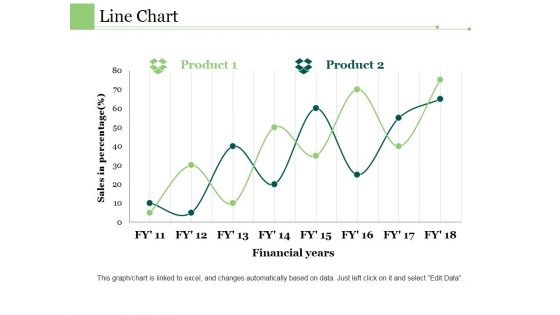
Line Chart Ppt PowerPoint Presentation Inspiration Smartart
This is a line chart ppt powerpoint presentation inspiration smartart. This is a two stage process. The stages in this process are business, marketing, strategy, planning, finance.
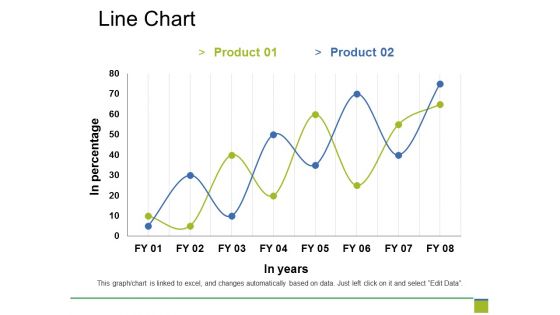
Line Chart Ppt PowerPoint Presentation Slides Inspiration
This is a line chart ppt powerpoint presentation slides inspiration. This is a two stage process. The stages in this process are business, marketing, strategy, planning, finance.
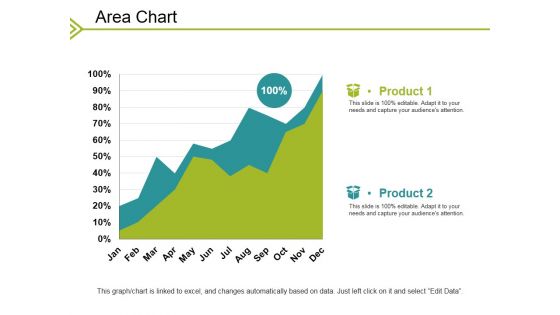
Area Chart Ppt PowerPoint Presentation Outline Examples
This is a area chart ppt powerpoint presentation outline examples. This is a two stage process. The stages in this process are business, marketing, graph, finance, strategy.
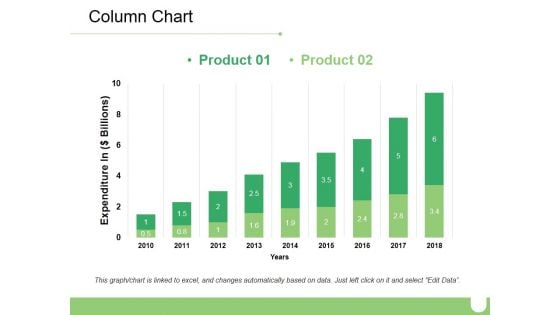
Column Chart Ppt PowerPoint Presentation Show Example
This is a column chart ppt powerpoint presentation show example. This is a two stage process. The stages in this process are business, marketing, expenditure in, finance, years.
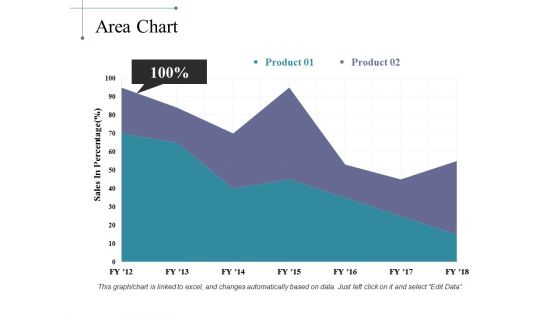
Area Chart Ppt PowerPoint Presentation Inspiration Guide
This is a area chart ppt powerpoint presentation inspiration guide. This is a two stage process. The stages in this process are business, marketing, strategy, finance, analysis.
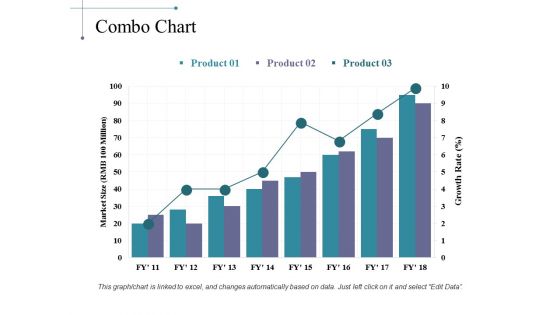
Combo Chart Ppt PowerPoint Presentation Ideas Visuals
This is a combo chart ppt powerpoint presentation ideas visuals. This is a three stage process. The stages in this process are business, marketing, strategy, finance, analysis.
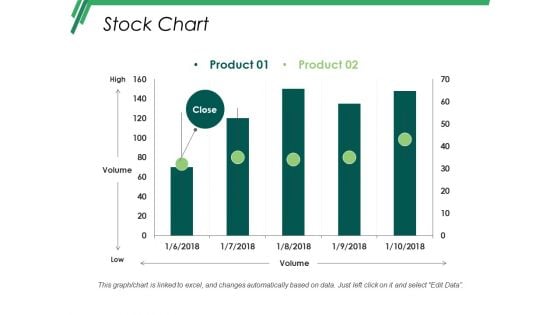
Stock Chart Ppt PowerPoint Presentation Ideas Designs
This is a stock chart ppt powerpoint presentation ideas designs. This is a five stage process. The stages in this process are business, marketing, strategy, finance, analysis.

Combo Chart Ppt PowerPoint Presentation Infographics Ideas
This is a combo chart ppt powerpoint presentation infographics ideas. This is a four stage process. The stages in this process are bar graph, marketing, strategy, finance, analysis.
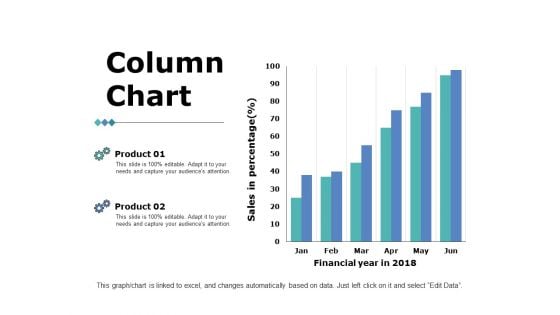
Column Chart Ppt PowerPoint Presentation Summary
This is a column chart ppt powerpoint presentation summary. This is a two stage process. The stages in this process are bar graph, marketing, strategy, finance, planning.
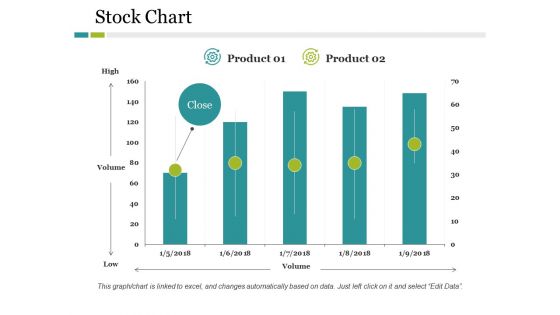
Stock Chart Ppt PowerPoint Presentation Layouts Portfolio
This is a stock chart ppt powerpoint presentation layouts portfolio. This is a two stage process. The stages in this process are business, marketing, high, volume, low, finance.
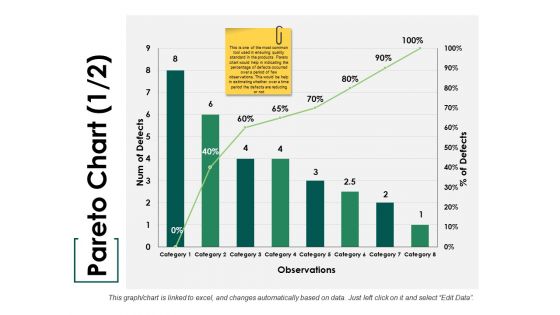
Pareto Chart Ppt PowerPoint Presentation Summary Show
This is a pareto chart ppt powerpoint presentation summary show. This is a eight stage process. The stages in this process are bar, marketing, strategy, finance, teamwork.
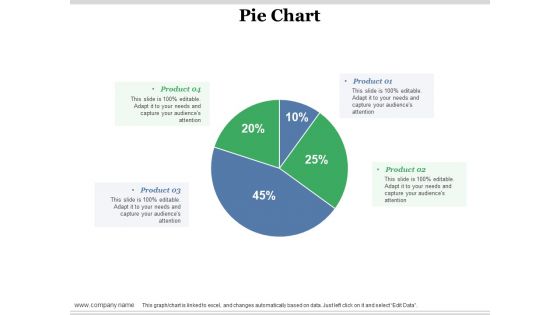
Pie Chart Ppt PowerPoint Presentation Ideas Deck
This is a pie chart ppt powerpoint presentation ideas deck. This is a four stage process. The stages in this process are pie, process, percentage, finance, business.
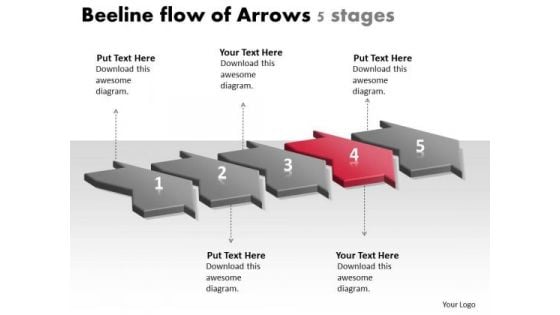
Beeline Flow Of Arrows 5 Stages Process Charts PowerPoint Slides
We present our beeline flow of arrows 5 stages process charts PowerPoint Slides.Use our Finance PowerPoint Templates because,You can Help your viewers automatically emphathise with your thoughts. Use our Process and Flows PowerPoint Templates because,We all know that alphabetical order is a time honoured concept. Use our Arrows PowerPoint Templates because,You can Focus on each one and investigate which one would be the best fit for your needs. Use our Shapes PowerPoint Templates because,You should Lay down the fundamentals to build upon. Use our Business PowerPoint Templates because, Spell out your advertising plans to increase market share. The feedback has been positive and productiveUse these PowerPoint slides for presentations relating to 3d, arrow, background, banner, business, chart, diagram, direction, element, financial, flow, gradient, illustration, isolated, marketing, mirrored, placeholder, presentation, process, steps, success, teamwork, vector. The prominent colors used in the PowerPoint template are Red, Gray, Black Keep away from fallacious arguments. Our Beeline Flow Of Arrows 5 Stages Process Charts PowerPoint Slides will extract the facts.
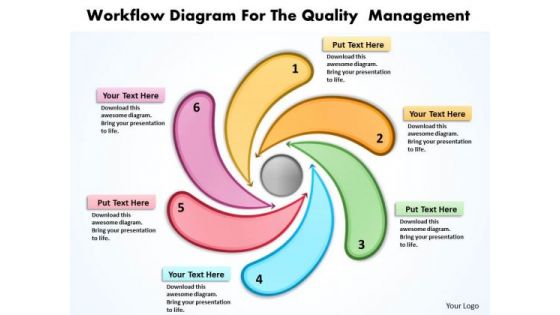
Workflow Diagram For The Quality Management Radial Chart PowerPoint Templates
We present our workflow diagram for the quality management Radial Chart PowerPoint templates.Present our Marketing PowerPoint Templates because Our PowerPoint Templates and Slides will let Your superior ideas hit the target always and everytime. Download and present our Business PowerPoint Templates because infrastructure growth is an obvious requirement of today.inform your group on how exactly this potential is tailor made for you. Download our Shapes PowerPoint Templates because you should Demonstrate how you think out of the box. Use our Finance PowerPoint Templates because you can see clearly through to the bigger bowl ahead. Time your jump to perfection and hit the nail on the head. Use our Symbol PowerPoint Templates because you can see In any endeavour people matter most.Use these PowerPoint slides for presentations relating to Arrow, Art, Business, Chart, Design, Development, Diagram, Flow, Flowchart, Graphic, Gray, Idea, Info, Management, Method, Model, Process, Quality, Rainbow, Research, Sign, Software, Strategy, Success, System, Template, Text, Vector, Work. The prominent colors used in the PowerPoint template are Red, Blue, Yellow. We assure you our workflow diagram for the quality management Radial Chart PowerPoint templates are incredible easy to use. Customers tell us our Flow PowerPoint templates and PPT Slides will make the presenter successul in his career/life. The feedback we get is that our workflow diagram for the quality management Radial Chart PowerPoint templates effectively help you save your valuable time. We assure you our Chart PowerPoint templates and PPT Slides are Splendid. People tell us our workflow diagram for the quality management Radial Chart PowerPoint templates are Classic. We assure you our Diagram PowerPoint templates and PPT Slides are Fabulous. Build their faith with our Workflow Diagram For The Quality Management Radial Chart PowerPoint Templates. They will ally with your cause.
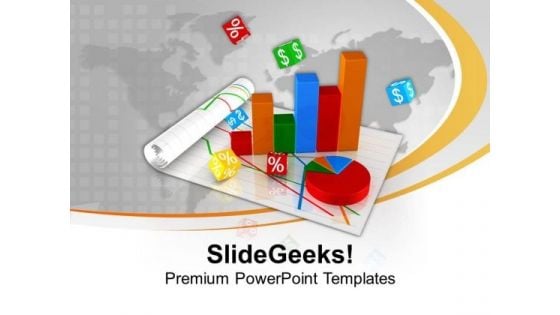
Bar And X Y Chart For Financial Growth PowerPoint Templates Ppt Backgrounds For Slides 0413
We present our Bar And X Y Chart For Financial Growth PowerPoint Templates PPT Backgrounds For Slides 0413.Download and present our Business PowerPoint Templates because You are working at that stage with an air of royalty. Let our PowerPoint Templates and Slides be the jewels in your crown. Download our Pie charts PowerPoint Templates because Our PowerPoint Templates and Slides are effectively colour coded to prioritise your plans They automatically highlight the sequence of events you desire. Use our Shapes PowerPoint Templates because It will Strengthen your hand with your thoughts. They have all the aces you need to win the day. Use our Signs PowerPoint Templates because You are working at that stage with an air of royalty. Let our PowerPoint Templates and Slides be the jewels in your crown. Present our Process and Flows PowerPoint Templates because Our PowerPoint Templates and Slides are innately eco-friendly. Their high recall value negate the need for paper handouts.Use these PowerPoint slides for presentations relating to Bar graph and pie chart, pie charts, shapes, signs, business, process and flows. The prominent colors used in the PowerPoint template are Blue, Red, Green. Our Bar And X Y Chart For Financial Growth PowerPoint Templates Ppt Backgrounds For Slides 0413 will never fight shy. They are confident of addressing any and every issue.
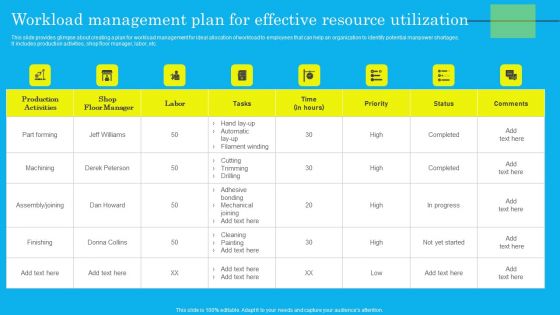
Workload Management Plan For Effective Resource Utilization Template PDF
This slide provides glimpse about creating a plan for workload management for ideal allocation of workload to employees that can help an organization to identify potential manpower shortages. It includes production activities, shop floor manager, labor, etc. Are you searching for a Workload Management Plan For Effective Resource Utilization Template PDF that is uncluttered, straightforward, and original Its easy to edit, and you can change the colors to suit your personal or business branding. For a presentation that expresses how much effort you have put in, this template is ideal With all of its features, including tables, diagrams, statistics, and lists, its perfect for a business plan presentation. Make your ideas more appealing with these professional slides. Download Workload Management Plan For Effective Resource Utilization Template PDF from Slidegeeks today.
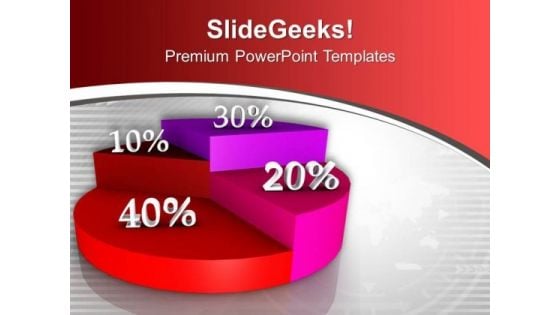
Circular Chart Represents Statistical Diagram PowerPoint Templates Ppt Backgrounds For Slides 0313
We present our Circular Chart Represents Statistical Diagram PowerPoint Templates PPT Backgrounds For Slides 0313.Use our Marketing PowerPoint Templates because Our PowerPoint Templates and Slides are truly out of this world. Even the MIB duo has been keeping tabs on our team. Use our Business PowerPoint Templates because Our PowerPoint Templates and Slides will help you be quick off the draw. Just enter your specific text and see your points hit home. Download our Shapes PowerPoint Templates because Our PowerPoint Templates and Slides will effectively help you save your valuable time. They are readymade to fit into any presentation structure. Download and present our Finance PowerPoint Templates because Our PowerPoint Templates and Slides team portray an attitude of elegance. Personify this quality by using them regularly. Download and present our Signs PowerPoint Templates because Our PowerPoint Templates and Slides are effectively colour coded to prioritise your plans They automatically highlight the sequence of events you desire.Use these PowerPoint slides for presentations relating to Pie chart, finance, business, shapes, signs, marketing. The prominent colors used in the PowerPoint template are Red, Pink, White. No matter how fastidious you like to be. Our Circular Chart Represents Statistical Diagram PowerPoint Templates Ppt Backgrounds For Slides 0313 will satisfy your every condition.

Fix Stock Market Finance PowerPoint Backgrounds And Templates 0111
Microsoft PowerPoint Template and Background with 3d illustration of large wrench and screwdriver sitting on top of bright red stock chart Advertise attributes on our Fix Stock Market Finance PowerPoint Backgrounds And Templates 0111. Your campaign for your brand will get a boost.
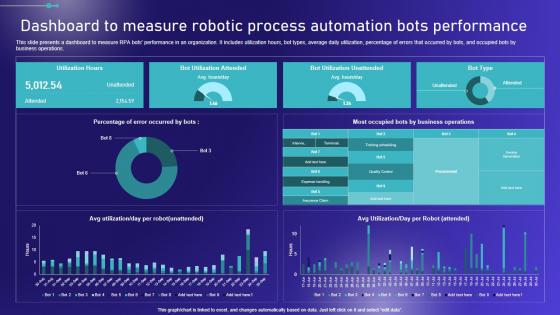
Dashboard To Measure Robotic Process Automation Embracing Robotic Process Diagrams PDF
This slide presents a dashboard to measure RPA bots performance in an organization. It includes utilization hours, bot types, average daily utilization, percentage of errors that occurred by bots, and occupied bots by business operations. If you are looking for a format to display your unique thoughts, then the professionally designed Dashboard To Measure Robotic Process Automation Embracing Robotic Process Diagrams PDF is the one for you. You can use it as a Google Slides template or a PowerPoint template. Incorporate impressive visuals, symbols, images, and other charts. Modify or reorganize the text boxes as you desire. Experiment with shade schemes and font pairings. Alter, share or cooperate with other people on your work. Download Dashboard To Measure Robotic Process Automation Embracing Robotic Process Diagrams PDF and find out how to give a successful presentation. Present a perfect display to your team and make your presentation unforgettable. This slide presents a dashboard to measure RPA bots performance in an organization. It includes utilization hours, bot types, average daily utilization, percentage of errors that occurred by bots, and occupied bots by business operations.
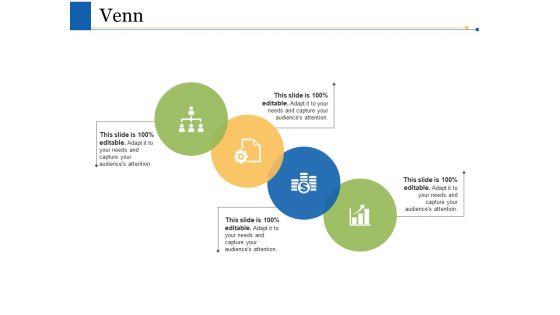
Venn Ppt PowerPoint Presentation Ideas Tips
This is a venn ppt powerpoint presentation ideas tips. This is a four stage process. The stages in this process are venn, financial, strategy, business, planning.
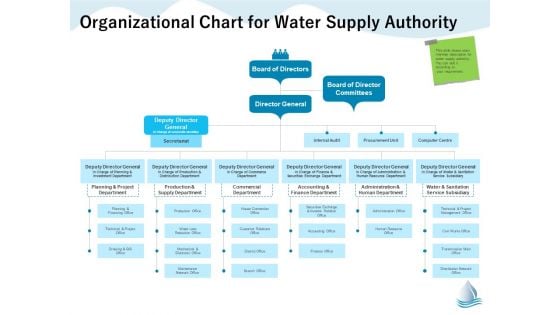
Underground Aquifer Supervision Organizational Chart For Water Supply Authority Themes PDF
Presenting this set of slides with name underground aquifer supervision organizational chart for water supply authority themes pdf. The topics discussed in these slides are planning, financing, project, production, accounting. This is a completely editable PowerPoint presentation and is available for immediate download. Download now and impress your audience.
Professional Scrum Master Training IT Software Development Progress Tracking Dashboard Mockup PDF
This slide portrays software development project management dashboard with KPIs namely status of planning, design, development, testing project launch date, project budget, overdue tasks, workload and upcoming deadlines. Deliver and pitch your topic in the best possible manner with this professional scrum master training it software development progress tracking dashboard mockup pdf. Use them to share invaluable insights on financial risk, people risk, governance risk, competitive risk, system or technology and impress your audience. This template can be altered and modified as per your expectations. So, grab it now.
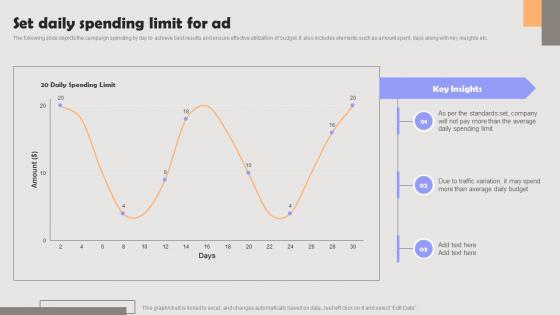
Improving PPC Campaign Results Set Daily Spending Limit For Ad Background Pdf
The following slide depicts the campaign spending by day to achieve best results and ensure effective utilization of budget. It also includes elements such as amount spent, days along with key insights etc. Do you know about Slidesgeeks Improving PPC Campaign Results Set Daily Spending Limit For Ad Background Pdf These are perfect for delivering any kind od presentation. Using it, create PowerPoint presentations that communicate your ideas and engage audiences. Save time and effort by using our pre-designed presentation templates that are perfect for a wide range of topic. Our vast selection of designs covers a range of styles, from creative to business, and are all highly customizable and easy to edit. Download as a PowerPoint template or use them as Google Slides themes. The following slide depicts the campaign spending by day to achieve best results and ensure effective utilization of budget. It also includes elements such as amount spent, days along with key insights etc.
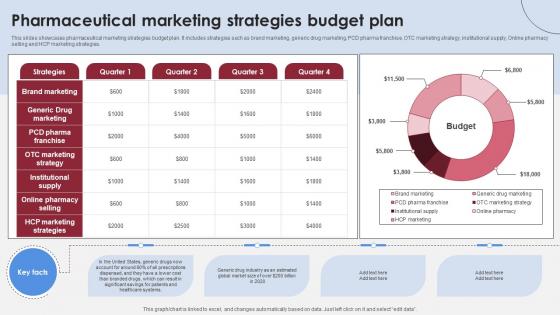
Pharmaceutical Marketing Strategies Accelerating Market Share And Profitability MKT SS V
This slides showcases pharmaceutical marketing strategies budget plan. It includes strategies such as brand marketing, generic drug marketing, PCD pharma franchise, OTC marketing strategy, institutional supply, Online pharmacy selling and HCP marketing strategies. Do you know about Slidesgeeks Pharmaceutical Marketing Strategies Accelerating Market Share And Profitability MKT SS V These are perfect for delivering any kind od presentation. Using it, create PowerPoint presentations that communicate your ideas and engage audiences. Save time and effort by using our pre-designed presentation templates that are perfect for a wide range of topic. Our vast selection of designs covers a range of styles, from creative to business, and are all highly customizable and easy to edit. Download as a PowerPoint template or use them as Google Slides themes. This slides showcases pharmaceutical marketing strategies budget plan. It includes strategies such as brand marketing, generic drug marketing, PCD pharma franchise, OTC marketing strategy, institutional supply, Online pharmacy selling and HCP marketing strategies.
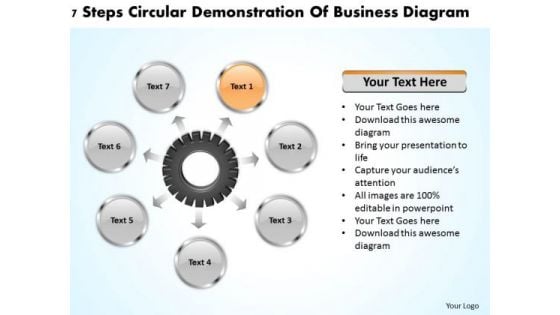
Business Concepts 7 Steps Circular Demonstration Of Diagram PowerPoint
We present our business concepts 7 steps circular demonstration of diagram Powerpoint.Download our Marketing PowerPoint Templates because It can Conjure up grand ideas with our magical PowerPoint Templates and Slides. Leave everyone awestruck by the end of your presentation. Present our Business PowerPoint Templates because Our PowerPoint Templates and Slides offer you the needful to organise your thoughts. Use them to list out your views in a logical sequence. Use our Circle Charts PowerPoint Templates because You can Be the star of the show with our PowerPoint Templates and Slides. Rock the stage with your ideas. Present our Arrows PowerPoint Templates because Watching this your Audience will Grab their eyeballs, they wont even blink. Download our Process and Flows PowerPoint Templates because You are working at that stage with an air of royalty. Let our PowerPoint Templates and Slides be the jewels in your crown.Use these PowerPoint slides for presentations relating to 3d, Action, Analysis, Attitude, Brainstorming, Business, Chart, Classroom, Concept, Conceptual, Conference, Connection, Corporate, Design, Diagram, Direction, Element, Employee, Enhance, Financial, Formula, Future, Goal, Graphic, Guidelines, Idea, Link, Management, Market, Marketing, Mind, Mind Map, Organization, Organize, Plan, Process, Product, Relation, Render, Solutions, Strategy, Success, Successful, Tactic, Target, Text, Training, Unity. The prominent colors used in the PowerPoint template are Tan, Gray, Black. Our Business Concepts 7 Steps Circular Demonstration Of Diagram PowerPoint are apt for any age. They are an excellent device to educate anyone

 Home
Home