Cost Icon
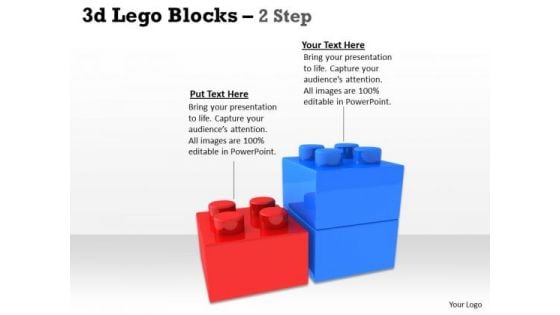
Business Finance Strategy Development 3d Lego Blocks 2 Step Sales Diagram
Get Out Of The Dock With Our Business Finance Strategy Development 3D Lego Blocks 2 Step Sales Diagram Powerpoint Templates. Your Mind Will Be Set Free. Play The Doctor With Our Business Finance Strategy Development 3D Lego Blocks 2 Step Sales Diagram Powerpoint Templates. Control Operations With Your Ideas.
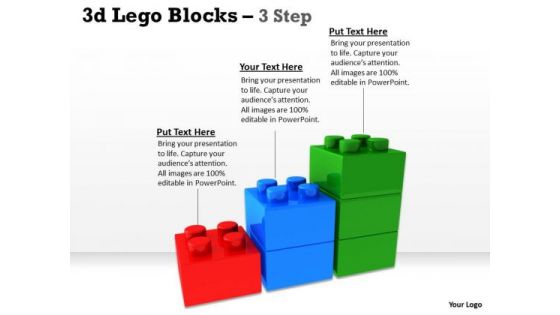
Business Finance Strategy Development 3d Lego Blocks 3 Step Business Cycle Diagram
Document The Process On Our Business Finance Strategy Development 3d Lego Blocks 3 Step Business Cycle Diagram Powerpoint Templates. Make A Record Of Every Detail. Satiate Desires With Our Business Finance Strategy Development 3d Lego Blocks 3 Step Business Cycle Diagram Powerpoint Templates. Give Them All They Want And More.
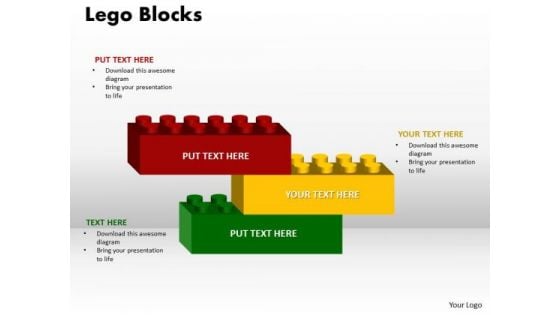
Business Cycle Diagram Building Blocks 3 Stages Business Finance Strategy Development
Analyze Ailments On Our Business Cycle Diagram Building Blocks 3 stages Business Finance Strategy Development Powerpoint Templates. Bring Out The Thinking Doctor In You. Dock Your Thoughts With Our Business Cycle Diagram Building Blocks 3 stages Business Finance Strategy Development Powerpoint Templates. They Will Launch Them Into Orbit.
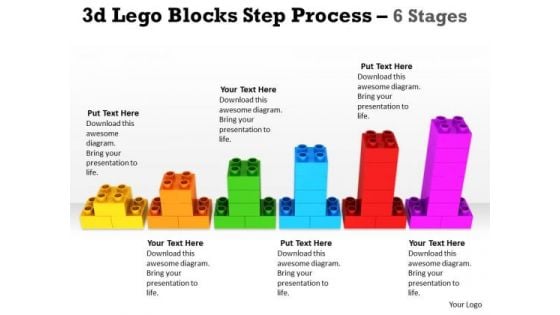
Business Finance Strategy Development 3d Lego Blocks Step Process 6 Stages Business Diagram
Document Your Views On Our Business Finance Strategy Development 3d Lego Blocks Step Process 6 Stages Business Diagram Powerpoint Templates. They Will Create A Strong Impression. Plan Your Documentary Shot By Shot. Break Them Down On Our Business Finance Strategy Development 3d Lego Blocks Step Process 6 Stages Business Diagram Powerpoint Templates.
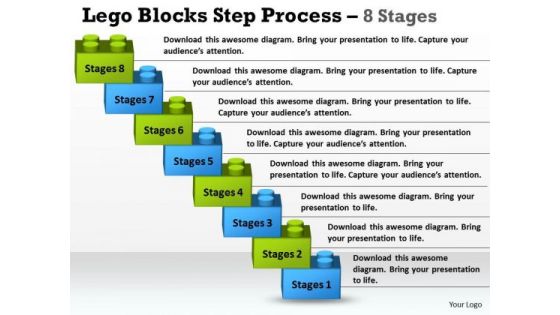
Business Finance Strategy Development Lego Blocks Step Process 8 Stages Strategy Diagram
Get Out Of The Dock With Our Business Finance Strategy Development Lego Blocks Step Process 8 Stages Strategy Diagram Powerpoint Templates. Your Mind Will Be Set Free. Play The Doctor With Our Business Finance Strategy Development Lego Blocks Step Process 8 Stages Strategy Diagram Powerpoint Templates. Control Operations With Your Ideas.

Business Finance Strategy Development Building Lego Process 10 Stages Sales Diagram
Get Out Of The Dock With Our Business Finance Strategy Development Building Lego Process 10 Stages Sales Diagram Powerpoint Templates. Your Mind Will Be Set Free. Play The Doctor With Our Business Finance Strategy Development Building Lego Process 10 Stages Sales Diagram Powerpoint Templates. Control Operations With Your Ideas.

Business Finance Strategy Development Building Lego Process 11 Stages Marketing Diagram
Analyze Ailments On Our Business Finance Strategy Development Building Lego Process 11 Stages Marketing Diagram Powerpoint Templates. Bring Out The Thinking Doctor In You. Dock Your Thoughts With Our Business Finance Strategy Development Building Lego Process 11 Stages Marketing Diagram Powerpoint Templates. They Will Launch Them Into Orbit.
Marketing Diagram Labyrinth Rectangular Ppt Green Modal Business Finance Strategy Development
Bet on your luck with our Marketing Diagram Labyrinth Rectangular ppt Green modal Business Finance Strategy Development Powerpoint Templates. Be assured that you will hit the jackpot. Let our Marketing Diagram Labyrinth Rectangular ppt Green modal Business Finance Strategy Development Powerpoint Templates be the string of your bow. Fire of your ideas and conquer the podium.

Business Finance Strategy Development Broken Chain Process 6 Stages Sales Diagram
Analyze Ailments On Our Business Finance Strategy Development Broken Chain Process 6 Stages Sales Diagram Powerpoint Templates. Bring Out The Thinking Doctor In You. Dock Your Thoughts With Our Business Finance Strategy Development Broken Chain Process 6 Stages Sales Diagram Powerpoint Templates. They Will Launch Them Into Orbit.

Business Finance Strategy Development Broken Chain Process 7 Stages Strategy Diagram
Analyze Ailments On Our Business Finance Strategy Development Broken Chain Process 7 Stages Strategy Diagram Powerpoint Templates. Bring Out The Thinking Doctor In You. Dock Your Thoughts With Our Business Finance Strategy Development Broken Chain Process 7 Stages Strategy Diagram Powerpoint Templates. They Will Launch Them Into Orbit.
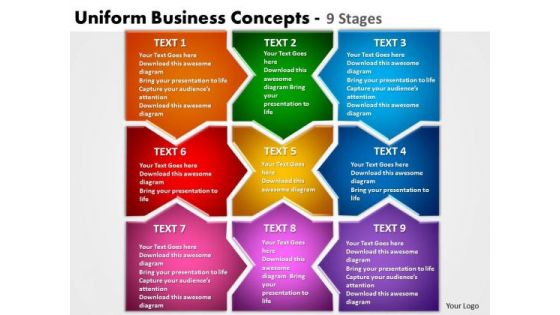
Marketing Diagram Uniform Business Concepts 9 Stages Business Finance Strategy Development
Dribble Away With Our Marketing Diagram Uniform Business Concepts 9 Stages Business Finance Strategy Development Powerpoint Templates. Score A Goal With Your Ideas. Drill It In With Our Marketing Diagram Uniform Business Concepts 9 Stages Business Finance Strategy Development Powerpoint Templates. Embed Your Message Into The Minds Of Your Audience.

Business Diagram Post It Notes Style 3 Business Finance Strategy Development
Our Business Diagram Post It Notes Style 3 Business Finance Strategy Development Powerpoint Templates offer you the needful to organize your thoughts. Use them to list out your views in a logical sequence. Our Business Diagram Post It Notes Style 3 Business Finance Strategy Development Powerpoint Templates are created by a hardworking bunch of busy bees. Always flitting around with solutions guaranteed to please.
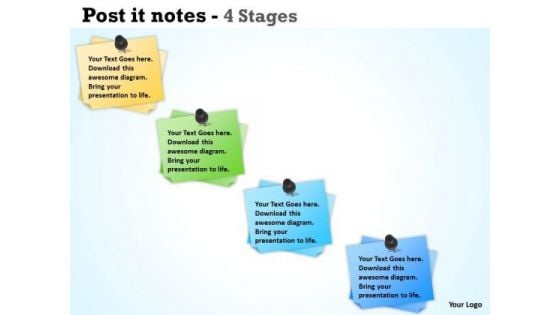
Business Finance Strategy Development Post It Notes 4 Stages Sales Diagram
Illuminate the road ahead withour Business Finance Strategy Development Post it notes 4 Stages Sales Diagram Powerpoint Templates. Pinpoint the important landmarks along the way. Blaze a trail with our innovative Business Finance Strategy Development Post it notes 4 Stages Sales Diagram Powerpoint Templates. Clearly mark the path for others to follow.

Business Finance Strategy Development Post It Notes Style 2 Strategy Diagram
Our Business Finance Strategy Development Post It Notes Style 2 Strategy Diagram Powerpoint Templates give you the basic framework of your talk. Give it the shape you desire with your wonderful views. Our Business Finance Strategy Development Post It Notes Style 2 Strategy Diagram Powerpoint Templates are the lungs of your talk. Fill them with the oxygen of your indepth thought process.

Business Finance Strategy Development Post It Notes Style 4 Business Diagram
Our Business Finance Strategy Development post it notes style 4 Business Diagram Powerpoint Templates provide the pitch to bowl on. Mesmerise your audience with your guile. Our Business Finance Strategy Development post it notes style 4 Business Diagram Powerpoint Templates are stepping stones to success. Climb them steadily and reach the top.
Business Finance Strategy Development Post It Notes Style 4 Consulting Diagram
Our Business Finance Strategy Development Post It Notes Style 4 Consulting Diagram Powerpoint Templates are the strands of your mental loom. Weave them together and produce a magical tapestry. Our Business Finance Strategy Development Post It Notes Style 4 Consulting Diagram Powerpoint Templates provide windows to your brilliant mind. Open them to your audience and impress them with your knowledge.
Business Finance Strategy Development Post It Notes Style 4 Marketing Diagram
Our Business Finance Strategy Development Post It Notes Style 4 Marketing Diagram Powerpoint Templates are the layers of your gourmet cake. Provide the icing of your ideas and produce a masterpiece. Use our Business Finance Strategy Development Post It Notes Style 4 Marketing Diagram Powerpoint Templates and and feel the difference. Right off they generate a surge of interest.
Consulting Diagram Post It Notes Style 1 Business Finance Strategy Development
Our Consulting Diagram Post It Notes Style 1 Business Finance Strategy Development Powerpoint Templates Are Truly Out Of This World. Even The MIB Duo Has Been Keeping Tabs On Our Team. Our Consulting Diagram Post It Notes Style 1 Business Finance Strategy Development Powerpoint Templates Team Portray An Attitude Of Elegance. Personify This Quality By Using Them Regularly.
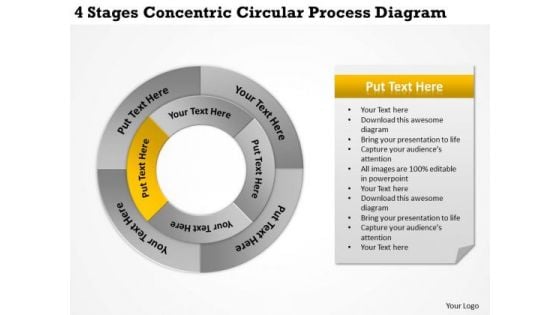
Develop Business Strategy Concentric Circular Process Diagram Development
We present our develop business strategy concentric circular process diagram development.Use our Flow Charts PowerPoint Templates because Our PowerPoint Templates and Slides will help you be quick off the draw. Just enter your specific text and see your points hit home. Download our Circle Charts PowerPoint Templates because our PowerPoint Templates and Slides will give your ideas the shape. Present our Ring charts PowerPoint Templates because Our PowerPoint Templates and Slides are truly out of this world. Even the MIB duo has been keeping tabs on our team. Present our Process and Flows PowerPoint Templates because These PowerPoint Templates and Slides will give the updraft to your ideas. See them soar to great heights with ease. Use our Business PowerPoint Templates because Our PowerPoint Templates and Slides will weave a web of your great ideas. They are gauranteed to attract even the most critical of your colleagues.Use these PowerPoint slides for presentations relating to Market, graph, sectors, chart, isolated, white, business, conglomerates, circle, graphic, goods, materials, technology, wheel, illustration, energy, basic, pie,round, clipart, utilities, cyclical, colorful, clip, text, transportation, infographic, transparency, four services, information, investment, financial, non,healthcare, capital. The prominent colors used in the PowerPoint template are Yellow, White, Gray. Our Develop Business Strategy Concentric Circular Process Diagram Development are like a deep breath. They ensure your ideas endure.
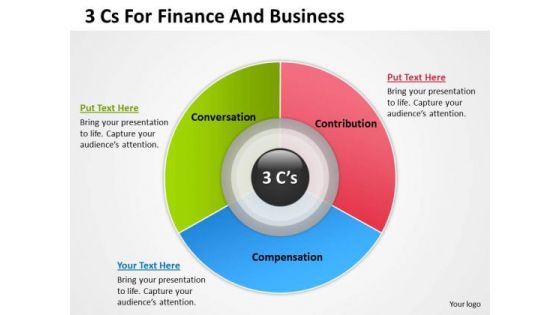
Strategy PowerPoint Template 3 Cs For Finance And Business Ppt Templates
Our strategy powerpoint template 3 cs for finance and business ppt templates will will follow the drill. They accomplish the task assigned to them. Do the drill with our Marketing PowerPoint Templates. Your ideas will march ahead. Place the orders with your thoughts. Our Circle Charts PowerPoint Templates know the drill. Bigger the challenge, better the answers. Our Strategy PowerPoint Template 3 Cs For Finance And Business Ppt Templates will deliver a decisive blow.
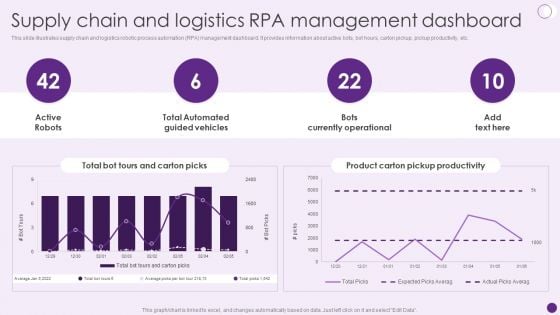
Supply Chain And Logistics Rpa Management Dashboard Deploying Automation To Enhance Diagrams PDF
This slide illustrates supply chain and logistics robotic process automation RPA management dashboard. It provides information about active bots, bot hours, carton pickup, pickup productivity, etc. Boost your pitch with our creative Supply Chain And Logistics Rpa Management Dashboard Deploying Automation To Enhance Diagrams PDF. Deliver an awe-inspiring pitch that will mesmerize everyone. Using these presentation templates you will surely catch everyones attention. You can browse the ppts collection on our website. We have researchers who are experts at creating the right content for the templates. So you do not have to invest time in any additional work. Just grab the template now and use them.
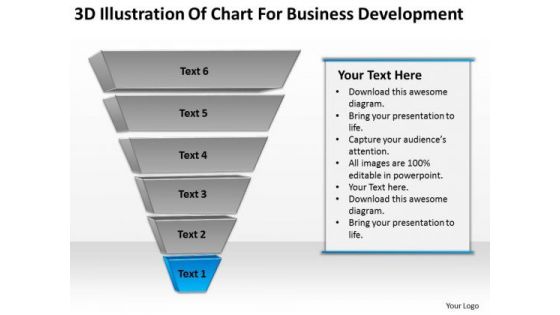
3d Illustration Of Chart For Business Development Ppt Plan PowerPoint Templates
We present our 3d illustration of chart for business development ppt plan PowerPoint templates.Download and present our Business PowerPoint Templates because These PowerPoint Templates and Slides will give the updraft to your ideas. See them soar to great heights with ease. Use our Flow Charts PowerPoint Templates because Our PowerPoint Templates and Slides team portray an attitude of elegance. Personify this quality by using them regularly. Present our Process and Flows PowerPoint Templates because You are an avid believer in ethical practices. Highlight the benefits that accrue with our PowerPoint Templates and Slides. Present our Triangles PowerPoint Templates because Our PowerPoint Templates and Slides are effectively colour coded to prioritise your plans They automatically highlight the sequence of events you desire. Download and present our Pyramids PowerPoint Templates because It can Conjure up grand ideas with our magical PowerPoint Templates and Slides. Leave everyone awestruck by the end of your presentation.Use these PowerPoint slides for presentations relating to Pyramidal, diagram, pyramid, market, ascent, grow, step, achievement, triangle, business, mountains, concept, render, success, presentation, pile,finance, level, layer, upward, development, building, shape, illustration, stage, status, winner, solution, design, ascend, growth, motivation, organization, going,progress, profit, increase, work, trade, angle, successful, conceptual, financial, careers, structure, performance. The prominent colors used in the PowerPoint template are Blue, Gray, Black. Venture into the unknown with our 3d Illustration Of Chart For Business Development Ppt Plan PowerPoint Templates. Your thoughts will move ahead sure-footedly.
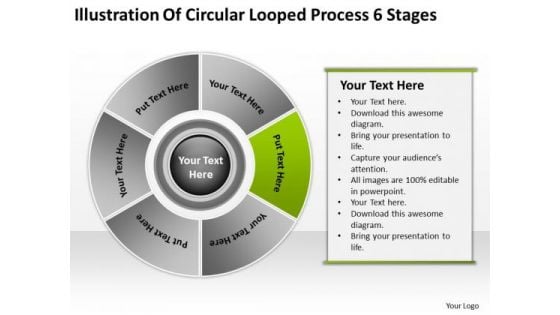
Circular Looped Process 6 Stages Business Plan Example PowerPoint Slides
We present our circular looped process 6 stages business plan example PowerPoint Slides.Download our Finance PowerPoint Templates because You can Score a slam dunk with our PowerPoint Templates and Slides. Watch your audience hang onto your every word. Use our Marketing PowerPoint Templates because you should Whip up a frenzy with our PowerPoint Templates and Slides. They will fuel the excitement of your team. Use our Business PowerPoint Templates because Our PowerPoint Templates and Slides will let you Hit the target. Go the full distance with ease and elan. Download our Circle Charts PowerPoint Templates because Our PowerPoint Templates and Slides will let your team Walk through your plans. See their energy levels rise as you show them the way. Download our Process and Flows PowerPoint Templates because You have a driving passion to excel in your field. Our PowerPoint Templates and Slides will prove ideal vehicles for your ideas.Use these PowerPoint slides for presentations relating to Chart, wheel, pie, graph, vector, process, marketing, diagram, business, catalog, website, network, statistics, model, document, junction, plan, presentation, template, circle, brochure, data, stock, management, box, options, direction, design, company, navigation, financial, structure, button, goals, results. The prominent colors used in the PowerPoint template are Green, Gray, Black. Examine every deatail with our Circular Looped Process 6 Stages Business Plan Example PowerPoint Slides. Put each element to the test.

Globe And Laptop Communication PowerPoint Templates And PowerPoint Themes 1012
The above template contains an image of laptop around globe. Grab the attention of your team with this eye catching template signifying global network. This image has been conceived to enable you to emphatically communicate your ideas in your Global PPT presentations on communication, networking, internet and technology. Create captivating presentations to deliver comparative and weighted arguments. Project your views with our Globe And Laptop Communication PowerPoint Templates And PowerPoint Themes 1012. Download without worries with our money back guaranteee.
Real Estate Market PowerPoint Templates And PowerPoint Themes 1012
Deliver amazing Presentations with our above template which contains a graphic of many colorful houses. This image represents the real estate concept. It is a useful captivating tool concieved to enable you to define your message in your Business PPT presentations. Go ahead and add personality to your presentations with our colorful template. Improve your organization with our Real Estate Market PowerPoint Templates And PowerPoint Themes 1012. Download without worries with our money back guaranteee.
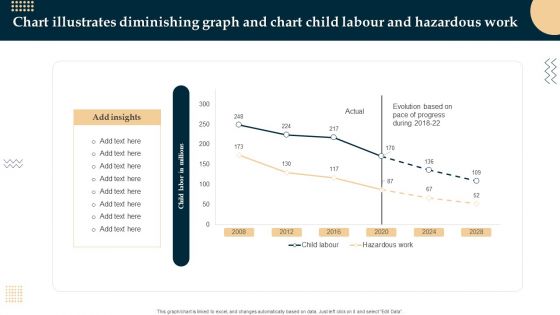
Chart Illustrates Diminishing Graph And Chart Child Labour And Hazardous Work Inspiration PDF
Showcasing this set of slides titled Chart Illustrates Diminishing Graph And Chart Child Labour And Hazardous Work Inspiration PDF. The topics addressed in these templates are Chart Illustrates Diminishing Graph, Hazardous Work, Chart Child Labour. All the content presented in this PPT design is completely editable. Download it and make adjustments in color, background, font etc. as per your unique business setting.

Chart Indicates Diminishing Graph And Chart Cash Payment Mode Inspiration PDF
Showcasing this set of slides titled Chart Indicates Diminishing Graph And Chart Cash Payment Mode Inspiration PDF. The topics addressed in these templates are Chart Indicates Diminishing Graph, Chart Cash Payment Mode. All the content presented in this PPT design is completely editable. Download it and make adjustments in color, background, font etc. as per your unique business setting.
Trend Chart Depicting Diminishing Graph And Chart Sales And Production Structure PDF
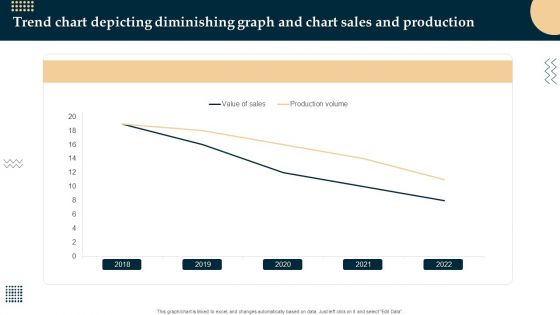
Pitch your topic with ease and precision using this Trend Chart Depicting Diminishing Graph And Chart Sales And Production Structure PDF. This layout presents information on Trend Chart Depicting, Diminishing Graph, Chart Sales And Production. It is also available for immediate download and adjustment. So, changes can be made in the color, design, graphics or any other component to create a unique layout.

Chart Indicates Diminishing Graph And Chart Retail Value And Volume Download PDF
Pitch your topic with ease and precision using this Chart Indicates Diminishing Graph And Chart Retail Value And Volume Download PDF. This layout presents information on Chart Indicates Diminishing Graph, Chart Retail Value And Volume. It is also available for immediate download and adjustment. So, changes can be made in the color, design, graphics or any other component to create a unique layout.
Ownership And Shareholder Analysis Of Nestle Corporation Customer Segmentation Summary Pdf
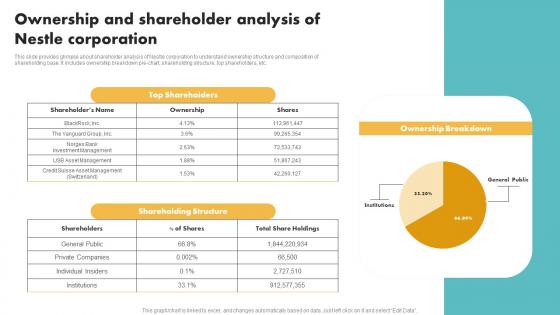
This slide provides glimpse about shareholder analysis of Nestle corporation to understand ownership structure and composition of shareholding base. It includes ownership breakdown pie-chart, shareholding structure, top shareholders, etc. Boost your pitch with our creative Ownership And Shareholder Analysis Of Nestle Corporation Customer Segmentation Summary Pdf Deliver an awe-inspiring pitch that will mesmerize everyone. Using these presentation templates you will surely catch everyones attention. You can browse the ppts collection on our website. We have researchers who are experts at creating the right content for the templates. So you do not have to invest time in any additional work. Just grab the template now and use them. This slide provides glimpse about shareholder analysis of Nestle corporation to understand ownership structure and composition of shareholding base. It includes ownership breakdown pie-chart, shareholding structure, top shareholders, etc.
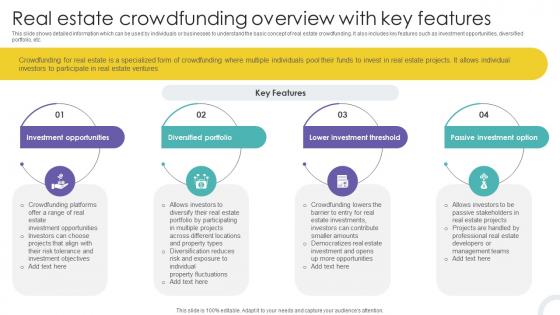
Real Estate Crowdfunding Overview With Key Features Crowdfunding Strategies To Raise Funds Fin SS V
This slide shows detailed information which can be used by individuals or businesses to understand the basic concept of real estate crowdfunding. It also includes key features such as investment opportunities, diversified portfolio, etc. Do you know about Slidesgeeks Real Estate Crowdfunding Overview With Key Features Crowdfunding Strategies To Raise Funds Fin SS V These are perfect for delivering any kind od presentation. Using it, create PowerPoint presentations that communicate your ideas and engage audiences. Save time and effort by using our pre-designed presentation templates that are perfect for a wide range of topic. Our vast selection of designs covers a range of styles, from creative to business, and are all highly customizable and easy to edit. Download as a PowerPoint template or use them as Google Slides themes. This slide shows detailed information which can be used by individuals or businesses to understand the basic concept of real estate crowdfunding. It also includes key features such as investment opportunities, diversified portfolio, etc.

Gold Chart Business PowerPoint Template 0810
3D gold growth graph with world map. All in gold. Take control with our Gold Chart Business PowerPoint Template 0810. Do not be fatalistic in your approach.
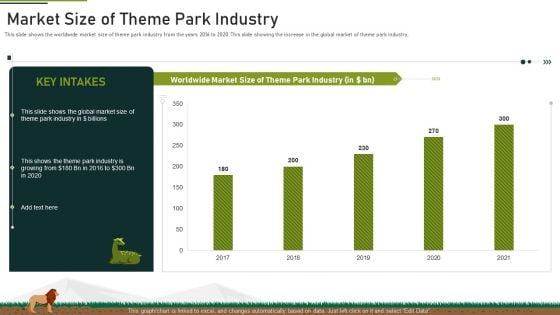
Market Size Of Theme Park Industry Ppt Infographic Template Microsoft PDF
This slide shows the worldwide market size of theme park industry from the years 2016 to 2020. This slide showing the increase in the global market of theme park industry. Deliver and pitch your topic in the best possible manner with this market size of theme park industry ppt infographic template microsoft pdf. Use them to share invaluable insights on market size of theme park industry and impress your audience. This template can be altered and modified as per your expectations. So, grab it now.
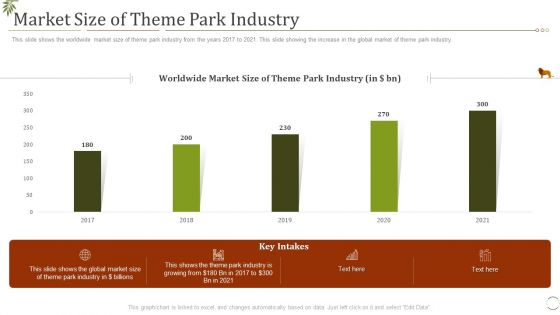
Market Size Of Theme Park Industry Ppt Inspiration Example Introduction PDF
This slide shows the worldwide market size of theme park industry from the years 2017 to 2021. This slide showing the increase in the global market of theme park industry. Deliver and pitch your topic in the best possible manner with this market size of theme park industry ppt inspiration example introduction pdf. Use them to share invaluable insights on market size of theme park industry and impress your audience. This template can be altered and modified as per your expectations. So, grab it now.
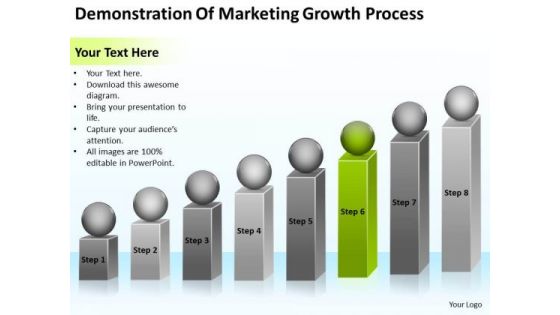
Demonstration Of Marketing Growth Process Ppt Business Planning PowerPoint Templates
We present our demonstration of marketing growth process ppt business planning PowerPoint templates.Download and present our Spheres PowerPoint Templates because Our PowerPoint Templates and Slides will give good value for money. They also have respect for the value of your time. Download and present our Process and Flows PowerPoint Templates because Our PowerPoint Templates and Slides will let you Hit the right notes. Watch your audience start singing to your tune. Download our Flow Charts PowerPoint Templates because Our PowerPoint Templates and Slides will weave a web of your great ideas. They are gauranteed to attract even the most critical of your colleagues. Download and present our Shapes PowerPoint Templates because Our PowerPoint Templates and Slides come in all colours, shades and hues. They help highlight every nuance of your views. Use our Business PowerPoint Templates because You can Channelise the thoughts of your team with our PowerPoint Templates and Slides. Urge them to focus on the goals you have set.Use these PowerPoint slides for presentations relating to Diagram, chart, market, statistics, square, grow, infograph, bar, corporate, red, business, vector, success, presentation, growing, circle, finance,analyst, goal, report, marketing, different, accounting, management, graph, illustration, geometric, sphere, design, growth, infographic, progress, profit,information, increase, aim, analyze, financial, rising, measure, block. The prominent colors used in the PowerPoint template are Green, Gray, Black. Assess consumer choices with our Demonstration Of Marketing Growth Process Ppt Business Planning PowerPoint Templates. Get an idea of their buying patterns.
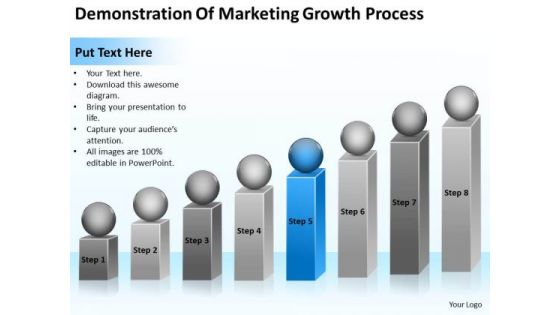
Demonstration Of Marketing Growth Process Ppt Business Plan PowerPoint Template
We present our demonstration of marketing growth process ppt business plan PowerPoint template.Present our Process and Flows PowerPoint Templates because Our PowerPoint Templates and Slides will Activate the energies of your audience. Get their creative juices flowing with your words. Use our Spheres PowerPoint Templates because Our PowerPoint Templates and Slides will give good value for money. They also have respect for the value of your time. Present our Flow Charts PowerPoint Templates because Our PowerPoint Templates and Slides team portray an attitude of elegance. Personify this quality by using them regularly. Download our Business PowerPoint Templates because Our PowerPoint Templates and Slides are specially created by a professional team with vast experience. They diligently strive to come up with the right vehicle for your brilliant Ideas. Download our Shapes PowerPoint Templates because You can Double your output with our PowerPoint Templates and Slides. They make beating deadlines a piece of cake.Use these PowerPoint slides for presentations relating to Diagram, chart, market, statistics, square, grow, infograph, bar, corporate, red, business, vector, success, presentation, growing, circle, finance,analyst, goal, report, marketing, different, accounting, management, graph, illustration, geometric, sphere, design, growth, infographic, progress, profit,information, increase, aim, analyze, financial, rising, measure, block. The prominent colors used in the PowerPoint template are Blue, Gray, White. Add brilliance with our Demonstration Of Marketing Growth Process Ppt Business Plan PowerPoint Template. You will come out on top.
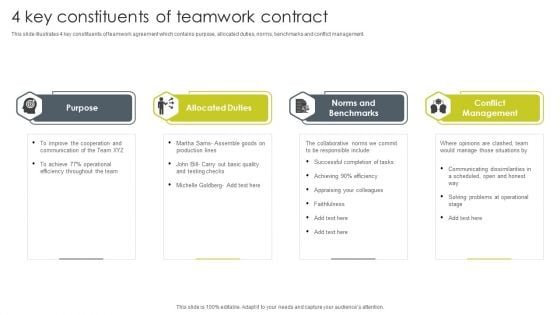
4 Key Constituents Of Teamwork Contract Graphics PDF
This slide illustrates 4 key constituents of teamwork agreement which contains purpose, allocated duties, norms, benchmarks and conflict management. Presenting 4 Key Constituents Of Teamwork Contract Graphics PDF to dispense important information. This template comprises four stages. It also presents valuable insights into the topics including Allocated Duties, Norms And Benchmarks, Conflict Management. This is a completely customizable PowerPoint theme that can be put to use immediately. So, download it and address the topic impactfully.
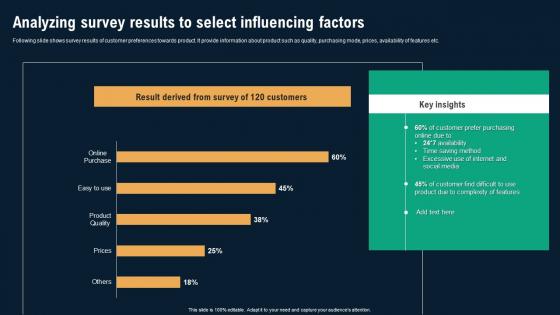
Analyzing Survey Results To Select Influencing Factors Business Environmental Analysis Introduction Pdf
Following slide shows survey results of customer preferences towards product. It provide information about product such as quality, purchasing mode, prices, availability of features etc. There are so many reasons you need a Analyzing Survey Results To Select Influencing Factors Business Environmental Analysis Introduction Pdf The first reason is you can not spend time making everything from scratch, Thus, Slidegeeks has made presentation templates for you too. You can easily download these templates from our website easily. Following slide shows survey results of customer preferences towards product. It provide information about product such as quality, purchasing mode, prices, availability of features etc.
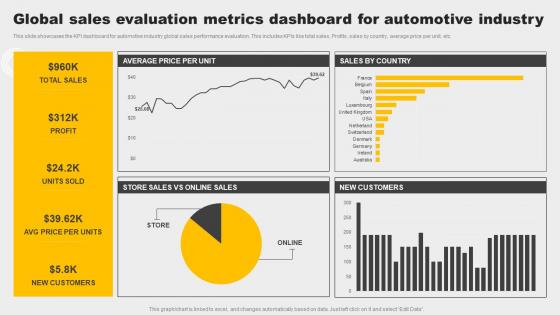
Global Sales Evaluation Metrics Dashboard For Automotive Industry Demonstration Pdf
This slide showcases the KPI dashboard for automotive industry global sales performance evaluation. This includes KPIs like total sales, Profits, sales by country, average price per unit, etc. Pitch your topic with ease and precision using this Global Sales Evaluation Metrics Dashboard For Automotive Industry Demonstration Pdf. This layout presents information on Customers, Profit, Sales. It is also available for immediate download and adjustment. So, changes can be made in the color, design, graphics or any other component to create a unique layout. This slide showcases the KPI dashboard for automotive industry global sales performance evaluation. This includes KPIs like total sales, Profits, sales by country, average price per unit, etc.

Customer Retention Through Effective Subscription Strategic Plan Infographics Pdf
This slide showcases subscription plan strategy to retain customers. It includes various programmes such as avoid add on approach, add value in prices and provide great experience. Showcasing this set of slides titled Customer Retention Through Effective Subscription Strategic Plan Infographics Pdf. The topics addressed in these templates are Retain Customer, Provide Variety, Great Experience. All the content presented in this PPT design is completely editable. Download it and make adjustments in color, background, font etc. as per your unique business setting. This slide showcases subscription plan strategy to retain customers. It includes various programmes such as avoid add on approach, add value in prices and provide great experience.

Revenue Model Shared Transportation Platform Business Model BMC SS V
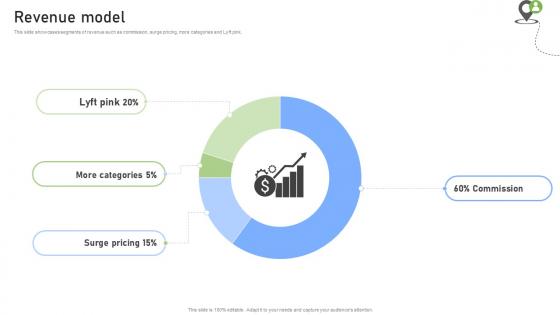
This slide showcases segments of revenue such as commission, surge pricing, more categories and Lyft pink. If your project calls for a presentation, then Slidegeeks is your go-to partner because we have professionally designed, easy-to-edit templates that are perfect for any presentation. After downloading, you can easily edit Revenue Model Shared Transportation Platform Business Model BMC SS V and make the changes accordingly. You can rearrange slides or fill them with different images. Check out all the handy templates This slide showcases segments of revenue such as commission, surge pricing, more categories and Lyft pink.
Revenue Model Rideshare Platform Business Model BMC SS V
This slide showcases segments of revenue such as commission, surge pricing, more categories and Lyft pink. If your project calls for a presentation, then Slidegeeks is your go-to partner because we have professionally designed, easy-to-edit templates that are perfect for any presentation. After downloading, you can easily edit Revenue Model Rideshare Platform Business Model BMC SS V and make the changes accordingly. You can rearrange slides or fill them with different images. Check out all the handy templates This slide showcases segments of revenue such as commission, surge pricing, more categories and Lyft pink.
Future Team Performance After Implementing Agile Methodology Diagrams PDF
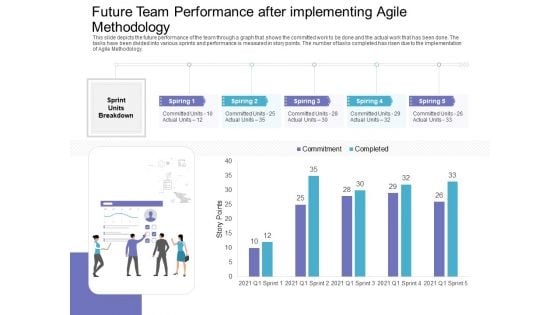
This slide depicts the future performance of the team through a graph that shows the committed work to be done and the actual work that has been done. The tasks have been divided into various sprints and performance is measured in story points. The number of tasks completed has risen due to the implementation of Agile Methodology. Deliver and pitch your topic in the best possible manner with this future team performance after implementing agile methodology diagrams pdf. Use them to share invaluable insights on future team performance after implementing agile methodology and impress your audience. This template can be altered and modified as per your expectations. So, grab it now.
Buyers Conversion Rate Of The Company Diagrams PDF
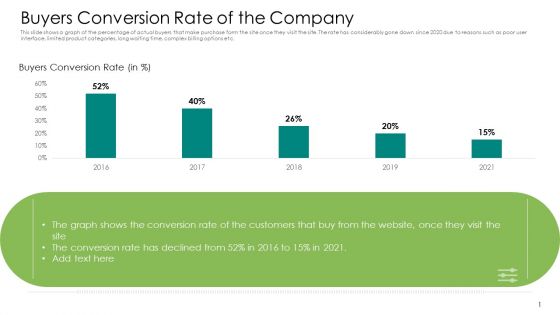
This slide shows a graph of the percentage of actual buyers that make purchase form the site once they visit the site. The rate has considerably gone down since 2020 due to reasons such as poor user interface, limited product categories, long waiting time, complex billing options etc. Deliver an awe-inspiring pitch with this creative buyers conversion rate of the company diagrams pdf. bundle. Topics like buyers conversion rate, 2016 to 2021 can be discussed with this completely editable template. It is available for immediate download depending on the needs and requirements of the user.
Covid19 Impact On Consumers Behavior Towards Restaurants Diagrams PDF
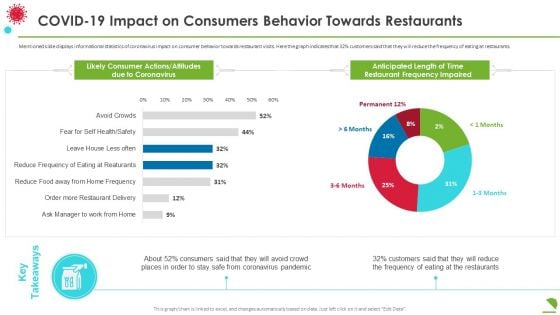
Mentioned slide displays informational statistics of coronavirus impact on consumer behavior towards restaurant visits. Here the graph indicates that 32 percentage customers said that they will reduce the frequency of eating at restaurants. Deliver an awe inspiring pitch with this creative covid19 impact on consumers behavior towards restaurants diagrams pdf bundle. Topics like covid 19 impact on consumers behavior towards restaurants can be discussed with this completely editable template. It is available for immediate download depending on the needs and requirements of the user.
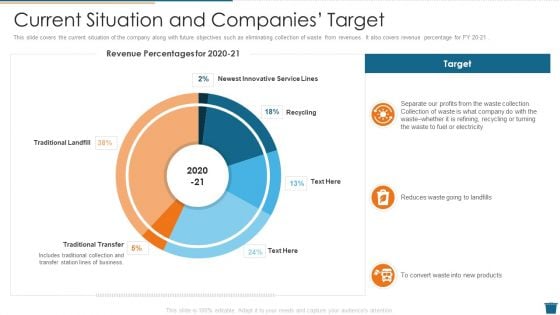
Factory Waste Management Current Situation And Companies Target Diagrams PDF
This slide covers the current situation of the company along with future objectives such as eliminating collection of waste from revenues. It also covers revenue percentage for FY 20 21 . Deliver and pitch your topic in the best possible manner with this factory waste management current situation and companies target diagrams pdf. Use them to share invaluable insights on current situation and companies target and impress your audience. This template can be altered and modified as per your expectations. So, grab it now.
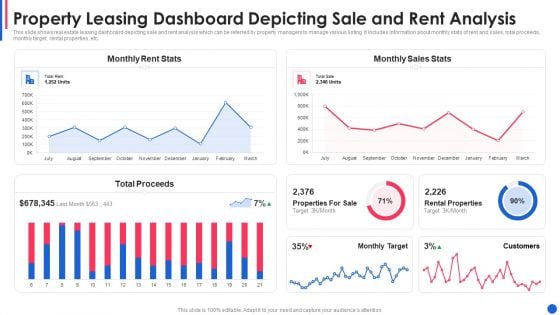
Property Leasing Dashboard Depicting Sale And Rent Analysis Diagrams PDF
This slide shows real estate leasing dashboard depicting sale and rent analysis which can be referred by property managers to manage various listing. It includes information about monthly stats of rent and sales, total proceeds, monthly target, rental properties, etc.Showcasing this set of slides titled property leasing dashboard depicting sale and rent analysis diagrams pdf The topics addressed in these templates are property leasing dashboard depicting sale and rent analysis All the content presented in this PPT design is completely editable. Download it and make adjustments in color, background, font etc. as per your unique business setting.
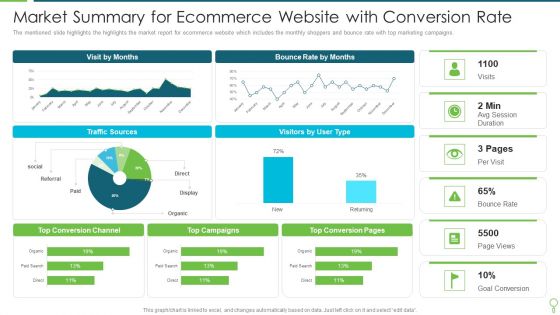
Market Summary For Ecommerce Website With Conversion Rate Diagrams PDF
The mentioned slide highlights the highlights the market report for ecommerce website which includes the monthly shoppers and bounce rate with top marketing campaigns. Pitch your topic with ease and precision using this Market Summary For Ecommerce Website With Conversion Rate Diagrams PDF. This layout presents information on Market Summary For Ecommerce Website With Conversion Rate. It is also available for immediate download and adjustment. So, changes can be made in the color, design, graphics or any other component to create a unique layout.
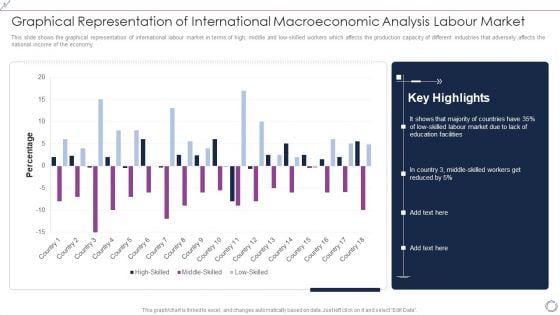
Graphical Representation Of International Macroeconomic Analysis Labour Market Diagrams PDF
This slide shows the graphical representation of international labour market in terms of high, middle and low-skilled workers which affects the production capacity of different industries that adversely affects the national income of the economy. Pitch your topic with ease and precision using this Graphical Representation Of International Macroeconomic Analysis Labour Market Diagrams PDF. This layout presents information on High Skilled, Middle Skilled, Low Skilled. It is also available for immediate download and adjustment. So, changes can be made in the color, design, graphics or any other component to create a unique layout.
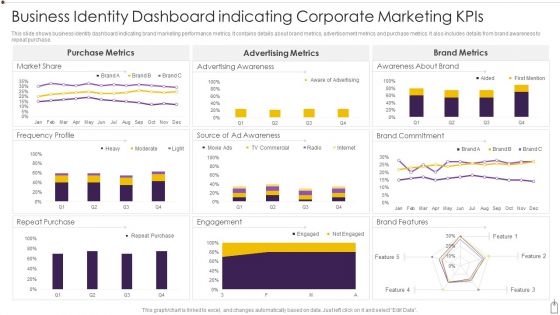
Business Identity Dashboard Indicating Corporate Marketing Kpis Diagrams PDF
This slide shows business identity dashboard indicating brand marketing performance metrics. It contains details about brand metrics, advertisement metrics and purchase metrics. It also includes details from brand awareness to repeat purchase. Showcasing this set of slides titled Business Identity Dashboard Indicating Corporate Marketing Kpis Diagrams PDF. The topics addressed in these templates are Purchase, Engagement, Market Share. All the content presented in this PPT design is completely editable. Download it and make adjustments in color, background, font etc. as per your unique business setting.
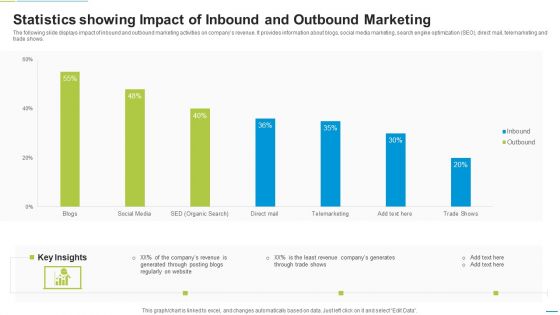
Statistics Showing Impact Of Inbound And Outbound Marketing Diagrams PDF
The following slide displays impact of inbound and outbound marketing activities on companys revenue. It provides information about blogs, social media marketing, search engine optimization SEO, direct mail, telemarketing and trade shows. Pitch your topic with ease and precision using this Statistics Showing Impact Of Inbound And Outbound Marketing Diagrams PDF. This layout presents information on Telemarketing, Social Media, Blogs. It is also available for immediate download and adjustment. So, changes can be made in the color, design, graphics or any other component to create a unique layout.
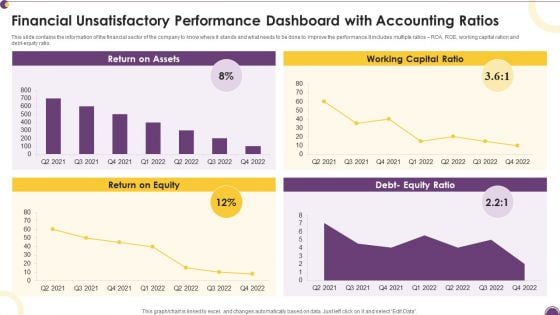
Financial Unsatisfactory Performance Dashboard With Accounting Ratios Diagrams PDF
This slide contains the information of the financial sector of the company to know where it stands and what needs to be done to improve the performance.It includes multiple ratios ROA, ROE, working capital ration and debt-equity ratio. Pitch your topic with ease and precision using this Financial Unsatisfactory Performance Dashboard With Accounting Ratios Diagrams PDF. This layout presents information on Return Assets, Working Capital, Return Equity. It is also available for immediate download and adjustment. So, changes can be made in the color, design, graphics or any other component to create a unique layout.

Personal Job Assignment Distribution Dashboard With Work Patterns Diagrams PDF
The following slide highlights the employee workload distribution dashboard with work patterns illustrating key headings which includes work patterns, work time summary, workload distribution by location and workload summary by time spent. Showcasing this set of slides titled Personal Job Assignment Distribution Dashboard With Work Patterns Diagrams PDF. The topics addressed in these templates are Work Patterns, Workload Distribution, Work Location. All the content presented in this PPT design is completely editable. Download it and make adjustments in color, background, font etc. as per your unique business setting.
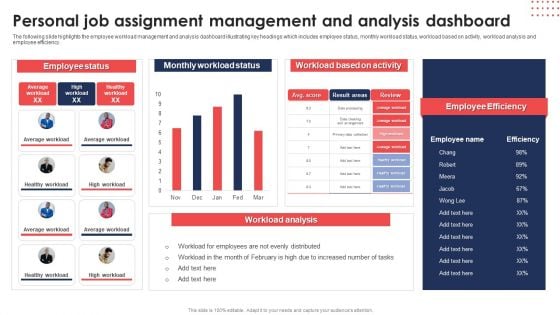
Personal Job Assignment Management And Analysis Dashboard Diagrams PDF
The following slide highlights the employee workload management and analysis dashboard illustrating key headings which includes employee status, monthly workload status, workload based on activity, workload analysis and employee efficiency. Pitch your topic with ease and precision using thisPersonal Job Assignment Management And Analysis Dashboard Diagrams PDF. This layout presents information on Employee Status, Monthly Workload Status, Workload Based Activity. It is also available for immediate download and adjustment. So, changes can be made in the color, design, graphics or any other component to create a unique layout.
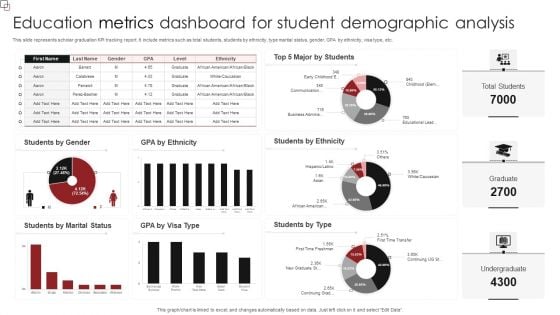
Education Metrics Dashboard For Student Demographic Analysis Diagrams PDF
This slide represents scholar graduation KPI tracking report. It include metrics such as total students, students by ethnicity, type marital status, gender, GPA by ethnicity, visa type, etc. Showcasing this set of slides titled Education Metrics Dashboard For Student Demographic Analysis Diagrams PDF. The topics addressed in these templates are Students Ethnicity, Students Type, Students Marital Status. All the content presented in this PPT design is completely editable. Download it and make adjustments in color, background, font etc. as per your unique business setting.
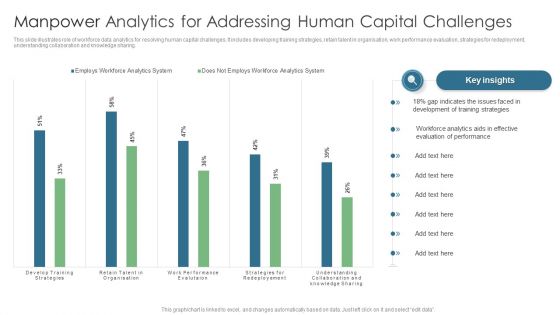
Manpower Analytics For Addressing Human Capital Challenges Diagrams PDF
This slide illustrates role of workforce data analytics for resolving human capital challenges. It includes developing training strategies, retain talent in organisation, work performance evaluation, strategies for redeployment, understanding collaboration and knowledge sharing. Showcasing this set of slides titled Manpower Analytics For Addressing Human Capital Challenges Diagrams PDF. The topics addressed in these templates are Gap Indicates, Training Strategies, Evaluation Performance. All the content presented in this PPT design is completely editable. Download it and make adjustments in color, background, font etc. as per your unique business setting.

Consulting Project Status Report Dashboard With Workspaces Diagrams PDF
The following slide showcases dashboard to provide an insight of active projects, their status and areas that require attention and improvement. Status included are on track, at risk and late Pitch your topic with ease and precision using this Consulting Project Status Report Dashboard With Workspaces Diagrams PDF. This layout presents information on Consulting Project Status Report, Dashboard With Workspaces. It is also available for immediate download and adjustment. So, changes can be made in the color, design, graphics or any other component to create a unique layout.
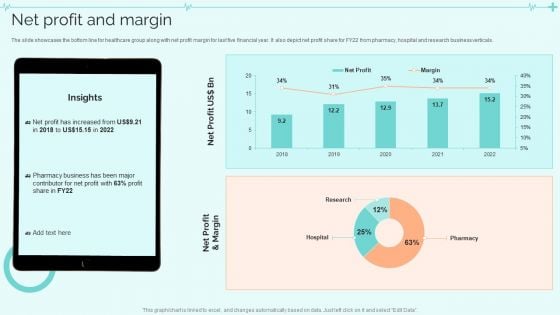
Clinical Services Company Profile Net Profit And Margin Diagrams PDF
The slide showcases the bottom line for healthcare group along with net profit margin for last five financial year. It also depict net profit share for FY22 from pharmacy, hospital and research business verticals. Deliver and pitch your topic in the best possible manner with this Clinical Services Company Profile Net Profit And Margin Diagrams PDF. Use them to share invaluable insights on Net Profit, Business, Margin and impress your audience. This template can be altered and modified as per your expectations. So, grab it now.
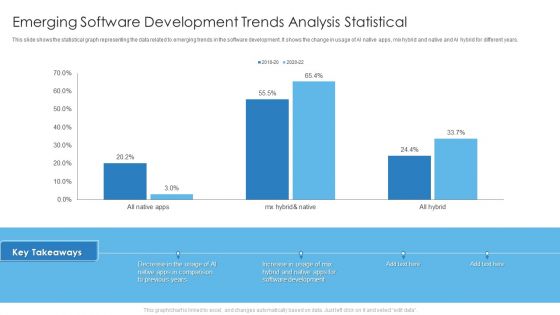
Emerging Software Development Trends Analysis Statistical Diagrams PDF
This slide shows the statistical graph representing the data related to emerging trends in the software development. It shows the change in usage of AI native apps, mix hybrid and native and AI hybrid for different years. Deliver and pitch your topic in the best possible manner with this Emerging Software Development Trends Analysis Statistical Diagrams PDF. Use them to share invaluable insights on Emerging Software Development, Trends Analysis Statistical and impress your audience. This template can be altered and modified as per your expectations. So, grab it now.
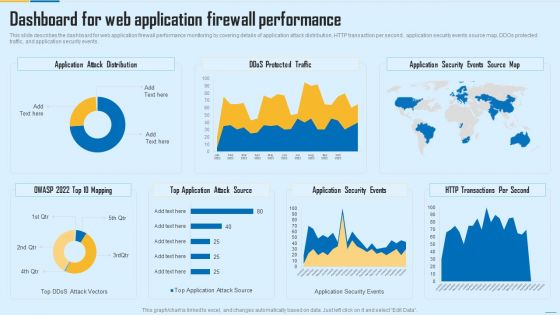
Dashboard For Web Application Firewall Performance WAF Platform Diagrams PDF
This slide describes the dashboard for web application firewall performance monitoring by covering details of application attack distribution, HTTP transaction per second, application security events source map, DDOs protected traffic, and application security events. Deliver an awe inspiring pitch with this creative Dashboard For Web Application Firewall Performance WAF Platform Diagrams PDF bundle. Topics like Application Attack Distribution, Application Security Events, Transactions Per Second can be discussed with this completely editable template. It is available for immediate download depending on the needs and requirements of the user.

 Home
Home