Cost Icon
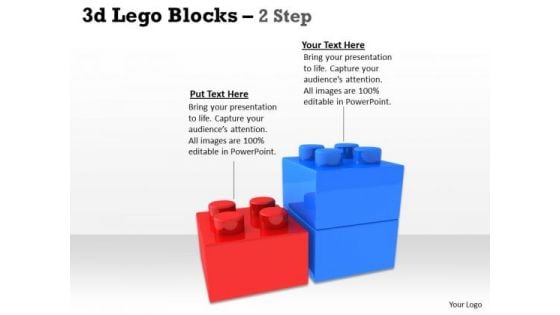
Business Finance Strategy Development 3d Lego Blocks 2 Step Sales Diagram
Get Out Of The Dock With Our Business Finance Strategy Development 3D Lego Blocks 2 Step Sales Diagram Powerpoint Templates. Your Mind Will Be Set Free. Play The Doctor With Our Business Finance Strategy Development 3D Lego Blocks 2 Step Sales Diagram Powerpoint Templates. Control Operations With Your Ideas.
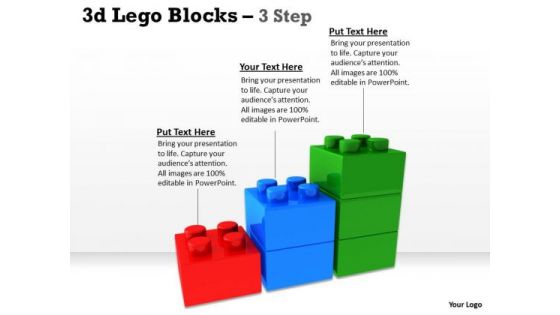
Business Finance Strategy Development 3d Lego Blocks 3 Step Business Cycle Diagram
Document The Process On Our Business Finance Strategy Development 3d Lego Blocks 3 Step Business Cycle Diagram Powerpoint Templates. Make A Record Of Every Detail. Satiate Desires With Our Business Finance Strategy Development 3d Lego Blocks 3 Step Business Cycle Diagram Powerpoint Templates. Give Them All They Want And More.
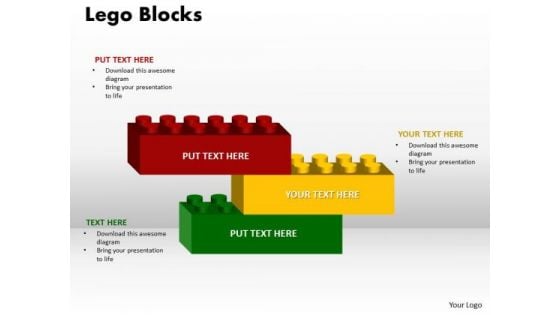
Business Cycle Diagram Building Blocks 3 Stages Business Finance Strategy Development
Analyze Ailments On Our Business Cycle Diagram Building Blocks 3 stages Business Finance Strategy Development Powerpoint Templates. Bring Out The Thinking Doctor In You. Dock Your Thoughts With Our Business Cycle Diagram Building Blocks 3 stages Business Finance Strategy Development Powerpoint Templates. They Will Launch Them Into Orbit.
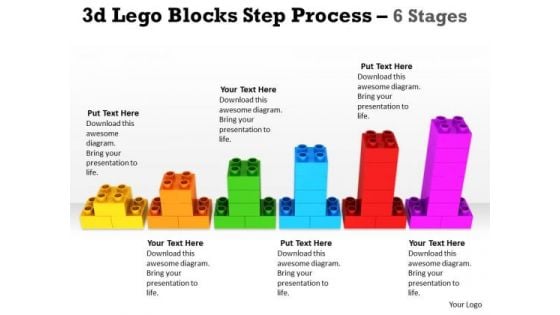
Business Finance Strategy Development 3d Lego Blocks Step Process 6 Stages Business Diagram
Document Your Views On Our Business Finance Strategy Development 3d Lego Blocks Step Process 6 Stages Business Diagram Powerpoint Templates. They Will Create A Strong Impression. Plan Your Documentary Shot By Shot. Break Them Down On Our Business Finance Strategy Development 3d Lego Blocks Step Process 6 Stages Business Diagram Powerpoint Templates.
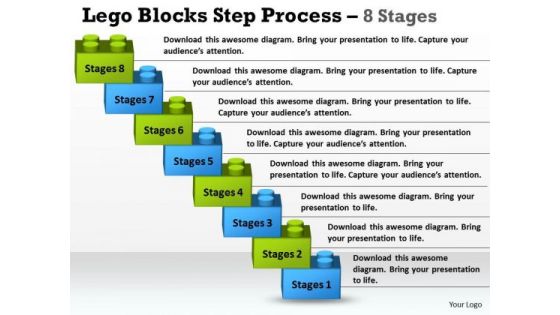
Business Finance Strategy Development Lego Blocks Step Process 8 Stages Strategy Diagram
Get Out Of The Dock With Our Business Finance Strategy Development Lego Blocks Step Process 8 Stages Strategy Diagram Powerpoint Templates. Your Mind Will Be Set Free. Play The Doctor With Our Business Finance Strategy Development Lego Blocks Step Process 8 Stages Strategy Diagram Powerpoint Templates. Control Operations With Your Ideas.

Business Finance Strategy Development Building Lego Process 10 Stages Sales Diagram
Get Out Of The Dock With Our Business Finance Strategy Development Building Lego Process 10 Stages Sales Diagram Powerpoint Templates. Your Mind Will Be Set Free. Play The Doctor With Our Business Finance Strategy Development Building Lego Process 10 Stages Sales Diagram Powerpoint Templates. Control Operations With Your Ideas.

Business Finance Strategy Development Building Lego Process 11 Stages Marketing Diagram
Analyze Ailments On Our Business Finance Strategy Development Building Lego Process 11 Stages Marketing Diagram Powerpoint Templates. Bring Out The Thinking Doctor In You. Dock Your Thoughts With Our Business Finance Strategy Development Building Lego Process 11 Stages Marketing Diagram Powerpoint Templates. They Will Launch Them Into Orbit.
Marketing Diagram Labyrinth Rectangular Ppt Green Modal Business Finance Strategy Development
Bet on your luck with our Marketing Diagram Labyrinth Rectangular ppt Green modal Business Finance Strategy Development Powerpoint Templates. Be assured that you will hit the jackpot. Let our Marketing Diagram Labyrinth Rectangular ppt Green modal Business Finance Strategy Development Powerpoint Templates be the string of your bow. Fire of your ideas and conquer the podium.
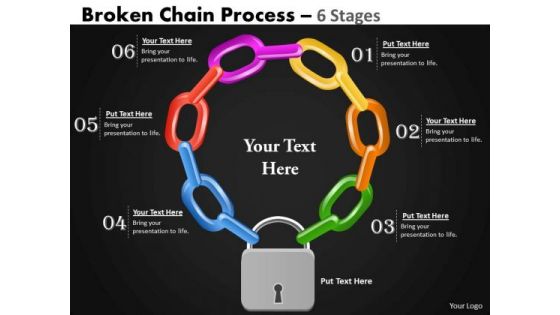
Business Finance Strategy Development Broken Chain Process 6 Stages Sales Diagram
Analyze Ailments On Our Business Finance Strategy Development Broken Chain Process 6 Stages Sales Diagram Powerpoint Templates. Bring Out The Thinking Doctor In You. Dock Your Thoughts With Our Business Finance Strategy Development Broken Chain Process 6 Stages Sales Diagram Powerpoint Templates. They Will Launch Them Into Orbit.
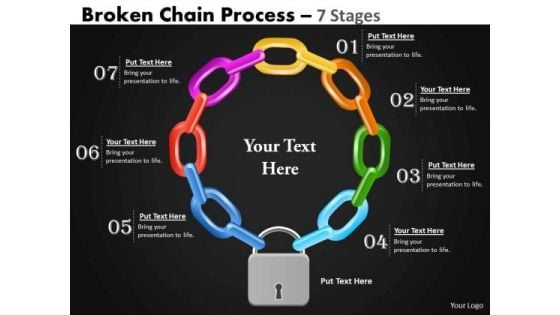
Business Finance Strategy Development Broken Chain Process 7 Stages Strategy Diagram
Analyze Ailments On Our Business Finance Strategy Development Broken Chain Process 7 Stages Strategy Diagram Powerpoint Templates. Bring Out The Thinking Doctor In You. Dock Your Thoughts With Our Business Finance Strategy Development Broken Chain Process 7 Stages Strategy Diagram Powerpoint Templates. They Will Launch Them Into Orbit.
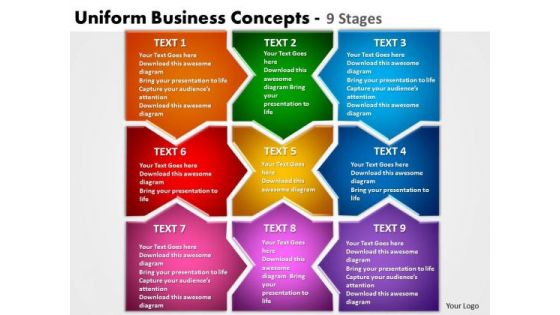
Marketing Diagram Uniform Business Concepts 9 Stages Business Finance Strategy Development
Dribble Away With Our Marketing Diagram Uniform Business Concepts 9 Stages Business Finance Strategy Development Powerpoint Templates. Score A Goal With Your Ideas. Drill It In With Our Marketing Diagram Uniform Business Concepts 9 Stages Business Finance Strategy Development Powerpoint Templates. Embed Your Message Into The Minds Of Your Audience.
Business Diagram Post It Notes Style 3 Business Finance Strategy Development
Our Business Diagram Post It Notes Style 3 Business Finance Strategy Development Powerpoint Templates offer you the needful to organize your thoughts. Use them to list out your views in a logical sequence. Our Business Diagram Post It Notes Style 3 Business Finance Strategy Development Powerpoint Templates are created by a hardworking bunch of busy bees. Always flitting around with solutions guaranteed to please.
Business Finance Strategy Development Post It Notes 4 Stages Sales Diagram
Illuminate the road ahead withour Business Finance Strategy Development Post it notes 4 Stages Sales Diagram Powerpoint Templates. Pinpoint the important landmarks along the way. Blaze a trail with our innovative Business Finance Strategy Development Post it notes 4 Stages Sales Diagram Powerpoint Templates. Clearly mark the path for others to follow.

Business Finance Strategy Development Post It Notes Style 2 Strategy Diagram
Our Business Finance Strategy Development Post It Notes Style 2 Strategy Diagram Powerpoint Templates give you the basic framework of your talk. Give it the shape you desire with your wonderful views. Our Business Finance Strategy Development Post It Notes Style 2 Strategy Diagram Powerpoint Templates are the lungs of your talk. Fill them with the oxygen of your indepth thought process.
Business Finance Strategy Development Post It Notes Style 4 Business Diagram
Our Business Finance Strategy Development post it notes style 4 Business Diagram Powerpoint Templates provide the pitch to bowl on. Mesmerise your audience with your guile. Our Business Finance Strategy Development post it notes style 4 Business Diagram Powerpoint Templates are stepping stones to success. Climb them steadily and reach the top.
Business Finance Strategy Development Post It Notes Style 4 Consulting Diagram
Our Business Finance Strategy Development Post It Notes Style 4 Consulting Diagram Powerpoint Templates are the strands of your mental loom. Weave them together and produce a magical tapestry. Our Business Finance Strategy Development Post It Notes Style 4 Consulting Diagram Powerpoint Templates provide windows to your brilliant mind. Open them to your audience and impress them with your knowledge.
Business Finance Strategy Development Post It Notes Style 4 Marketing Diagram
Our Business Finance Strategy Development Post It Notes Style 4 Marketing Diagram Powerpoint Templates are the layers of your gourmet cake. Provide the icing of your ideas and produce a masterpiece. Use our Business Finance Strategy Development Post It Notes Style 4 Marketing Diagram Powerpoint Templates and and feel the difference. Right off they generate a surge of interest.
Consulting Diagram Post It Notes Style 1 Business Finance Strategy Development
Our Consulting Diagram Post It Notes Style 1 Business Finance Strategy Development Powerpoint Templates Are Truly Out Of This World. Even The MIB Duo Has Been Keeping Tabs On Our Team. Our Consulting Diagram Post It Notes Style 1 Business Finance Strategy Development Powerpoint Templates Team Portray An Attitude Of Elegance. Personify This Quality By Using Them Regularly.
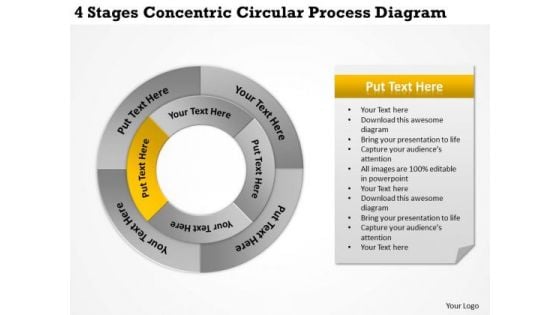
Develop Business Strategy Concentric Circular Process Diagram Development
We present our develop business strategy concentric circular process diagram development.Use our Flow Charts PowerPoint Templates because Our PowerPoint Templates and Slides will help you be quick off the draw. Just enter your specific text and see your points hit home. Download our Circle Charts PowerPoint Templates because our PowerPoint Templates and Slides will give your ideas the shape. Present our Ring charts PowerPoint Templates because Our PowerPoint Templates and Slides are truly out of this world. Even the MIB duo has been keeping tabs on our team. Present our Process and Flows PowerPoint Templates because These PowerPoint Templates and Slides will give the updraft to your ideas. See them soar to great heights with ease. Use our Business PowerPoint Templates because Our PowerPoint Templates and Slides will weave a web of your great ideas. They are gauranteed to attract even the most critical of your colleagues.Use these PowerPoint slides for presentations relating to Market, graph, sectors, chart, isolated, white, business, conglomerates, circle, graphic, goods, materials, technology, wheel, illustration, energy, basic, pie,round, clipart, utilities, cyclical, colorful, clip, text, transportation, infographic, transparency, four services, information, investment, financial, non,healthcare, capital. The prominent colors used in the PowerPoint template are Yellow, White, Gray. Our Develop Business Strategy Concentric Circular Process Diagram Development are like a deep breath. They ensure your ideas endure.
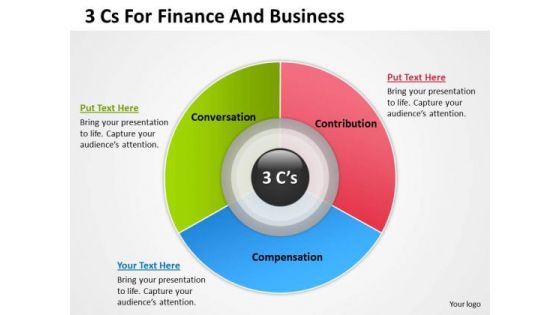
Strategy PowerPoint Template 3 Cs For Finance And Business Ppt Templates
Our strategy powerpoint template 3 cs for finance and business ppt templates will will follow the drill. They accomplish the task assigned to them. Do the drill with our Marketing PowerPoint Templates. Your ideas will march ahead. Place the orders with your thoughts. Our Circle Charts PowerPoint Templates know the drill. Bigger the challenge, better the answers. Our Strategy PowerPoint Template 3 Cs For Finance And Business Ppt Templates will deliver a decisive blow.
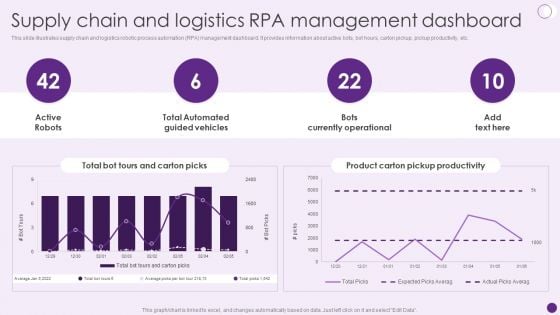
Supply Chain And Logistics Rpa Management Dashboard Deploying Automation To Enhance Diagrams PDF
This slide illustrates supply chain and logistics robotic process automation RPA management dashboard. It provides information about active bots, bot hours, carton pickup, pickup productivity, etc. Boost your pitch with our creative Supply Chain And Logistics Rpa Management Dashboard Deploying Automation To Enhance Diagrams PDF. Deliver an awe-inspiring pitch that will mesmerize everyone. Using these presentation templates you will surely catch everyones attention. You can browse the ppts collection on our website. We have researchers who are experts at creating the right content for the templates. So you do not have to invest time in any additional work. Just grab the template now and use them.
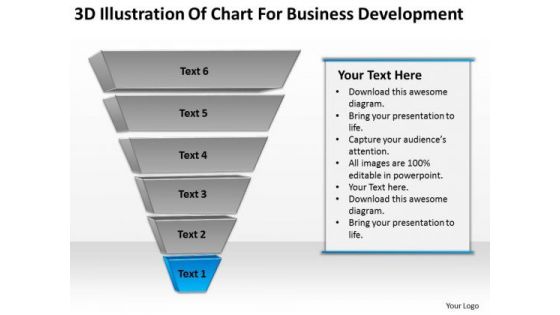
3d Illustration Of Chart For Business Development Ppt Plan PowerPoint Templates
We present our 3d illustration of chart for business development ppt plan PowerPoint templates.Download and present our Business PowerPoint Templates because These PowerPoint Templates and Slides will give the updraft to your ideas. See them soar to great heights with ease. Use our Flow Charts PowerPoint Templates because Our PowerPoint Templates and Slides team portray an attitude of elegance. Personify this quality by using them regularly. Present our Process and Flows PowerPoint Templates because You are an avid believer in ethical practices. Highlight the benefits that accrue with our PowerPoint Templates and Slides. Present our Triangles PowerPoint Templates because Our PowerPoint Templates and Slides are effectively colour coded to prioritise your plans They automatically highlight the sequence of events you desire. Download and present our Pyramids PowerPoint Templates because It can Conjure up grand ideas with our magical PowerPoint Templates and Slides. Leave everyone awestruck by the end of your presentation.Use these PowerPoint slides for presentations relating to Pyramidal, diagram, pyramid, market, ascent, grow, step, achievement, triangle, business, mountains, concept, render, success, presentation, pile,finance, level, layer, upward, development, building, shape, illustration, stage, status, winner, solution, design, ascend, growth, motivation, organization, going,progress, profit, increase, work, trade, angle, successful, conceptual, financial, careers, structure, performance. The prominent colors used in the PowerPoint template are Blue, Gray, Black. Venture into the unknown with our 3d Illustration Of Chart For Business Development Ppt Plan PowerPoint Templates. Your thoughts will move ahead sure-footedly.
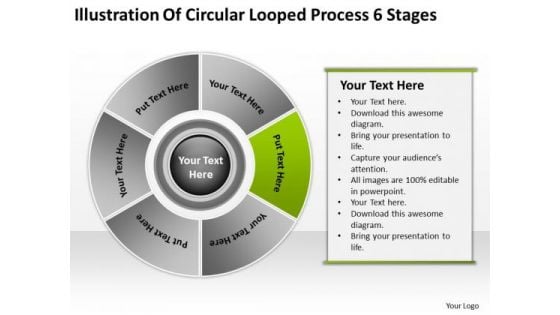
Circular Looped Process 6 Stages Business Plan Example PowerPoint Slides
We present our circular looped process 6 stages business plan example PowerPoint Slides.Download our Finance PowerPoint Templates because You can Score a slam dunk with our PowerPoint Templates and Slides. Watch your audience hang onto your every word. Use our Marketing PowerPoint Templates because you should Whip up a frenzy with our PowerPoint Templates and Slides. They will fuel the excitement of your team. Use our Business PowerPoint Templates because Our PowerPoint Templates and Slides will let you Hit the target. Go the full distance with ease and elan. Download our Circle Charts PowerPoint Templates because Our PowerPoint Templates and Slides will let your team Walk through your plans. See their energy levels rise as you show them the way. Download our Process and Flows PowerPoint Templates because You have a driving passion to excel in your field. Our PowerPoint Templates and Slides will prove ideal vehicles for your ideas.Use these PowerPoint slides for presentations relating to Chart, wheel, pie, graph, vector, process, marketing, diagram, business, catalog, website, network, statistics, model, document, junction, plan, presentation, template, circle, brochure, data, stock, management, box, options, direction, design, company, navigation, financial, structure, button, goals, results. The prominent colors used in the PowerPoint template are Green, Gray, Black. Examine every deatail with our Circular Looped Process 6 Stages Business Plan Example PowerPoint Slides. Put each element to the test.

Globe And Laptop Communication PowerPoint Templates And PowerPoint Themes 1012
The above template contains an image of laptop around globe. Grab the attention of your team with this eye catching template signifying global network. This image has been conceived to enable you to emphatically communicate your ideas in your Global PPT presentations on communication, networking, internet and technology. Create captivating presentations to deliver comparative and weighted arguments. Project your views with our Globe And Laptop Communication PowerPoint Templates And PowerPoint Themes 1012. Download without worries with our money back guaranteee.
Real Estate Market PowerPoint Templates And PowerPoint Themes 1012
Deliver amazing Presentations with our above template which contains a graphic of many colorful houses. This image represents the real estate concept. It is a useful captivating tool concieved to enable you to define your message in your Business PPT presentations. Go ahead and add personality to your presentations with our colorful template. Improve your organization with our Real Estate Market PowerPoint Templates And PowerPoint Themes 1012. Download without worries with our money back guaranteee.
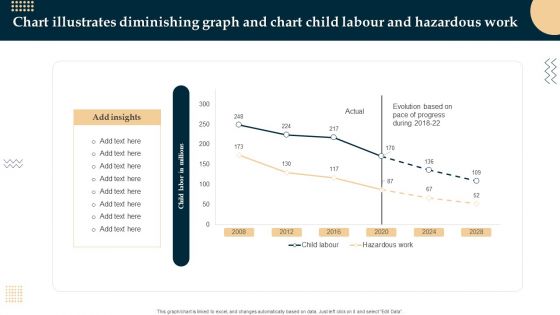
Chart Illustrates Diminishing Graph And Chart Child Labour And Hazardous Work Inspiration PDF
Showcasing this set of slides titled Chart Illustrates Diminishing Graph And Chart Child Labour And Hazardous Work Inspiration PDF. The topics addressed in these templates are Chart Illustrates Diminishing Graph, Hazardous Work, Chart Child Labour. All the content presented in this PPT design is completely editable. Download it and make adjustments in color, background, font etc. as per your unique business setting.

Chart Indicates Diminishing Graph And Chart Cash Payment Mode Inspiration PDF
Showcasing this set of slides titled Chart Indicates Diminishing Graph And Chart Cash Payment Mode Inspiration PDF. The topics addressed in these templates are Chart Indicates Diminishing Graph, Chart Cash Payment Mode. All the content presented in this PPT design is completely editable. Download it and make adjustments in color, background, font etc. as per your unique business setting.
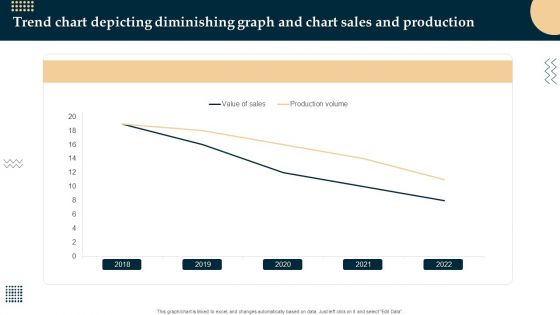
Trend Chart Depicting Diminishing Graph And Chart Sales And Production Structure PDF
Pitch your topic with ease and precision using this Trend Chart Depicting Diminishing Graph And Chart Sales And Production Structure PDF. This layout presents information on Trend Chart Depicting, Diminishing Graph, Chart Sales And Production. It is also available for immediate download and adjustment. So, changes can be made in the color, design, graphics or any other component to create a unique layout.

Chart Indicates Diminishing Graph And Chart Retail Value And Volume Download PDF
Pitch your topic with ease and precision using this Chart Indicates Diminishing Graph And Chart Retail Value And Volume Download PDF. This layout presents information on Chart Indicates Diminishing Graph, Chart Retail Value And Volume. It is also available for immediate download and adjustment. So, changes can be made in the color, design, graphics or any other component to create a unique layout.
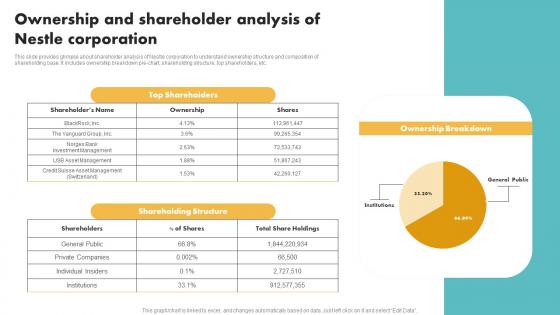
Ownership And Shareholder Analysis Of Nestle Corporation Customer Segmentation Summary Pdf
This slide provides glimpse about shareholder analysis of Nestle corporation to understand ownership structure and composition of shareholding base. It includes ownership breakdown pie-chart, shareholding structure, top shareholders, etc. Boost your pitch with our creative Ownership And Shareholder Analysis Of Nestle Corporation Customer Segmentation Summary Pdf Deliver an awe-inspiring pitch that will mesmerize everyone. Using these presentation templates you will surely catch everyones attention. You can browse the ppts collection on our website. We have researchers who are experts at creating the right content for the templates. So you do not have to invest time in any additional work. Just grab the template now and use them. This slide provides glimpse about shareholder analysis of Nestle corporation to understand ownership structure and composition of shareholding base. It includes ownership breakdown pie-chart, shareholding structure, top shareholders, etc.
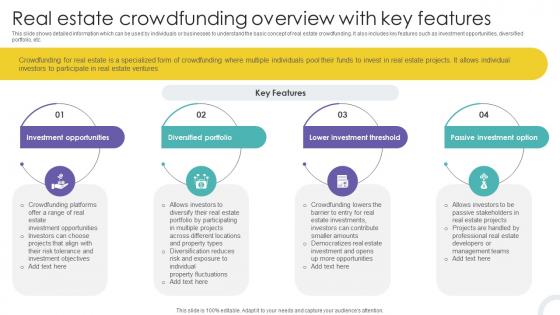
Real Estate Crowdfunding Overview With Key Features Crowdfunding Strategies To Raise Funds Fin SS V
This slide shows detailed information which can be used by individuals or businesses to understand the basic concept of real estate crowdfunding. It also includes key features such as investment opportunities, diversified portfolio, etc. Do you know about Slidesgeeks Real Estate Crowdfunding Overview With Key Features Crowdfunding Strategies To Raise Funds Fin SS V These are perfect for delivering any kind od presentation. Using it, create PowerPoint presentations that communicate your ideas and engage audiences. Save time and effort by using our pre-designed presentation templates that are perfect for a wide range of topic. Our vast selection of designs covers a range of styles, from creative to business, and are all highly customizable and easy to edit. Download as a PowerPoint template or use them as Google Slides themes. This slide shows detailed information which can be used by individuals or businesses to understand the basic concept of real estate crowdfunding. It also includes key features such as investment opportunities, diversified portfolio, etc.

Gold Chart Business PowerPoint Template 0810
3D gold growth graph with world map. All in gold. Take control with our Gold Chart Business PowerPoint Template 0810. Do not be fatalistic in your approach.
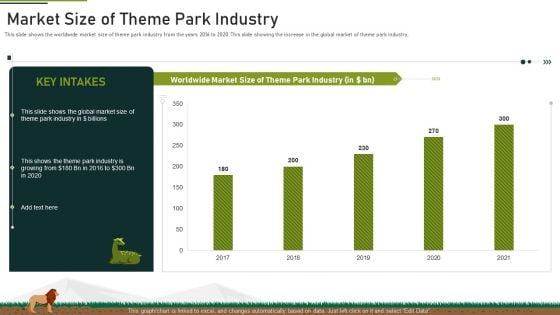
Market Size Of Theme Park Industry Ppt Infographic Template Microsoft PDF
This slide shows the worldwide market size of theme park industry from the years 2016 to 2020. This slide showing the increase in the global market of theme park industry. Deliver and pitch your topic in the best possible manner with this market size of theme park industry ppt infographic template microsoft pdf. Use them to share invaluable insights on market size of theme park industry and impress your audience. This template can be altered and modified as per your expectations. So, grab it now.
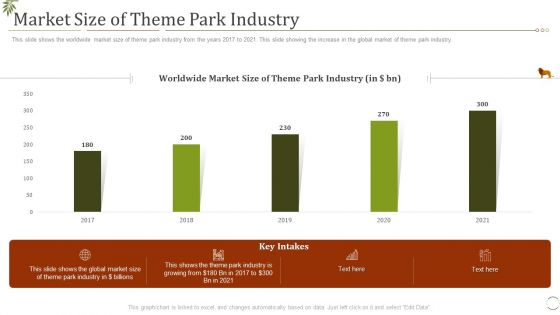
Market Size Of Theme Park Industry Ppt Inspiration Example Introduction PDF
This slide shows the worldwide market size of theme park industry from the years 2017 to 2021. This slide showing the increase in the global market of theme park industry. Deliver and pitch your topic in the best possible manner with this market size of theme park industry ppt inspiration example introduction pdf. Use them to share invaluable insights on market size of theme park industry and impress your audience. This template can be altered and modified as per your expectations. So, grab it now.
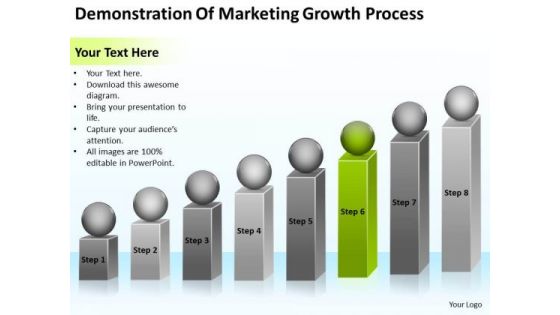
Demonstration Of Marketing Growth Process Ppt Business Planning PowerPoint Templates
We present our demonstration of marketing growth process ppt business planning PowerPoint templates.Download and present our Spheres PowerPoint Templates because Our PowerPoint Templates and Slides will give good value for money. They also have respect for the value of your time. Download and present our Process and Flows PowerPoint Templates because Our PowerPoint Templates and Slides will let you Hit the right notes. Watch your audience start singing to your tune. Download our Flow Charts PowerPoint Templates because Our PowerPoint Templates and Slides will weave a web of your great ideas. They are gauranteed to attract even the most critical of your colleagues. Download and present our Shapes PowerPoint Templates because Our PowerPoint Templates and Slides come in all colours, shades and hues. They help highlight every nuance of your views. Use our Business PowerPoint Templates because You can Channelise the thoughts of your team with our PowerPoint Templates and Slides. Urge them to focus on the goals you have set.Use these PowerPoint slides for presentations relating to Diagram, chart, market, statistics, square, grow, infograph, bar, corporate, red, business, vector, success, presentation, growing, circle, finance,analyst, goal, report, marketing, different, accounting, management, graph, illustration, geometric, sphere, design, growth, infographic, progress, profit,information, increase, aim, analyze, financial, rising, measure, block. The prominent colors used in the PowerPoint template are Green, Gray, Black. Assess consumer choices with our Demonstration Of Marketing Growth Process Ppt Business Planning PowerPoint Templates. Get an idea of their buying patterns.
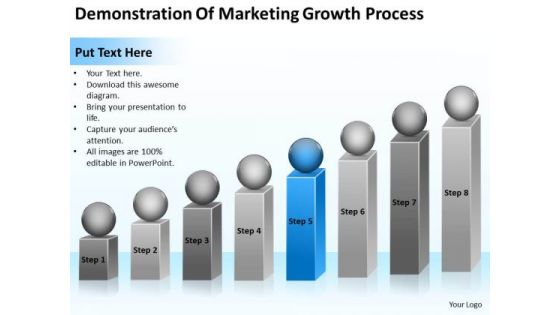
Demonstration Of Marketing Growth Process Ppt Business Plan PowerPoint Template
We present our demonstration of marketing growth process ppt business plan PowerPoint template.Present our Process and Flows PowerPoint Templates because Our PowerPoint Templates and Slides will Activate the energies of your audience. Get their creative juices flowing with your words. Use our Spheres PowerPoint Templates because Our PowerPoint Templates and Slides will give good value for money. They also have respect for the value of your time. Present our Flow Charts PowerPoint Templates because Our PowerPoint Templates and Slides team portray an attitude of elegance. Personify this quality by using them regularly. Download our Business PowerPoint Templates because Our PowerPoint Templates and Slides are specially created by a professional team with vast experience. They diligently strive to come up with the right vehicle for your brilliant Ideas. Download our Shapes PowerPoint Templates because You can Double your output with our PowerPoint Templates and Slides. They make beating deadlines a piece of cake.Use these PowerPoint slides for presentations relating to Diagram, chart, market, statistics, square, grow, infograph, bar, corporate, red, business, vector, success, presentation, growing, circle, finance,analyst, goal, report, marketing, different, accounting, management, graph, illustration, geometric, sphere, design, growth, infographic, progress, profit,information, increase, aim, analyze, financial, rising, measure, block. The prominent colors used in the PowerPoint template are Blue, Gray, White. Add brilliance with our Demonstration Of Marketing Growth Process Ppt Business Plan PowerPoint Template. You will come out on top.
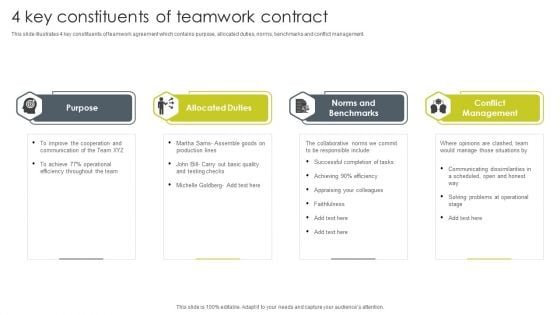
4 Key Constituents Of Teamwork Contract Graphics PDF
This slide illustrates 4 key constituents of teamwork agreement which contains purpose, allocated duties, norms, benchmarks and conflict management. Presenting 4 Key Constituents Of Teamwork Contract Graphics PDF to dispense important information. This template comprises four stages. It also presents valuable insights into the topics including Allocated Duties, Norms And Benchmarks, Conflict Management. This is a completely customizable PowerPoint theme that can be put to use immediately. So, download it and address the topic impactfully.
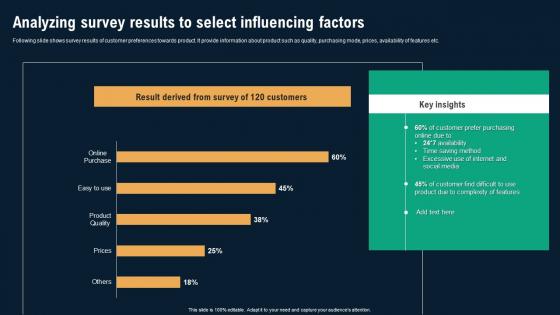
Analyzing Survey Results To Select Influencing Factors Business Environmental Analysis Introduction Pdf
Following slide shows survey results of customer preferences towards product. It provide information about product such as quality, purchasing mode, prices, availability of features etc. There are so many reasons you need a Analyzing Survey Results To Select Influencing Factors Business Environmental Analysis Introduction Pdf The first reason is you can not spend time making everything from scratch, Thus, Slidegeeks has made presentation templates for you too. You can easily download these templates from our website easily. Following slide shows survey results of customer preferences towards product. It provide information about product such as quality, purchasing mode, prices, availability of features etc.
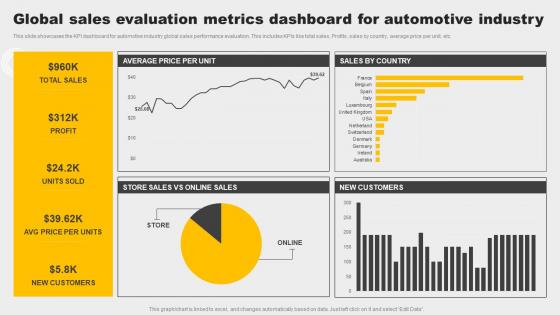
Global Sales Evaluation Metrics Dashboard For Automotive Industry Demonstration Pdf
This slide showcases the KPI dashboard for automotive industry global sales performance evaluation. This includes KPIs like total sales, Profits, sales by country, average price per unit, etc. Pitch your topic with ease and precision using this Global Sales Evaluation Metrics Dashboard For Automotive Industry Demonstration Pdf. This layout presents information on Customers, Profit, Sales. It is also available for immediate download and adjustment. So, changes can be made in the color, design, graphics or any other component to create a unique layout. This slide showcases the KPI dashboard for automotive industry global sales performance evaluation. This includes KPIs like total sales, Profits, sales by country, average price per unit, etc.

Customer Retention Through Effective Subscription Strategic Plan Infographics Pdf
This slide showcases subscription plan strategy to retain customers. It includes various programmes such as avoid add on approach, add value in prices and provide great experience. Showcasing this set of slides titled Customer Retention Through Effective Subscription Strategic Plan Infographics Pdf. The topics addressed in these templates are Retain Customer, Provide Variety, Great Experience. All the content presented in this PPT design is completely editable. Download it and make adjustments in color, background, font etc. as per your unique business setting. This slide showcases subscription plan strategy to retain customers. It includes various programmes such as avoid add on approach, add value in prices and provide great experience.

Revenue Model Shared Transportation Platform Business Model BMC SS V
This slide showcases segments of revenue such as commission, surge pricing, more categories and Lyft pink. If your project calls for a presentation, then Slidegeeks is your go-to partner because we have professionally designed, easy-to-edit templates that are perfect for any presentation. After downloading, you can easily edit Revenue Model Shared Transportation Platform Business Model BMC SS V and make the changes accordingly. You can rearrange slides or fill them with different images. Check out all the handy templates This slide showcases segments of revenue such as commission, surge pricing, more categories and Lyft pink.
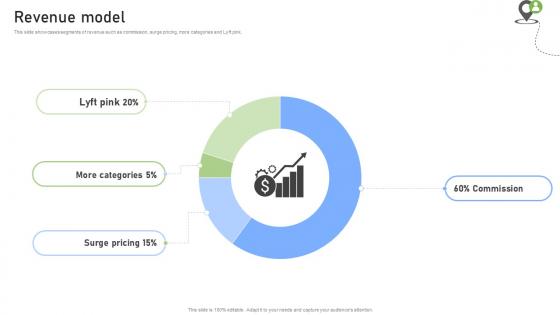
Revenue Model Rideshare Platform Business Model BMC SS V
This slide showcases segments of revenue such as commission, surge pricing, more categories and Lyft pink. If your project calls for a presentation, then Slidegeeks is your go-to partner because we have professionally designed, easy-to-edit templates that are perfect for any presentation. After downloading, you can easily edit Revenue Model Rideshare Platform Business Model BMC SS V and make the changes accordingly. You can rearrange slides or fill them with different images. Check out all the handy templates This slide showcases segments of revenue such as commission, surge pricing, more categories and Lyft pink.
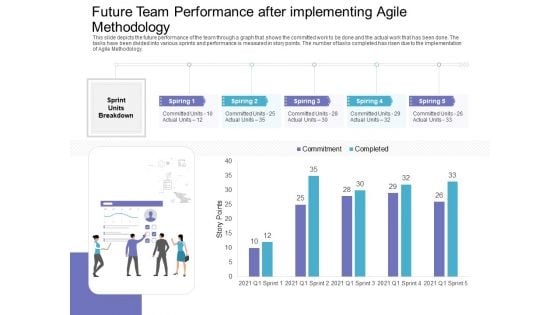
Future Team Performance After Implementing Agile Methodology Diagrams PDF
This slide depicts the future performance of the team through a graph that shows the committed work to be done and the actual work that has been done. The tasks have been divided into various sprints and performance is measured in story points. The number of tasks completed has risen due to the implementation of Agile Methodology. Deliver and pitch your topic in the best possible manner with this future team performance after implementing agile methodology diagrams pdf. Use them to share invaluable insights on future team performance after implementing agile methodology and impress your audience. This template can be altered and modified as per your expectations. So, grab it now.
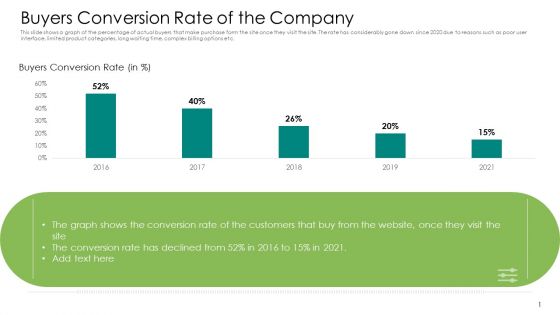
Buyers Conversion Rate Of The Company Diagrams PDF
This slide shows a graph of the percentage of actual buyers that make purchase form the site once they visit the site. The rate has considerably gone down since 2020 due to reasons such as poor user interface, limited product categories, long waiting time, complex billing options etc. Deliver an awe-inspiring pitch with this creative buyers conversion rate of the company diagrams pdf. bundle. Topics like buyers conversion rate, 2016 to 2021 can be discussed with this completely editable template. It is available for immediate download depending on the needs and requirements of the user.
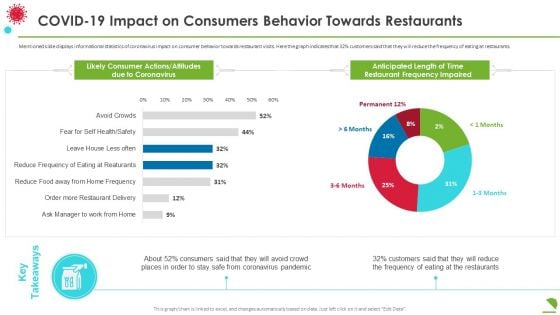
Covid19 Impact On Consumers Behavior Towards Restaurants Diagrams PDF
Mentioned slide displays informational statistics of coronavirus impact on consumer behavior towards restaurant visits. Here the graph indicates that 32 percentage customers said that they will reduce the frequency of eating at restaurants. Deliver an awe inspiring pitch with this creative covid19 impact on consumers behavior towards restaurants diagrams pdf bundle. Topics like covid 19 impact on consumers behavior towards restaurants can be discussed with this completely editable template. It is available for immediate download depending on the needs and requirements of the user.
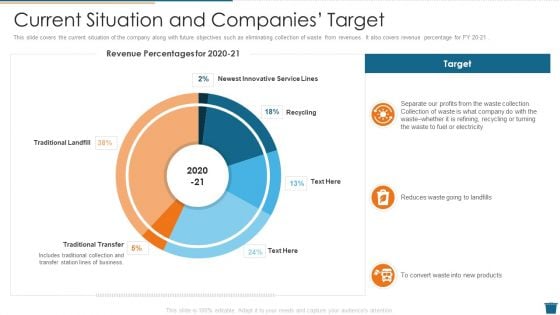
Factory Waste Management Current Situation And Companies Target Diagrams PDF
This slide covers the current situation of the company along with future objectives such as eliminating collection of waste from revenues. It also covers revenue percentage for FY 20 21 . Deliver and pitch your topic in the best possible manner with this factory waste management current situation and companies target diagrams pdf. Use them to share invaluable insights on current situation and companies target and impress your audience. This template can be altered and modified as per your expectations. So, grab it now.
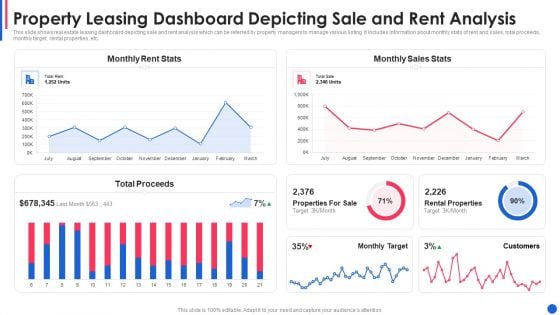
Property Leasing Dashboard Depicting Sale And Rent Analysis Diagrams PDF
This slide shows real estate leasing dashboard depicting sale and rent analysis which can be referred by property managers to manage various listing. It includes information about monthly stats of rent and sales, total proceeds, monthly target, rental properties, etc.Showcasing this set of slides titled property leasing dashboard depicting sale and rent analysis diagrams pdf The topics addressed in these templates are property leasing dashboard depicting sale and rent analysis All the content presented in this PPT design is completely editable. Download it and make adjustments in color, background, font etc. as per your unique business setting.
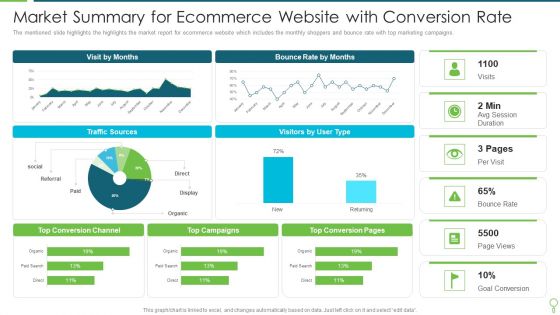
Market Summary For Ecommerce Website With Conversion Rate Diagrams PDF
The mentioned slide highlights the highlights the market report for ecommerce website which includes the monthly shoppers and bounce rate with top marketing campaigns. Pitch your topic with ease and precision using this Market Summary For Ecommerce Website With Conversion Rate Diagrams PDF. This layout presents information on Market Summary For Ecommerce Website With Conversion Rate. It is also available for immediate download and adjustment. So, changes can be made in the color, design, graphics or any other component to create a unique layout.
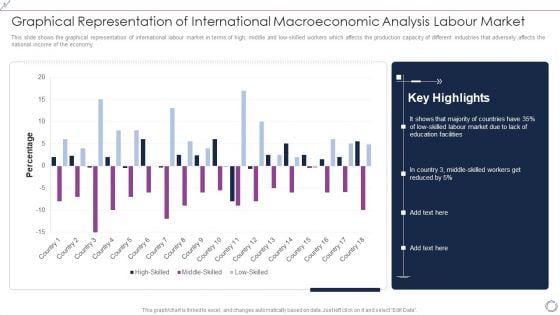
Graphical Representation Of International Macroeconomic Analysis Labour Market Diagrams PDF
This slide shows the graphical representation of international labour market in terms of high, middle and low-skilled workers which affects the production capacity of different industries that adversely affects the national income of the economy. Pitch your topic with ease and precision using this Graphical Representation Of International Macroeconomic Analysis Labour Market Diagrams PDF. This layout presents information on High Skilled, Middle Skilled, Low Skilled. It is also available for immediate download and adjustment. So, changes can be made in the color, design, graphics or any other component to create a unique layout.
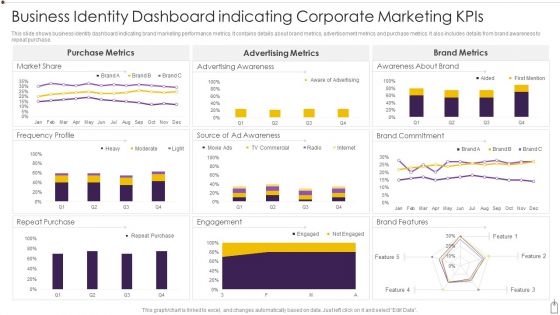
Business Identity Dashboard Indicating Corporate Marketing Kpis Diagrams PDF
This slide shows business identity dashboard indicating brand marketing performance metrics. It contains details about brand metrics, advertisement metrics and purchase metrics. It also includes details from brand awareness to repeat purchase. Showcasing this set of slides titled Business Identity Dashboard Indicating Corporate Marketing Kpis Diagrams PDF. The topics addressed in these templates are Purchase, Engagement, Market Share. All the content presented in this PPT design is completely editable. Download it and make adjustments in color, background, font etc. as per your unique business setting.
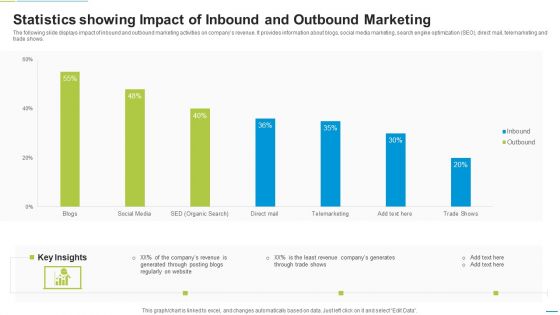
Statistics Showing Impact Of Inbound And Outbound Marketing Diagrams PDF
The following slide displays impact of inbound and outbound marketing activities on companys revenue. It provides information about blogs, social media marketing, search engine optimization SEO, direct mail, telemarketing and trade shows. Pitch your topic with ease and precision using this Statistics Showing Impact Of Inbound And Outbound Marketing Diagrams PDF. This layout presents information on Telemarketing, Social Media, Blogs. It is also available for immediate download and adjustment. So, changes can be made in the color, design, graphics or any other component to create a unique layout.
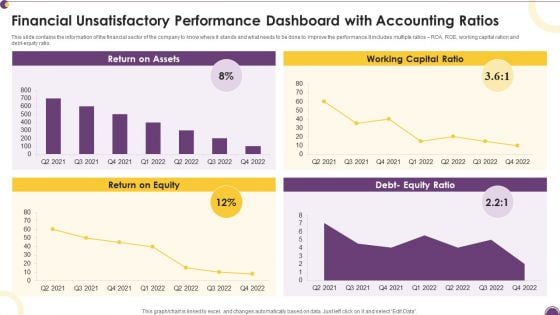
Financial Unsatisfactory Performance Dashboard With Accounting Ratios Diagrams PDF
This slide contains the information of the financial sector of the company to know where it stands and what needs to be done to improve the performance.It includes multiple ratios ROA, ROE, working capital ration and debt-equity ratio. Pitch your topic with ease and precision using this Financial Unsatisfactory Performance Dashboard With Accounting Ratios Diagrams PDF. This layout presents information on Return Assets, Working Capital, Return Equity. It is also available for immediate download and adjustment. So, changes can be made in the color, design, graphics or any other component to create a unique layout.

Personal Job Assignment Distribution Dashboard With Work Patterns Diagrams PDF
The following slide highlights the employee workload distribution dashboard with work patterns illustrating key headings which includes work patterns, work time summary, workload distribution by location and workload summary by time spent. Showcasing this set of slides titled Personal Job Assignment Distribution Dashboard With Work Patterns Diagrams PDF. The topics addressed in these templates are Work Patterns, Workload Distribution, Work Location. All the content presented in this PPT design is completely editable. Download it and make adjustments in color, background, font etc. as per your unique business setting.
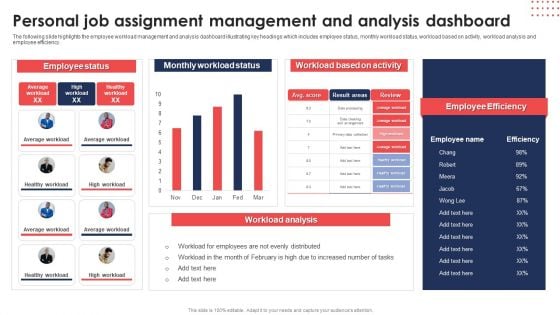
Personal Job Assignment Management And Analysis Dashboard Diagrams PDF
The following slide highlights the employee workload management and analysis dashboard illustrating key headings which includes employee status, monthly workload status, workload based on activity, workload analysis and employee efficiency. Pitch your topic with ease and precision using thisPersonal Job Assignment Management And Analysis Dashboard Diagrams PDF. This layout presents information on Employee Status, Monthly Workload Status, Workload Based Activity. It is also available for immediate download and adjustment. So, changes can be made in the color, design, graphics or any other component to create a unique layout.
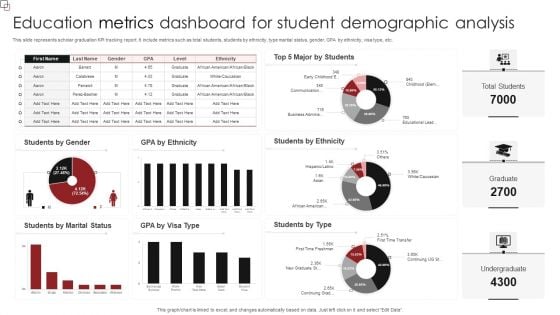
Education Metrics Dashboard For Student Demographic Analysis Diagrams PDF
This slide represents scholar graduation KPI tracking report. It include metrics such as total students, students by ethnicity, type marital status, gender, GPA by ethnicity, visa type, etc. Showcasing this set of slides titled Education Metrics Dashboard For Student Demographic Analysis Diagrams PDF. The topics addressed in these templates are Students Ethnicity, Students Type, Students Marital Status. All the content presented in this PPT design is completely editable. Download it and make adjustments in color, background, font etc. as per your unique business setting.
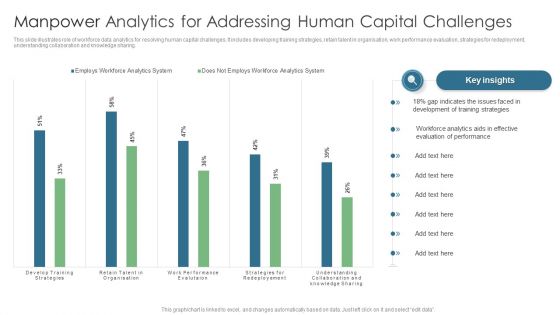
Manpower Analytics For Addressing Human Capital Challenges Diagrams PDF
This slide illustrates role of workforce data analytics for resolving human capital challenges. It includes developing training strategies, retain talent in organisation, work performance evaluation, strategies for redeployment, understanding collaboration and knowledge sharing. Showcasing this set of slides titled Manpower Analytics For Addressing Human Capital Challenges Diagrams PDF. The topics addressed in these templates are Gap Indicates, Training Strategies, Evaluation Performance. All the content presented in this PPT design is completely editable. Download it and make adjustments in color, background, font etc. as per your unique business setting.

Consulting Project Status Report Dashboard With Workspaces Diagrams PDF
The following slide showcases dashboard to provide an insight of active projects, their status and areas that require attention and improvement. Status included are on track, at risk and late Pitch your topic with ease and precision using this Consulting Project Status Report Dashboard With Workspaces Diagrams PDF. This layout presents information on Consulting Project Status Report, Dashboard With Workspaces. It is also available for immediate download and adjustment. So, changes can be made in the color, design, graphics or any other component to create a unique layout.
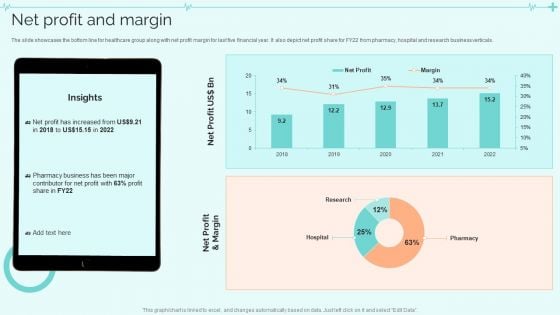
Clinical Services Company Profile Net Profit And Margin Diagrams PDF
The slide showcases the bottom line for healthcare group along with net profit margin for last five financial year. It also depict net profit share for FY22 from pharmacy, hospital and research business verticals. Deliver and pitch your topic in the best possible manner with this Clinical Services Company Profile Net Profit And Margin Diagrams PDF. Use them to share invaluable insights on Net Profit, Business, Margin and impress your audience. This template can be altered and modified as per your expectations. So, grab it now.
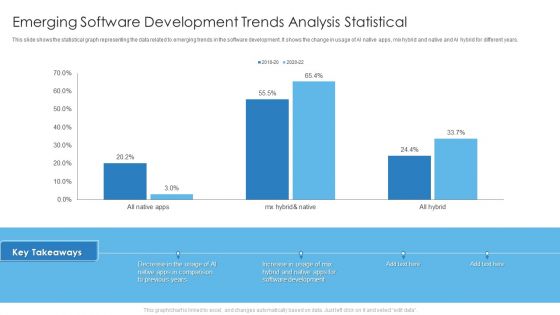
Emerging Software Development Trends Analysis Statistical Diagrams PDF
This slide shows the statistical graph representing the data related to emerging trends in the software development. It shows the change in usage of AI native apps, mix hybrid and native and AI hybrid for different years. Deliver and pitch your topic in the best possible manner with this Emerging Software Development Trends Analysis Statistical Diagrams PDF. Use them to share invaluable insights on Emerging Software Development, Trends Analysis Statistical and impress your audience. This template can be altered and modified as per your expectations. So, grab it now.
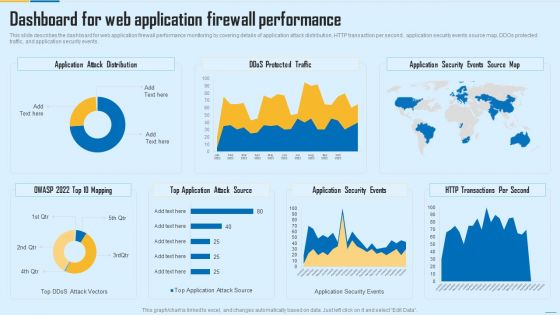
Dashboard For Web Application Firewall Performance WAF Platform Diagrams PDF
This slide describes the dashboard for web application firewall performance monitoring by covering details of application attack distribution, HTTP transaction per second, application security events source map, DDOs protected traffic, and application security events. Deliver an awe inspiring pitch with this creative Dashboard For Web Application Firewall Performance WAF Platform Diagrams PDF bundle. Topics like Application Attack Distribution, Application Security Events, Transactions Per Second can be discussed with this completely editable template. It is available for immediate download depending on the needs and requirements of the user.
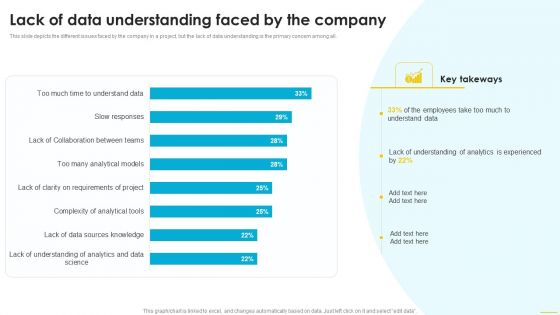
Lack Of Data Understanding Faced By The Company Diagrams PDF
This slide depicts the different issues faced by the company in a project, but the lack of data understanding is the primary concern among all. This modern and well arranged Lack Of Data Understanding Faced By The Company Diagrams PDF provides lots of creative possibilities. It is very simple to customize and edit with the Powerpoint Software. Just drag and drop your pictures into the shapes. All facets of this template can be edited with Powerpoint no extra software is necessary. Add your own material, put your images in the places assigned for them, adjust the colors, and then you can show your slides to the world, with an animated slide included.
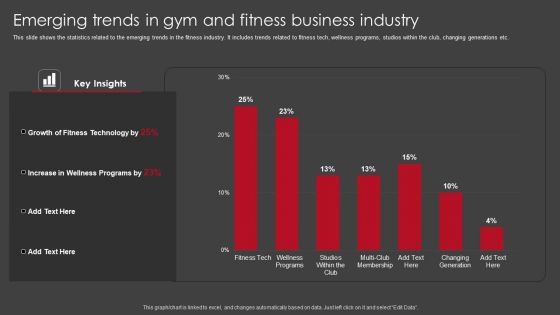
Emerging Trends In Gym And Fitness Business Industry Diagrams PDF
This slide shows the statistics related to the emerging trends in the fitness industry. It includes trends related to fitness tech, wellness programs, studios within the club, changing generations etc. Showcasing this set of slides titled Emerging Trends In Gym And Fitness Business Industry Diagrams PDF. The topics addressed in these templates are Emerging Trends In Gym, Fitness Business Industry. All the content presented in this PPT design is completely editable. Download it and make adjustments in color, background, font etc. as per your unique business setting.
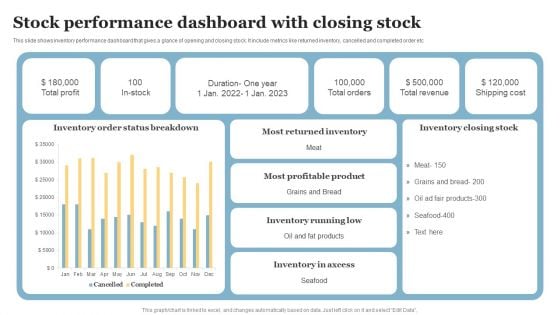
Stock Performance Dashboard With Closing Stock Diagrams PDF
This slide shows inventory performance dashboard that gives a glance of opening and closing stock. It include metrics like returned inventory, cancelled and completed order etc. Pitch your topic with ease and precision using this Stock Performance Dashboard With Closing Stock Diagrams PDF. This layout presents information on Most Returned Inventory, Most Profitable Product, Inventory Running Low. It is also available for immediate download and adjustment. So, changes can be made in the color, design, graphics or any other component to create a unique layout.
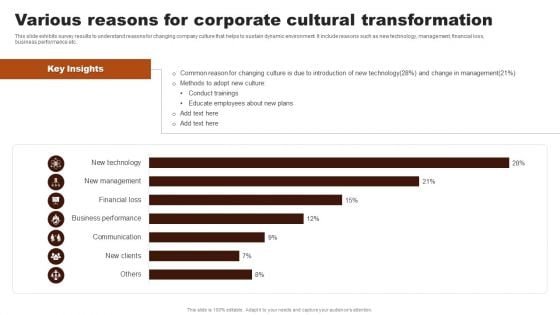
Various Reasons For Corporate Cultural Transformation Diagrams PDF
This slide exhibits survey results to understand reasons for changing company culture that helps to sustain dynamic environment. It include reasons such as new technology, management, financial loss, business performance etc. Showcasing this set of slides titled Various Reasons For Corporate Cultural Transformation Diagrams PDF. The topics addressed in these templates are Various Reasons Corporate, Cultural Transformation. All the content presented in this PPT design is completely editable. Download it and make adjustments in color, background, font etc. as per your unique business setting.
Data Structure IT Data Structure Performance Tracking Dashboard Diagrams PDF
Slidegeeks is here to make your presentations a breeze with Data Structure IT Data Structure Performance Tracking Dashboard Diagrams PDF With our easy-to-use and customizable templates, you can focus on delivering your ideas rather than worrying about formatting. With a variety of designs to choose from, youre sure to find one that suits your needs. And with animations and unique photos, illustrations, and fonts, you can make your presentation pop. So whether youre giving a sales pitch or presenting to the board, make sure to check out Slidegeeks first.
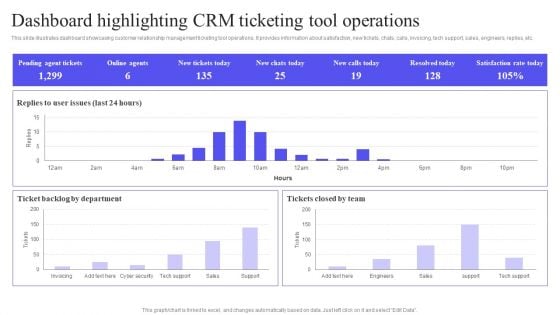
Dashboard Highlighting CRM Ticketing Tool Operations Diagrams PDF
This slide illustrates dashboard showcasing customer relationship management ticketing tool operations. It provides information about satisfaction, new tickets, chats, calls, invoicing, tech support, sales, engineers, replies, etc. Want to ace your presentation in front of a live audience Our Dashboard Highlighting CRM Ticketing Tool Operations Diagrams PDF can help you do that by engaging all the users towards you. Slidegeeks experts have put their efforts and expertise into creating these impeccable powerpoint presentations so that you can communicate your ideas clearly. Moreover, all the templates are customizable, and easy to edit and downloadable. Use these for both personal and commercial use.
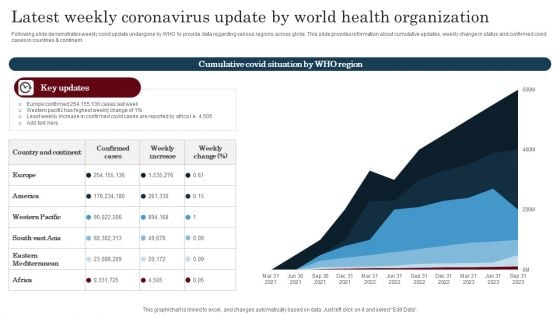
Latest Weekly Coronavirus Update By World Health Organization Diagrams PDF
Following slide highlights the top ten counties coronavirus data which helps community to evaluate current status and follow protocols. This slide includes country specific information such as total cases, death toll, recovered and active cases, etc. Showcasing this set of slides titled Latest Weekly Coronavirus Update By World Health Organization Diagrams PDF. The topics addressed in these templates are atest Weekly Coronavirus, Update, World Health Organization. All the content presented in this PPT design is completely editable. Download it and make adjustments in color, background, font etc. as per your unique business setting.
Multi Cloud Infrastructure Management Cloud Performance Tracking Dashboard Diagrams PDF
This slide covers the Key performance indicators for tracking performance of the cloud such as violations break down, sources, rules and severity. From laying roadmaps to briefing everything in detail, our templates are perfect for you. You can set the stage with your presentation slides. All you have to do is download these easy-to-edit and customizable templates. Multi Cloud Infrastructure Management Cloud Performance Tracking Dashboard Diagrams PDF will help you deliver an outstanding performance that everyone would remember and praise you for. Do download this presentation today.
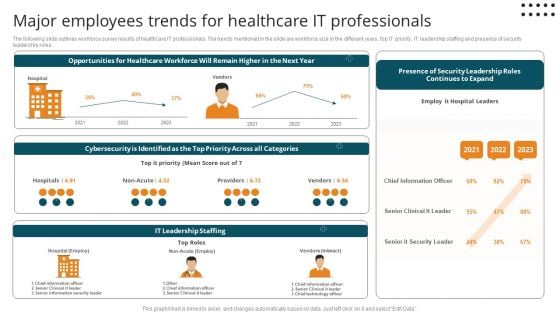
Major Employees Trends For Healthcare It Professionals Diagrams PDF
The following slide outlines workforce survey results of healthcare IT professionals. The trends mentioned in the slide are workforce size in the different years, top IT priority, IT leadership staffing and presence of security leadership roles.Pitch your topic with ease and precision using this Major Employees Trends For Healthcare It Professionals Diagrams PDF. This layout presents information on Cybersecurity Identified, Chief Information, Senior Clinical. It is also available for immediate download and adjustment. So, changes can be made in the color, design, graphics or any other component to create a unique layout.
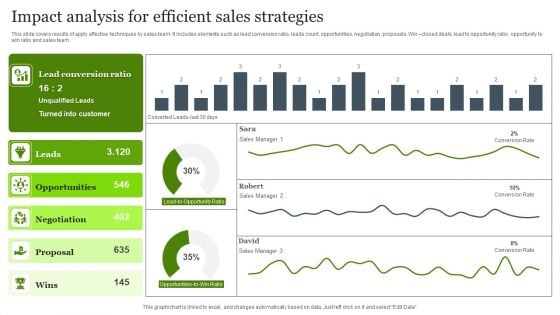
Impact Analysis For Efficient Sales Strategies Diagrams PDF
This slide covers results of apply effective techniques by sales team. It includes elements such as lead conversion ratio, leads count, opportunities, negotiation, proposals. Win closed deals, lead to opportunity ratio, opportunity to win ratio and sales team. Pitch your topic with ease and precision using this Impact Analysis For Efficient Sales Strategies Diagrams PDF. This layout presents information on Customer, Opportunities, Efficient Sales Strategies. It is also available for immediate download and adjustment. So, changes can be made in the color, design, graphics or any other component to create a unique layout.
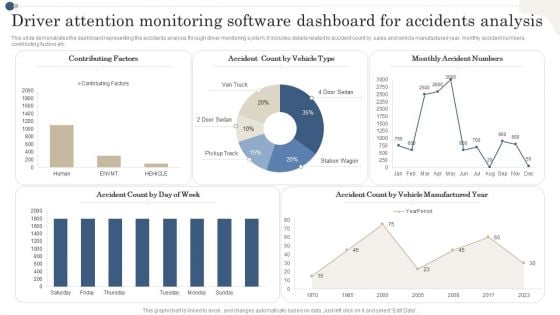
Driver Attention Monitoring Software Dashboard For Accidents Analysis Diagrams PDF
This slide demonstrates the dashboard representing the accidents analysis through driver monitoring system. It includes details related to accident count by sales and vehicle manufactured year, monthly accident numbers, contributing factors etc. Showcasing this set of slides titled Driver Attention Monitoring Software Dashboard For Accidents Analysis Diagrams PDF. The topics addressed in these templates are Contributing Factors,Vehicle Type, Monthly Accident Numbers. All the content presented in this PPT design is completely editable. Download it and make adjustments in color, background, font etc. as per your unique business setting.
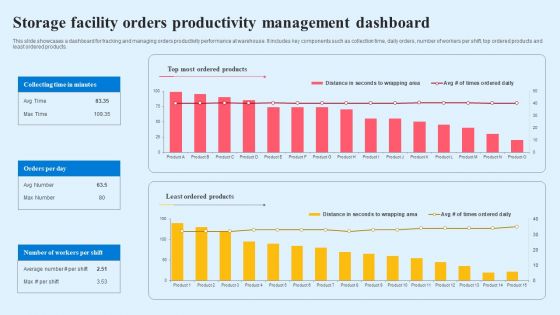
Storage Facility Orders Productivity Management Dashboard Diagrams PDF
This slide showcases a dashboard for tracking and managing orders productivity performance at warehouse. It includes key components such as collection time, daily orders, number of workers per shift, top ordered products and least ordered products. Showcasing this set of slides titled Storage Facility Orders Productivity Management Dashboard Diagrams PDF. The topics addressed in these templates are Top Most Ordered Products, Least Ordered Products, Orders Per Day. All the content presented in this PPT design is completely editable. Download it and make adjustments in color, background, font etc. as per your unique business setting.
Storage Facility Productivity Tracking And Management System Dashboard Diagrams PDF
This slide showcases a dashboard for managing and tracking warehouse productivity to optimize operational process. It includes key components such as user registered, subscribers request, orders, sales, transaction summary and top profiles. Showcasing this set of slides titled Storage Facility Productivity Tracking And Management System Dashboard Diagrams PDF. The topics addressed in these templates are Transaction Summary, Registered Users, Tracking Management. All the content presented in this PPT design is completely editable. Download it and make adjustments in color, background, font etc. as per your unique business setting.
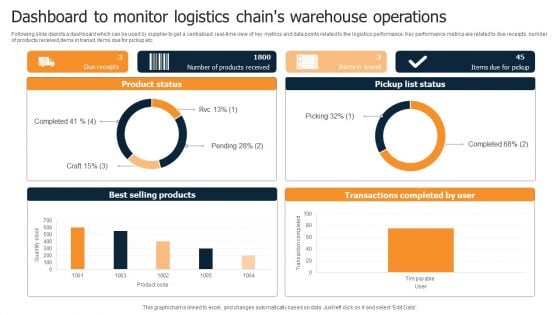
Dashboard To Monitor Logistics Chains Warehouse Operations Diagrams PDF
Following slide depicts a dashboard which can be used by supplier to get a centralized, real-time view of key metrics and data points related to the logistics performance. Key performance metrics are related to due receipts, number of products received,items in transit, items due for pickup etc. Pitch your topic with ease and precision using this Dashboard To Monitor Logistics Chains Warehouse Operations Diagrams PDF. This layout presents information on Product Status, Pickup List Status, Best Selling Products. It is also available for immediate download and adjustment. So, changes can be made in the color, design, graphics or any other component to create a unique layout.
Lead Tracking Metrics Dashboard With User Responses Diagrams PDF
This slide showcases dashboard for lead conversion metrics that can help organization to filter out total leads interested from the leads who have responded to the phone calls by organization. It also showcases key metrics such as leads busiest hours, leads busiest days, phone number types and lead types. Showcasing this set of slides titled Lead Tracking Metrics Dashboard With User Responses Diagrams PDF. The topics addressed in these templates are Busiest Hours Leads, Conversion Metrics, Lead Types. All the content presented in this PPT design is completely editable. Download it and make adjustments in color, background, font etc. as per your unique business setting.
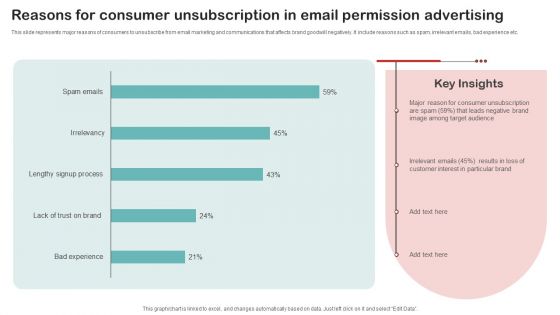
Reasons For Consumer Unsubscription In Email Permission Advertising Diagrams PDF
This slide represents major reasons of consumers to unsubscribe from email marketing and communications that affects brand goodwill negatively. It include reasons such as spam, irrelevant emails, bad experience etc. Pitch your topic with ease and precision using this Reasons For Consumer Unsubscription In Email Permission Advertising Diagrams PDF. This layout presents information on Irrelevant Emails, Customer Interest, Target Audience. It is also available for immediate download and adjustment. So, changes can be made in the color, design, graphics or any other component to create a unique layout.
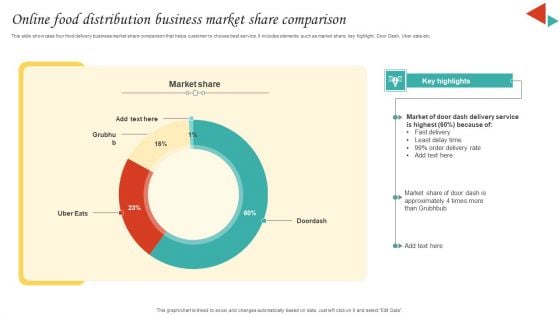
Online Food Distribution Business Market Share Comparison Diagrams PDF
This slide showcase four food delivery business market share comparison that helps customer to choose best service. It includes elements such as market share, key highlight, Door Dash, Uber eats etc. Showcasing this set of slides titled Online Food Distribution Business Market Share Comparison Diagrams PDF. The topics addressed in these templates are Market Share, Delivery Service, Least Delay Time. All the content presented in this PPT design is completely editable. Download it and make adjustments in color, background, font etc. as per your unique business setting.
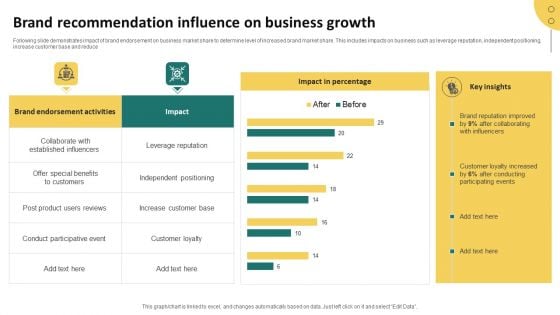
Brand Recommendation Influence On Business Growth Diagrams PDF
Following slide demonstrates impact of brand endorsement on business market share to determine level of increased brand market share. This includes impacts on business such as leverage reputation, independent positioning, increase customer base and reduce. Pitch your topic with ease and precision using this Brand Recommendation Influence On Business Growth Diagrams PDF. This layout presents information on Leverage Reputation, Independent Positioning, Increase Customer Base, Customer Loyalty. It is also available for immediate download and adjustment. So, changes can be made in the color, design, graphics or any other component to create a unique layout.
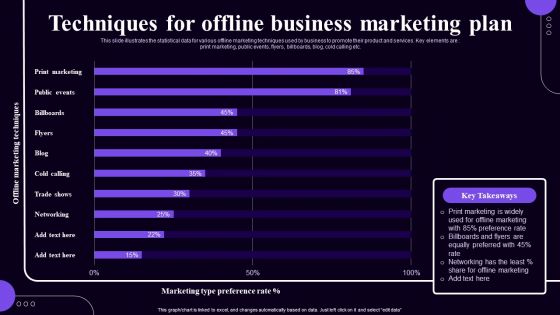
Techniques For Offline Business Marketing Plan Diagrams PDF
This slide illustrates the statistical data for various offline marketing techniques used by business to promote their product and services. Key elements are print marketing, public events, flyers, billboards, blog, cold calling etc. Showcasing this set of slides titled Techniques For Offline Business Marketing Plan Diagrams PDF. The topics addressed in these templates are Print Marketing, Public Events, Billboards. All the content presented in this PPT design is completely editable. Download it and make adjustments in color, background, font etc. as per your unique business setting.
Rebranding Procedure Summary Rebranding Project Progress Tracking Dashboard Diagrams PDF
This slide provides information regarding essential characteristics of co-branding in terms of strategic partnership, build credibility, developing marketing strategy, develop innovation and value addition, etc. This modern and well arranged Rebranding Procedure Summary Rebranding Project Progress Tracking Dashboard Diagrams PDF provides lots of creative possibilities. It is very simple to customize and edit with the Powerpoint Software. Just drag and drop your pictures into the shapes. All facets of this template can be edited with Powerpoint no extra software is necessary. Add your own material, put your images in the places assigned for them, adjust the colors, and then you can show your slides to the world, with an animated slide included.
Ad Campaign Performance Indicators Tracking Dashboard Diagrams PDF
This slide covers dashboard to measure the performance of ad campaigns on LinkedIn platform. The purpose of this template is to provide the company an overview on the outcomes of running ad campaigns on LinkedIn. It includes performance based on impressions, CTR, engagement rates, CPC, CPM, etc. Find a pre designed and impeccable Ad Campaign Performance Indicators Tracking Dashboard Diagrams PDF. The templates can ace your presentation without additional effort. You can download these easy to edit presentation templates to make your presentation stand out from others. So, what are you waiting for Download the template from Slidegeeks today and give a unique touch to your presentation.
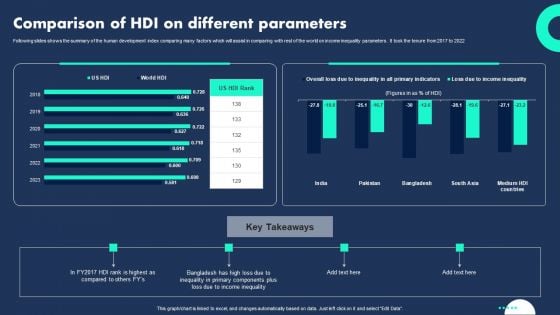
Comparison Of HDI On Different Parameters Diagrams PDF
Following slides shows the summary of the human development index comparing many factors which will assist in comparing with rest of the world on income inequality parameters . It took the tenure from 2017 to 2022. Showcasing this set of slides titled Comparison Of HDI On Different Parameters Diagrams PDF. The topics addressed in these templates are Inequality Primary Components, Plus Loss Income Inequality, Different Parameters . All the content presented in this PPT design is completely editable. Download it and make adjustments in color, background, font etc. as per your unique business setting.
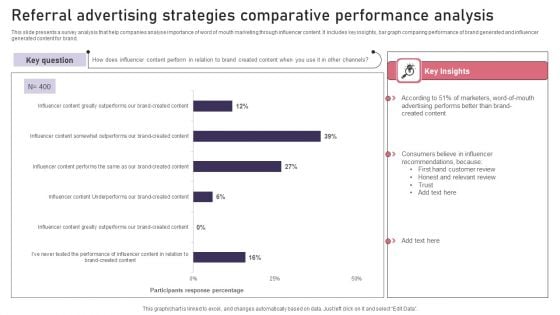
Referral Advertising Strategies Comparative Performance Analysis Diagrams PDF
This slide presents a survey analysis that help companies analyse importance of word of mouth marketing through influencer content. It includes key insights, bar graph comparing performance of brand generated and influencer generated content for brand. Showcasing this set of slides titled Referral Advertising Strategies Comparative Performance Analysis Diagrams PDF. The topics addressed in these templates are Referral Advertising, Strategies Comparative, Performance Analysis. All the content presented in this PPT design is completely editable. Download it and make adjustments in color, background, font etc. as per your unique business setting.
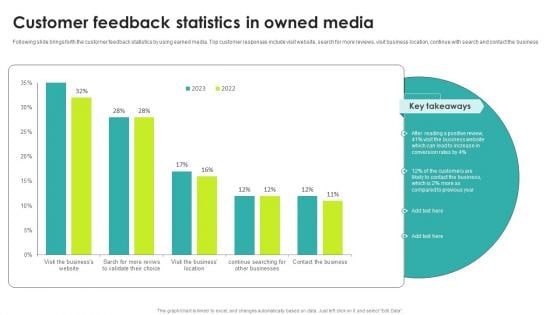
Customer Feedback Statistics In Owned Media Diagrams PDF
Following slide brings forth the customer feedback statistics by using earned media. Top customer responses include visit website, search for more reviews, visit business location, continue with search and contact the business Pitch your topic with ease and precision using this Customer Feedback Statistics In Owned Media Diagrams PDF. This layout presents information on Key Takeaways, Media, Customer. It is also available for immediate download and adjustment. So, changes can be made in the color, design, graphics or any other component to create a unique layout.

Houses And Percentage Symbol Business Real Estate PowerPoint Templates And PowerPoint Themes 1112
Houses And Percentage Symbol Business Real Estate PowerPoint Templates And PowerPoint Themes 1112-The above template displays a diagram of many houses and percent symbol in center. This image clearly defines the concept of discount, investment and architecture. It is a useful captivating tool conceived to enable you to define your message in your Business PPT presentations on construction and real estate. The structure of our templates allows you to effectively highlight the key issues concerning the growth of your business.-Houses And Percentage Symbol Business Real Estate PowerPoint Templates And PowerPoint Themes 1112-This PowerPoint template can be used for presentations relating to-House and percent symbol, Business, Symbol, Finance, Marketing, Real estate Catch the bus with our Houses And Percentage Symbol Business Real Estate PowerPoint Templates And PowerPoint Themes 1112. Climb aboard for a dream ride.
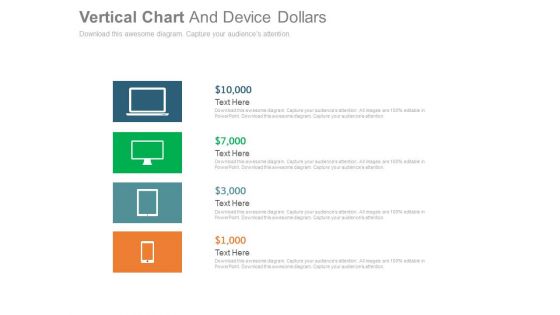
Computer Development And Generation Chart Powerpoint Slides
This PPT slide displays graphics of computer devices. Use this PPT design to display technology development and generation. This PowerPoint template can be customized as per requirements of business education or any other theme.
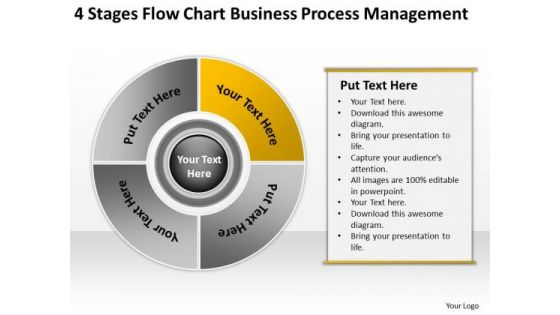
Business PowerPoint Templates Process Management What Is Plan Slides
We present our business powerpoint templates process management what is plan Slides.Download and present our Finance PowerPoint Templates because You aspire to touch the sky with glory. Let our PowerPoint Templates and Slides provide the fuel for your ascent. Download our Marketing PowerPoint Templates because Our PowerPoint Templates and Slides are designed to help you succeed. They have all the ingredients you need. Present our Business PowerPoint Templates because You can Channelise the thoughts of your team with our PowerPoint Templates and Slides. Urge them to focus on the goals you have set. Download our Circle Charts PowerPoint Templates because Timeline crunches are a fact of life. Meet all deadlines using our PowerPoint Templates and Slides. Use our Process and Flows PowerPoint Templates because Our PowerPoint Templates and Slides are focused like a searchlight beam. They highlight your ideas for your target audience.Use these PowerPoint slides for presentations relating to Chart, wheel, pie, graph, vector, process, marketing, diagram, business, catalog, website, network, statistics, model, document, junction, plan, presentation, template, circle, brochure, data, stock, management, box, options, direction, design, company, navigation, financial, structure, button, goals, results. The prominent colors used in the PowerPoint template are Yellow, Black, Gray. Our Business PowerPoint Templates Process Management What Is Plan Slides will ensure your ideas are noticed. You will be glad you tried us out.
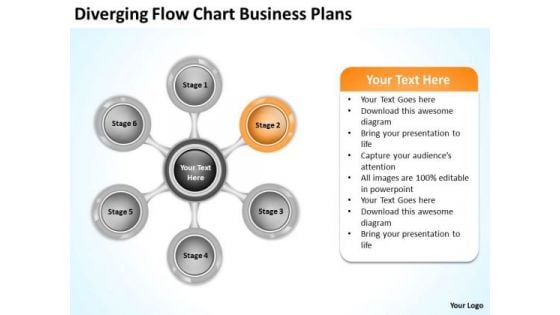
PowerPoint Presentation Plans 6 Stages Business Development Template Slides
We present our powerpoint presentation plans 6 stages business development template Slides.Use our Communication PowerPoint Templates because Our PowerPoint Templates and Slides will weave a web of your great ideas. They are gauranteed to attract even the most critical of your colleagues. Present our Finance PowerPoint Templates because Our PowerPoint Templates and Slides are aesthetically designed to attract attention. We gaurantee that they will grab all the eyeballs you need. Download our Business PowerPoint Templates because Our PowerPoint Templates and Slides will let Your superior ideas hit the target always and everytime. Download and present our Circle Charts PowerPoint Templates because Our PowerPoint Templates and Slides provide you with a vast range of viable options. Select the appropriate ones and just fill in your text. Download our Process and Flows PowerPoint Templates because Our PowerPoint Templates and Slides will steer your racing mind. Hit the right buttons and spur on your audience.Use these PowerPoint slides for presentations relating to Process, Chart, Diagram, Flow, Important, Flowchart, Data, Connection, Connect, Connectivity, Organization, Business, Teamwork, Graphical, Graph, Steps, Design, Corporate, Plan, Concept, Arrow, TierRelation, Ladder, Administration, Group, Color, Highlight, Organize, Manager, Office, Financial. The prominent colors used in the PowerPoint template are Orange, Gray, Black. Counsel them well with our PowerPoint Presentation Plans 6 Stages Business Development Template Slides. Help them absorb your advice.
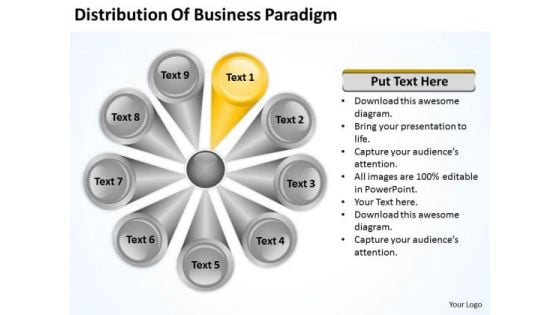
PowerPoint Templates Paradigm 9 Stages Ppt Business Plan Model
We present our powerpoint templates paradigm 9 stages ppt business plan model.Download our Communication PowerPoint Templates because You can Stir your ideas in the cauldron of our PowerPoint Templates and Slides. Cast a magic spell on your audience. Use our Finance PowerPoint Templates because It can be used to Set your controls for the heart of the sun. Our PowerPoint Templates and Slides will be the propellant to get you there. Download and present our Business PowerPoint Templates because It is Aesthetically crafted by artistic young minds. Our PowerPoint Templates and Slides are designed to display your dexterity. Download and present our Circle Charts PowerPoint Templates because You can Create a matrix with our PowerPoint Templates and Slides. Feel the strength of your ideas click into place. Download and present our Process and Flows PowerPoint Templates because Our PowerPoint Templates and Slides will let you Illuminate the road ahead to Pinpoint the important landmarks along the way.Use these PowerPoint slides for presentations relating to Process, Chart, Diagram, Flow, Important, Flowchart, Data, Connection, Connect, Connectivity, Organization, Business, Teamwork, Graphical, Graph, Steps, Design, Corporate, Plan, Concept, Arrow, TierRelation, Ladder, Administration, Group, Color, Highlight, Organize, Manager, Office, Financial. The prominent colors used in the PowerPoint template are Yellow, Gray, Black. Improve the visual apprearance of your presentation with our PowerPoint Templates Paradigm 9 Stages Ppt Business Plan Model. Make sure your presentation gets the attention it deserves.
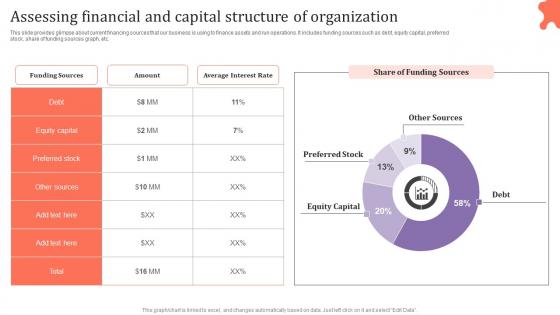
Assessing Financial And Capital Structure Assessing Corporate Financial Techniques Elements Pdf
This slide provides glimpse about current financing sources that our business is using to finance assets and run operations. It includes funding sources such as debt, equity capital, preferred stock, share of funding sources graph, etc. Slidegeeks is here to make your presentations a breeze with Assessing Financial And Capital Structure Assessing Corporate Financial Techniques Elements Pdf With our easy to use and customizable templates, you can focus on delivering your ideas rather than worrying about formatting. With a variety of designs to choose from, you are sure to find one that suits your needs. And with animations and unique photos, illustrations, and fonts, you can make your presentation pop. So whether you are giving a sales pitch or presenting to the board, make sure to check out Slidegeeks first This slide provides glimpse about current financing sources that our business is using to finance assets and run operations. It includes funding sources such as debt, equity capital, preferred stock, share of funding sources graph, etc.

Odd Pricing Strategy Ppt PowerPoint Presentation Complete Deck With Slides
This Odd Pricing Strategy Ppt PowerPoint Presentation Complete Deck With Slides acts as backup support for your ideas, vision, thoughts, etc. Use it to present a thorough understanding of the topic. This PPT slideshow can be utilized for both in-house and outside presentations depending upon your needs and business demands. Entailing Eighteen slides with a consistent design and theme, this template will make a solid use case. As it is intuitively designed, it suits every business vertical and industry. All you have to do is make a few tweaks in the content or any other component to design unique presentations. The biggest advantage of this complete deck is that it can be personalized multiple times once downloaded. The color, design, shapes, and other elements are free to modify to add personal touches. You can also insert your logo design in this PPT layout. Therefore a well-thought and crafted presentation can be delivered with ease and precision by downloading this Odd Pricing Strategy Ppt PowerPoint Presentation Complete Deck With Slides PPT slideshow.
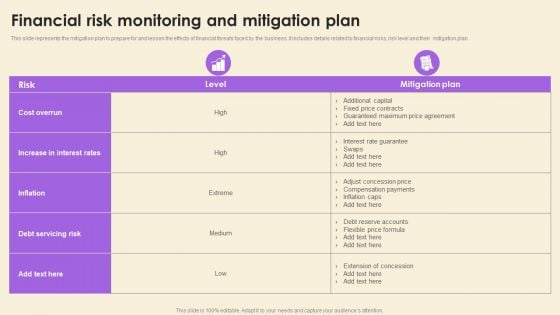
Operational Risk Assessment And Management Plan Financial Risk Monitoring And Mitigation Plan Template PDF
This slide represents the mitigation plan to prepare for and lessen the effects of financial threats faced by the business. It includes details related to financial risks, risk level and their mitigation plan. If you are looking for a format to display your unique thoughts, then the professionally designed Operational Risk Assessment And Management Plan Financial Risk Monitoring And Mitigation Plan Template PDF is the one for you. You can use it as a Google Slides template or a PowerPoint template. Incorporate impressive visuals, symbols, images, and other charts. Modify or reorganize the text boxes as you desire. Experiment with shade schemes and font pairings. Alter, share or cooperate with other people on your work. Download Operational Risk Assessment And Management Plan Financial Risk Monitoring And Mitigation Plan Template PDF and find out how to give a successful presentation. Present a perfect display to your team and make your presentation unforgettable.
Erp Management Dashboard For Tracking Gross Erp And Digital Transformation For Maximizing DT SS V
This slide presents a ERP integrated finance monitoring dashboard that helps in tracking gross and net profit margin of business. It monitors KPIs such as balance, quick ratio, current ratio, total income, total expenses, accounts payable.Here you can discover an assortment of the finest PowerPoint and Google Slides templates. With these templates, you can create presentations for a variety of purposes while simultaneously providing your audience with an eye-catching visual experience. Download Erp Management Dashboard For Tracking Gross Erp And Digital Transformation For Maximizing DT SS V to deliver an impeccable presentation. These templates will make your job of preparing presentations much quicker, yet still, maintain a high level of quality. Slidegeeks has experienced researchers who prepare these templates and write high-quality content for you. Later on, you can personalize the content by editing the Erp Management Dashboard For Tracking Gross Erp And Digital Transformation For Maximizing DT SS V. This slide presents a ERP integrated finance monitoring dashboard that helps in tracking gross and net profit margin of business. It monitors KPIs such as balance, quick ratio, current ratio, total income, total expenses, accounts payable.
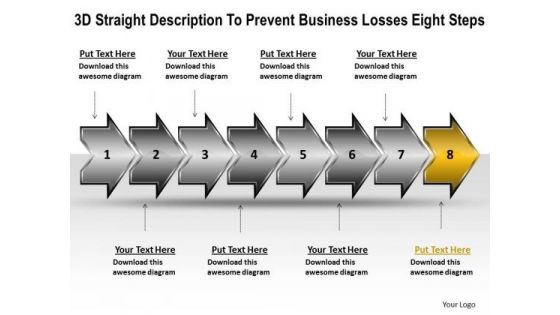
Business PowerPoint Presentation Losses Eight Steps Flow Chart Slides
We present our business powerpoint presentation losses eight steps flow chart Slides.Download our Finance PowerPoint Templates because they represent the proress in our lives. Download our Business PowerPoint Templates because watch the excitement levels rise as they realise their worth. Download our Process and Flows PowerPoint Templates because it demonstrates to your audience how the best and most refined ideas pass through. Present our Arrows PowerPoint Templates because you can Educate your listeners on the means to keep it ticking over. Present our Shapes PowerPoint Templates because this diagram depicts the essence of this chain reaction like sequence of events.Use these PowerPoint slides for presentations relating to 3d, Abstract, Around, Arrows, Business, Center, Circle, Circular, Concept, Connections, Curve, Cycle, Directions, Distribution, Illustration, Management, Middle, Objects, Plan, Process, Recycle, Rounded, Shadows, Space, System. The prominent colors used in the PowerPoint template are Yellow, Gray, Black. People tell us our business powerpoint presentation losses eight steps flow chart Slides provide great value for your money. Be assured of finding the best projection to highlight your words. PowerPoint presentation experts tell us our Circle PowerPoint templates and PPT Slides are Lush. Presenters tell us our business powerpoint presentation losses eight steps flow chart Slides are Nifty. The feedback we get is that our Circle PowerPoint templates and PPT Slides are Multicolored. You can be sure our business powerpoint presentation losses eight steps flow chart Slides are Romantic. Professionals tell us our Center PowerPoint templates and PPT Slides are Elegant. Fulfill aspirations with our Business PowerPoint Presentation Losses Eight Steps Flow Chart Slides. Cater to all your clients fancy demands.
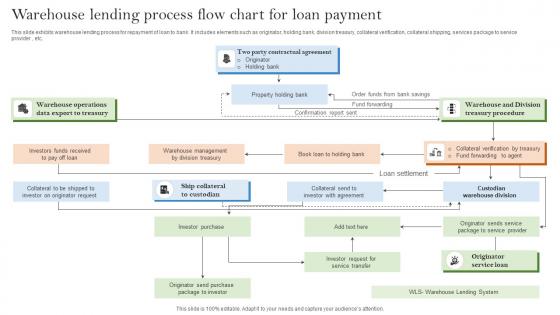
Warehouse Lending Process Flow Chart For Loan Payment Slides Pdf
This slide exhibits warehouse lending process for repayment of loan to bank. It includes elements such as originator, holding bank, division treasury, collateral verification, collateral shipping, services package to service provider , etc. Pitch your topic with ease and precision using this Warehouse Lending Process Flow Chart For Loan Payment Slides Pdf. This layout presents information on Custodian Warehouse Division, Originator Service Loan, Service Transfer. It is also available for immediate download and adjustment. So, changes can be made in the color, design, graphics or any other component to create a unique layout. This slide exhibits warehouse lending process for repayment of loan to bank. It includes elements such as originator, holding bank, division treasury, collateral verification, collateral shipping, services package to service provider , etc.
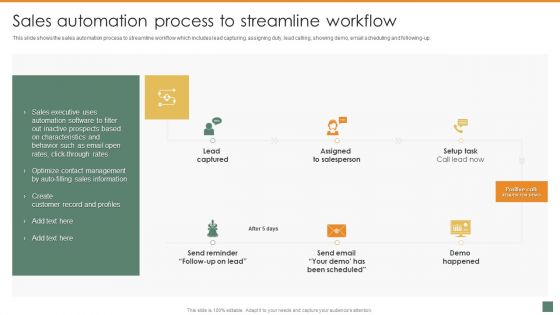
Sales Automation Process To Streamline Workflow Summary And Significance Of Sales Automation Diagrams PDF
This slide shows the sales automation process to streamline workflow which includes lead capturing, assigning duty, lead calling, showing demo, email scheduling and following up. The best PPT templates are a great way to save time, energy, and resources. Slidegeeks have 100 percent editable powerpoint slides making them incredibly versatile. With these quality presentation templates, you can create a captivating and memorable presentation by combining visually appealing slides and effectively communicating your message. Download Sales Automation Process To Streamline Workflow Summary And Significance Of Sales Automation Diagrams PDF from Slidegeeks and deliver a wonderful presentation.
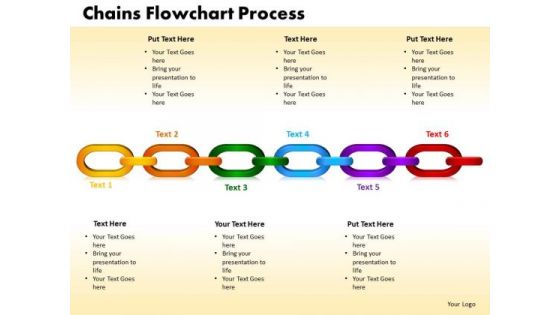
PowerPoint Themes Chains Flowchart Process Company Ppt Slide
PowerPoint Themes Chains Flowchart Process Company PPT Slide-This is a very simple Chain Flow Chart Diagram. It can be used to express ideas, logical chains, or organizational hierarchies.-PowerPoint Themes Chains Flowchart Process Company PPT Slide Operate efficiently with our PowerPoint Themes Chains Flowchart Process Company Ppt Slide. Download without worries with our money back guaranteee.

Project Management Business Mind Map Chart Ppt Plan PowerPoint Slides
We present our project management business mind map chart ppt plan PowerPoint Slides.Download our Business PowerPoint Templates because You canTake a leap off the starting blocks with our PowerPoint Templates and Slides. They will put you ahead of the competition in quick time. Download our Marketing PowerPoint Templates because Our PowerPoint Templates and Slides will embellish your thoughts. See them provide the desired motivation to your team. Download and present our Flow Charts PowerPoint Templates because You can Be the star of the show with our PowerPoint Templates and Slides. Rock the stage with your ideas. Use our Shapes PowerPoint Templates because Our PowerPoint Templates and Slides will give good value for money. They also have respect for the value of your time. Download and present our Process and Flows PowerPoint Templates because It can Leverage your style with our PowerPoint Templates and Slides. Charm your audience with your ability.Use these PowerPoint slides for presentations relating to 3d, mapping, flow, chart, process, business, diagram, network, layout, corporate, plan, presentation, circle, brochure, description, marketing, relation, management, creative, connection, strategy, catalog, contact, design, connect, link, progress, part, conceptual, goals. The prominent colors used in the PowerPoint template are Blue, Gray, Blue light. Our Project Management Business Mind Map Chart Ppt Plan PowerPoint Slides provide a common thread. Stitch all different factions together.
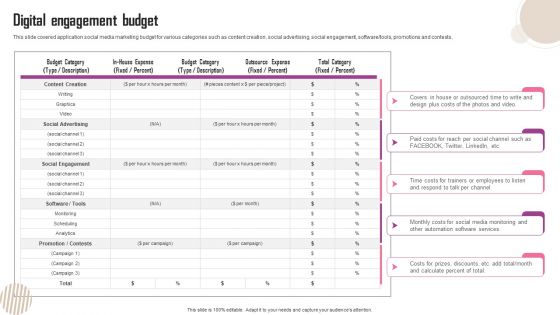
Digital Engagement Budget Ppt Infographic Template Styles PDF
This slide covered application social media marketing budget for various categories such as content creation, social advertising, social engagement, software or tools, promotions and contests. Do you know about Slidesgeeks Digital Engagement Budget Ppt Infographic Template Styles PDF These are perfect for delivering any kind od presentation. Using it, create PowerPoint presentations that communicate your ideas and engage audiences. Save time and effort by using our pre designed presentation templates that are perfect for a wide range of topic. Our vast selection of designs covers a range of styles, from creative to business, and are all highly customizable and easy to edit. Download as a PowerPoint template or use them as Google Slides themes.
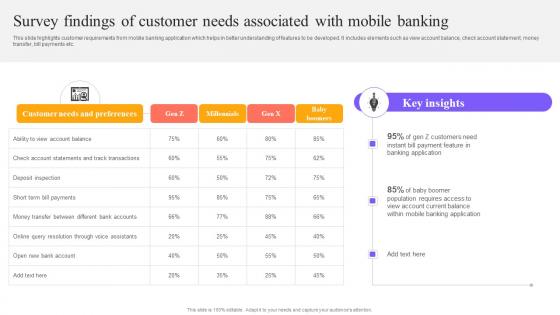
Digital Approach To Client Survey Findings Of Customer Needs Associated With Mobile Banking
This slide highlights customer requirements from mobile banking application which helps in better understanding of features to be developed. It includes elements such as view account balance, check account statement, money transfer, bill payments etc. Are you searching for a Digital Approach To Client Survey Findings Of Customer Needs Associated With Mobile Banking that is uncluttered, straightforward, and original Its easy to edit, and you can change the colors to suit your personal or business branding. For a presentation that expresses how much effort you have put in, this template is ideal With all of its features, including tables, diagrams, statistics, and lists, its perfect for a business plan presentation. Make your ideas more appealing with these professional slides. Download Digital Approach To Client Survey Findings Of Customer Needs Associated With Mobile Banking from Slidegeeks today. This slide highlights customer requirements from mobile banking application which helps in better understanding of features to be developed. It includes elements such as view account balance, check account statement, money transfer, bill payments etc.
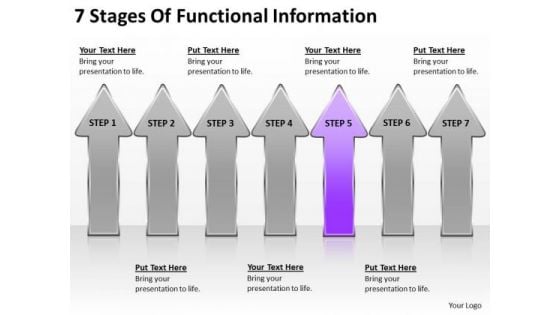
7 Stages Of Functional Information Security Business Plan PowerPoint Slides
We present our 7 stages of functional information security business plan PowerPoint Slides .Download and present our Arrows PowerPoint Templates because Our PowerPoint Templates and Slides will provide you a launch platform. Give a lift off to your ideas and send them into orbit. Present our Business PowerPoint Templates because Our PowerPoint Templates and Slides will bullet point your ideas. See them fall into place one by one. Download our Marketing PowerPoint Templates because Our PowerPoint Templates and Slides will give good value for money. They also have respect for the value of your time. Present our Process and Flows PowerPoint Templates because Our PowerPoint Templates and Slides will help you be quick off the draw. Just enter your specific text and see your points hit home. Download and present our Flow Charts PowerPoint Templates because It will mark the footprints of your journey. Illustrate how they will lead you to your desired destination.Use these PowerPoint slides for presentations relating to Abstract, arrows, balance, business, chart, company, concept, data, diagram, document, finance, financial, report, graph, market, marketing, price, profit, report, statistics, stock, success, trade, work. The prominent colors used in the PowerPoint template are Purple, White, Gray. Presenters tell us our 7 stages of functional information security business plan PowerPoint Slides are designed by professionals Customers tell us our business PowerPoint templates and PPT Slides are designed by professionals Professionals tell us our 7 stages of functional information security business plan PowerPoint Slides help you meet deadlines which are an element of today's workplace. Just browse and pick the slides that appeal to your intuitive senses. Professionals tell us our concept PowerPoint templates and PPT Slides will impress their bosses and teams. Presenters tell us our 7 stages of functional information security business plan PowerPoint Slides are designed by a team of presentation professionals. People tell us our balance PowerPoint templates and PPT Slides will save the presenter time. Ask any favour of our 7 Stages Of Functional Information Security Business Plan PowerPoint Slides. You will find them truly accomodating.
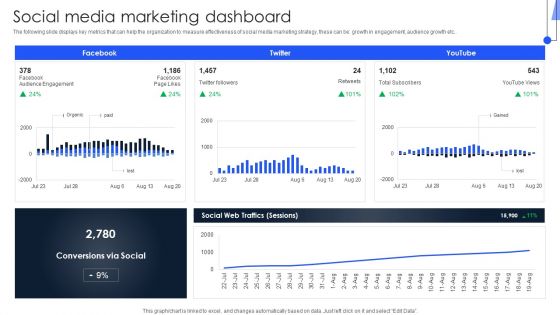
Implementing Marketing Strategies Social Media Marketing Dashboard Diagrams PDF
The following slide displays key metrics that can help the organization to measure effectiveness of social media marketing strategy, these can be growth in engagement, audience growth etc. Slidegeeks is here to make your presentations a breeze with Implementing Marketing Strategies Social Media Marketing Dashboard Diagrams PDF With our easy-to-use and customizable templates, you can focus on delivering your ideas rather than worrying about formatting. With a variety of designs to choose from, youre sure to find one that suits your needs. And with animations and unique photos, illustrations, and fonts, you can make your presentation pop. So whether youre giving a sales pitch or presenting to the board, make sure to check out Slidegeeks first.
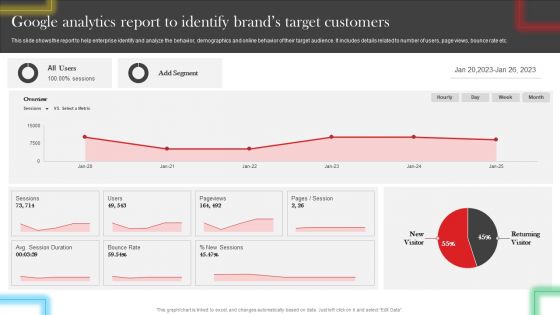
Google Analytics Report To Identify Brands Target Customers Diagrams PDF
This slide shows the report to help enterprise identify and analyze the behavior, demographics and online behavior of their target audience. It includes details related to number of users, page views, bounce rate etc. Present like a pro with Google Analytics Report To Identify Brands Target Customers Diagrams PDF Create beautiful presentations together with your team, using our easy-to-use presentation slides. Share your ideas in real-time and make changes on the fly by downloading our templates. So whether you are in the office, on the go, or in a remote location, you can stay in sync with your team and present your ideas with confidence. With Slidegeeks presentation got a whole lot easier. Grab these presentations today.
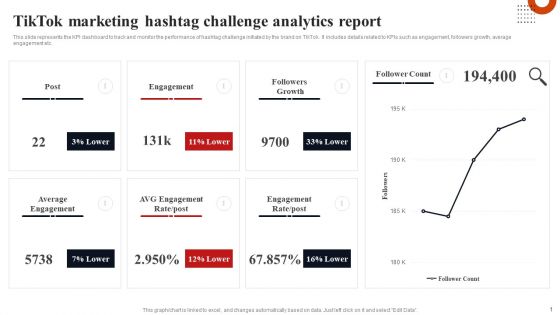
Tiktok Marketing Hashtag Challenge Analytics Report Diagrams PDF
This slide represents the KPI dashboard to track and monitor the performance of hashtag challenge initiated by the brand on TikTok. It includes details related to KPIs such as engagement, followers growth, average engagement etc. This modern and well arranged Tiktok Marketing Hashtag Challenge Analytics Report Diagrams PDF provides lots of creative possibilities. It is very simple to customize and edit with the Powerpoint Software. Just drag and drop your pictures into the shapes. All facets of this template can be edited with Powerpoint no extra software is necessary. Add your own material, put your images in the places assigned for them, adjust the colors, and then you can show your slides to the world, with an animated slide included.
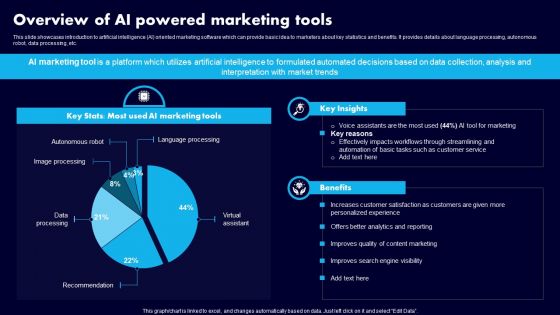
Overview Of AI Powered Marketing Tools Ppt Outline Diagrams PDF
This slide showcases introduction to artificial intelligence AI oriented marketing software which can provide basic idea to marketers about key statistics and benefits. It provides details about language processing, autonomous robot, data processing, etc. The Overview Of AI Powered Marketing Tools Ppt Outline Diagrams PDF is a compilation of the most recent design trends as a series of slides. It is suitable for any subject or industry presentation, containing attractive visuals and photo spots for businesses to clearly express their messages. This template contains a variety of slides for the user to input data, such as structures to contrast two elements, bullet points, and slides for written information. Slidegeeks is prepared to create an impression.
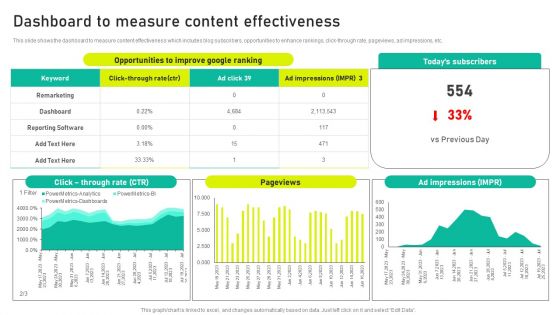
Dashboard To Measure Content Effectiveness Ppt Ideas Diagrams PDF
This slide shows the dashboard to measure content effectiveness which includes blog subscribers, opportunities to enhance rankings, click-through rate, pageviews, ad impressions, etc. Coming up with a presentation necessitates that the majority of the effort goes into the content and the message you intend to convey. The visuals of a PowerPoint presentation can only be effective if it supplements and supports the story that is being told. Keeping this in mind our experts created Dashboard To Measure Content Effectiveness Ppt Ideas Diagrams PDF to reduce the time that goes into designing the presentation. This way, you can concentrate on the message while our designers take care of providing you with the right template for the situation.
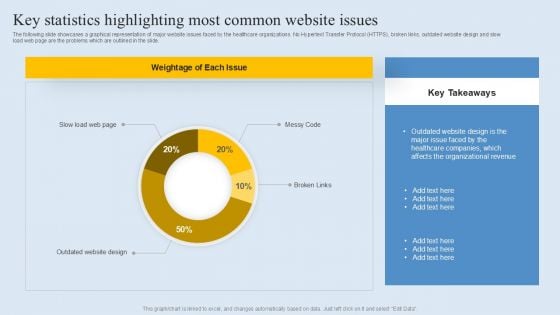
Key Statistics Highlighting Most Common Website Issues Diagrams PDF
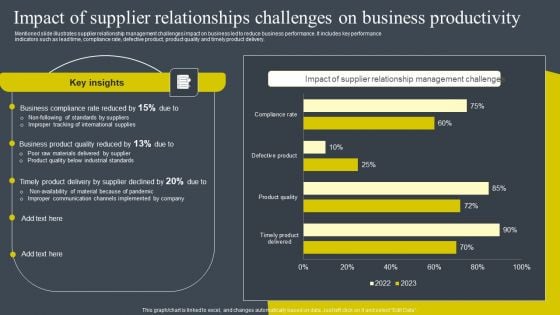
Impact Of Supplier Relationships Challenges On Business Productivity Diagrams PDF
Mentioned slide illustrates supplier relationship management challenges impact on business led to reduce business performance. It includes key performance indicators such as lead time, compliance rate, defective product, product quality and timely product delivery. The Impact Of Supplier Relationships Challenges On Business Productivity Diagrams PDF is a compilation of the most recent design trends as a series of slides. It is suitable for any subject or industry presentation, containing attractive visuals and photo spots for businesses to clearly express their messages. This template contains a variety of slides for the user to input data, such as structures to contrast two elements, bullet points, and slides for written information. Slidegeeks is prepared to create an impression.
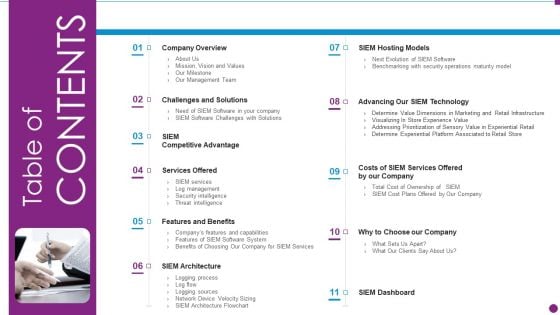
Security Information And Event Management Strategies For Financial Audit And Compliance Table Of Contents Diagrams PDF
This is a security information and event management strategies for financial audit and compliance table of contents diagrams pdf template with various stages. Focus and dispense information on eleven stages using this creative set, that comes with editable features. It contains large content boxes to add your information on topics like company overview, challenges and solutions, services offered, features and benefits, siem architecture. You can also showcase facts, figures, and other relevant content using this PPT layout. Grab it now.
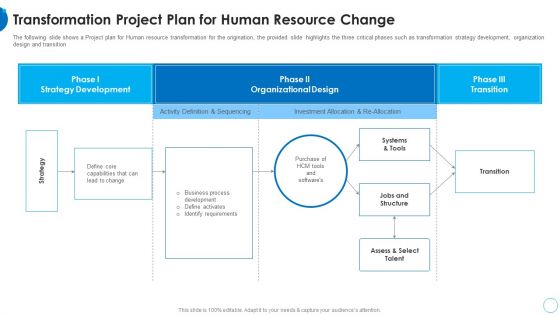
Transformation Project Plan For Human Resource Change HR Change Management Tools Pictures PDF
The following slide shows a Project plan for Human resource transformation for the origination, the provided slide highlights the three critical phases such as transformation strategy development, organization design and transition Deliver an awe inspiring pitch with this creative transformation project plan for human resource change hr change management tools pictures pdf bundle. Topics like business process, organizational design, strategy development, requirements can be discussed with this completely editable template. It is available for immediate download depending on the needs and requirements of the user.
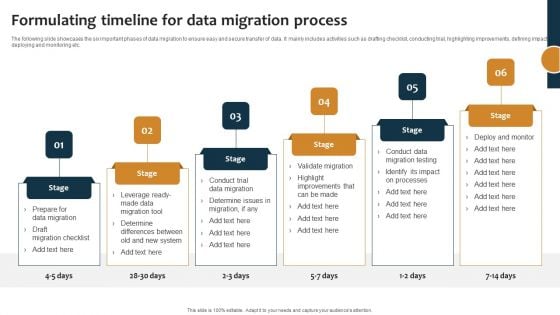
Improving Business Procedures Enterprise Resource Planning System Formulating Timeline For Data Migration Topics PDF
The following slide showcases the six important phases of data migration to ensure easy and secure transfer of data. It mainly includes activities such as drafting checklist, conducting trial, highlighting improvements, defining impact, deploying and monitoring etc. The best PPT templates are a great way to save time, energy, and resources. Slidegeeks have 100 percent editable powerpoint slides making them incredibly versatile. With these quality presentation templates, you can create a captivating and memorable presentation by combining visually appealing slides and effectively communicating your message. Download Improving Business Procedures Enterprise Resource Planning System Formulating Timeline For Data Migration Topics PDF from Slidegeeks and deliver a wonderful presentation.
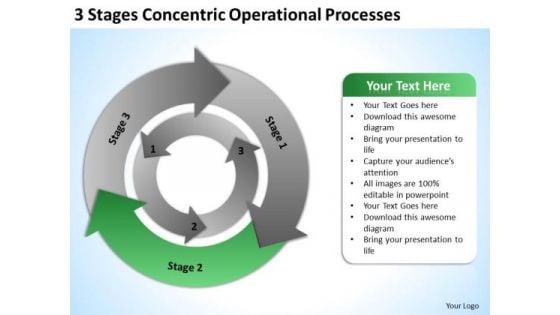
3 Stages Concentric Operational Processes Business Plan For PowerPoint Slides
We present our 3 stages concentric operational processes business plan for PowerPoint Slides.Download our Finance PowerPoint Templates because Our PowerPoint Templates and Slides will Embellish your thoughts. They will help you illustrate the brilliance of your ideas. Download our Communication PowerPoint Templates because You are working at that stage with an air of royalty. Let our PowerPoint Templates and Slides be the jewels in your crown. Download our Arrows PowerPoint Templates because You are well armed with penetrative ideas. Our PowerPoint Templates and Slides will provide the gunpowder you need. Present our Business PowerPoint Templates because Our PowerPoint Templates and Slides will embellish your thoughts. See them provide the desired motivation to your team. Present our Circle Charts PowerPoint Templates because Our PowerPoint Templates and Slides are specially created by a professional team with vast experience. They diligently strive to come up with the right vehicle for your brilliant Ideas. Use these PowerPoint slides for presentations relating to Advertise, around, arrow, brand, business, chart, circle, collective, communication, concentric, concept, diagram, direction, financial, flow, flowchart, graphic element, grunge, loop, motion, movement, object, old, operation, organization, pie, presentation, process, production, relationship, repetitive, rotation, round, sequence, step, system, teamwork, wheel. The prominent colors used in the PowerPoint template are Green, Gray, Black. With our 3 Stages Concentric Operational Processes Business Plan For PowerPoint Slides you won't play second fiddle. They help you dominate the action.
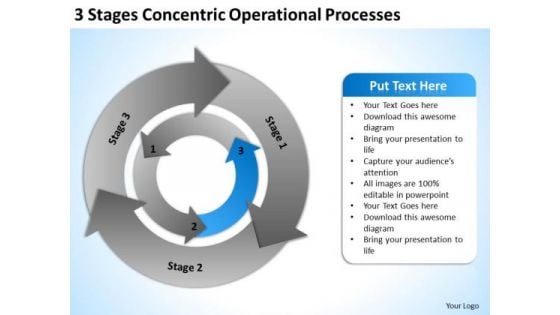
3 Stages Concentric Operational Processes Business Plans PowerPoint Templates
We present our 3 stages concentric operational processes business plans PowerPoint templates.Download our Finance PowerPoint Templates because Our PowerPoint Templates and Slides are the chords of your song. String them along and provide the lilt to your views. Download and present our Communication PowerPoint Templates because Our PowerPoint Templates and Slides will effectively help you save your valuable time. They are readymade to fit into any presentation structure. Present our Arrows PowerPoint Templates because Our PowerPoint Templates and Slides will let you Hit the right notes. Watch your audience start singing to your tune. Download our Business PowerPoint Templates because It will Raise the bar of your Thoughts. They are programmed to take you to the next level. Use our Circle Charts PowerPoint Templates because You can Zap them with our PowerPoint Templates and Slides. See them reel under the impact.Use these PowerPoint slides for presentations relating to Advertise, around, arrow, brand, business, chart, circle, collective, communication, concentric, concept, diagram, direction, financial, flow, flowchart, graphic element, grunge, loop, motion, movement, object, old, operation, organization, pie, presentation, process, production, relationship, repetitive, rotation, round, sequence, step, system, teamwork, wheel. The prominent colors used in the PowerPoint template are Blue, Gray, Black. Cast our 3 Stages Concentric Operational Processes Business Plans PowerPoint Templates in your act. The audience will call for an encore.
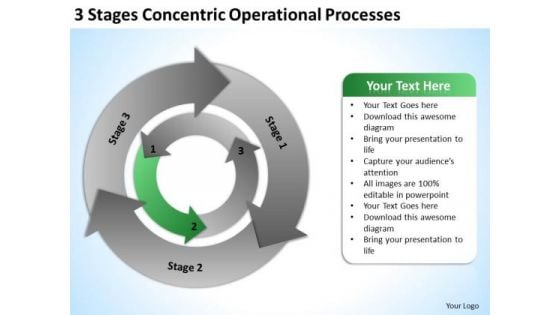
3 Stages Concentric Operational Processes Busniess Plan PowerPoint Slides
We present our 3 stages concentric operational processes busniess plan PowerPoint Slides.Present our Finance PowerPoint Templates because It will Raise the bar of your Thoughts. They are programmed to take you to the next level. Present our Communication PowerPoint Templates because You aspire to touch the sky with glory. Let our PowerPoint Templates and Slides provide the fuel for your ascent. Download and present our Arrows PowerPoint Templates because Our PowerPoint Templates and Slides will Embellish your thoughts. They will help you illustrate the brilliance of your ideas. Download our Business PowerPoint Templates because Our PowerPoint Templates and Slides will let your words and thoughts hit bullseye everytime. Present our Circle Charts PowerPoint Templates because It will Give impetus to the hopes of your colleagues. Our PowerPoint Templates and Slides will aid you in winning their trust.Use these PowerPoint slides for presentations relating to Advertise, around, arrow, brand, business, chart, circle, collective, communication, concentric, concept, diagram, direction, financial, flow, flowchart, graphic element, grunge, loop, motion, movement, object, old, operation, organization, pie, presentation, process, production, relationship, repetitive, rotation, round, sequence, step, system, teamwork, wheel. The prominent colors used in the PowerPoint template are Green, Gray, Black. Our 3 Stages Concentric Operational Processes Busniess Plan PowerPoint Slides are all encompassing. They cover each and every angle.
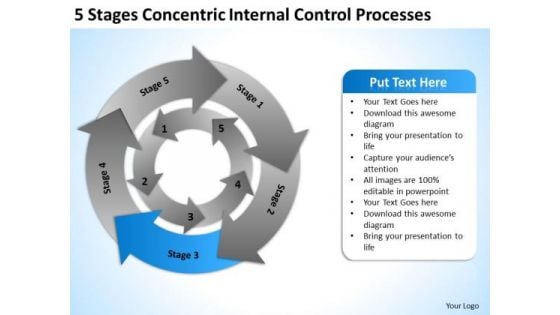
5 Stages Concentric Internal Control Processes Business Plan PowerPoint Templates
We present our 5 stages concentric internal control processes business plan PowerPoint templates.Use our Finance PowerPoint Templates because Our PowerPoint Templates and Slides will fulfill your every need. Use them and effectively satisfy the desires of your audience. Present our Communication PowerPoint Templates because Our PowerPoint Templates and Slides will let your ideas bloom. Create a bed of roses for your audience. Use our Arrows PowerPoint Templates because You can Zap them with our PowerPoint Templates and Slides. See them reel under the impact. Download and present our Business PowerPoint Templates because Our PowerPoint Templates and Slides will let your words and thoughts hit bullseye everytime. Download and present our Circle Charts PowerPoint Templates because our PowerPoint Templates and Slides are the string of your bow. Fire of your ideas and conquer the podium.Use these PowerPoint slides for presentations relating to Advertise, around, arrow, brand, business, chart, circle, collective, communication, concentric, concept, diagram, direction, financial, flow, flowchart, graphic element, grunge, loop, motion, movement, object, old, operation, organization, pie, presentation, process, production, relationship, repetitive, rotation, round, sequence, step, system, teamwork, wheel. The prominent colors used in the PowerPoint template are Blue, Gray, Black. Our 5 Stages Concentric Internal Control Processes Business Plan PowerPoint Templates deliver a blast for a buck. Just a bang is not good enough.
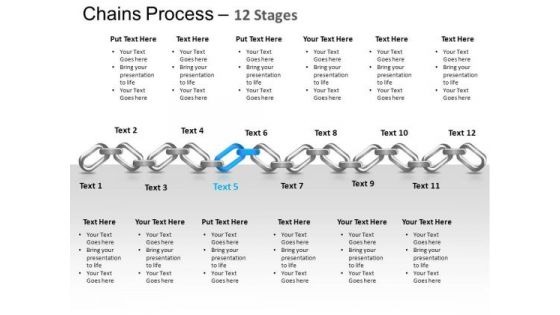
PowerPoint Themes Education Chains Ppt Themes
PowerPoint Themes Education Chains PPT Themes-Most events and in every aspect of life are invariably interlinked. Use this chains graphic to outline your thoughts and their inherent interdependance to acheive the final outcome. Highlight the strength and durability of your thoughts, ideas and products.-These amazing PowerPoint pre-designed slides and PowerPoint templates have been carefully created by our team of experts to help you impress your audience. Our stunning collection of Powerpoint slides are 100% editable and can easily fit in any PowerPoint presentations. By using these animations and graphics in PowerPoint and you can easily make professional presentations. Any text can be entered at any point in the PowerPoint template or slide. Just DOWNLOAD our awesome PowerPoint templates and you are ready to go. Give a good account with our PowerPoint Themes Education Chains Ppt Themes. Put your views across with clarity.
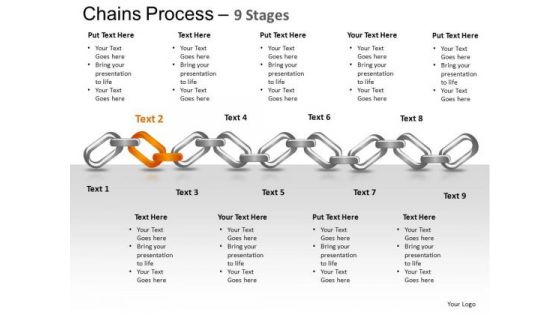
PowerPoint Theme Company Chains Ppt Theme
PowerPoint Theme Company Chains PPT Theme-Most events and in every aspect of life are invariably interlinked. Use this chains graphic to outline your thoughts and their inherent interdependance to acheive the final outcome. Highlight the strength and durability of your thoughts, ideas and products.-These amazing PowerPoint pre-designed slides and PowerPoint templates have been carefully created by our team of experts to help you impress your audience. Our stunning collection of Powerpoint slides are 100% editable and can easily fit in any PowerPoint presentations. By using these animations and graphics in PowerPoint and you can easily make professional presentations. Any text can be entered at any point in the PowerPoint template or slide. Just DOWNLOAD our awesome PowerPoint templates and you are ready to go. Our PowerPoint Theme Company Chains Ppt Theme are destined to meet your standards. They conform to your exacting demands.
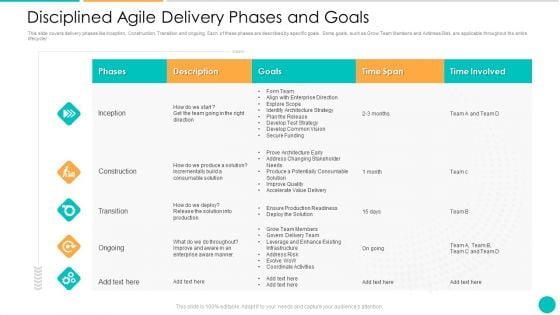
DAD Framework Disciplined Agile Delivery Phases And Goals Ppt Model Professional PDF
This slide covers delivery phases like Inception, Construction, Transition and ongoing. Each of these phases are described by specific goals. Some goals, such as Grow Team Members and Address Risk, are applicable throughout the entire lifecycle. Deliver and pitch your topic in the best possible manner with this DAD framework disciplined agile delivery phases and goals ppt model professional pdf. Use them to share invaluable insights on develop test strategy, grow team members, produce a potentially consumable solution, secure funding, goals and impress your audience. This template can be altered and modified as per your expectations. So, grab it now.
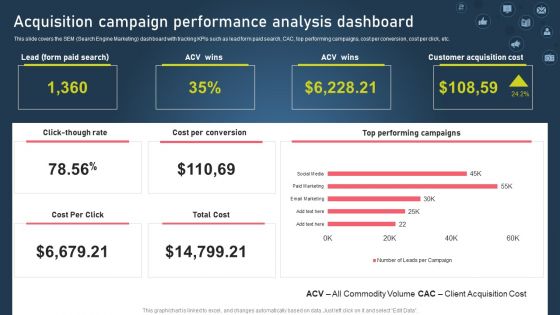
Strategies For Acquiring Online And Offline Clients Acquisition Campaign Performance Analysis Dashboard Elements PDF
This slide covers the client acquisition budget chart for allocating the required resources to a specific channel. It includes marketing channels such as SEO, PPC, social media marketing, event sponsorships, offline marketing, display, and remarketing ads. Want to ace your presentation in front of a live audience. Our Strategies For Acquiring Online And Offline Clients Acquisition Channel Budget Allocation Plan Infographics PDF can help you do that by engaging all the users towards you.. Slidegeeks experts have put their efforts and expertise into creating these impeccable powerpoint presentations so that you can communicate your ideas clearly. Moreover, all the templates are customizable, and easy-to-edit and downloadable. Use these for both personal and commercial use.
Business Diagram Dollar Sign Bulb With Pencil For Finance Presentation Template
Our professionally designed business diagram is as an effective tool for communicating business ideas and strategies for corporate planning. It contains graphics of dollar sign bulb with pencil. Convey your views with this diagram slide. It will amplify the strength of your logic.

Business Diagram 3d Lock With Pie Chart And Text Boxes For Business PowerPoint Slide
This Power Point diagram has been crafted with pie chart in shape of lock. It contains diagram of lock pie chart to compare and present data in an effective manner. Use this diagram to build professional presentations for your viewers.

Business Charts PowerPoint Templates Cards And Dices Happy New Year Sales Marketing Slides
Business Charts PowerPoint templates cards and dices happy new year Sales marketing Slides-New Year is the time at which a new calendar year begins and the calendar's year count is incremented. This PowerPoint Diagram helps you to wish New Year in different way. It consists of many slides with different graphics. It shows different ways of representing 2013 and wishing New Year. Critique plans with our Business Charts PowerPoint Templates Cards And Dices Happy New Year Sales Marketing Slides. Download without worries with our money back guaranteee.
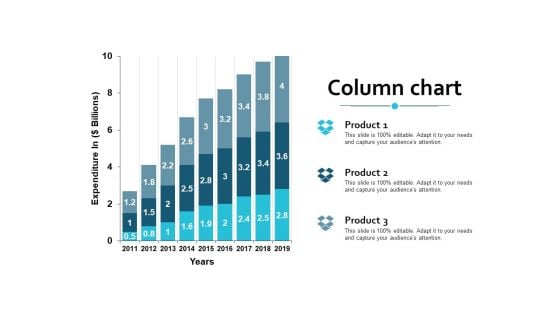
Column Chart Analysis Ppt Powerpoint Presentation Summary Infographics
This is a column chart analysis ppt powerpoint presentation summary infographics. This is a three stage process. The stages in this process are column chart, finance, marketing, management, analysiscolumn chart, finance, marketing, management, analysis.
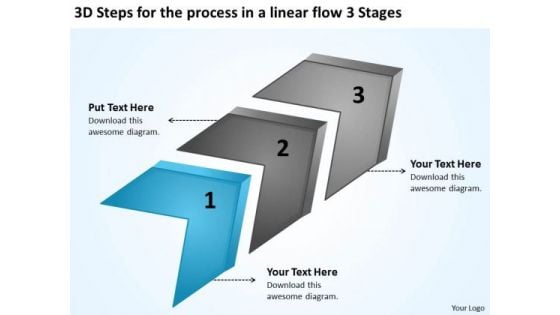
Steps For The Process In A Linear Flow 3 Stages Samples Of Business Plans PowerPoint Slides
We present our steps for the process in a linear flow 3 stages samples of business plans PowerPoint Slides.Download our Business PowerPoint Templates because you can Lead your flock steadily to greater heights. Look around at the vast potential of achievement around you. Download our Arrows PowerPoint Templates because they will Amplify your thoughts via our appropriate templates. Use our Shapes PowerPoint Templates because you have the basic goal in mind. Present our Process and Flows PowerPoint Templates because this template helps you to illustrate your method, piece by piece, and interlock the whole process in the minds of your audience. Download our Flow charts PowerPoint Templates because our PowerPoint templates give this step by step process to acheive the aim.Use these PowerPoint slides for presentations relating to Budget, business charts, character, chart, drawing on, finance, financial, flow, graph, growth, hand, isolated, horizontal, leadership, marker, pen, power, professional, progress, reducing, showing one, the concept, the employee, the line manager, success, space, upward leader. The prominent colors used in the PowerPoint template are Blue, Black, White. The feedback we get is that our steps for the process in a linear flow 3 stages samples of business plans PowerPoint Slides provide great value for your money. Be assured of finding the best projection to highlight your words. The feedback we get is that our financial PowerPoint templates and PPT Slides are Adorable. People tell us our steps for the process in a linear flow 3 stages samples of business plans PowerPoint Slides are Spectacular. We assure you our charts PowerPoint templates and PPT Slides are Striking. We assure you our steps for the process in a linear flow 3 stages samples of business plans PowerPoint Slides are Enchanting. The feedback we get is that our charts PowerPoint templates and PPT Slides are Luxuriant. Get familiar with our Steps For The Process In A Linear Flow 3 Stages Samples Of Business Plans PowerPoint Slides. They will prove an excellent ally.
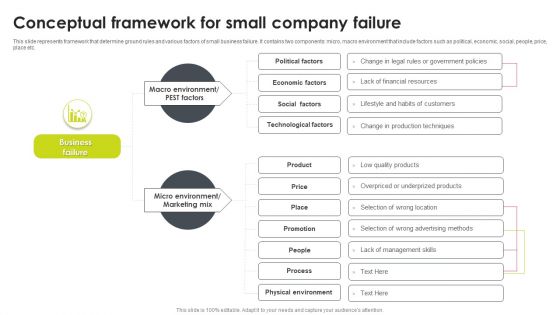
Conceptual Framework For Small Company Failure Demonstration PDF
This slide represents framework that determine ground rules and various factors of small business failure. It contains two components micro, macro environment that include factors such as political, economic, social, people, price, place etc. Presenting Conceptual Framework For Small Company FaiConceptual Framework For Small Company Failure Demonstration PDF to dispense important information. This template comprises two stages. It also presents valuable insights into the topics including Business Failure, Economic Factors, Technological Factors. This is a completely customizable PowerPoint theme that can be put to use immediately. So, download it and address the topic impactfully.
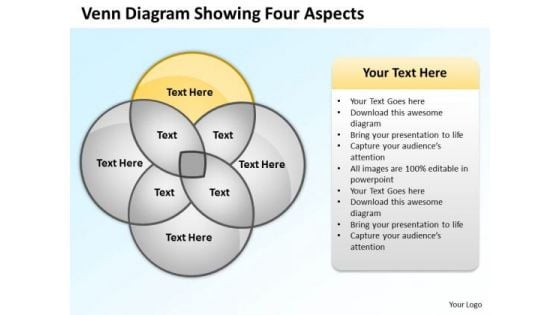
Business Power Point Venn Diagram Showing Four Aspects PowerPoint Slides
We present our business power point venn diagram showing four aspects PowerPoint Slides.Download and present our Circle Charts PowerPoint Templates because Our PowerPoint Templates and Slides are specially created by a professional team with vast experience. They diligently strive to come up with the right vehicle for your brilliant Ideas. Download our Ring Charts PowerPoint Templates because It can be used to Set your controls for the heart of the sun. Our PowerPoint Templates and Slides will be the propellant to get you there. Use our Process and Flows PowerPoint Templates because Our PowerPoint Templates and Slides will let you Hit the target. Go the full distance with ease and elan. Download and present our Flow Charts PowerPoint Templates because It will Raise the bar of your Thoughts. They are programmed to take you to the next level. Present our Business PowerPoint Templates because You are working at that stage with an air of royalty. Let our PowerPoint Templates and Slides be the jewels in your crown.Use these PowerPoint slides for presentations relating to Business, button, catalog, chart, circle, company, cross, data, design, diagram, direction, document, financial, four, glossy, goals, graph, junction, management, market, marketing, model, multicolored, multiple, navigation, network, options, plan, presentation, process, purple, results, shiny, sphere, statistics, stock, structure. The prominent colors used in the PowerPoint template are Yellow, Gray, White. People tell us our business power point venn diagram showing four aspects PowerPoint Slides are the best it can get when it comes to presenting. PowerPoint presentation experts tell us our cross PowerPoint templates and PPT Slides are effectively colour coded to prioritise your plans They automatically highlight the sequence of events you desire. Presenters tell us our business power point venn diagram showing four aspects PowerPoint Slides will help you be quick off the draw. Just enter your specific text and see your points hit home. Use our chart PowerPoint templates and PPT Slides provide great value for your money. Be assured of finding the best projection to highlight your words. Customers tell us our business power point venn diagram showing four aspects PowerPoint Slides are incredible easy to use. People tell us our cross PowerPoint templates and PPT Slides are specially created by a professional team with vast experience. They diligently strive to come up with the right vehicle for your brilliant Ideas. Our Business Power Point Venn Diagram Showing Four Aspects PowerPoint Slides are highly esteemed. They have jump started many a career.
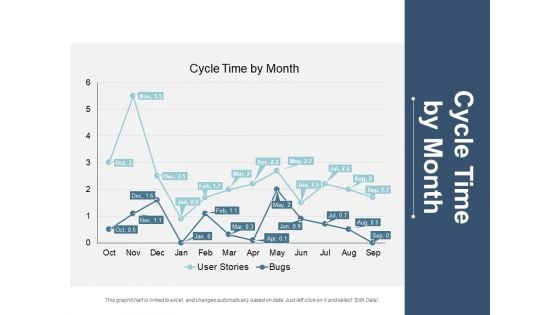
Cycle Time By Month Ppt PowerPoint Presentation Visual Aids Ideas
This is a cycle time by month ppt powerpoint presentation visual aids ideas. This is a two stage process. The stages in this process are line chart, finance, marketing, management, investment.
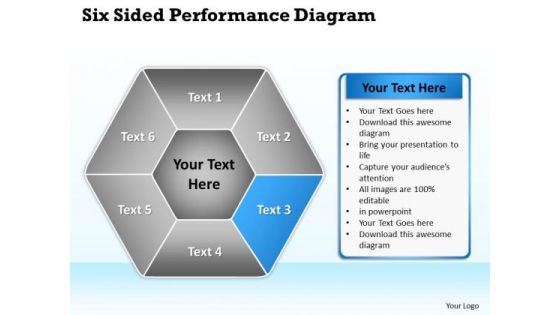
Business Flow Diagram Six Sided Multicolor Hexagon Ppt PowerPoint Templates
We present our business flow diagram six sided multicolor hexagon ppt PowerPoint templates.Use our Ring Charts PowerPoint Templates because You can Be the star of the show with our PowerPoint Templates and Slides. Rock the stage with your ideas. Use our Circle Charts PowerPoint Templates because You have the co-ordinates for your destination of success. Let our PowerPoint Templates and Slides map out your journey. Use our Process and Flows PowerPoint Templates because You are well armed with penetrative ideas. Our PowerPoint Templates and Slides will provide the gunpowder you need. Use our Arrows PowerPoint Templates because You can Rise to the occasion with our PowerPoint Templates and Slides. You will bring your audience on their feet in no time. Present our Shapes PowerPoint Templates because Our PowerPoint Templates and Slides will let you Illuminate the road ahead to Pinpoint the important landmarks along the way.Use these PowerPoint slides for presentations relating to Businessman, center, chart, circle, clockwise, component, concept, connect, core, cycle, diagram, draw, education, element, empty, flow, gist, hand, hexagon, hexagonal, industrial, industry, loop, man, manager, meeting, office, pen, people, person, plan, pointing, presentation, process, sign, stage, step, strategy, support, surround, teacher, teaching. The prominent colors used in the PowerPoint template are Blue, Gray, White. People tell us our business flow diagram six sided multicolor hexagon ppt PowerPoint templates look good visually. PowerPoint presentation experts tell us our core PowerPoint templates and PPT Slides will help them to explain complicated concepts. Presenters tell us our business flow diagram six sided multicolor hexagon ppt PowerPoint templates provide great value for your money. Be assured of finding the best projection to highlight your words. Use our connect PowerPoint templates and PPT Slides are incredible easy to use. Customers tell us our business flow diagram six sided multicolor hexagon ppt PowerPoint templates will make the presenter look like a pro even if they are not computer savvy. People tell us our component PowerPoint templates and PPT Slides are topically designed to provide an attractive backdrop to any subject. Load up with our Business Flow Diagram Six Sided Multicolor Hexagon Ppt PowerPoint Templates with our Business Flow Diagram Six Sided Multicolor Hexagon Ppt PowerPoint Templates. You will be at the top of your game.
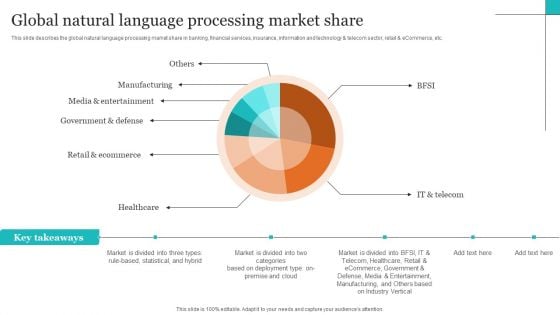
Leveraging NLP To Enhance Operational Efficiency Global Natural Language Processing Market Share Background PDF
This slide describes the global natural language processing market share in banking, financial services, insurance, information and technology and telecom sector, retail and eCommerce, etc. Welcome to our selection of the Leveraging NLP To Enhance Operational Efficiency Global Natural Language Processing Market Share Background PDF. These are designed to help you showcase your creativity and bring your sphere to life. Planning and Innovation are essential for any business that is just starting out. This collection contains the designs that you need for your everyday presentations. All of our PowerPoints are 100 percent editable, so you can customize them to suit your needs. This multi purpose template can be used in various situations. Grab these presentation templates today.
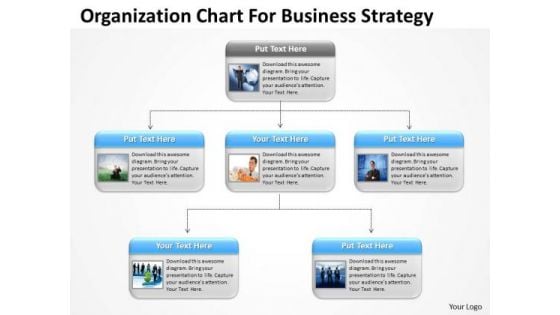
Chart For International Marketing Concepts Formulate Business Plan PowerPoint Templates
We present our chart for international marketing concepts formulate business plan PowerPoint templates.Present our Technology PowerPoint Templates because You can safely bank on our PowerPoint Templates and Slides. They will provide a growth factor to your valuable thoughts. Download and present our Competition PowerPoint Templates because You have a driving passion to excel in your field. Our PowerPoint Templates and Slides will prove ideal vehicles for your ideas. Download our Boxes PowerPoint Templates because Our PowerPoint Templates and Slides will let you Clearly mark the path for others to follow. Present our Process and Flows PowerPoint Templates because Our PowerPoint Templates and Slides will bullet point your ideas. See them fall into place one by one. Present our Business PowerPoint Templates because You will get more than you ever bargained for. Use these PowerPoint slides for presentations relating to Chart, flow, organization, flowchart, box, vector, chain, information, 3d, network, isolated, program, business, blank, plan, concept, arrow, sign, teamwork, symbol, organisation, diagram, circle, graphic, process, workflow, technology, shape, management, graph, connection, solution, design, colorful, empty, procedure, connect, organize, background, work, structure, block. The prominent colors used in the PowerPoint template are Blue, Gray, Black. Destroy failure with our Chart For International Marketing Concepts Formulate Business Plan PowerPoint Templates. You will come out on top.

Portfolio Evaluation Pie Chart Ppt Slides
This is a portfolio evolution pie chart ppt slides. This is a six stage process. The stages in this process are business, finance, marketing.
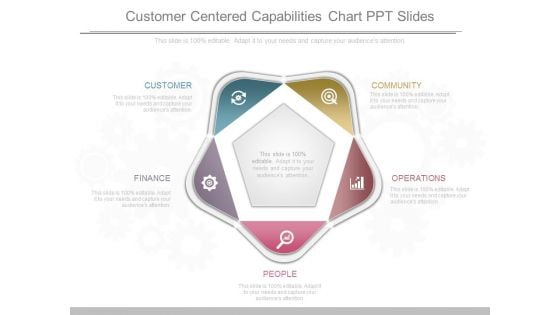
Customer Centered Capabilities Chart Ppt Slides
This is a customer centered capabilities chart ppt slides. This is a five stage process. The stages in this process are community, operations, people, finance, customer.
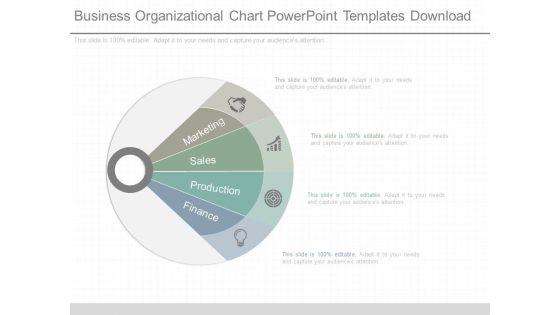
Business Organizational Chart Powerpoint Templates Download
This is a business organizational chart powerpoint templates download. This is a four stage process. The stages in this process are marketing, sales, production, finance.
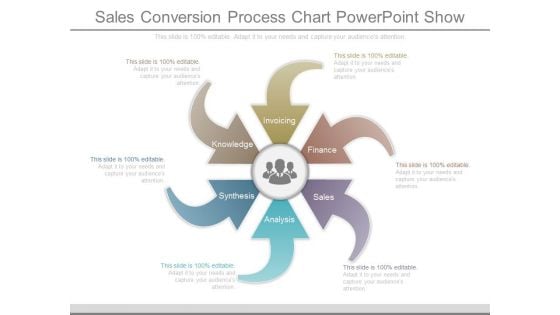
Sales Conversion Process Chart Powerpoint Show
This is a sales conversion process chart powerpoint show. This is a six stage process. The stages in this process are invoicing, finance, sales, analysis, synthesis, knowledge.
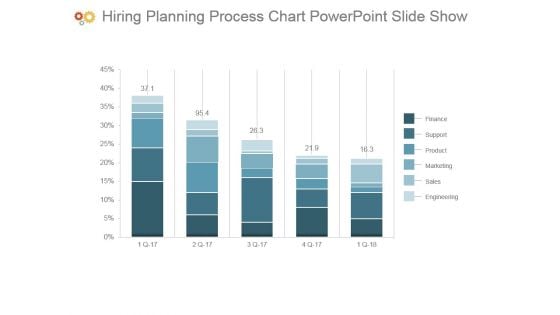
Hiring Planning Process Chart Powerpoint Slide Show
This is a hiring planning process chart powerpoint slide show. This is a five stage process. The stages in this process are finance, support, product, marketing, sales, engineering.
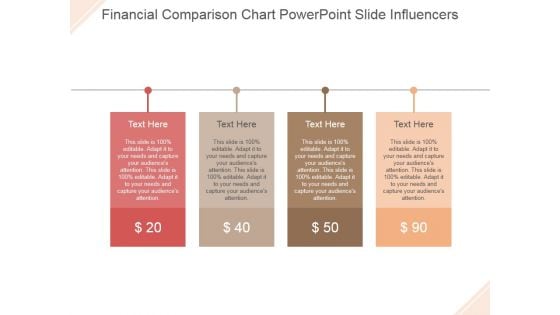
Financial Comparison Chart Ppt PowerPoint Presentation Styles
This is a financial comparison chart ppt powerpoint presentation styles. This is a four stage process. The stage in this process are dollar, business, symbol, finance, management.

Donut Chart Ppt PowerPoint Presentation Ideas
This is a donut chart ppt powerpoint presentation ideas. This is a six stage process. The stages in this process are business, strategy, marketing, analysis, finance.
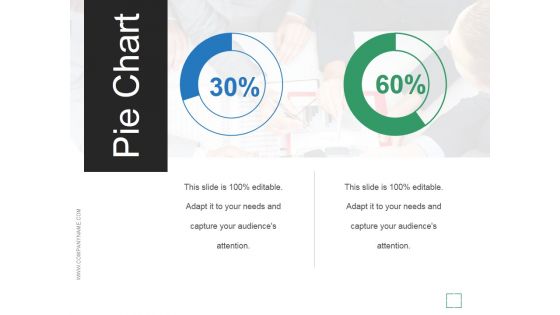
Pie Chart Ppt PowerPoint Presentation Sample
This is a pie chart ppt powerpoint presentation sample. This is a two stage process. The stages in this process are business, marketing, finance, analysis, management.
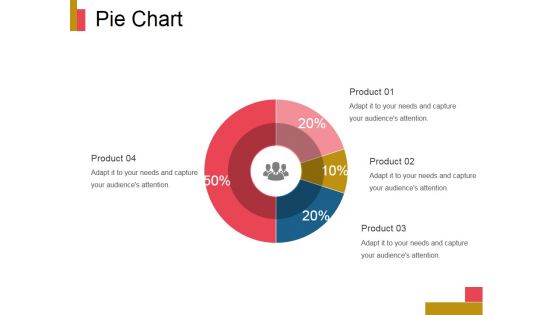
Pie Chart Ppt PowerPoint Presentation Design Ideas
This is a pie chart ppt powerpoint presentation design ideas. This is a four stage process. The stages in this process are product, finance, business, marketing, pie.
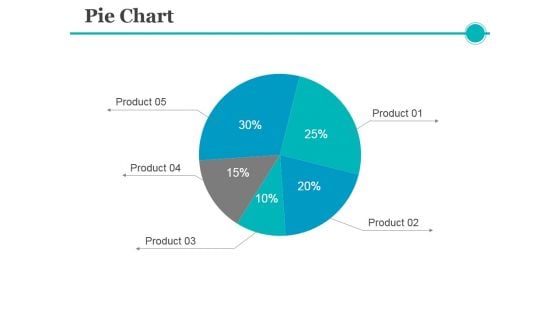
Pie Chart Ppt PowerPoint Presentation Professional Introduction
This is a pie chart ppt powerpoint presentation professional introduction. This is a five stage process. The stages in this process are product, finance, pie, process, business.
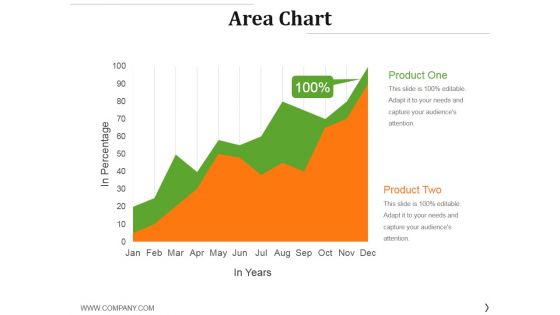
Area Chart Ppt PowerPoint Presentation Gallery Inspiration
This is a area chart ppt powerpoint presentation gallery inspiration. This is a two stage process. The stages in this process are product, growth, success, graph, finance.
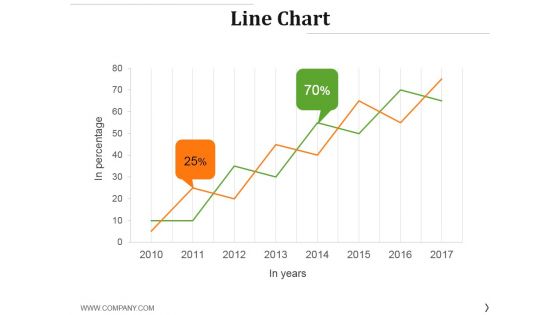
Line Chart Ppt PowerPoint Presentation Professional Template
This is a line chart ppt powerpoint presentation professional template. This is a two stage process. The stages in this process are business, finance, percentage, growth, success.
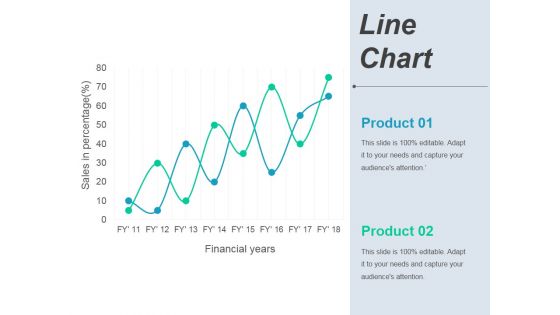
Line Chart Ppt PowerPoint Presentation Ideas Deck
This is a line chart ppt powerpoint presentation ideas deck. This is a two stage process. The stages in this process are business, marketing, finance, growth.
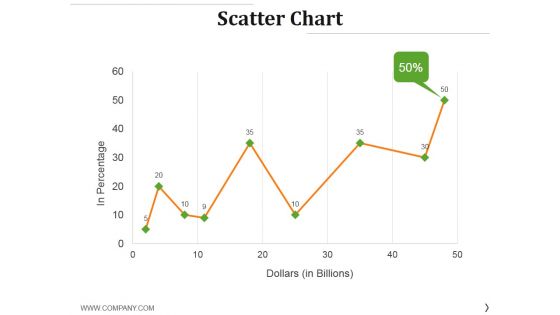
Scatter Chart Ppt PowerPoint Presentation Layouts Gridlines
This is a scatter chart ppt powerpoint presentation layouts gridlines. This is a nine stage process. The stages in this process are in percentage, dollars, growth, success, finance.
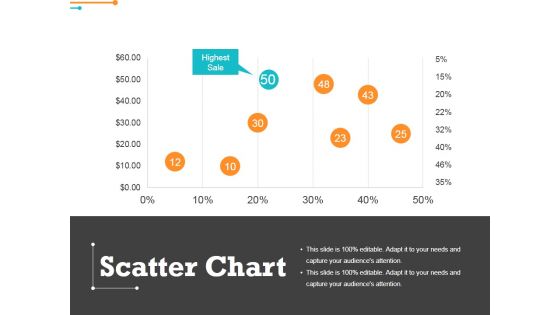
Scatter Chart Ppt PowerPoint Presentation Outline Graphics
This is a scatter chart ppt powerpoint presentation outline graphics. This is a eight stage process. The stages in this process are highest sale, percentage, finance, business.
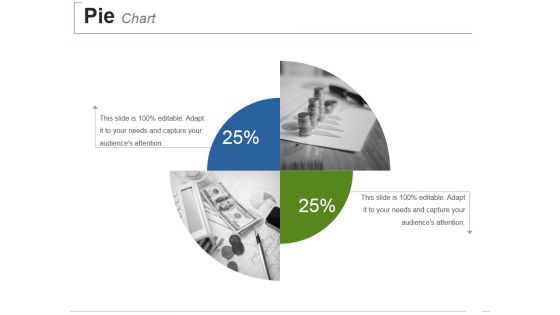
Pie Chart Ppt PowerPoint Presentation Styles Inspiration
This is a pie chart ppt powerpoint presentation styles inspiration. This is a two stage process. The stages in this process are finance, management, marketing, success, business, analysis.
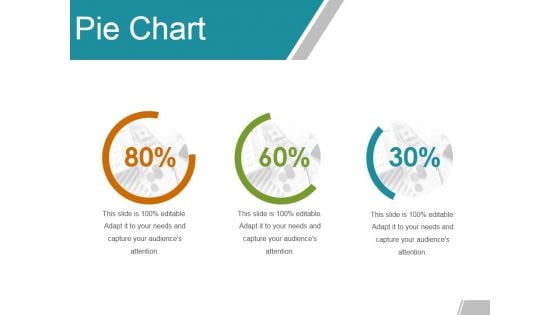
Pie Chart Ppt PowerPoint Presentation Summary Slide
This is a pie chart ppt powerpoint presentation summary slide. This is a three stage process. The stages in this process are percentage, finance, marketing, business.
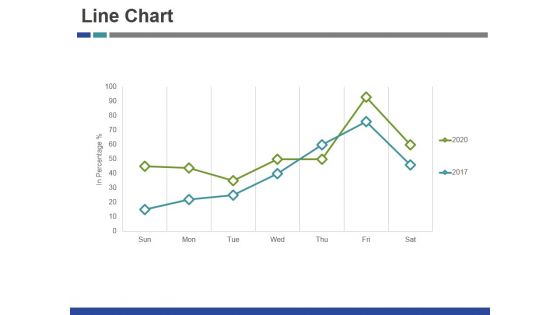
Line Chart Ppt PowerPoint Presentation Gallery Summary
This is a line chart ppt powerpoint presentation gallery summary. This is a two stage process. The stages in this process are finance, graph, business, management, marketing.
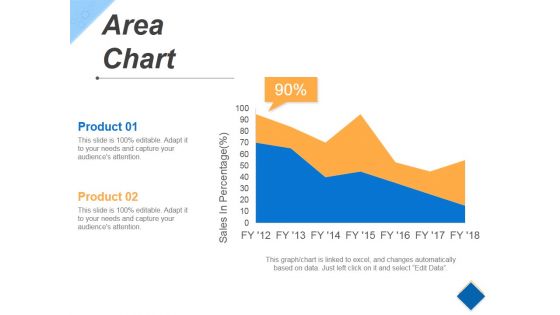
Area Chart Ppt PowerPoint Presentation Slides Gridlines
This is a area chart ppt powerpoint presentation slides gridlines. This is a two stage process. The stages in this process are business, finance, marketing, percentage.
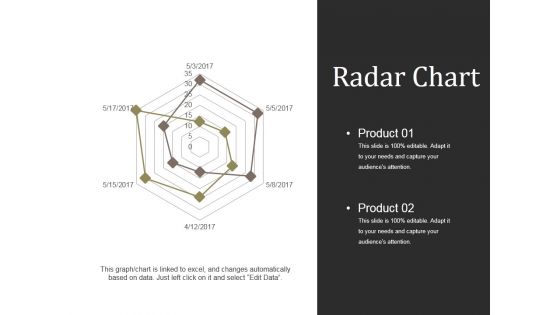
Radar Chart Ppt PowerPoint Presentation Model Picture
This is a radar chart ppt powerpoint presentation model picture. This is a six stage process. The stages in this process are product, finance marketing, business, management, analysis.
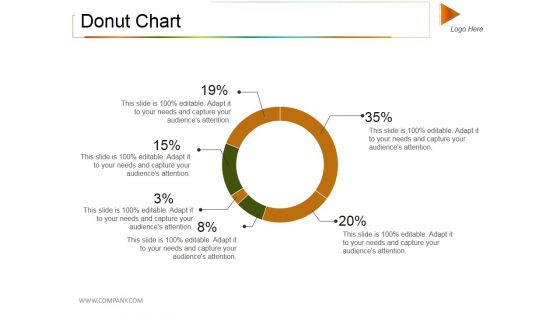
Donut Chart Ppt PowerPoint Presentation Model Rules
This is a donut chart ppt powerpoint presentation model rules. This is a six stage process. The stages in this process are donut, percentage, finance, business, marketing.
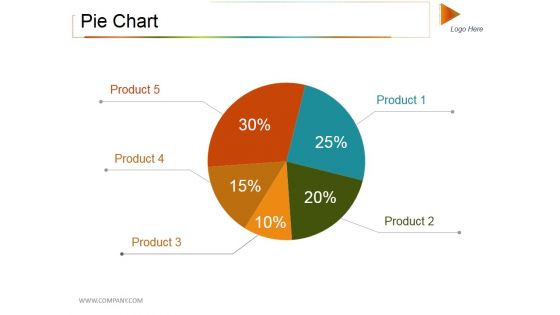
Pie Chart Ppt PowerPoint Presentation Styles Objects
This is a pie chart ppt powerpoint presentation styles objects. This is a five stage process. The stages in this process are pie, process, percentage, finance, business.
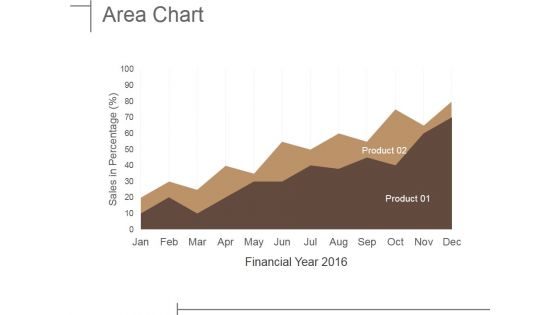
Area Chart Ppt PowerPoint Presentation Ideas Guide
This is a area chart ppt powerpoint presentation ideas guide. This is a two stage process. The stages in this process are growth, finance, success, business, marketing.
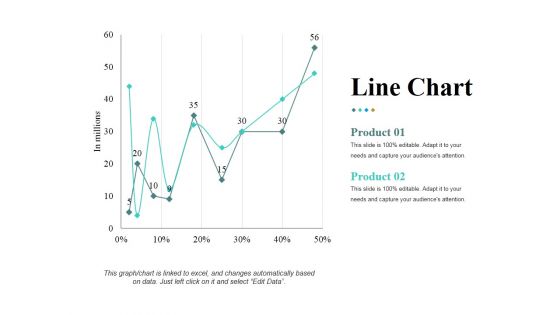
Line Chart Ppt PowerPoint Presentation Pictures Ideas
This is a line chart ppt powerpoint presentation pictures ideas. This is a two stage process. The stages in this process are in millions, percentage, finance, product, growth.
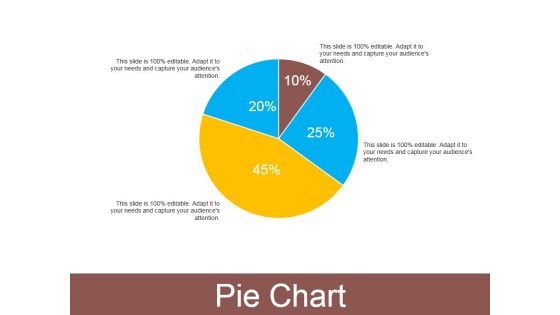
Pie Chart Ppt PowerPoint Presentation Outline Smartart
This is a pie chart ppt powerpoint presentation outline smartart. This is a four stage process. The stages in this process are pie, process, percentage, finance, business.
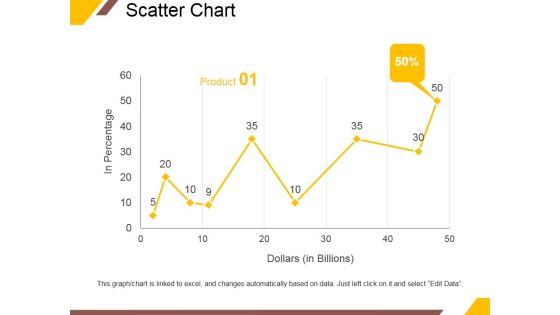
Scatter Chart Ppt PowerPoint Presentation Gallery Vector
This is a scatter chart ppt powerpoint presentation gallery vector. This is a nine stage process. The stages in this process are in percentage, dollars, product, percentage, finance.
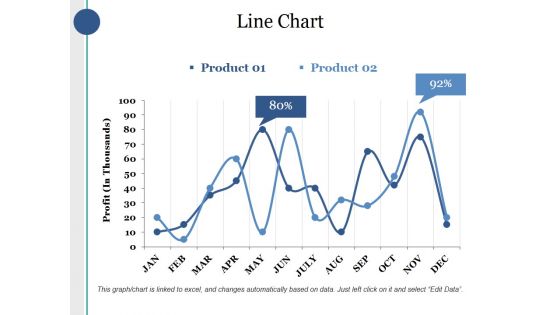
Line Chart Ppt PowerPoint Presentation Layouts Sample
This is a line chart ppt powerpoint presentation layouts sample. This is a two stage process. The stages in this process are product, profit, percentage, finance, business.
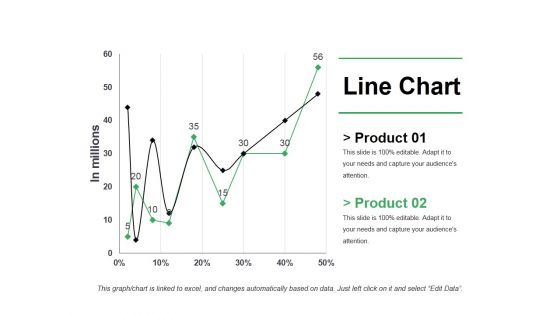
Line Chart Ppt PowerPoint Presentation Pictures Shapes
This is a line chart ppt powerpoint presentation pictures shapes. This is a two stage process. The stages in this process are business, marketing, strategy, finance, growth.
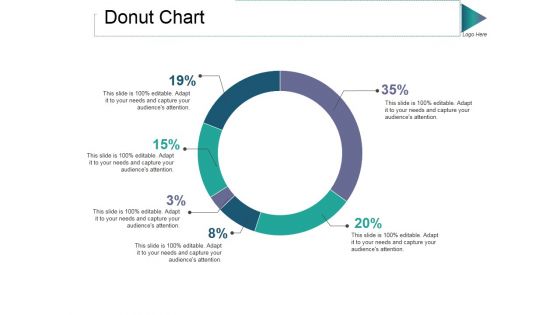
Donut Chart Ppt PowerPoint Presentation Gallery Guide
This is a donut chart ppt powerpoint presentation gallery guide. This is a six stage process. The stages in this process are percentage, finance, donut, business, process.

Business Calculations Sales PowerPoint Themes And PowerPoint Slides 0411
Microsoft PowerPoint Theme and Slide with business still life with coffee and chart showing success Set a good example with our Business Calculations Sales PowerPoint Themes And PowerPoint Slides 0411. Be the benchmark for others to follow.

Accounts And Graph Business PowerPoint Themes And PowerPoint Slides 0511
Microsoft PowerPoint Theme and Slide with an accounts bar charts in different colors Burst on to the scene with our Accounts And Graph Business PowerPoint Themes And PowerPoint Slides 0511. Set the stage ablaze with your ideas.
Market Share Business PowerPoint Themes And PowerPoint Slides 0511
Microsoft PowerPoint Theme and Slide with a colorful pie chart graph with the words market share on it Disarm your audience with our Market Share Business PowerPoint Themes And PowerPoint Slides 0511. You will come out on top.
Unity Puzzle Shapes Services PowerPoint Themes And PowerPoint Slides 0311
Microsoft PowerPoint Theme and Slide with 3d colorful puzzle chart wheel Our Unity Puzzle Shapes Services PowerPoint Themes And PowerPoint Slides 0311 always show a full face. Get a complete view from any angle.
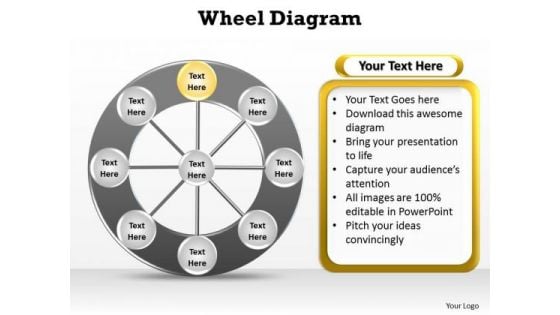
PowerPoint Backgrounds Company Wheel Diagram Ppt Designs
PowerPoint Backgrounds Company Wheel Diagram PPT Designs-The Circle of Life - a concept emmbedded in our minds and hence easy to comprehend. Life and Business is made up of processes comprising stages that flow from one to another. An excellent graphic to attract the attention of and understanding by your audience to improve earnings.-Banner, Boxes, Brochure, Business, Catalog, Chart, Circle, Company, Corporate, Design, Diagram, Different, Differentiate, G illustration, Information, Item, Junction, Management, Marketing, Menu, Modern, Multicolor, Network, Options, Parts, Pie Determine improvements with our PowerPoint Backgrounds Company Wheel Diagram Ppt Designs. Download without worries with our money back guaranteee.
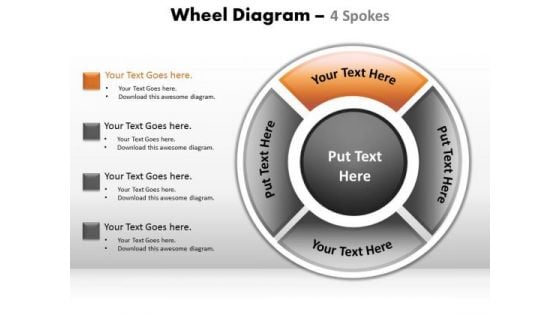
PowerPoint Backgrounds Global Wheel Diagram Ppt Design
PowerPoint Backgrounds Global Wheel Diagram PPT Design-The Circle of Life - a concept emmbedded in our minds and hence easy to comprehend. Life and Business is made up of processes comprising stages that flow from one to another. An excellent graphic to attract the attention of and understanding by your audience to improve earnings.-Banner, Boxes, Brochure, Business, Catalog, Chart, Circle, Company, Corporate, Design, Diagram, Different, Differentiate, G illustration, Information, Item, Junction, Management, Marketing, Menu, Modern, Multicolor, Network, Options, Parts, Pie Schedule meetings with our PowerPoint Backgrounds Global Wheel Diagram Ppt Design. Download without worries with our money back guaranteee.
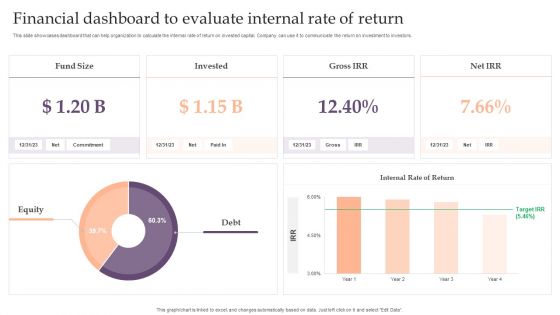
Assessing Debt And Equity Fundraising Alternatives For Business Growth Financial Dashboard To Evaluate Internal Designs PDF
This slide showcases dashboard that can help organization to calculate the internal rate of return on invested capital. Company can use it to communicate the return on investment to investors. Create an editable Assessing Debt And Equity Fundraising Alternatives For Business Growth Financial Dashboard To Evaluate Internal Designs PDF that communicates your idea and engages your audience. Whether you are presenting a business or an educational presentation, pre designed presentation templates help save time.Assessing Debt And Equity Fundraising Alternatives For Business Growth Financial Dashboard To Evaluate Internal Designs PDF is highly customizable and very easy to edit, covering many different styles from creative to business presentations. Slidegeeks has creative team members who have crafted amazing templates. So, go and get them without any delay.
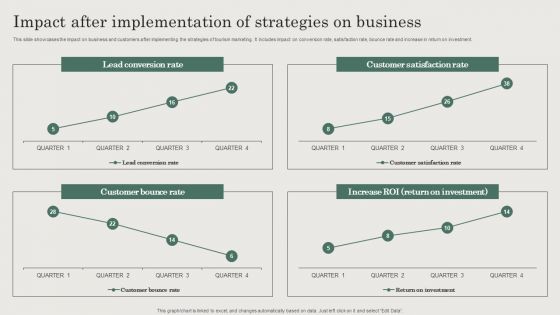
Hospitality And Travel Advertising Techniques Impact After Implementation Of Strategies On Business Rules PDF
This slide showcases the impact on business and customers after implementing the strategies of tourism marketing. It includes impact on conversion rate, satisfaction rate, bounce rate and increase in return on investment. Boost your pitch with our creative Hospitality And Travel Advertising Techniques Impact After Implementation Of Strategies On Business Rules PDF. Deliver an awe inspiring pitch that will mesmerize everyone. Using these presentation templates you will surely catch everyones attention. You can browse the ppts collection on our website. We have researchers who are experts at creating the right content for the templates. So you do not have to invest time in any additional work. Just grab the template now and use them.
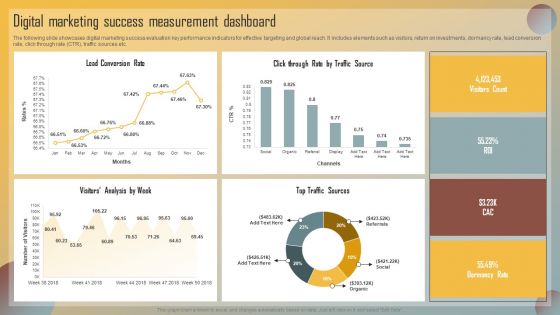
Guide For Marketing Analytics To Improve Decisions Digital Marketing Success Measurement Dashboard Guidelines PDF
The following slide showcases digital marketing success evaluation key performance indicators for effective targeting and global reach. It includes elements such as visitors, return on investments, dormancy rate, lead conversion rate, click through rate CTR, traffic sources etc. Boost your pitch with our creative Guide For Marketing Analytics To Improve Decisions Digital Marketing Success Measurement Dashboard Guidelines PDF. Deliver an awe-inspiring pitch that will mesmerize everyone. Using these presentation templates you will surely catch everyones attention. You can browse the ppts collection on our website. We have researchers who are experts at creating the right content for the templates. So you do not have to invest time in any additional work. Just grab the template now and use them.
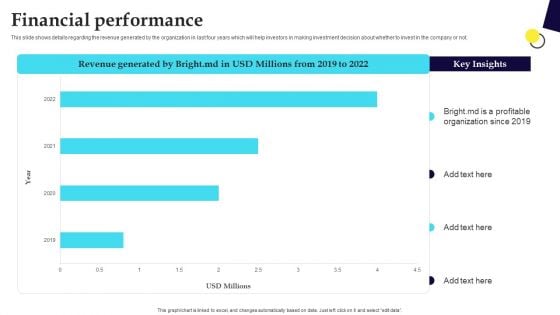
Digital Healthcare Platform Fundraising Pitch Deck Financial Performance Clipart PDF
This slide shows details regarding the revenue generated by the organization in last four years which will help investors in making investment decision about whether to invest in the company or not. Explore a selection of the finest Digital Healthcare Platform Fundraising Pitch Deck Financial Performance Clipart PDF here. With a plethora of professionally designed and pre made slide templates, you can quickly and easily find the right one for your upcoming presentation. You can use our Digital Healthcare Platform Fundraising Pitch Deck Financial Performance Clipart PDF to effectively convey your message to a wider audience. Slidegeeks has done a lot of research before preparing these presentation templates. The content can be personalized and the slides are highly editable. Grab templates today from Slidegeeks.
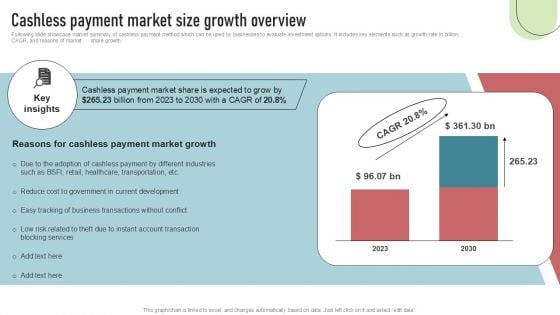
Cashless Payment Strategies To Enhance Business Performance Cashless Payment Market Size Growth Overview Topics PDF
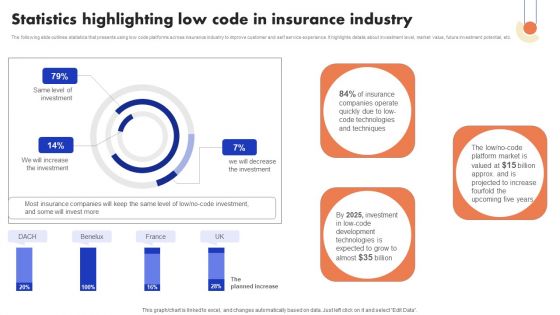
Implementation Of Digital Advancement Techniques Statistics Highlighting Low Code Formats PDF
The following slide outlines statistics that presents using low code platforms across insurance industry to improve customer and self service experience. It highlights details about investment level, market value, future investment potential, etc. Do you have to make sure that everyone on your team knows about any specific topic I yes, then you should give Implementation Of Digital Advancement Techniques Statistics Highlighting Low Code Formats PDF a try. Our experts have put a lot of knowledge and effort into creating this impeccable Implementation Of Digital Advancement Techniques Statistics Highlighting Low Code Formats PDF. You can use this template for your upcoming presentations, as the slides are perfect to represent even the tiniest detail. You can download these templates from the Slidegeeks website and these are easy to edit. So grab these today.
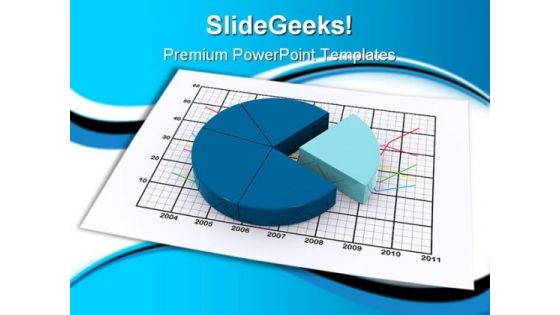
Pie Chart Graph Business PowerPoint Backgrounds And Templates 1210
Microsoft PowerPoint Template and Background with pie chart lying on a paper sheet containing a business diagram(3 render) Our Pie Chart Graph Business PowerPoint Backgrounds And Templates 1210 assist execution. They channel the action in the desired direction.
Honey Comb PowerPoint Templates Honey Ppt Slides
Honey Comb PowerPoint templates Honey PPT Slides-These high quality powerpoint pre-designed slides and powerpoint templates have been carefully created by our professional team to help you impress your audience. All slides have been created and are 100% editable in powerpoint. Each and every property of any graphic - color, size, orientation, shading, outline etc. can be modified to help you build an effective powerpoint presentation. Any text can be entered at any point in the powerpoint template or slide. Simply DOWNLOAD, TYPE and PRESENT! These PowerPoint presentation slides can be used to represent themes relating to -Bee, beehive, beeswax, cell, close, close-up, color, comb, concept, design, dripping, drop, element, flow, flowing, food, geometric, gold, graphic, hexagon, hive, honey, honey-cell, honeycell, honeycomb, honeyed, illustration, liquid, macro, mead, medicine, natural, object, orange, organic, pattern, reflection, repetition, seamless, shape, shiny, sweet, textured, vector, viscous, wax, yellow-Honey Comb PowerPoint templates Honey PPT Slides Verbalize your views with our Honey Comb PowerPoint Templates Honey Ppt Slides. Download without worries with our money back guaranteee.
Missing Hexagon In A Comb PowerPoint Slides
Missing Hexagon in a Comb PowerPoint Slides-These high quality powerpoint pre-designed slides and powerpoint templates have been carefully created by our professional team to help you impress your audience. All slides have been created and are 100% editable in powerpoint. Each and every property of any graphic - color, size, orientation, shading, outline etc. can be modified to help you build an effective powerpoint presentation. Any text can be entered at any point in the powerpoint template or slide. Simply DOWNLOAD, TYPE and PRESENT! These PowerPoint presentation slides can be used to represent themes relating to -Bee, beehive, beeswax, cell, close, close-up, color, comb, concept, design, dripping, drop, element, flow, flowing, food, geometric, gold, graphic, hexagon, hive, honey, honey-cell, honeycell, honeycomb, honeyed, illustration, liquid, macro, mead, medicine, natural, object, orange, organic, pattern, reflection, repetition, seamless, shape, shiny, sweet, textured, vector, viscous, wax, yellow-Missing Hexagon in a Comb PowerPoint Slides Drive your organization with our Missing Hexagon In A Comb PowerPoint Slides. Download without worries with our money back guaranteee.
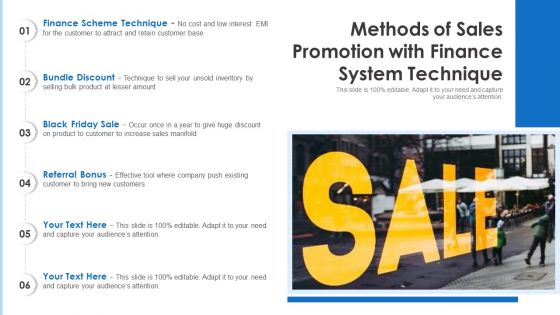
Methods Of Sales Promotion With Finance System Technique Ppt PowerPoint Presentation File Diagrams PDF
Showcasing this set of slides titled methods of sales promotion with finance system technique ppt powerpoint presentation file diagrams pdf. The topics addressed in these templates are bundle discount, finance scheme technique, black friday sale. All the content presented in this PPT design is completely editable. Download it and make adjustments in color, background, font etc. as per your unique business setting.
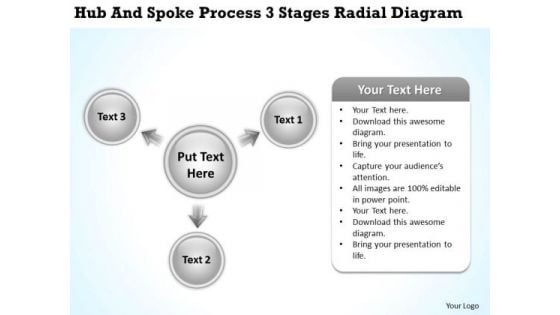
Business Analyst Diagrams Radial PowerPoint Templates Backgrounds For Slides
We present our business analyst diagrams radial PowerPoint templates backgrounds for slides.Present our Arrow PowerPoint Templates because Our PowerPoint Templates and Slides offer you the widest possible range of options. Download and present our Radial Charts PowerPoint Templates because Our PowerPoint Templates and Slides are Clear and concise. Use them and dispel any doubts your team may have. Download our Flow Charts PowerPoint Templates because These PowerPoint Templates and Slides will give the updraft to your ideas. See them soar to great heights with ease. Present our Business PowerPoint Templates because It will Strengthen your hand with your thoughts. They have all the aces you need to win the day. Present our Process and Flows PowerPoint Templates because Our PowerPoint Templates and Slides will steer your racing mind. Hit the right buttons and spur on your audience.Use these PowerPoint slides for presentations relating to Arrow, box, business, chart, circle, color, concept, connect, connection, connectivity, corporate, data, design, diagram, financial, flow, flowchart, glassy, glossy, graph, graphical, group, illustration, organize, plan, process, set, steps, teamwork, vector. The prominent colors used in the PowerPoint template are White, Gray, Black. Integrate teams with our Business Analyst Diagrams Radial PowerPoint Templates Backgrounds For Slides. Download without worries with our money back guaranteee.

Pie Chart People PowerPoint Template 0810
Businesspeople are standing on a large broken graph conceptual business illustration. Our Pie Chart People PowerPoint Template 0810 have more than what meets the eye. They contain additional dimensions.
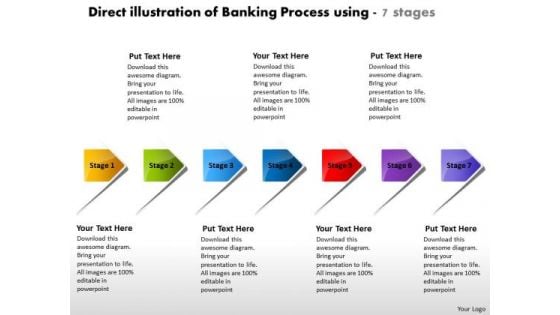
Direct Illustration Of Banking Process Using 7 Stages Electrical Design PowerPoint Slides
We present our direct illustration of banking process using 7 stages electrical design PowerPoint Slides.Use our Business PowerPoint Templates because,The fruits of your labour are beginning to show.Enlighten them on the great plans you have for their enjoyment Use our Shapes PowerPoint Templates because, You have a great plan to put the pieces together, getting all the various contributors to gel for a successful completion. Use our Signs PowerPoint Templates because,our creative template will lay down your views. Use our Arrows PowerPoint Templates because,You can Trigger audience minds with your interesting ideas. Use our Process and Flows PowerPoint Templates because,This diagram helps to reaffirm to your team your faith in maintaining the highest ethical standards.Use these PowerPoint slides for presentations relating to account, arrow, arrows, away, box, business, chart, choice, concept, concepts, consultation, corporate, design, diagram, direction, elements, flow, follow, follows, future, group, grow, increase, lines, many, month, move, past, period, phase, project, report, rise, row, step, success, text, time, timeline, work, year. The prominent colors used in the PowerPoint template are Yellow, Green, Blue. People tell us our direct illustration of banking process using 7 stages electrical design PowerPoint Slides will generate and maintain the level of interest you desire. They will create the impression you want to imprint on your audience. The feedback we get is that our away PowerPoint templates and PPT Slides are Perfect. People tell us our direct illustration of banking process using 7 stages electrical design PowerPoint Slides are Multicolored. Presenters tell us our concept PowerPoint templates and PPT Slides are effectively colour coded to prioritise your plans They automatically highlight the sequence of events you desire. The feedback we get is that our direct illustration of banking process using 7 stages electrical design PowerPoint Slides are Vintage. Professionals tell us our away PowerPoint templates and PPT Slides will make the presenter look like a pro even if they are not computer savvy. If you have doubts about the effort required? Be assured our Direct Illustration Of Banking Process Using 7 Stages Electrical Design PowerPoint Slides will make it fairly easy.
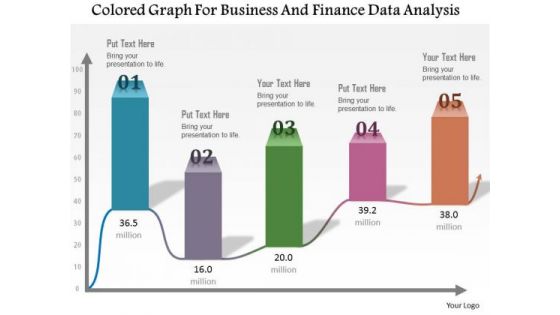
Business Diagram Colored Graph For Business And Finance Data Analysis Presentation Template
This Power Point template has been designed with graphic of colored bar graph. Use this slide to represent five steps of any business process. Use this diagram for your business presentations and get exclusive comments on your efforts.
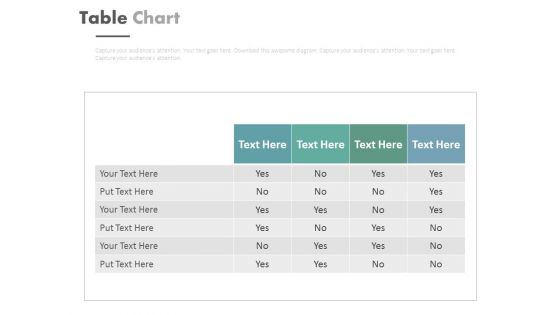
Table Chart For Balanced Scorecard Measures Powerpoint Slides
This PowerPoint template contains graphics of table chart. You may download this PPT slide design to display balanced scorecard measures. You can easily customize this template to make it more unique as per your need.

 Home
Home