Cost Icon
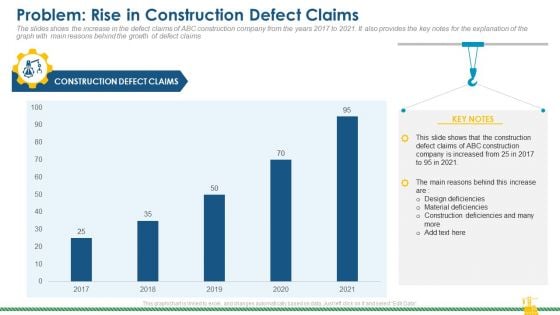
Rising Construction Defect Claims Against The Corporation Problem Rise In Construction Defect Claims Diagrams PDF
The slides shows the increase in the defect claims of ABC construction company from the years 2017 to 2021. It also provides the key notes for the explanation of the graph with main reasons behind the growth of defect claims. Deliver and pitch your topic in the best possible manner with this rising construction defect claims against the corporation problem rise in construction defect claims diagrams pdf. Use them to share invaluable insights on defect, claims, material deficiencies, design deficiencies and impress your audience. This template can be altered and modified as per your expectations. So, grab it now.
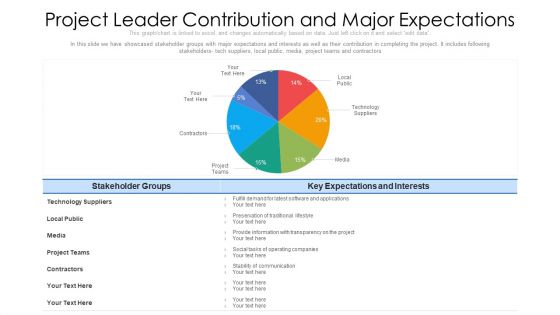
Project Leader Contribution And Major Expectations Ppt PowerPoint Presentation File Diagrams PDF
In this slide we have showcased stakeholder groups with major expectations and interests as well as their contribution in completing the project. It includes following stakeholders- tech suppliers, local public, media, project teams and contractors. Pitch your topic with ease and precision using this project leader contribution and major expectations ppt powerpoint presentation file diagrams pdf. This layout presents information on technology, media, contractors. It is also available for immediate download and adjustment. So, changes can be made in the color, design, graphics or any other component to create a unique layout.
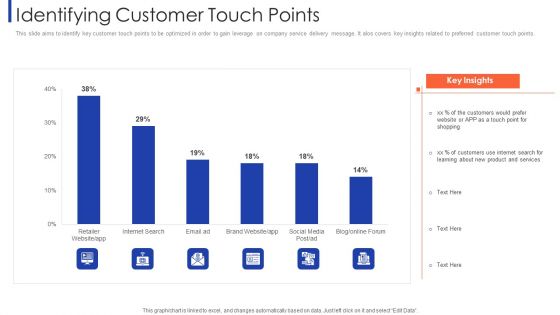
Customer Relationship Strategy For Building Loyalty Identifying Customer Touch Points Diagrams PDF
This slide aims to identify key customer touch points to be optimized in order to gain leverage on company service delivery message. It alos covers key insights related to preferred customer touch points. Deliver an awe inspiring pitch with this creative customer relationship strategy for building loyalty identifying customer touch points diagrams pdf bundle. Topics like retailer website, internet search, brand website, social media can be discussed with this completely editable template. It is available for immediate download depending on the needs and requirements of the user.
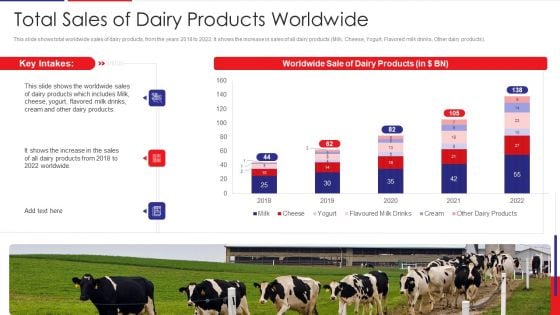
Examination Of Buyer Mindset Towards Dairy Products Total Sales Of Dairy Products Worldwide Diagrams PDF
This slide shows total worldwide sales of dairy products, from the years 2018 to 2022. It shows the increase in sales of all dairy products Milk, Cheese, Yogurt, Flavored milk drinks, Other dairy products. Deliver and pitch your topic in the best possible manner with this examination of buyer mindset towards dairy products total sales of dairy products worldwide diagrams pdf. Use them to share invaluable insights on total sales of dairy products worldwide and impress your audience. This template can be altered and modified as per your expectations. So, grab it now.
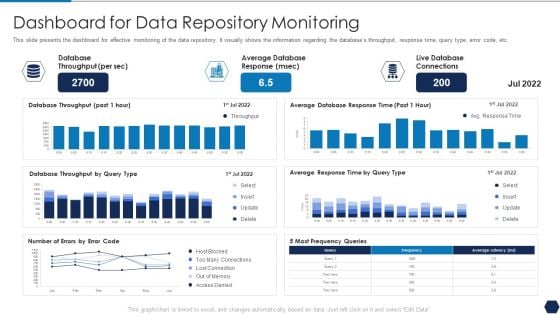
Tactical Plan For Upgrading DBMS Dashboard For Data Repository Monitoring Diagrams PDF
This slide presents the dashboard for effective monitoring of the data repository. It visually shows the information regarding the databases throughput, response time, query type, error code, etc. Deliver and pitch your topic in the best possible manner with this tactical plan for upgrading dbms dashboard for data repository monitoring diagrams pdf. Use them to share invaluable insights on database throughput, average database response, live database connections and impress your audience. This template can be altered and modified as per your expectations. So, grab it now.
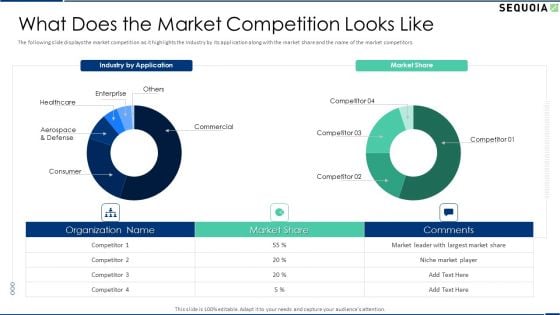
Sequoia Company Capital Raising Elevator What Does The Market Competition Looks Like Diagrams PDF
The following slide displays the market competition as it highlights the Industry by its application along with the market share and the name of the market competitors. Deliver and pitch your topic in the best possible manner with this sequoia company capital raising elevator what does the market competition looks like diagrams pdf. Use them to share invaluable insights on enterprise, commercial, consumer, market share and impress your audience. This template can be altered and modified as per your expectations. So, grab it now.
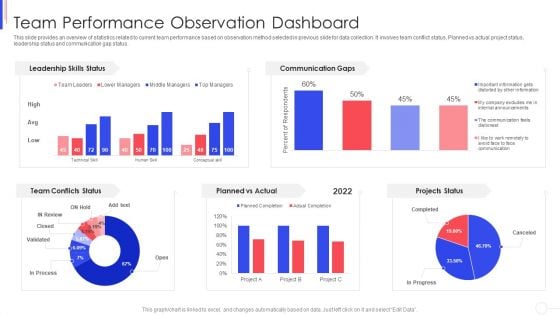
Strategy To Improve Team Proficiency Team Performance Observation Dashboard Diagrams PDF
This slide provides an overview of statistics related to current team performance based on observation method selected in previous slide for data collection. It involves team conflict status, Planned vs actual project status, leadership status and communication gap status. Deliver an awe inspiring pitch with this creative proficiency team performance observation dashboard diagrams pdf bundle. Topics like team performance observation dashboard can be discussed with this completely editable template. It is available for immediate download depending on the needs and requirements of the user.
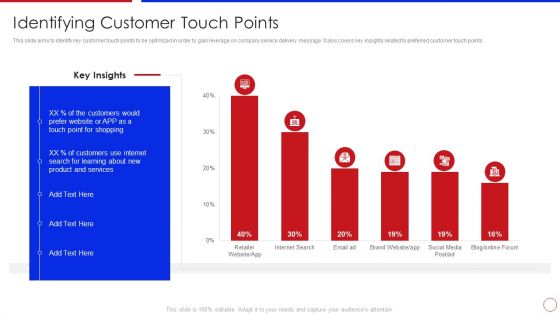
Strategy To Enhance Buyer Intimacy Identifying Customer Touch Points Ppt Infographics Diagrams PDF
This slide aims to identify key customer touch points to be optimized in order to gain leverage on company service delivery message. It alos covers key insights related to preferred customer touch points. Deliver and pitch your topic in the best possible manner with this strategy to enhance buyer intimacy identifying customer touch points ppt infographics diagrams pdf. Use them to share invaluable insights on identifying customer touch points and impress your audience. This template can be altered and modified as per your expectations. So, grab it now.
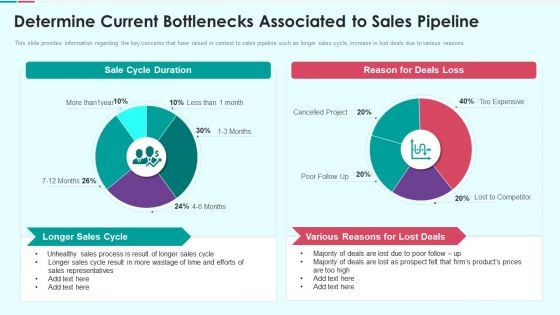
Sales Funnel Management For Revenue Generation Determine Current Bottlenecks Diagrams PDF
This slide provides information regarding the key concerns that have raised in context to sales pipeline such as longer sales cycle, increase in lost deals due to various reasons. Deliver and pitch your topic in the best possible manner with this sales funnel management for revenue generation determine current bottlenecks diagrams pdf Use them to share invaluable insights on longer sales cycle, various reasons for lost deals, sales representatives and impress your audience. This template can be altered and modified as per your expectations. So, grab it now.
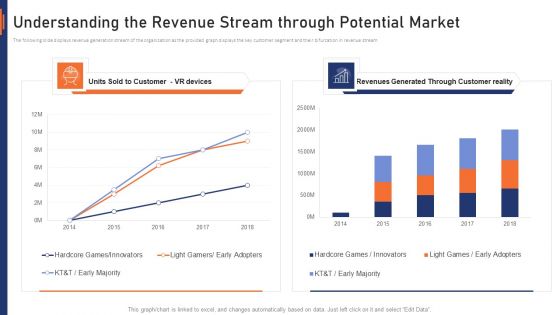
VR Market Capital Raising Elevator Pitch Deck Understanding The Revenue Stream Through Potential Market Diagrams PDF
The following slide displays revenue generation stream of the organization as the provided graph displays the key customer segment and their bifurcation in revenue stream. Deliver and pitch your topic in the best possible manner with this vr market capital raising elevator pitch deck understanding the revenue stream through potential market diagrams pdf. Use them to share invaluable insights on understanding the revenue stream through potential market and impress your audience. This template can be altered and modified as per your expectations. So, grab it now.
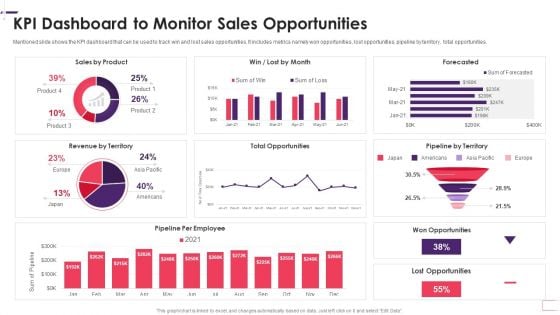
Enhancing Stp Strategies For A Successful Market Promotion Kpi Dashboard To Monitor Diagrams PDF
Mentioned slide shows the KPI dashboard that can be used to track win and lost sales opportunities. It includes metrics namely won opportunities, lost opportunities, pipeline by territory, total opportunities. Deliver and pitch your topic in the best possible manner with this enhancing stp strategies for a successful market promotion kpi dashboard to monitor diagrams pdf. Use them to share invaluable insights on kpi dashboard to monitor sales opportunities and impress your audience. This template can be altered and modified as per your expectations. So, grab it now.
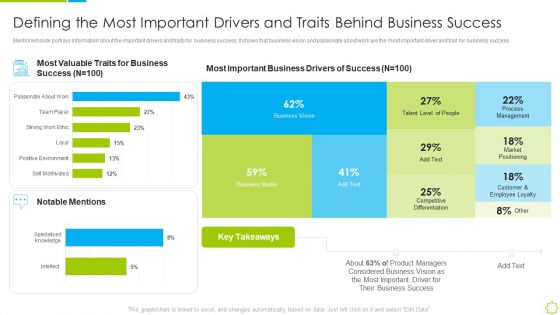
Launch New Sales Enablement Program Lead Generation Defining The Most Important Drivers Diagrams PDF
Mentioned slide portrays information about the important drivers and traits for business success. It shows that business vision and passionate about work are the most important driver and trait for business success. Deliver an awe inspiring pitch with this creative launch new sales enablement program lead generation defining the most important drivers diagrams pdf bundle. Topics like defining the most important drivers and traits behind business success can be discussed with this completely editable template. It is available for immediate download depending on the needs and requirements of the user.
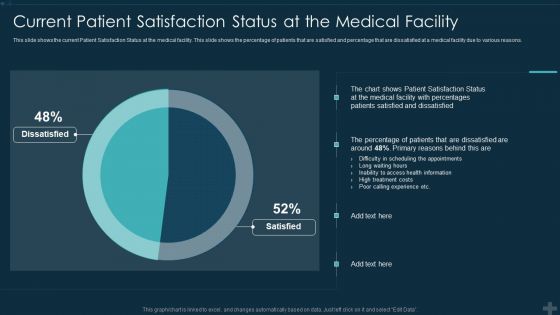
Application Patient Satisfaction Tactics Enhance Clinical Results Current Patient Satisfaction Status Diagrams PDF
This slide shows the current Patient Satisfaction Status at the medical facility. This slide shows the percentage of patients that are satisfied and percentage that are dissatisfied at a medical facility due to various reasons. Deliver an awe inspiring pitch with this creative application patient satisfaction tactics enhance clinical results current patient satisfaction status diagrams pdf bundle. Topics like current patient satisfaction status at the medical facility can be discussed with this completely editable template. It is available for immediate download depending on the needs and requirements of the user.
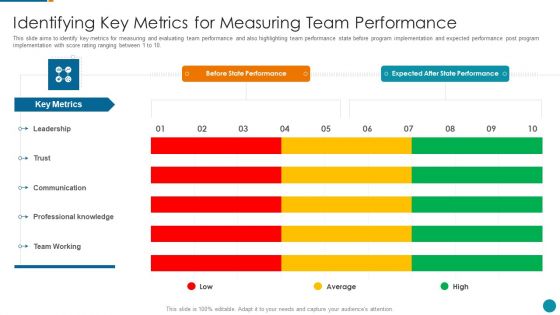
Strategic Procedure To Improve Employee Efficiency Identifying Key Metrics For Measuring Diagrams PDF
This slide aims to identify key metrics for measuring and evaluating team performance and also highlighting team performance state before program implementation and expected performance post program implementation with score rating ranging between 1 to 10.Deliver and pitch your topic in the best possible manner with this strategic procedure to improve employee efficiency identifying key metrics for measuring diagrams pdf Use them to share invaluable insights on expected after state performance, professional knowledge, communication and impress your audience. This template can be altered and modified as per your expectations. So, grab it now.
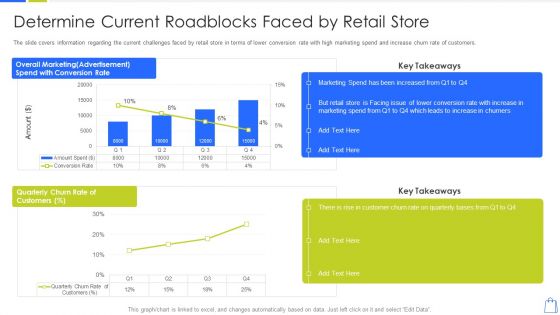
Redefining Experiential Retail Marketing Determine Current Roadblocks Faced By Retail Store Diagrams PDF
The slide covers information regarding the current challenges faced by retail store in terms of lower conversion rate with high marketing spend and increase churn rate of customers. Deliver and pitch your topic in the best possible manner with this redefining experiential retail marketing determine current roadblocks faced by retail store diagrams pdf. Use them to share invaluable insights on determine current roadblocks faced by retail store and impress your audience. This template can be altered and modified as per your expectations. So, grab it now.
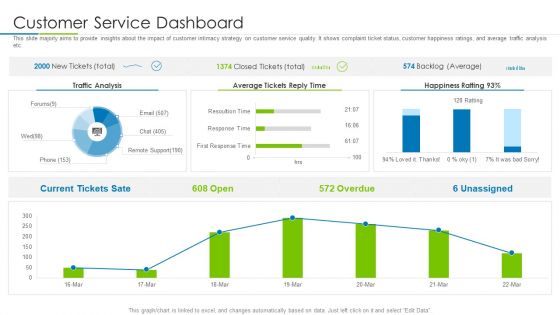
Customer Rapport Strategy To Build Loyal Client Base Customer Service Dashboard Diagrams PDF
This slide majorly aims to provide insights about the impact of customer intimacy strategy on customer service quality. It shows complaint ticket status, customer happiness ratings, and average traffic analysis etc. Deliver and pitch your topic in the best possible manner with this customer rapport strategy to build loyal client base customer service dashboard diagrams pdf. Use them to share invaluable insights on customer service dashboard and impress your audience. This template can be altered and modified as per your expectations. So, grab it now.
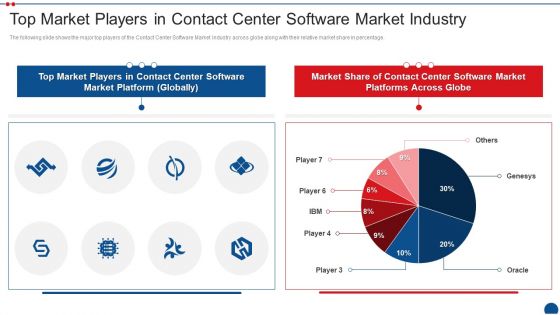
Call Center Application Market Industry Top Market Players In Contact Center Software Market Industry Diagrams PDF
The following slide shows the major top players of the Contact Center Software Market Industry across globe along with their relative market share in percentage. Deliver an awe inspiring pitch with this creative call center application market industry top market players in contact center software market industry diagrams pdf bundle. Topics like top market players in contact center software market industry can be discussed with this completely editable template. It is available for immediate download depending on the needs and requirements of the user.
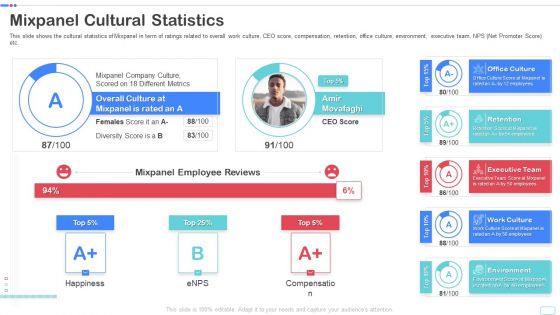
Mixpanel Capital Raising Pitch Deck Mixpanel Cultural Statistics Topics PDF Diagrams PDF
This slide shows the cultural statistics of Mixpanel in term of ratings related to overall work culture, CEO score, compensation, retention, office culture, environment, executive team, NPS Net Promoter Score etc. Deliver an awe inspiring pitch with this creative mixpanel capital raising pitch deck mixpanel cultural statistics topics pdf diagrams pdf bundle. Topics like office culture, retention, executive team, work culture, environment can be discussed with this completely editable template. It is available for immediate download depending on the needs and requirements of the user.
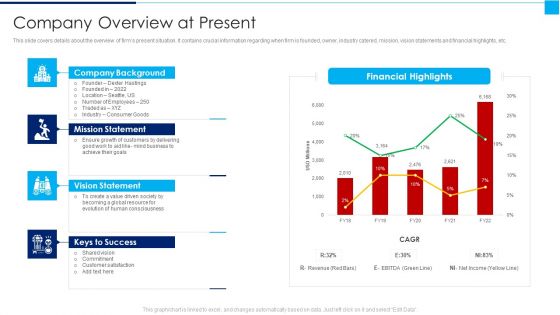
Ways To Enhance Organizations Profitability Company Overview At Present Diagrams PDF
This slide covers details about the overview of firms present situation. It contains crucial information regarding when firm is founded, owner, industry catered, mission, vision statements and financial highlights, etc. Deliver and pitch your topic in the best possible manner with this ways to enhance organizations profitability company overview at present diagrams pdf Use them to share invaluable insights on mission statement, vision statement, keys to success and impress your audience. This template can be altered and modified as per your expectations. So, grab it now.
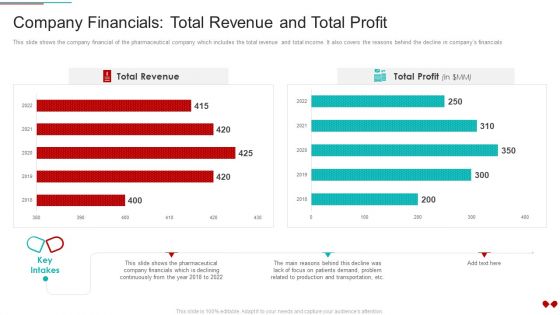
Environmental Impact Analysis For A Pharmaceutical Company Financials Total Revenue And Total Profit Diagrams PDF
This slide shows the company financial of the pharmaceutical company which includes the total revenue and total income. It also covers the reasons behind the decline in companys financialsDeliver an awe inspiring pitch with this creative Environmental Impact Analysis For A Pharmaceutical Company Financials Total Revenue And Total Profit Diagrams PDF bundle. Topics like Company Financials Total Revenue And Total Profit can be discussed with this completely editable template. It is available for immediate download depending on the needs and requirements of the user.
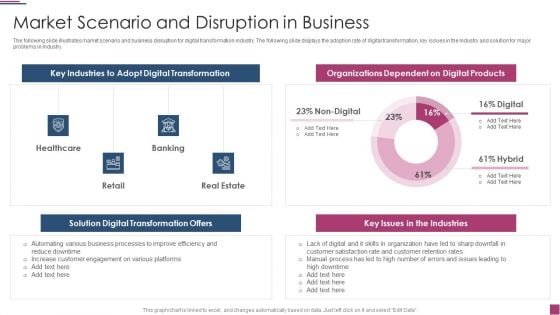
Innovation Procedure For Online Business Market Scenario And Disruption In Business Diagrams PDF
The following slide illustrates market scenario and business disruption for digital transformation industry. The following slide displays the adoption rate of digital transformation, key issues in the Industry and solution for major problems in Industry. Deliver and pitch your topic in the best possible manner with this Innovation Procedure For Online Business Market Scenario And Disruption In Business Diagrams PDF Use them to share invaluable insights on Key Industries, Solution Digital Transformation, Organizations Dependent and impress your audience. This template can be altered and modified as per your expectations. So, grab it now.
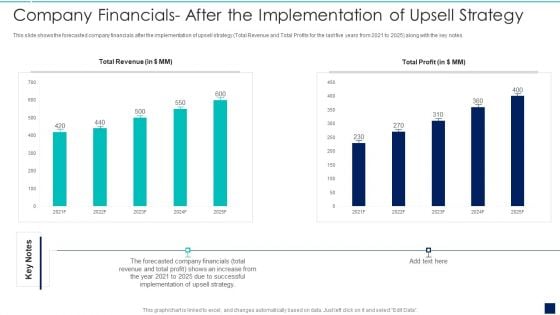
Influence Buyers To Purchase Additional High Company Financials After The Implementation Diagrams PDF
This slide shows the forecasted company financials after the implementation of upsell strategy total Revenue and Total Profits for the last five years from 2021 to 2025 along with the key notes.Deliver an awe inspiring pitch with this creative Influence Buyers To Purchase Additional High Company Financials After The Implementation Diagrams PDF bundle. Topics like Company Financials After The Implementation Of Upsell Strategy can be discussed with this completely editable template. It is available for immediate download depending on the needs and requirements of the user.
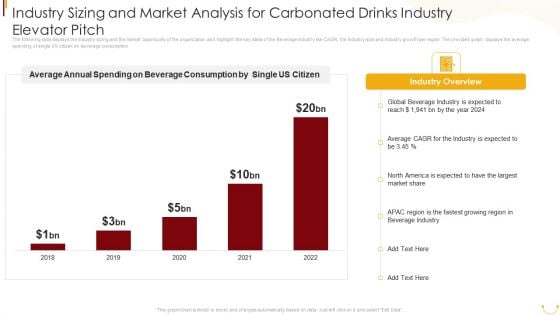
Industry Sizing And Market Analysis For Carbonated Drinks Industry Elevator Pitch Diagrams PDF
The following slide displays the Industry sizing and the market opportunity of the organization as it highlight the key stats of the Beverage industry like CAGR, the Industry size and Industry growth per region. The provided graph displays the average spending of single US citizen on beverage consumption. Deliver and pitch your topic in the best possible manner with this Industry Sizing And Market Analysis For Carbonated Drinks Industry Elevator Pitch Diagrams PDF. Use them to share invaluable insights on Average Annual Spending, Beverage Consumption, Single US Citizen, Global Beverage Industry, 2018 To 2022 and impress your audience. This template can be altered and modified as per your expectations. So, grab it now.

Insurance Company Business Plan Addressing Market Assessment For Insurance Business Diagrams PDF
This slide covers information regarding market assessment of insurance business with high competition existing. It covers details about key players and market share associated to top players. Deliver and pitch your topic in the best possible manner with this Insurance Company Business Plan Addressing Market Assessment For Insurance Business Diagrams PDF Use them to share invaluable insights on America Insurance, General Insurance, Local Competition Includes and impress your audience. This template can be altered and modified as per your expectations. So, grab it now.
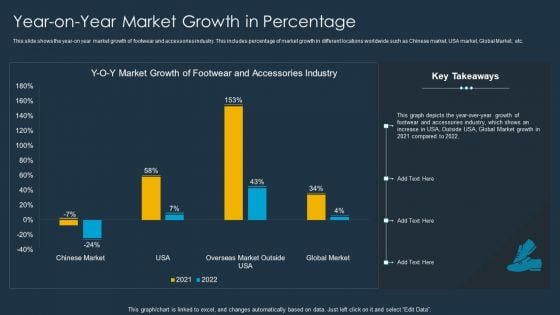
Shoe Firm Investor Pitch Deck Year On Year Market Growth In Percentage Diagrams PDF
This slide shows the year-on year market growth of footwear and accessories industry. This includes percentage of market growth in different locations worldwide such as Chinese market, USA market, Global Market, etc. Deliver an awe inspiring pitch with this creative Shoe Firm Investor Pitch Deck Year On Year Market Growth In Percentage Diagrams PDF bundle. Topics like Market Growth, Accessories Industry, Global Merket can be discussed with this completely editable template. It is available for immediate download depending on the needs and requirements of the user.
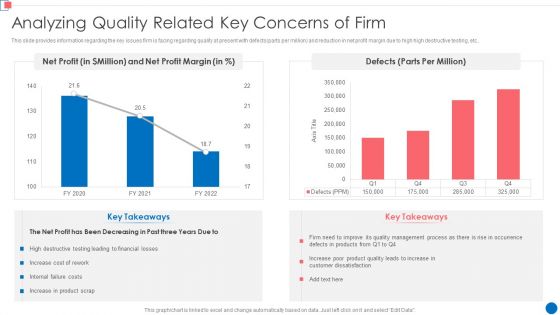
Optimize Enterprise Core Analyzing Quality Related Key Concerns Of Firm Diagrams PDF
This slide provides information regarding the key issues firm is facing regarding quality at present with defects parts per million and reduction in net profit margin due to high high destructive testing, etc. Deliver an awe inspiring pitch with this creative Optimize Enterprise Core Analyzing Quality Related Key Concerns Of Firm Diagrams PDF bundle. Topics like Net Profit, Net Profit Margin, 2020 To 2022 can be discussed with this completely editable template. It is available for immediate download depending on the needs and requirements of the user.
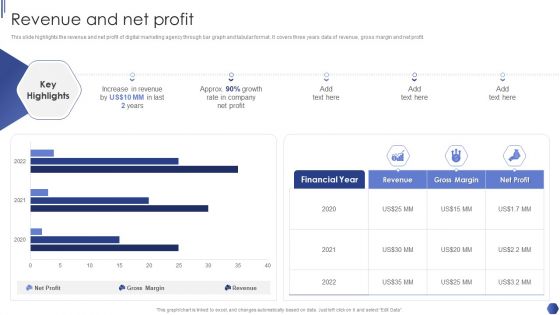
Digital Marketing Agency Business Profile Revenue And Net Profit Diagrams PDF
This slide highlights the revenue and net profit of digital marketing agency through bar graph and tabular format. It covers three years data of revenue, gross margin and net profit. Deliver and pitch your topic in the best possible manner with this Digital Marketing Agency Business Profile Revenue And Net Profit Diagrams PDF. Use them to share invaluable insights on Increase In Revenue, Growth Rate, Net Profit and impress your audience. This template can be altered and modified as per your expectations. So, grab it now.
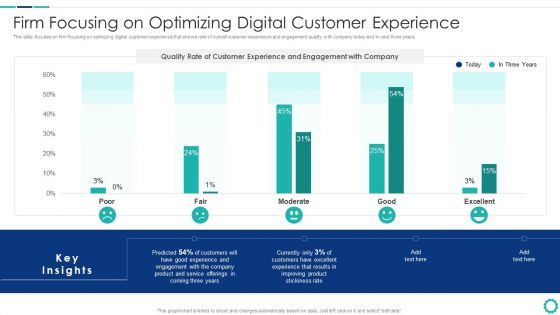
Creating Successful Strategies To Enhance Customer Experience Firm Focusing On Optimizing Digital Diagrams PDF
This slide focuses on firm focusing on optimizing digital customer experience that shows rate of overall customer experience and engagement quality with company today and in next three years.Deliver and pitch your topic in the best possible manner with this Creating Successful Strategies To Enhance Customer Experience Firm Focusing On Optimizing Digital Diagrams PDF Use them to share invaluable insights on Experience And Engagement, Improving Product, Customers Excellent and impress your audience. This template can be altered and modified as per your expectations. So, grab it now.
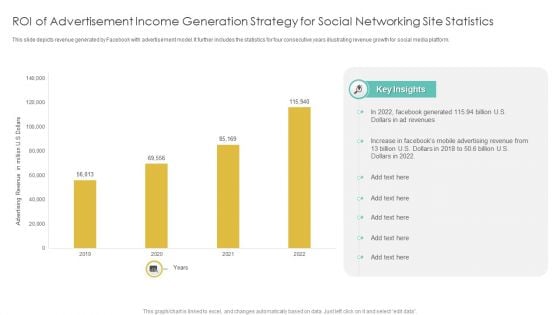
Roi Of Advertisement Income Generation Strategy For Social Networking Site Statistics Diagrams PDF
This slide depicts revenue generated by Facebook with advertisement model. It further includes the statistics for four consecutive years illustrating revenue growth for social media platform. Pitch your topic with ease and precision using this Roi Of Advertisement Income Generation Strategy For Social Networking Site Statistics Diagrams PDF. This layout presents information on Advertisement Income, Generation Strategy, Social Networking Site Statistics. It is also available for immediate download and adjustment. So, changes can be made in the color, design, graphics or any other component to create a unique layout.
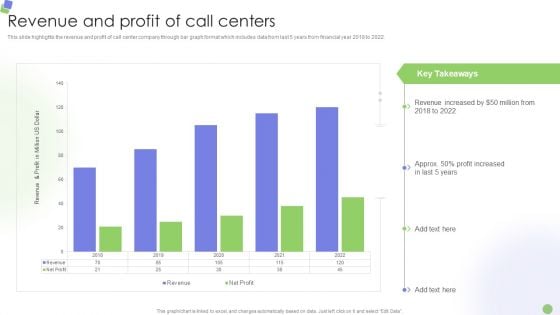
Knowledge Process Outsourcing Company Profile Revenue And Profit Of Call Centers Diagrams PDF
This slide highlights the revenue and profit of call center company through bar graph format which includes data from last 5 years from financial year 2018 to 2022.Deliver and pitch your topic in the best possible manner with this Knowledge Process Outsourcing Company Profile Revenue And Profit Of Call Centers Diagrams PDF. Use them to share invaluable insights on Revenue Increased, Profit Increased, Key Takeaways and impress your audience. This template can be altered and modified as per your expectations. So, grab it now.
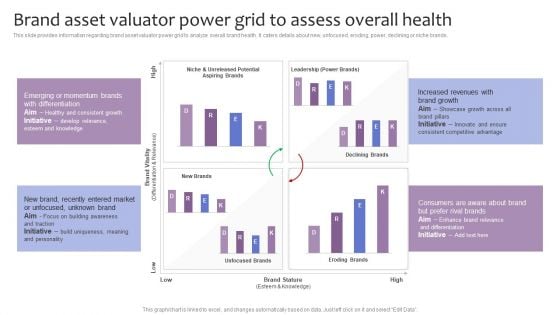
Strategic Brand Management Brand Asset Valuator Power Grid To Assess Overall Health Diagrams PDF
This slide provides information regarding brand asset valuator power grid to analyze overall brand health. It caters details about new, unfocused, eroding, power, declining or niche brands. Deliver and pitch your topic in the best possible manner with this Strategic Brand Management Brand Asset Valuator Power Grid To Assess Overall Health Diagrams PDF. Use them to share invaluable insights on Brand Vitality, Brand Stature, Declining Brands, Eroding Brands and impress your audience. This template can be altered and modified as per your expectations. So, grab it now.
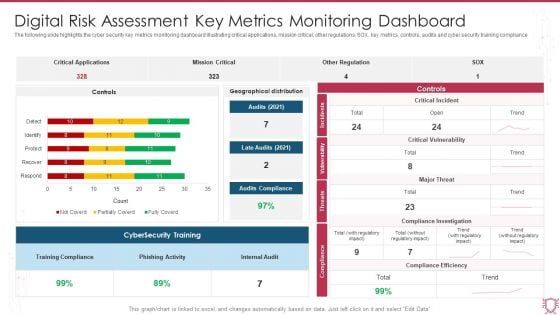
Digital Risk Assessment Key Metrics Monitoring Dashboard Ppt Ideas Diagrams PDF
The following slide highlights the cyber security key metrics monitoring dashboard illustrating critical applications, mission critical, other regulations, SOX, key metrics, controls, audits and cyber security training compliance. Showcasing this set of slides titled Digital Risk Assessment Key Metrics Monitoring Dashboard Ppt Ideas Diagrams PDF. The topics addressed in these templates are Critical Applications, Mission Critical, Other Regulation. All the content presented in this PPT design is completely editable. Download it and make adjustments in color, background, font etc. as per your unique business setting.
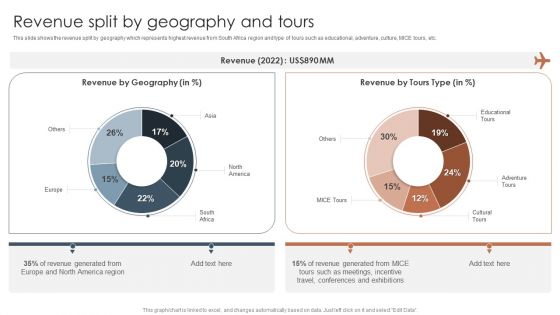
Tour And Travels Agency Profile Revenue Split By Geography And Tours Diagrams PDF
This slide shows the revenue split by geography which represents highest revenue from South Africa region and type of tours such as educational, adventure, culture, MICE tours, etc.Deliver and pitch your topic in the best possible manner with this Tour And Travels Agency Profile Revenue Split By Geography And Tours Diagrams PDF. Use them to share invaluable insights on Revenue Generated, America Region, Such As Meetings and impress your audience. This template can be altered and modified as per your expectations. So, grab it now.
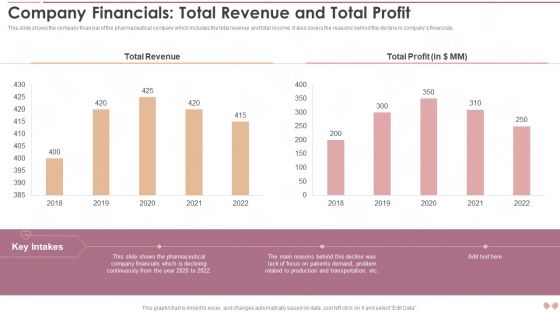
Innovative Business Model Of Pharmaceutical Company Financials Total Revenue And Total Profit Diagrams PDF
This slide shows the key impacts of the strategies on companys operations. It includes operational and environmental impacts such as accurate demand forecasting, reward research and development etc.Deliver and pitch your topic in the best possible manner with this Innovative Business Model Of Pharmaceutical Company Financials Total Revenue And Total Profit Diagrams PDF. Use them to share invaluable insights on Total Revenue, Total Profit, Related Production and impress your audience. This template can be altered and modified as per your expectations. So, grab it now.
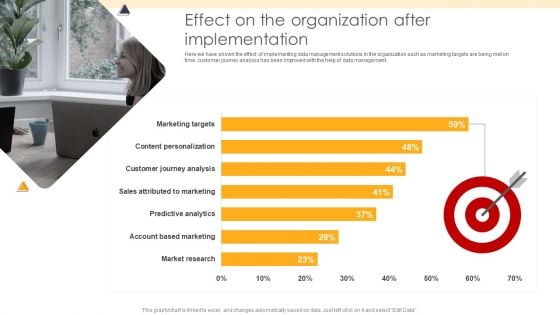
ETL Repository Effect On The Organization After Implementation Ppt PowerPoint Presentation Portfolio Diagrams PDF
Here we have shown the effect of implementing data management solutions in the organization such as marketing targets are being met on time, customer journey analysis has been improved with the help of data management. Deliver an awe inspiring pitch with this creative ETL Repository Effect On The Organization After Implementation Ppt PowerPoint Presentation Portfolio Diagrams PDF bundle. Topics like Market Research, Account Based, Sales Attributed can be discussed with this completely editable template. It is available for immediate download depending on the needs and requirements of the user.
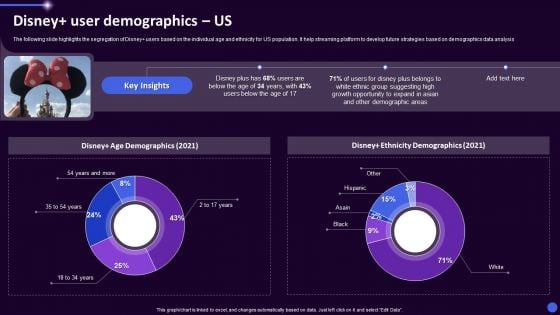
Disney Plus OTT Platform Company Summary Disney User Demographics Us Ppt Gallery Diagrams PDF
The following slide highlights the segregation of Disney users based on the individual age and ethnicity for US population. It help streaming platform to develop future strategies based on demographics data analysis. Deliver an awe inspiring pitch with this creative Disney Plus OTT Platform Company Summary Disney User Demographics Us Ppt Gallery Diagrams PDF bundle. Topics like Disney Ethnicity Demographics, Disney Age Demographics, 2021 can be discussed with this completely editable template. It is available for immediate download depending on the needs and requirements of the user.
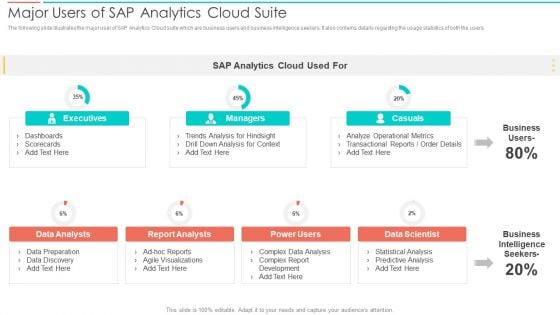
SAC Planning And Implementation Major Users Of SAP Analytics Cloud Suite Diagrams PDF
The following slide illustrates the major user of SAP Analytics Cloud suite which are business users and business intelligence seekers. It also contains details regarding the usage statistics of both the users. Deliver an awe inspiring pitch with this creative SAC Planning And Implementation Major Users Of SAP Analytics Cloud Suite Diagrams PDF bundle. Topics like Executives, Casuals, Business Intelligence Seekers, Data Scientist can be discussed with this completely editable template. It is available for immediate download depending on the needs and requirements of the user.
B2B Sales Techniques Playbook Sales Management Activities Tracking Dashboard Diagrams PDF
This slide provides information regarding sales management activities tracking dashboard to measure closed business, sales pipeline, sales activity by sales rep, month over month growth, forecast by month, etc. Deliver and pitch your topic in the best possible manner with this B2B Sales Techniques Playbook Sales Management Activities Tracking Dashboard Diagrams PDF. Use them to share invaluable insights on Sales Pipeline, Sales Activity, Sales Pipeline and impress your audience. This template can be altered and modified as per your expectations. So, grab it now.
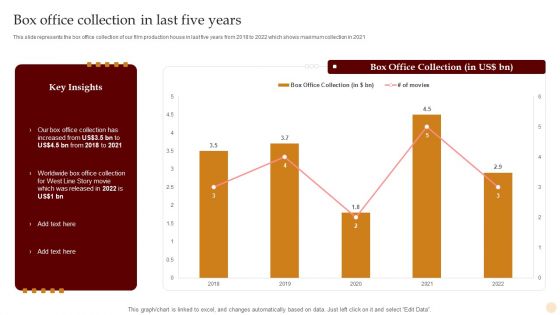
Motion Pictures Production Company Profile Box Office Collection In Last Five Years Diagrams PDF
This slide represents the box office collection of our film production house in last five years from 2018 to 2022 which shows maximum collection in 2021. Deliver and pitch your topic in the best possible manner with this Motion Pictures Production Company Profile Box Office Collection In Last Five Years Diagrams PDF. Use them to share invaluable insights on Box Office Collection, 2018 To 2022 and impress your audience. This template can be altered and modified as per your expectations. So, grab it now.
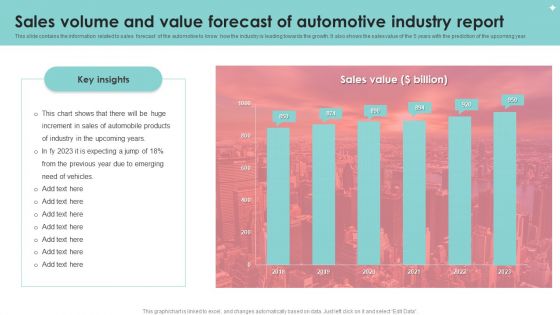
Sales Volume And Value Forecast Of Automotive Industry Report Diagrams PDF
This slide contains the information related to sales forecast of the automotive to know how the industry is leading towards the growth. It also shows the sales value of the 5 years with the prediction of the upcoming year. Showcasing this set of slides titled Sales Volume And Value Forecast Of Automotive Industry Report Diagrams PDF. The topics addressed in these templates are Sales Volume, Value Forecast, Automotive Industry Report. All the content presented in this PPT design is completely editable. Download it and make adjustments in color, background, font etc. as per your unique business setting.
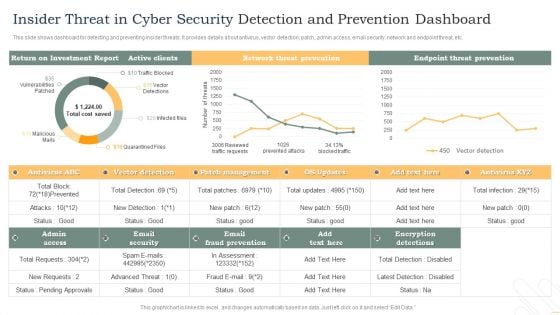
Insider Threat In Cyber Security Detection And Prevention Dashboard Diagrams PDF
This slide shows dashboard for detecting and preventing insider threats. It provides details about antivirus, vector detection, patch, admin access, email security, network and endpoint threat, etc. Pitch your topic with ease and precision using this Insider Threat In Cyber Security Detection And Prevention Dashboard Diagrams PDF. This layout presents information on Active Clients, Network Threat Prevention, Endpoint Threat Prevention. It is also available for immediate download and adjustment. So, changes can be made in the color, design, graphics or any other component to create a unique layout.
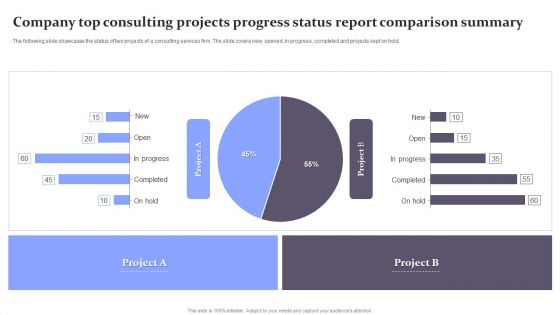
Company Top Consulting Projects Progress Status Report Comparison Summary Diagrams PDF
The following slide showcases the status of two projects of a consulting services firm. The slide covers new, opened, in progress, completed and projects kept on hold. Pitch your topic with ease and precision using this Company Top Consulting Projects Progress Status Report Comparison Summary Diagrams PDF. This layout presents information on Company Top Consulting Projects Progress, Status Report Comparison Summary. It is also available for immediate download and adjustment. So, changes can be made in the color, design, graphics or any other component to create a unique layout.
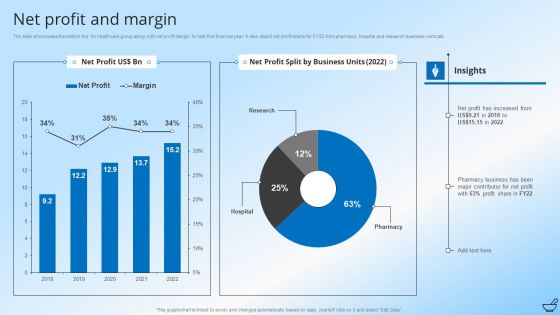
Pharmaceutical And Clinical Research Summary Net Profit And Margin Diagrams PDF
The slide showcases the bottom line for healthcare group along with net profit margin for last five financial year. It also depict net profit share for FY22 from pharmacy, hospital and research business verticals. Deliver an awe inspiring pitch with this creative Pharmaceutical And Clinical Research Summary Net Profit And Margin Diagrams PDF bundle. Topics like Pharmacy Business, Profit Share, Business Units can be discussed with this completely editable template. It is available for immediate download depending on the needs and requirements of the user.

IT Application Services Company Outline Revenue And Profit By Category Diagrams PDF
The slide highlights the historical revenue and profit for services and solutions. It also depicts revenue and profit split for services and solutions for current year along with key insights. Deliver and pitch your topic in the best possible manner with this IT Application Services Company Outline Revenue And Profit By Category Diagrams PDF. Use them to share invaluable insights on Revenue Split, Profit Split, Services and impress your audience. This template can be altered and modified as per your expectations. So, grab it now.
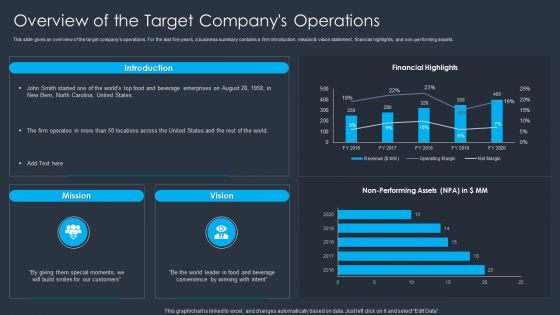
Merger And Acquisition Buying Strategy For Business Growth Overview Of The Target Companys Operations Diagrams PDF
This slide gives an overview of the target companys operations. For the last five years, a business summary contains a firm introduction, mission and vision statement, financial highlights, and non performing assets. Deliver and pitch your topic in the best possible manner with this Merger And Acquisition Buying Strategy For Business Growth Overview Of The Target Companys Operations Diagrams PDF. Use them to share invaluable insights on Customers, Financial Highlights, Enterprises and impress your audience. This template can be altered and modified as per your expectations. So, grab it now.
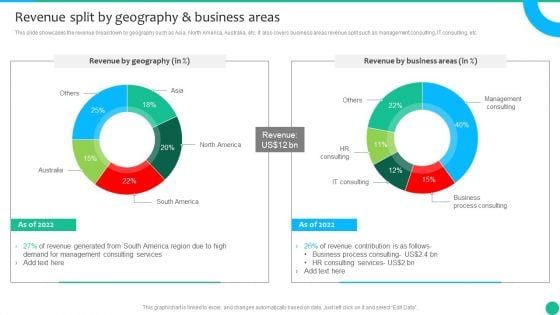
Strategic Management Consultancy Business Profile Revenue Split By Geography And Business Areas Diagrams PDF
This slide showcases the revenue breakdown by geography such as Asia, North America, Australia, etc. It also covers business areas revenue split such as management consulting, IT consulting, etc. Deliver and pitch your topic in the best possible manner with this Strategic Management Consultancy Business Profile Revenue Split By Geography And Business Areas Diagrams PDF. Use them to share invaluable insights on Demand For Management, Consulting Services, Revenue and impress your audience. This template can be altered and modified as per your expectations. So, grab it now.
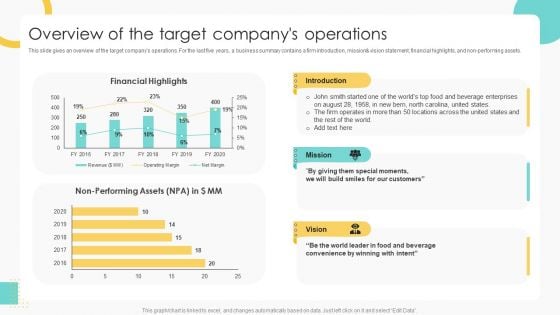
Buy Side Merger And Acquisition Pitch Book Overview Of The Target Companys Operations Diagrams PDF
This slide gives an overview of the target companys operations. For the last five years, a business summary contains a firm introduction, mission and vision statement, financial highlights, and non performing assets. Deliver and pitch your topic in the best possible manner with this Buy Side Merger And Acquisition Pitch Book Overview Of The Target Companys Operations Diagrams PDF. Use them to share invaluable insights on Financial Highlights, Enterprises, Customers and impress your audience. This template can be altered and modified as per your expectations. So, grab it now.
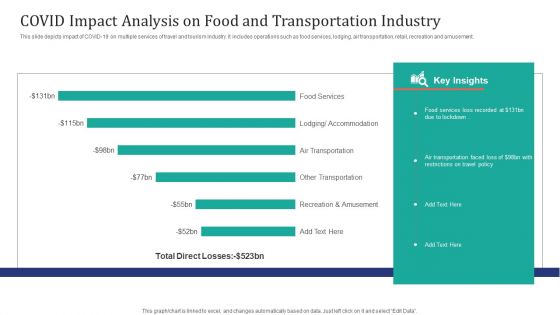
COVID Impact Analysis On Food And Transportation Industry Ppt Infographic Template Diagrams PDF
This slide depicts impact of COVID-19 on multiple services of travel and tourism industry. It includes operations such as food services, lodging, air transportation, retail, recreation and amusement. Showcasing this set of slides titled COVID Impact Analysis On Food And Transportation Industry Ppt Infographic Template Diagrams PDF. The topics addressed in these templates are Food Services, Air Transportation Faced, Restrictions Travel Policy. All the content presented in this PPT design is completely editable. Download it and make adjustments in color, background, font etc. as per your unique business setting.
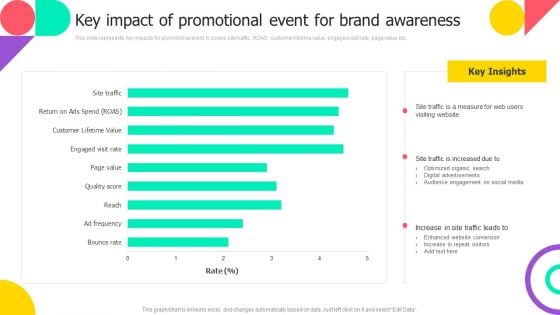
Brand Engagement Promotional Campaign Implementation Key Impact Of Promotional Event For Brand Awareness Diagrams PDF
This slide represents key impacts for promotional event. It covers site traffic, ROAS, customer lifetime value, engaged visit rate, page value etc. Find a pre designed and impeccable Brand Engagement Promotional Campaign Implementation Key Impact Of Promotional Event For Brand Awareness Diagrams PDF. The templates can ace your presentation without additional effort. You can download these easy to edit presentation templates to make your presentation stand out from others. So, what are you waiting for Download the template from Slidegeeks today and give a unique touch to your presentation.
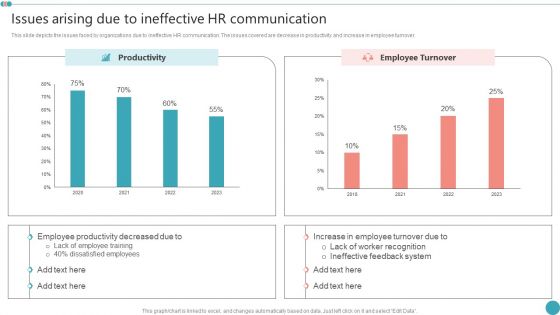
Issues Arising Due To Ineffective HR Communication Employee Engagement HR Strategy At Organization Diagrams PDF
This slide depicts the issues faced by organizations due to ineffective HR communication. The issues covered are decrease in productivity and increase in employee turnover.Want to ace your presentation in front of a live audience Our Issues Arising Due To Ineffective HR Communication Employee Engagement HR Strategy At Organization Diagrams PDF can help you do that by engaging all the users towards you.. Slidegeeks experts have put their efforts and expertise into creating these impeccable powerpoint presentations so that you can communicate your ideas clearly. Moreover, all the templates are customizable, and easy-to-edit and downloadable. Use these for both personal and commercial use.
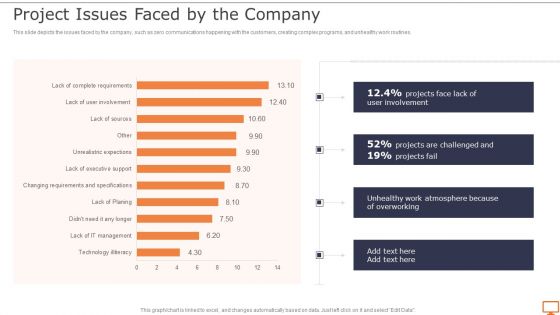
Deploying XP Practices To Enhance Operational Efficiency Project Issues Faced By The Company Diagrams PDF
This slide depicts the issues faced by the company, such as zero communications happening with the customers, creating complex programs, and unhealthy work routines.Want to ace your presentation in front of a live audience Our Deploying XP Practices To Enhance Operational Efficiency Project Issues Faced By The Company Diagrams PDF can help you do that by engaging all the users towards you.. Slidegeeks experts have put their efforts and expertise into creating these impeccable powerpoint presentations so that you can communicate your ideas clearly. Moreover, all the templates are customizable, and easy-to-edit and downloadable. Use these for both personal and commercial use.
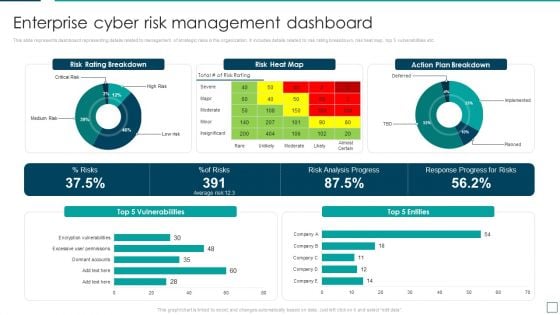
Strategic Risk Management And Mitigation Plan Enterprise Cyber Risk Management Dashboard Diagrams PDF
This slide represents dashboard representing details related to management of strategic risks in the organization. It includes details related to risk rating breakdown, risk heat map, top 5 vulnerabilities etc. From laying roadmaps to briefing everything in detail, our templates are perfect for you. You can set the stage with your presentation slides. All you have to do is download these easy to edit and customizable templates. Strategic Risk Management And Mitigation Plan Enterprise Cyber Risk Management Dashboard Diagrams PDF will help you deliver an outstanding performance that everyone would remember and praise you for. Do download this presentation today.
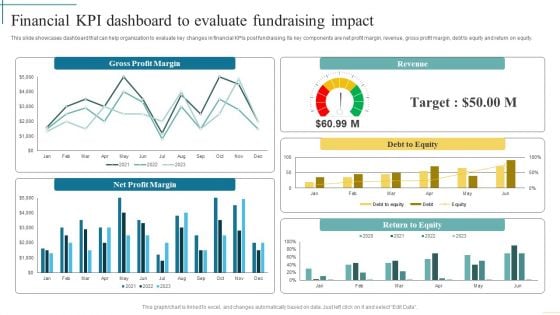
Financial Kpi Dashboard To Evaluate Fundraising Impact Developing Fundraising Techniques Diagrams PDF
This slide showcases dashboard that can help organization to evaluate key changes in financial KPIs post fundraising. Its key components are net profit margin, revenue, gross profit margin, debt to equity and return on equity. From laying roadmaps to briefing everything in detail, our templates are perfect for you. You can set the stage with your presentation slides. All you have to do is download these easy-to-edit and customizable templates. Financial Kpi Dashboard To Evaluate Fundraising Impact Developing Fundraising Techniques Diagrams PDF will help you deliver an outstanding performance that everyone would remember and praise you for. Do download this presentation today.
Process Enhancement Plan To Boost Sales Performance Website Performance Tracking And Monitoring Dashboard Diagrams PDF
The following slide showcases a dashboard to track and measure website performance. It includes key elements such as visits, average session duration, bounce rate, page views, goal conversion, visits by week, traffic sources, top channels by conversions, etc. From laying roadmaps to briefing everything in detail, our templates are perfect for you. You can set the stage with your presentation slides. All you have to do is download these easy to edit and customizable templates. Process Enhancement Plan To Boost Sales Performance Website Performance Tracking And Monitoring Dashboard Diagrams PDF will help you deliver an outstanding performance that everyone would remember and praise you for. Do download this presentation today.
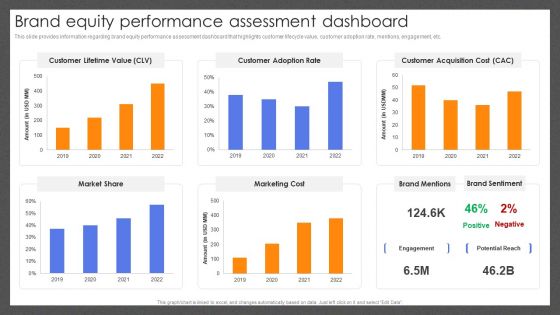
Guide For Effective Brand Brand Equity Performance Assessment Dashboard Diagrams PDF
This slide provides information regarding brand equity performance assessment dashboard that highlights customer lifecycle value, customer adoption rate, mentions, engagement, etc. Present like a pro with Guide For Effective Brand Brand Equity Performance Assessment Dashboard Diagrams PDF Create beautiful presentations together with your team, using our easy-to-use presentation slides. Share your ideas in real-time and make changes on the fly by downloading our templates. So whether youre in the office, on the go, or in a remote location, you can stay in sync with your team and present your ideas with confidence. With Slidegeeks presentation got a whole lot easier. Grab these presentations today.
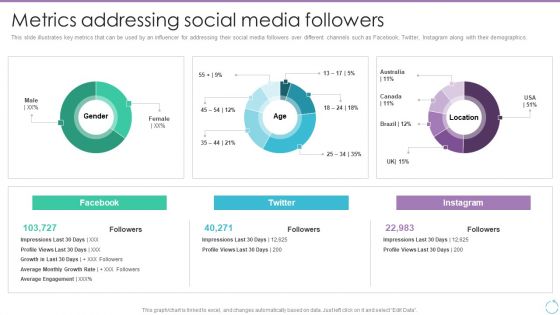
Personal Branding Plan For Executives Metrics Addressing Social Media Followers Diagrams PDF
This slide illustrates key metrics that can be used by an influencer for addressing their social media followers over different channels such as Facebook, Twitter, Instagram along with their demographics. The Personal Branding Plan For Executives Metrics Addressing Social Media Followers Diagrams PDF is a compilation of the most recent design trends as a series of slides. It is suitable for any subject or industry presentation, containing attractive visuals and photo spots for businesses to clearly express their messages. This template contains a variety of slides for the user to input data, such as structures to contrast two elements, bullet points, and slides for written information. Slidegeeks is prepared to create an impression.
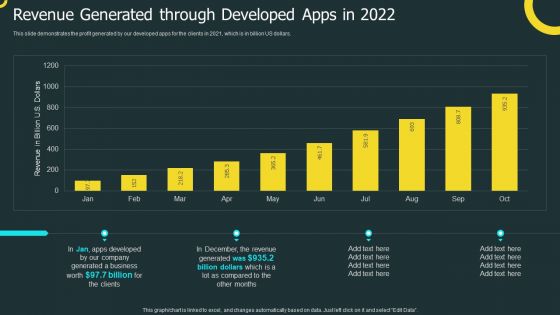
IOS Application Development Revenue Generated Through Developed Apps In 2022 Diagrams PDF
This slide demonstrates the profit generated by our developed apps for the clients in 2021, which is in billion US dollars. Slidegeeks has constructed IOS Application Development Revenue Generated Through Developed Apps In 2022 Diagrams PDF after conducting extensive research and examination. These presentation templates are constantly being generated and modified based on user preferences and critiques from editors. Here, you will find the most attractive templates for a range of purposes while taking into account ratings and remarks from users regarding the content. This is an excellent jumping off point to explore our content and will give new users an insight into our top notch PowerPoint Templates.
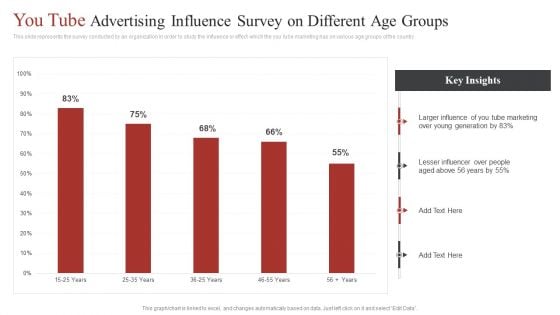
You Tube Advertising Influence Survey On Different Age Groups Ppt Diagram Ppt PDF
This slide represents the survey conducted by an organization in order to study the influence or effect which the you tube marketing has on various age groups of the country. Pitch your topic with ease and precision using this You Tube Advertising Influence Survey On Different Age Groups Ppt Diagram Ppt PDF. This layout presents information on Larger Influence, You Tube Marketing, Young Generation. It is also available for immediate download and adjustment. So, changes can be made in the color, design, graphics or any other component to create a unique layout.

Customer Support Center Call Center Action Plan Dashboard Highlighting Agent Diagrams PDF
This slide showcases dashboard for call center action plan which includes total calls, average answer speed, abandon rate, average calls per minute with agent performance and overall customer satisfaction score. Want to ace your presentation in front of a live audience Our Customer Support Center Call Center Action Plan Dashboard Highlighting Agent Diagrams PDF can help you do that by engaging all the users towards you.. Slidegeeks experts have put their efforts and expertise into creating these impeccable powerpoint presentations so that you can communicate your ideas clearly. Moreover, all the templates are customizable, and easy-to-edit and downloadable. Use these for both personal and commercial use.

Comprehensive Market Research Guide Growth Opportunities In Market Research Industry Diagrams PDF
The following slide outlines market size of global market research industry. Information covered in this slide is related to projected revenue from 2022 to 2030 and compound annual growth rate CAGR. Make sure to capture your audiences attention in your business displays with our gratis customizable Comprehensive Market Research Guide Growth Opportunities In Market Research Industry Diagrams PDF. These are great for business strategies, office conferences, capital raising or task suggestions. If you desire to acquire more customers for your tech business and ensure they stay satisfied, create your own sales presentation with these plain slides.

 Home
Home