Cost Icon
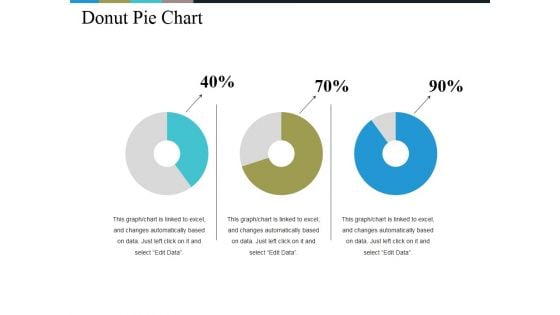
Donut Pie Chart Ppt PowerPoint Presentation Infographics Background Images
This is a donut pie chart ppt powerpoint presentation infographics background images. This is a three stage process. The stages in this process are chart, percentage, business, management, process.
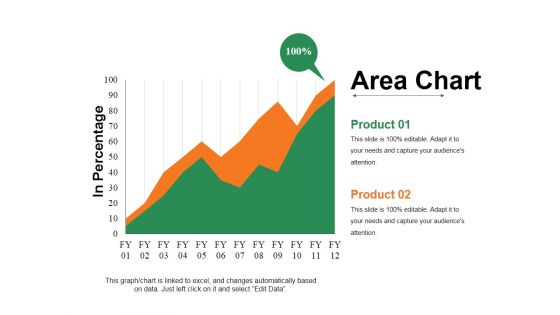
Area Chart Ppt PowerPoint Presentation Infographic Template Guidelines
This is a area chart ppt powerpoint presentation infographic template guidelines. This is a two stage process. The stages in this process are in percentage, chart, business, growth, strategy.
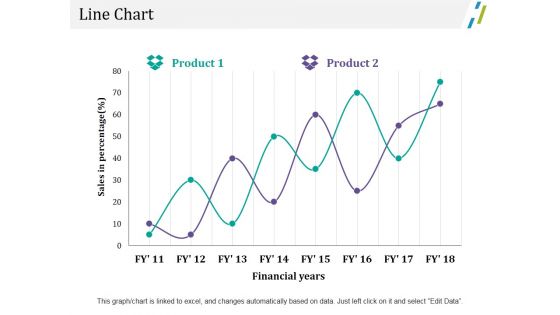
Line Chart Ppt PowerPoint Presentation Outline File Formats
This is a line chart ppt powerpoint presentation outline file formats. This is a two stage process. The stages in this process are business, marketing, sales in percentage, financial years, chart.
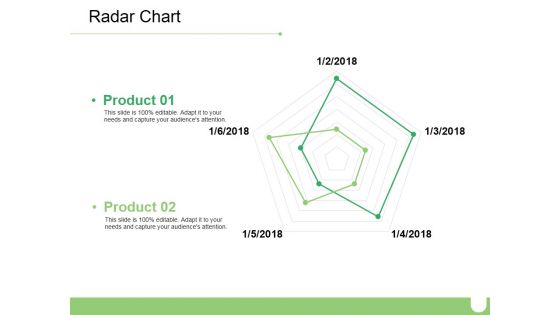
Radar Chart Ppt PowerPoint Presentation Slides Designs Download
This is a radar chart ppt powerpoint presentation slides designs download. This is a two stage process. The stages in this process are business, radar chart, marketing, graph, strategy.
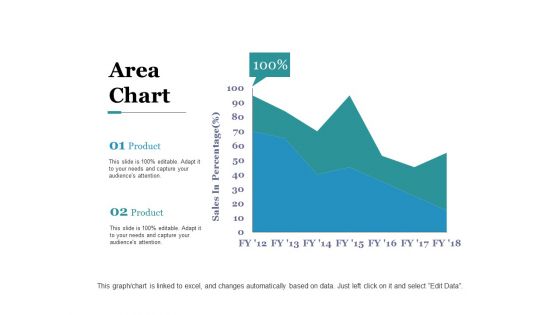
Area Chart Ppt PowerPoint Presentation Outline Graphic Tips
This is a area chart ppt powerpoint presentation outline graphic tips. This is a two stage process. The stages in this process are business, sales in percentage, area chart, percentage, marketing.
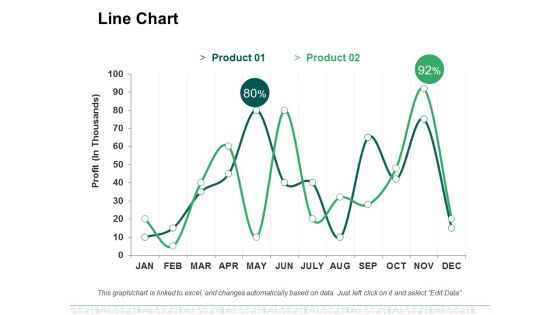
Line Chart Ppt PowerPoint Presentation File Designs Download
This is a line chart ppt powerpoint presentation file designs download. This is a two stage process. The stages in this process are business, marketing, profit, line chart, percentage.
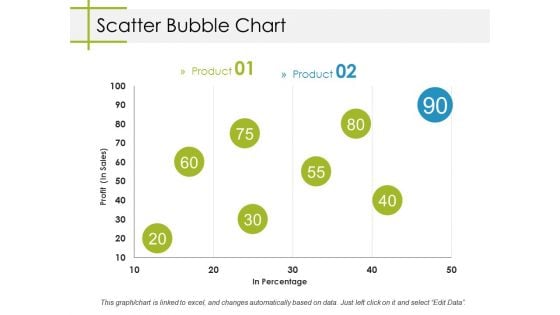
Scatter Bubble Chart Ppt PowerPoint Presentation Model Designs
This is a scatter bubble chart ppt powerpoint presentation model designs. This is a two stage process. The stages in this process are business, profit, in percentage, bubble chart, marketing.
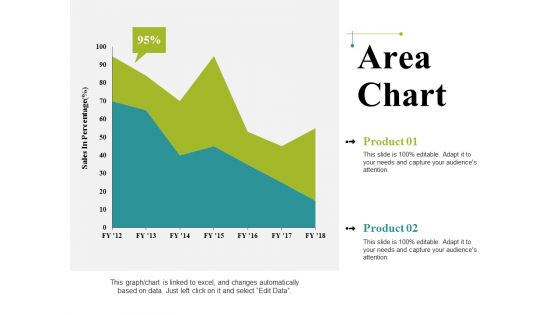
Area Chart Ppt PowerPoint Presentation Infographics Graphics Pictures
This is a area chart ppt powerpoint presentation infographics graphics pictures. This is a two stage process. The stages in this process are business, sales in percentage, area chart, marketing, graph.
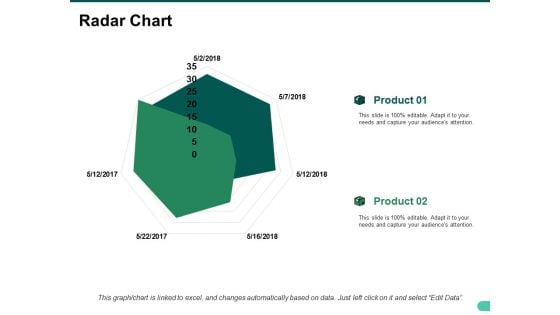
Radar Chart Ppt PowerPoint Presentation Show Graphic Images
This is a radar chart ppt powerpoint presentation show graphic images. This is a two stage process. The stages in this process are business, radar chart, marketing, graph, strategy.
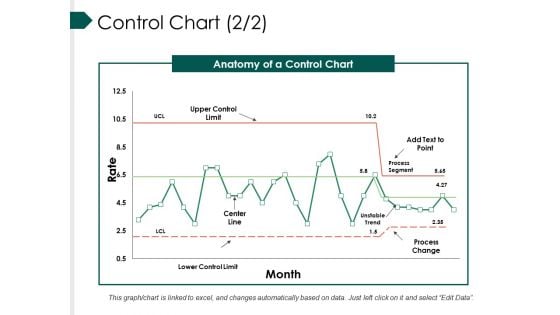
Control Chart Template Ppt PowerPoint Presentation Slides Smartart
This is a control chart template ppt powerpoint presentation slides smartart. This is a two stage process. The stages in this process are anatomy of a control chart, upper control limit, add text to point, process change, lower control limit.
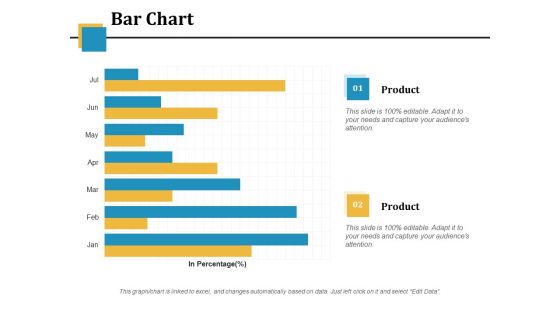
Bar Chart Ppt PowerPoint Presentation Infographic Template Picture
This is a bar chart ppt powerpoint presentation infographic template picture. This is a two stage process. The stages in this process are financial, in percentage, business, marketing, bar chart.

Area Chart Ppt PowerPoint Presentation Styles Design Templates
This is a area chart ppt powerpoint presentation styles design templates. This is a two stage process. The stages in this process are area chart, analysis, business, marketing, strategy.
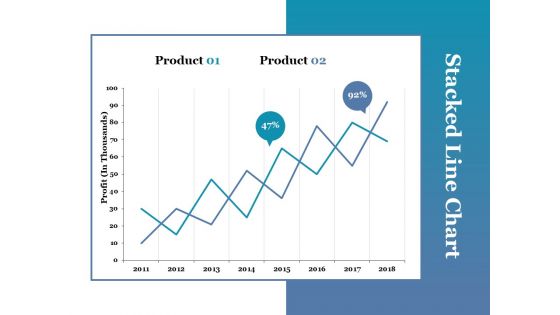
Stacked Line Chart Ppt PowerPoint Presentation Portfolio Picture
This is a stacked line chart ppt powerpoint presentation portfolio picture. This is a two stage process. The stages in this process are stacked line chart, product, profit, growth.
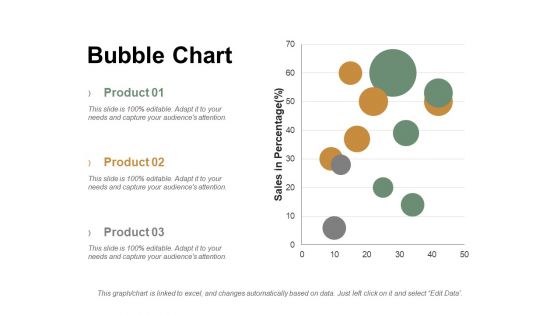
Bubble Chart Ppt PowerPoint Presentation Summary Graphics Tutorials
This is a bubble chart ppt powerpoint presentation summary graphics tutorials. This is a three stage process. The stages in this process are product, sales in percentage, bubble chart.
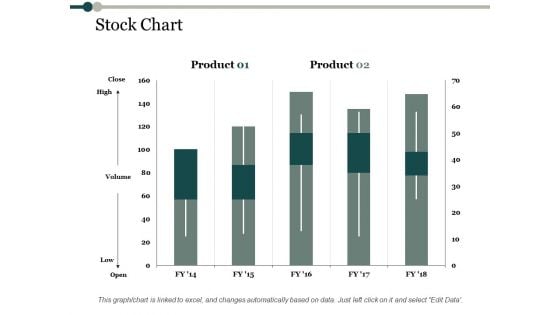
Stock Chart Process Analysis Ppt PowerPoint Presentation Professional Information
This is a stock chart process analysis ppt powerpoint presentation professional information. This is a two stage process. The stages in this process are stock chart, product, high, volume, low.
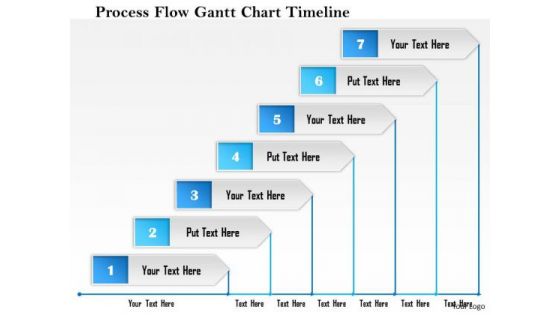
Business Framework Process Flow Gantt Chart Timeline PowerPoint Presentation
This Power point template slide has been designed with graphic of Gantt chart. This PPT slide contains the concept of process flow. Use this PPT slide for your business process related topics.
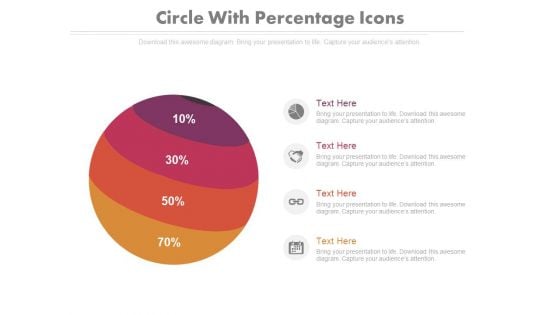
Four Parts Circle Chart With Percentage Ratio Powerpoint Slides
This PowerPoint template contains four parts circle chart with percentage ratio. You may download this PPT slide design to display your ideas in visual manner. You can easily customize this template to make it more unique as per your need.
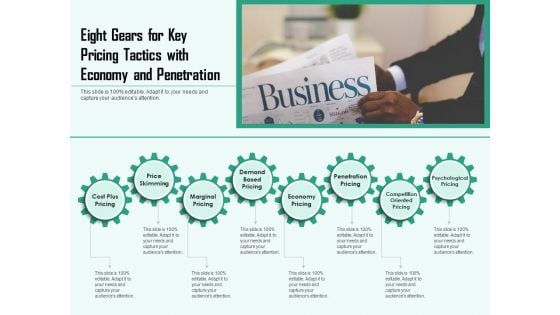
Eight Gears For Key Pricing Tactics With Economy And Penetration Ppt PowerPoint Presentation File Example Introduction PDF
Presenting eight gears for key pricing tactics with economy and penetration ppt powerpoint presentation file example introduction pdf to dispense important information. This template comprises eight stages. It also presents valuable insights into the topics including marginal pricing, price skimming, economy pricing. This is a completely customizable PowerPoint theme that can be put to use immediately. So, download it and address the topic impactfully.
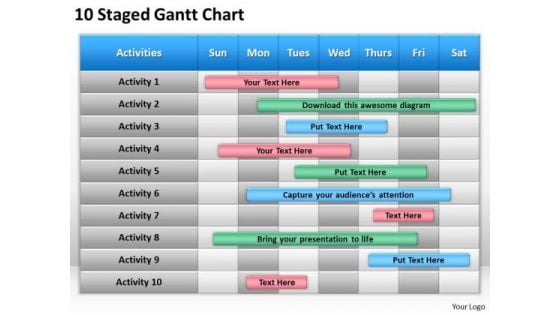
Consulting PowerPoint Template Gantt Chart Ppt Templates Backgrounds For Slides
Our consulting PowerPoint template gantt chart ppt templates backgrounds for slides help to make a draft. They give you a good place to start. Break the deadlock with our Competition PowerPoint Templates. Let the words start to flow. Assert your capability with our Advertising PowerPoint Templates. Give your thoughts that decisive touch. Break it down factor by factor. Our Consulting PowerPoint Template Gantt Chart Ppt Templates Backgrounds For Slides address each concern with diligence.
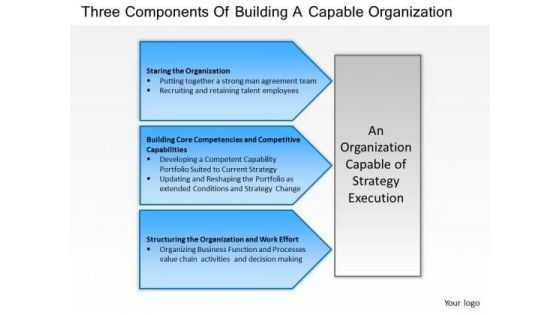
Business Diagram Three Components Of Building A Capable Organization PowerPoint Ppt Presentation
Our Business Diagram Three Components Of Building A Capable Organization PowerPoint PPT Presentation Powerpoint Templates And Your Ideas Make A Great Doubles Pair. Play The Net With Assured Hands.
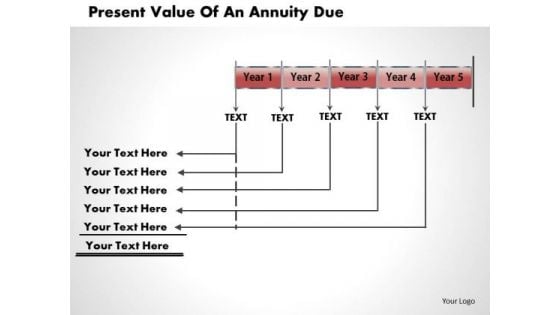
Business Diagram Present Value Of An Annuity Due PowerPoint Ppt Presentation
Dominate Proceedings With Your Ideas. Our Business Diagram Present Value Of An Annuity Due PowerPoint PPT Presentation Powerpoint Templates Will Empower Your Thoughts. Our Business Powerpoint Templates Have A Domino Effect. Your Ideas Will Generate One After Another.
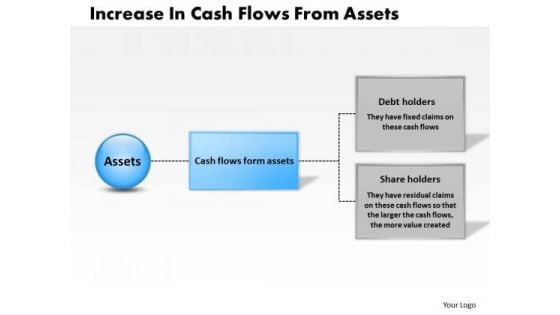
Business Diagram Increase In Cash Flows From Assets PowerPoint Ppt Presentation
Analyze Ailments On Our Business Diagram Increase In Cash Flows From Assets PowerPoint PPT Presentation PowerPoint Templates. Bring Out The Thinking Doctor In You. Dock Your Thoughts With Our Business PowerPoint Templates. They Will Launch Them Into Orbit.
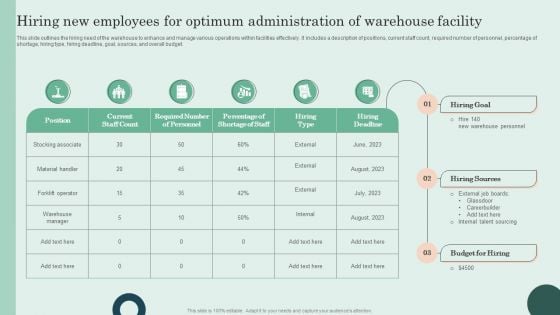
Hiring New Employees For Optimum Administration Of Warehouse Facility Themes PDF
This slide outlines the hiring need of the warehouse to enhance and manage various operations within facilities effectively. It includes a description of positions, current staff count, required number of personnel, percentage of shortage, hiring type, hiring deadline, goal, sources, and overall budget. Boost your pitch with our creative Hiring New Employees For Optimum Administration Of Warehouse Facility Themes PDF. Deliver an awe-inspiring pitch that will mesmerize everyone. Using these presentation templates you will surely catch everyones attention. You can browse the ppts collection on our website. We have researchers who are experts at creating the right content for the templates. So you do not have to invest time in any additional work. Just grab the template now and use them.
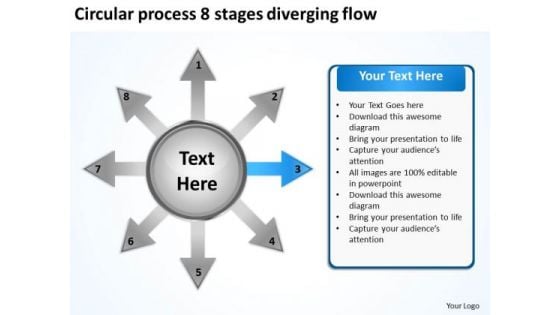
Circular Process 8 Stages Diverging Flow Venn Network PowerPoint Templates
We present our circular process 8 stages diverging flow Venn Network PowerPoint templates.Use our Ring charts PowerPoint Templates because Our PowerPoint Templates and Slides will let you meet your Deadlines. Use our Marketing PowerPoint Templates because there is a crucial aspect that requires extra attention. Download our Arrows PowerPoint Templates because you can Churn the wheels of the brains of your colleagues. Present our Shapes PowerPoint Templates because this helps in epitomised the values of teamwork. Present our Business PowerPoint Templates because this slide will fire away with all the accuracy at your command.Use these PowerPoint slides for presentations relating to Around, arrow, business, chart, circle, circular, circulation, commerce, concept, curving, cycle, diagram, direction, element, finance, financial, flow, flowchart, flowing, global, globe, internet, investment, market, motion, movement, moving, presentation, process, recession, recycle, repeat, repetitive, ring, rotation, round, savings, shape, shipping, shopping, spinning, step, structure, symbol. The prominent colors used in the PowerPoint template are Blue light, Black, White. People tell us our circular process 8 stages diverging flow Venn Network PowerPoint templates are Swanky. We assure you our chart PowerPoint templates and PPT Slides are Festive. PowerPoint presentation experts tell us our circular process 8 stages diverging flow Venn Network PowerPoint templates are Stylish. You can be sure our circulation PowerPoint templates and PPT Slides are Fancy. Professionals tell us our circular process 8 stages diverging flow Venn Network PowerPoint templates are Nifty. Use our business PowerPoint templates and PPT Slides are Splendid. Change the face of thinking in your company. Our Circular Process 8 Stages Diverging Flow Venn Network PowerPoint Templates will exhibit your expertise.
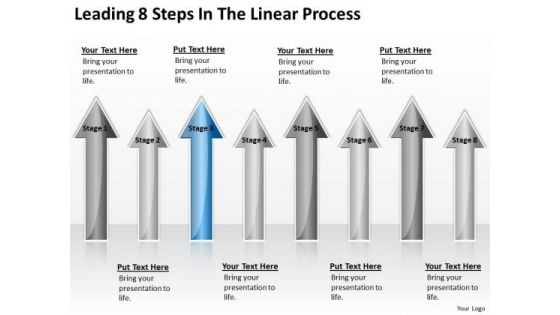
Parallel Processing Applications Leading 8 Steps The Linear Arrows PowerPoint Templates
We present our parallel processing applications leading 8 steps the linear arrows PowerPoint templates.Present our Business PowerPoint Templates because Our PowerPoint Templates and Slides will effectively help you save your valuable time. They are readymade to fit into any presentation structure. Present our Arrows PowerPoint Templates because Our PowerPoint Templates and Slides team portray an attitude of elegance. Personify this quality by using them regularly. Present our Finance PowerPoint Templates because Our PowerPoint Templates and Slides team portray an attitude of elegance. Personify this quality by using them regularly. Download and present our Success PowerPoint Templates because Our PowerPoint Templates and Slides are endowed to endure. Ideas conveyed through them will pass the test of time. Download and present our Flow Charts PowerPoint Templates because Our PowerPoint Templates and Slides provide you with a vast range of viable options. Select the appropriate ones and just fill in your text. Use these PowerPoint slides for presentations relating to Account, achievement, analyze, arrow, business, chart, colorful, company, corporate, economy, finance, graph, graphic, grow, improve, increase, information, investment, management, objective, positive, presentation, profile, profit, progress, report, result, stock, success. The prominent colors used in the PowerPoint template are Blue, Gray, Black. Presenters tell us our parallel processing applications leading 8 steps the linear arrows PowerPoint templates are incredible easy to use. We assure you our chart PowerPoint templates and PPT Slides are incredible easy to use. The feedback we get is that our parallel processing applications leading 8 steps the linear arrows PowerPoint templates will save the presenter time. Customers tell us our corporate PowerPoint templates and PPT Slides are designed by a team of presentation professionals. Customers tell us our parallel processing applications leading 8 steps the linear arrows PowerPoint templates will generate and maintain the level of interest you desire. They will create the impression you want to imprint on your audience. PowerPoint presentation experts tell us our corporate PowerPoint templates and PPT Slides provide great value for your money. Be assured of finding the best projection to highlight your words. Formalize plans with our Parallel Processing Applications Leading 8 Steps The Linear Arrows PowerPoint Templates. Download without worries with our money back guaranteee.
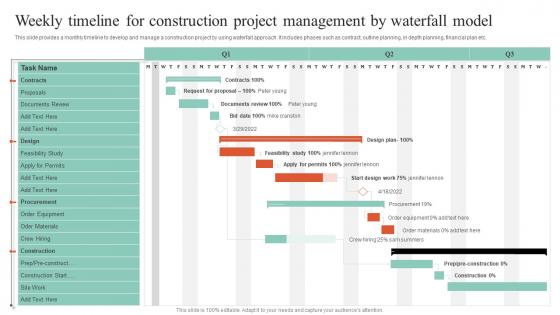
Executing Guide For Waterfall Weekly Timeline For Construction Project Management Guidelines Pdf
This slide provides a monthly timeline to develop and manage a construction project by using waterfall approach. It includes phases such as contract, outline planning, in depth planning, financial plan etc. Make sure to capture your audiences attention in your business displays with our gratis customizable Executing Guide For Waterfall Weekly Timeline For Construction Project Management Guidelines Pdf. These are great for business strategies, office conferences, capital raising or task suggestions. If you desire to acquire more customers for your tech business and ensure they stay satisfied, create your own sales presentation with these plain slides. This slide provides a monthly timeline to develop and manage a construction project by using waterfall approach. It includes phases such as contract, outline planning, in depth planning, financial plan etc.
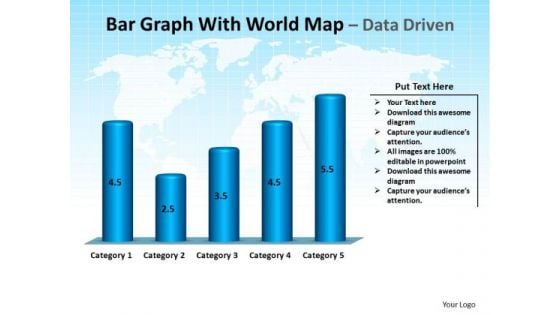
Business Success PowerPoint Templates Business Bar Graph With World Map Ppt Slides
Business Success PowerPoint Templates Business bar graph with world map PPT Slides-This PowerPoint Template is a illustration of bar garph with world map on blue background -Business Success PowerPoint Templates Business bar graph with world map PPT Slides-This ppt can be used for concepts relating to-animated, business, finance, sales, marketing, accounting, future, education, america, Antarctica, arrow, Asia, charts, statistics, budget, investment, abstract, australia, background, bar, blue, calculation, company and continents. Load up with our Business Success PowerPoint Templates Business Bar Graph With World Map Ppt Slides with our Business Success PowerPoint Templates Business Bar Graph With World Map Ppt Slides. You will be at the top of your game.
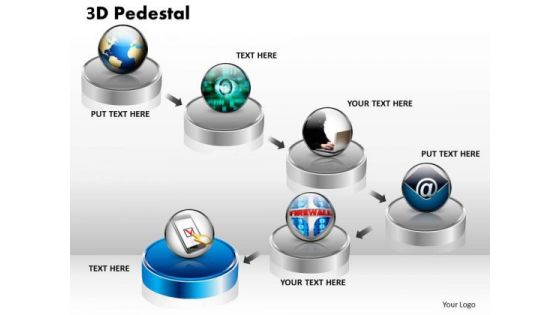
PowerPoint Designs Business 3d Pedestal Ppt Templates
PowerPoint Designs Business 3D Pedestal PPT Templates-These high quality powerpoint pre-designed slides and powerpoint templates have been carefully created by our professional team to help you impress your audience. All slides have been created and are 100% editable in powerpoint. Each and every property of any graphic - color, size, orientation, shading, outline etc. can be modified to help you build an effective powerpoint presentation. Any text can be entered at any point in the powerpoint template or slide. Simply DOWNLOAD, TYPE and PRESENT! Energize your team with our PowerPoint Designs Business 3d Pedestal Ppt Templates. Download without worries with our money back guaranteee.
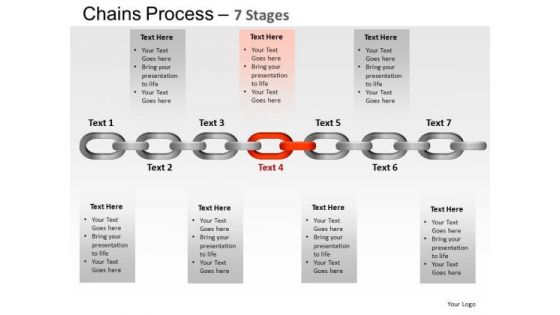
PowerPoint Presentation Strategy Chains Process Ppt Layouts
PowerPoint Presentation Strategy Chains Process PPT Layouts-These high quality powerpoint pre-designed slides and powerpoint templates have been carefully created by our professional team to help you impress your audience. All slides have been created and are 100% editable in powerpoint. Each and every property of any graphic - color, size, orientation, shading, outline etc. can be modified to help you build an effective powerpoint presentation. Any text can be entered at any point in the powerpoint template or slide. Simply DOWNLOAD, TYPE and PRESENT! Represent yourself with our PowerPoint Presentation Strategy Chains Process Ppt Layouts. Download without worries with our money back guaranteee.

House With Key Security PowerPoint Templates And PowerPoint Themes 1112
House With Key Security PowerPoint Templates And PowerPoint Themes 1112-Develop competitive advantage with our above template which contains a diagram of greenhouse connected with keys. This image represents the concept of security. It portrays the concept of building, chain, development, investment, mortgage, residential etc. Our PPT images are so ideally designed that it reveals the very basis of our PPT template are an effective tool to make your clients understand. The structure of our templates allows you to effectively highlight the key issues concerning the growth of your business.-House With Key Security PowerPoint Templates And PowerPoint Themes 1112-This PowerPoint template can be used for presentations relating to-House with key, Security, Design, Business, Abstract, Metaphor The audience will always evince interest. Our House With Key Security PowerPoint Templates And PowerPoint Themes 1112 will make them apply their minds.
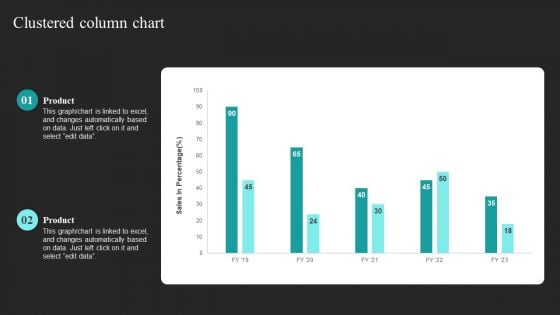
Strategic Promotional Guide For Restaurant Business Advertising Clustered Column Chart Infographics PDF
Presenting this PowerPoint presentation, titled Strategic Promotional Guide For Restaurant Business Advertising Clustered Column Chart Infographics PDF, with topics curated by our researchers after extensive research. This editable presentation is available for immediate download and provides attractive features when used. Download now and captivate your audience. Presenting this Strategic Promotional Guide For Restaurant Business Advertising Clustered Column Chart Infographics PDF. Our researchers have carefully researched and created these slides with all aspects taken into consideration. This is a completely customizable Strategic Promotional Guide For Restaurant Business Advertising Clustered Column Chart Infographics PDF that is available for immediate downloading. Download now and make an impact on your audience. Highlight the attractive features available with our PPTs.
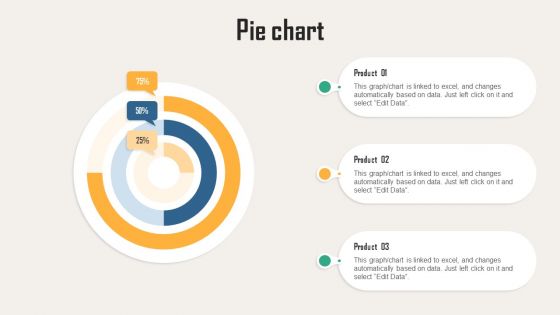
Creating Customer Personas For Customizing Pie Chart Ppt Professional Slides PDF
This graph or chart is linked to excel, and changes automatically based on data. Just left click on it and select Edit Data. Find highly impressive Creating Customer Personas For Customizing Pie Chart Ppt Professional Slides PDF on Slidegeeks to deliver a meaningful presentation. You can save an ample amount of time using these presentation templates. No need to worry to prepare everything from scratch because Slidegeeks experts have already done a huge research and work for you. You need to download Creating Customer Personas For Customizing Pie Chart Ppt Professional Slides PDF for your upcoming presentation. All the presentation templates are 100 percent editable and you can change the color and personalize the content accordingly. Download now.
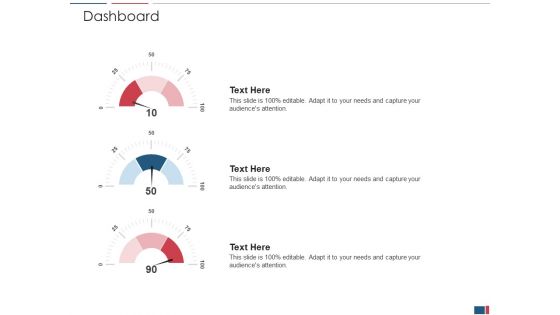
Drug Discovery Growth Process Reach Potential Product Toxicity Dashboard Themes PDF
Deliver an awe inspiring pitch with this creative drug discovery growth process reach potential product toxicity dashboard themes pdf bundle. Topics like dashboard can be discussed with this completely editable template. It is available for immediate download depending on the needs and requirements of the user.
Conference Meeting Business PowerPoint Templates And PowerPoint Themes 1112
We present our Conference Meeting Business PowerPoint Templates And PowerPoint Themes 1112.Use our Business PowerPoint Templates because, The structure of our templates allows you to effectively highlight the key issues concerning the growth of your business. Use our Success PowerPoint Templates because, They help to focus the thoughts of your listeners. Use our Leadership PowerPoint Templates because, Grab the attention of your team with this eye catching template signifying . Use our Communication PowerPoint Templates because, Illustrate how each element flows seamlessly onto the next stage. Use our Finance PowerPoint Templates because, Amplify your thoughts via our appropriate templates.Use these PowerPoint slides for presentations relating to Business meeting conference, business, success, leadership, communication, finance. The prominent colors used in the PowerPoint template are Black, Green, Gray Analyse the figures with our Conference Meeting Business PowerPoint Templates And PowerPoint Themes 1112. You will find answers emerging.

Two Wedding Rings Symbol PowerPoint Templates And PowerPoint Themes 1112
We present our Two Wedding Rings Symbol PowerPoint Templates And PowerPoint Themes 1112.Use our Design PowerPoint Templates because, Our Template designs are State of the Art. Use our Business PowerPoint Templates because, Transmit your passion via our creative templates. Use our Finance PowerPoint Templates because, The pyramid is a symbol of the desire to reach the top in a steady manner. Use our Metaphor PowerPoint Templates because, You have some exciting plans to spread goodwill among the underprivileged, Expound on your ideas and show to your colleagues how they can help others and in the process increase your Brand value. Use our Symbol PowerPoint Templates because, Determine your targets and sequence them as per your priorities.Use these PowerPoint slides for presentations relating to Wedding rings Business Finance Design Symbol Metaphor. The prominent colors used in the PowerPoint template are Yellow, White, Brown There is nothing fake about your commitment. Demonstrate authenticity with our Two Wedding Rings Symbol PowerPoint Templates And PowerPoint Themes 1112.
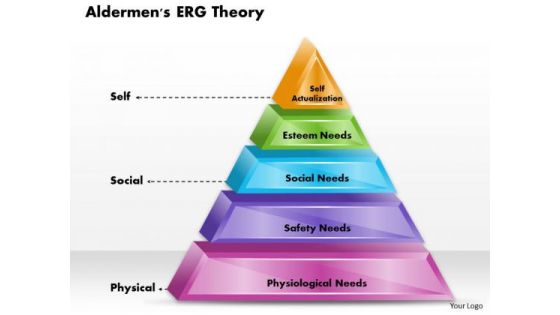
Business Framework Aldermens Erg Theory PowerPoint Presentation
This diagram has been designed with Aldermen erg theory. This diagram displays pyramid diagram, of self actualization, esteem needs, social needs, safety needs and physiological needs. Use this diagram to present information in the visual manner.
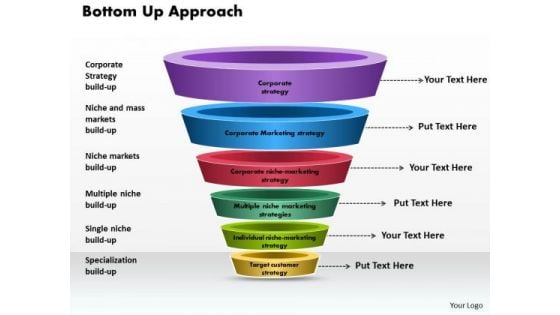
Business Framework Bottom Up Approach PowerPoint Presentation
This power point diagram slide has been crafted with bottom up approach. In this diagram, we have used multilevel funnel diagram with individual state. Use this diagram for your financial presentations and display bottom up approach in an graphical manner.
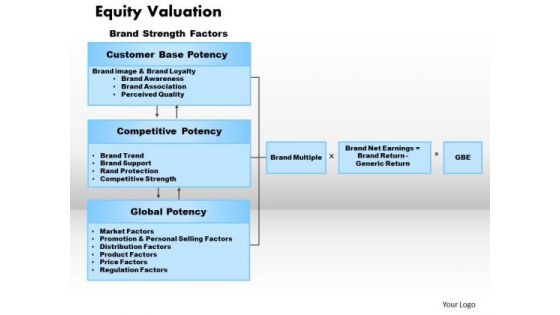
Business Framework Equity Valuation PowerPoint Presentation
This business framework Power Point template diagram has been crafted with graphic of three stage diagram. This PPT diagram contains the concept of equity valuation. Use this PPT diagram for your financial system related presentations.
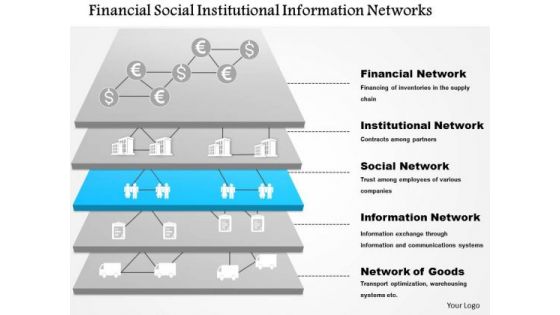
Business Framework Financial Social Institutional Information Networks 2 Ppt Presentation
This business framework Power Point template diagram has been crafted with graphic of multiple stage diagram. This PPT diagram contains the concept of financial information generation. Use this PPT diagram for your financial system related presentations.
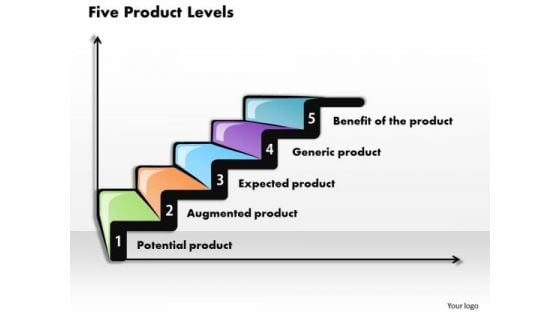
Business Framework Five Product Levels PowerPoint Presentation
This Power Point template diagram has been crafted with graphic of five level stair diagram. This PPT diagram contains the concept of progress and development. Use this PPT diagram slide may be used for product and success related presentations.
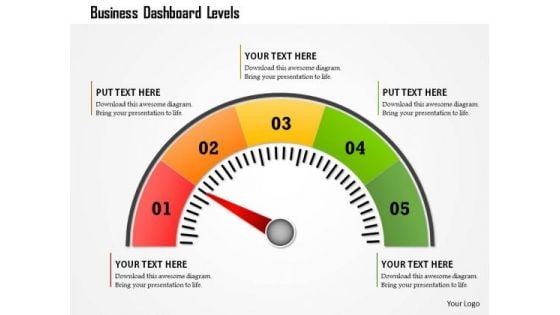
Business Framework Business Dashboard Levels PowerPoint Presentation
This business diagram displays colored meter with multiple levels. Use this diagram to display business process. This diagram can be used to indicate performance measures. This is an excellent diagram to impress your audiences.
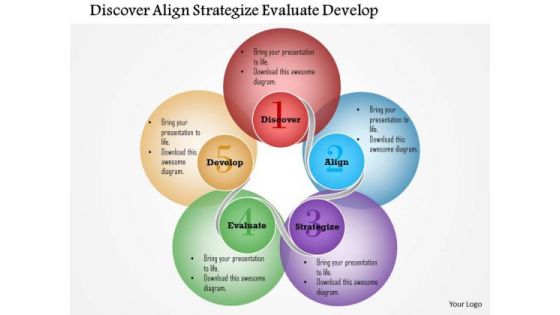
Business Framework Discover Align Strategize Evaluate Develop PowerPoint Presentation
This business diagram has been designed with graphic of Venn diagram. This Venn diagram is displaying the concept of discovering align strategy and development. Use this editable diagram for your business and marketing related presentations.
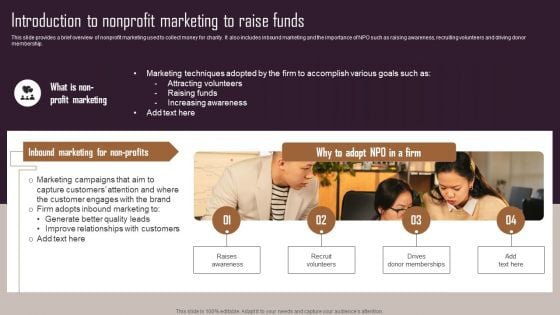
Effective NPO Promotional Strategies For Recruit Volunteers Introduction To Nonprofit Marketing To Raise Funds Download PDF
This slide provides a brief overview of nonprofit marketing used to collect money for charity. It also includes inbound marketing and the importance of NPO such as raising awareness, recruiting volunteers and driving donor membership. Retrieve professionally designed Effective NPO Promotional Strategies For Recruit Volunteers Introduction To Nonprofit Marketing To Raise Funds Download PDF to effectively convey your message and captivate your listeners. Save time by selecting pre-made slideshows that are appropriate for various topics, from business to educational purposes. These themes come in many different styles, from creative to corporate, and all of them are easily adjustable and can be edited quickly. Access them as PowerPoint templates or as Google Slides themes. You do not have to go on a hunt for the perfect presentation because Slidegeeks got you covered from everywhere.
Green Folder Between Yellow Folder Business PowerPoint Templates And PowerPoint Themes 1012
Green Folder Between Yellow Folder Business PowerPoint Templates And PowerPoint Themes 1012-The above template displays a diagram of group folder with the document to find the right folder. This image represents the concept of business technology. Use this template for presentations on documents circulation, document archives, banks, accounting etc. This image has been conceived to enable you to emphatically communicate your ideas in your Business PPT presentations. Create captivating presentations to deliver comparative and weighted arguments.-Green Folder Between Yellow Folder Business PowerPoint Templates And PowerPoint Themes 1012-This PowerPoint template can be used for presentations relating to-Green folder between yellow, Technology, Symbol, Business, Procees and flows, Abstract Evaluate plans with our Green Folder Between Yellow Folder Business PowerPoint Templates And PowerPoint Themes 1012. Download without worries with our money back guaranteee.
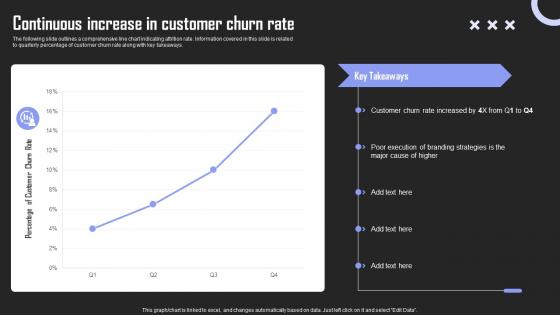
Continuous Increase Rate Brand Building Techniques To Gain Competitive Edge Summary Pdf
The following slide outlines a comprehensive line chart indicating attrition rate. Information covered in this slide is related to quarterly percentage of customer churn rate along with key takeaways. Whether you have daily or monthly meetings, a brilliant presentation is necessary. Continuous Increase Rate Brand Building Techniques To Gain Competitive Edge Summary Pdf can be your best option for delivering a presentation. Represent everything in detail using Continuous Increase Rate Brand Building Techniques To Gain Competitive Edge Summary Pdf and make yourself stand out in meetings. The template is versatile and follows a structure that will cater to your requirements. All the templates prepared by Slidegeeks are easy to download and edit. Our research experts have taken care of the corporate themes as well. So, give it a try and see the results. The following slide outlines a comprehensive line chart indicating attrition rate. Information covered in this slide is related to quarterly percentage of customer churn rate along with key takeaways.
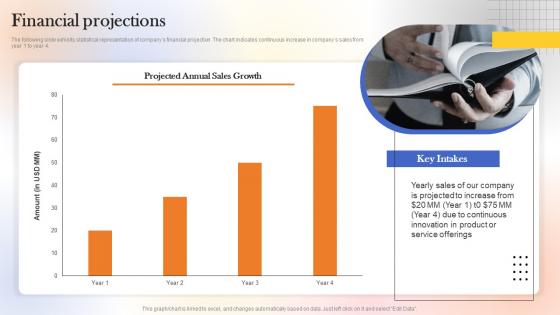
Financial Projections Web Designing Platform Fundraising Pitch Deck Microsoft Pdf
The following slide exhibits statistical representation of companys financial projection. The chart indicates continuous increase in companys sales from year 1 to year 4. Whether you have daily or monthly meetings, a brilliant presentation is necessary. Financial Projections Web Designing Platform Fundraising Pitch Deck Microsoft Pdf can be your best option for delivering a presentation. Represent everything in detail using Financial Projections Web Designing Platform Fundraising Pitch Deck Microsoft Pdf and make yourself stand out in meetings. The template is versatile and follows a structure that will cater to your requirements. All the templates prepared by Slidegeeks are easy to download and edit. Our research experts have taken care of the corporate themes as well. So, give it a try and see the results. The following slide exhibits statistical representation of companys financial projection. The chart indicates continuous increase in companys sales from year 1 to year 4.
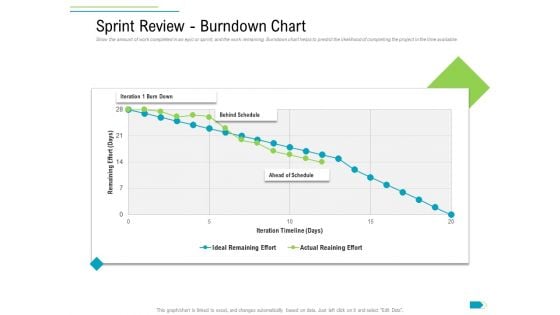
Agile Process Implementation For Marketing Program Sprint Review Burndown Chart Inspiration PDF
Show the amount of work completed in an epic or sprint, and the work remaining. Burndown chart helps to predict the likelihood of completing the project in the time available. Deliver an awe-inspiring pitch with this creative agile process implementation for marketing program sprint review burndown chart inspiration pdf bundle. Topics like iteration 1 burn down, behind schedule, ahead schedule, ideal remaining effort, actual reaining effort can be discussed with this completely editable template. It is available for immediate download depending on the needs and requirements of the user.
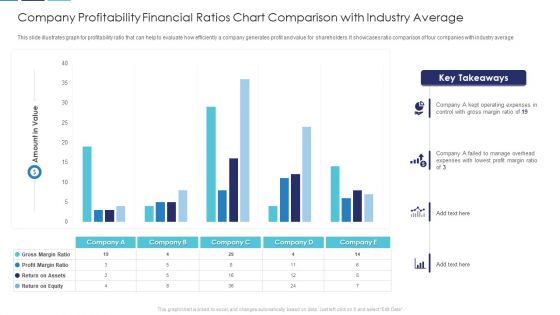
Company Profitability Financial Ratios Chart Comparison With Industry Average Download PDF
This slide illustrates graph for profitability ratio that can help to evaluate how efficiently a company generates profit and value for shareholders. It showcases ratio comparison of four companies with industry average Showcasing this set of slides titled company profitability financial ratios chart comparison with industry average download pdf. The topics addressed in these templates are company profitability financial ratios chart comparison with industry average. All the content presented in this PPT design is completely editable. Download it and make adjustments in color, background, font etc. as per your unique business setting.
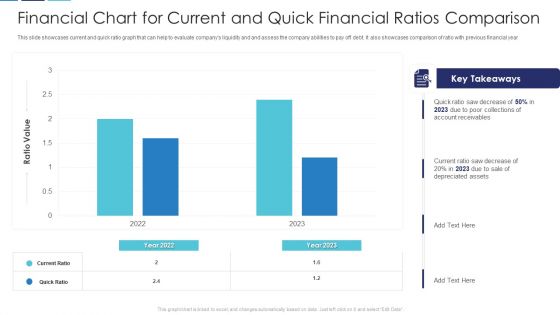
Financial Chart For Current And Quick Financial Ratios Comparison Brochure PDF
This slide showcases current and quick ratio graph that can help to evaluate companys liquidity and and assess the company abilities to pay off debt. It also showcases comparison of ratio with previous financial year Pitch your topic with ease and precision using this financial chart for current and quick financial ratios comparison brochure pdf. This layout presents information on financial chart for current and quick financial ratios comparison. It is also available for immediate download and adjustment. So, changes can be made in the color, design, graphics or any other component to create a unique layout.
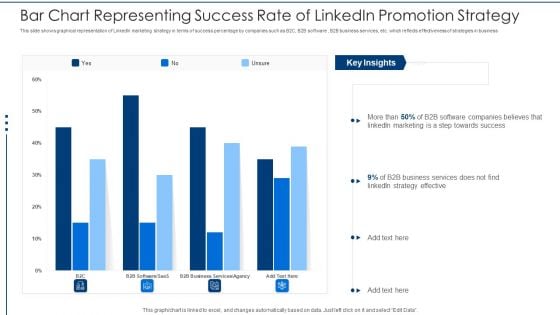
Bar Chart Representing Success Rate Of Linkedin Promotion Strategy Rules PDF
This slide shows graphical representation of LinkedIn marketing strategy in terms of success percentage by companies such as B2C, B2B software , B2B business services, etc. which reflects effectiveness of strategies in business Pitch your topic with ease and precision using this bar chart representing success rate of linkedin promotion strategy rules pdf. This layout presents information on bar chart representing success rate of linkedin promotion strategy. It is also available for immediate download and adjustment. So, changes can be made in the color, design, graphics or any other component to create a unique layout.
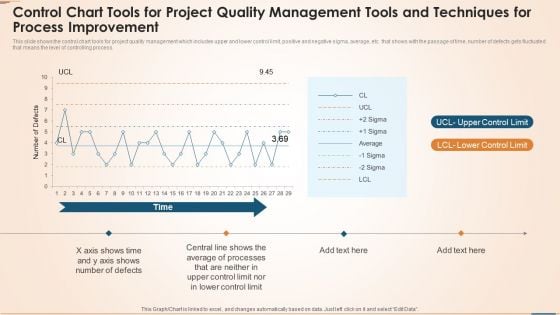
Control Chart Tools For Project Quality Management Tools And Techniques For Process Improvement Topics PDF
This slide shows the control chart tools for project quality management which includes upper and lower control limit, positive and negative sigma, average, etc. that shows with the passage of time, number of defects gets fluctuated that means the level of controlling process. Pitch your topic with ease and precision using this control chart tools for project quality management tools and techniques for process improvement topics pdf. This layout presents information on time, upper control limit, lower control limit. It is also available for immediate download and adjustment. So, changes can be made in the color, design, graphics or any other component to create a unique layout.
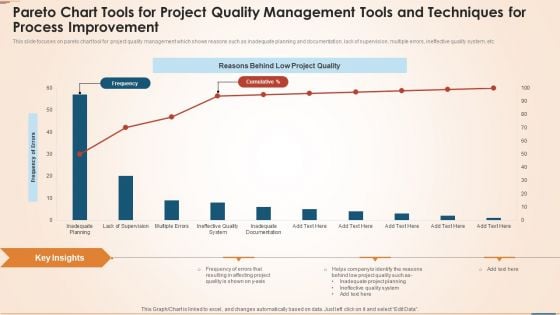
Pareto Chart Tools For Project Quality Management Tools And Techniques For Process Improvement Elements PDF
This slide focuses on pareto chart tool for project quality management which shows reasons such as inadequate planning and documentation, lack of supervision, multiple errors, ineffective quality system, etc. Pitch your topic with ease and precision using this pareto chart tools for project quality management tools and techniques for process improvement elements pdf. This layout presents information on frequency, reasons behind low project quality, frequency of errors, planning. It is also available for immediate download and adjustment. So, changes can be made in the color, design, graphics or any other component to create a unique layout.
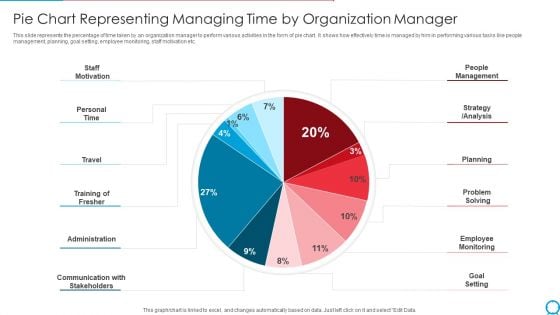
Pie Chart Representing Managing Time By Organization Manager Ppt PowerPoint Presentation Gallery Template PDF
This slide represents the percentage of time taken by an organization manager to perform various activities in the form of pie chart. It shows how effectively time is managed by him in performing various tasks like people management, planning, goal setting, employee monitoring, staff motivation etc. Pitch your topic with ease and precision using this pie chart representing managing time by organization manager ppt powerpoint presentation gallery template pdf. This layout presents information on staff motivation, personal time, travel training of fresher, administration. It is also available for immediate download and adjustment. So, changes can be made in the color, design, graphics or any other component to create a unique layout.
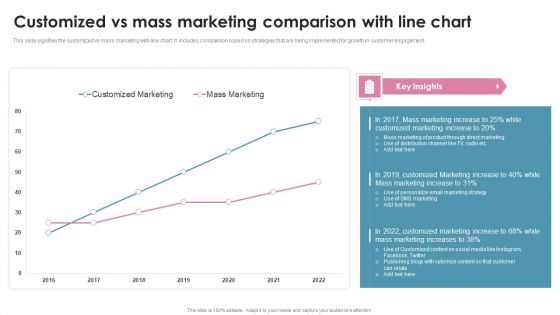
Customized Vs Mass Marketing Comparison With Line Chart Ppt PowerPoint Presentation File Ideas PDF
This slide signifies the customized vs mass marketing with line chart. It includes comparison based on strategies that are being implemented for growth in customer engagement. Pitch your topic with ease and precision using this Customized Vs Mass Marketing Comparison With Line Chart Ppt PowerPoint Presentation File Ideas PDF. This layout presents information on Customized Marketing, Mass Marketing, 2016 To 2022. It is also available for immediate download and adjustment. So, changes can be made in the color, design, graphics or any other component to create a unique layout.

Pie Chart Showing Factors Impacting Elements Of Successful Project And Failure Graphics PDF
The following slide depicts the major reasons for project failure to avoid future reoccurrence. It includes elements such as ineffective management practices, poorly defined objectives, technical glitches etc. Showcasing this set of slides titled Pie Chart Showing Factors Impacting Elements Of Successful Project And Failure Graphics PDF. The topics addressed in these templates are Pie Chart Showing Factors, Impacting Elements, Successful Project And Failure. All the content presented in this PPT design is completely editable. Download it and make adjustments in color, background, font etc. as per your unique business setting.
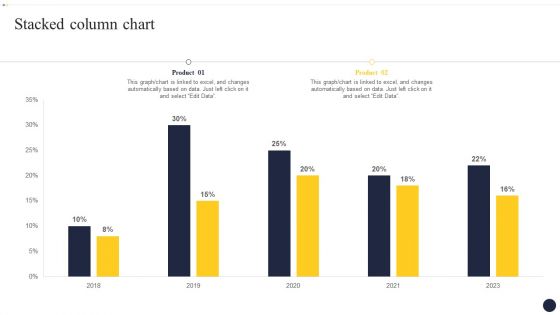
Integrating Naas Service Model To Enhance Stacked Column Chart Infographics PDF
Find highly impressive Integrating Naas Service Model To Enhance Stacked Column Chart Infographics PDF on Slidegeeks to deliver a meaningful presentation. You can save an ample amount of time using these presentation templates. No need to worry to prepare everything from scratch because Slidegeeks experts have already done a huge research and work for you. You need to download Integrating Naas Service Model To Enhance Stacked Column Chart Infographics PDF for your upcoming presentation. All the presentation templates are 100 percent editable and you can change the color and personalize the content accordingly. Download now.
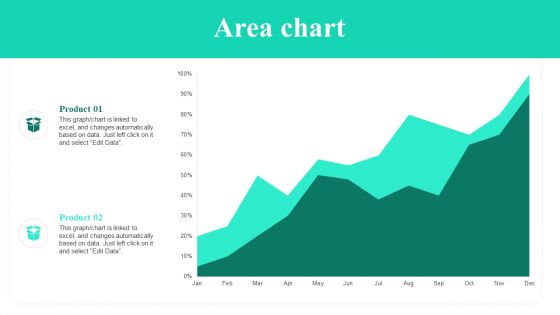
Adopting Flexible Work Policy Area Chart Ppt PowerPoint Presentation File Slideshow PDF
Do you have to make sure that everyone on your team knows about any specific topic I yes, then you should give Adopting Flexible Work Policy Area Chart Ppt PowerPoint Presentation File Slideshow PDF a try. Our experts have put a lot of knowledge and effort into creating this impeccable Adopting Flexible Work Policy Area Chart Ppt PowerPoint Presentation File Slideshow PDF. You can use this template for your upcoming presentations, as the slides are perfect to represent even the tiniest detail. You can download these templates from the Slidegeeks website and these are easy to edit. So grab these today.
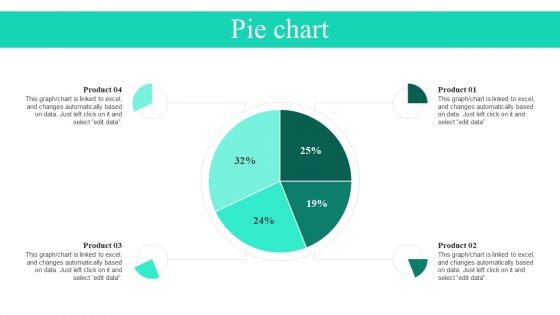
Adopting Flexible Work Policy Pie Chart Ppt PowerPoint Presentation File Layouts PDF
Do you have an important presentation coming up Are you looking for something that will make your presentation stand out from the rest Look no further than Adopting Flexible Work Policy Pie Chart Ppt PowerPoint Presentation File Layouts PDF. With our professional designs, you can trust that your presentation will pop and make delivering it a smooth process. And with Slidegeeks, you can trust that your presentation will be unique and memorable. So why wait Grab Adopting Flexible Work Policy Pie Chart Ppt PowerPoint Presentation File Layouts PDF today and make your presentation stand out from the rest.
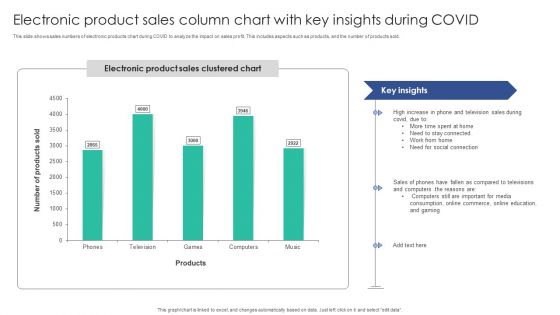
Electronic Product Sales Column Chart With Key Insights During COVID Microsoft PDF
This slide shows sales numbers of electronic products chart during COVID to analyze the impact on sales profit. This includes aspects such as products, and the number of products sold. Pitch your topic with ease and precision using this Electronic Product Sales Column Chart With Key Insights During COVID Microsoft PDF. This layout presents information on Stay Connected, Social Connection, Compared Televisions. It is also available for immediate download and adjustment. So, changes can be made in the color, design, graphics or any other component to create a unique layout.
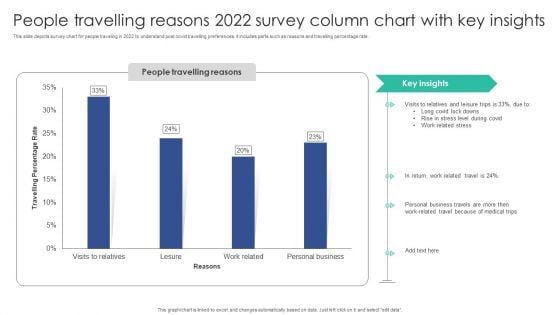
People Travelling Reasons 2022 Survey Column Chart With Key Insights Sample PDF
This slide depicts survey chart for people traveling in 2022 to understand post covid travelling preferences. It includes parts such as reasons and travelling percentage rate.Pitch your topic with ease and precision using this People Travelling Reasons 2022 Survey Column Chart With Key Insights Sample PDF. This layout presents information on Visits Relatives, Leisure Trips, Personal Business. It is also available for immediate download and adjustment. So, changes can be made in the color, design, graphics or any other component to create a unique layout.

 Home
Home