Cost Icon
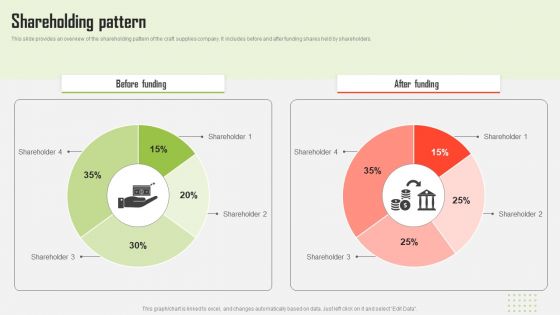
Craft Material Supply Firm Fundraising Pitch Deck Shareholding Pattern Mockup PDF
This slide provides an overview of the shareholding pattern of the craft supplies company. It includes before and after funding shares held by shareholders. Coming up with a presentation necessitates that the majority of the effort goes into the content and the message you intend to convey. The visuals of a PowerPoint presentation can only be effective if it supplements and supports the story that is being told. Keeping this in mind our experts created Craft Material Supply Firm Fundraising Pitch Deck Shareholding Pattern Mockup PDF to reduce the time that goes into designing the presentation. This way, you can concentrate on the message while our designers take care of providing you with the right template for the situation.
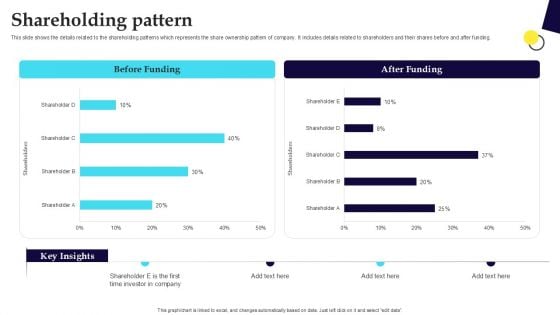
Digital Healthcare Platform Fundraising Pitch Deck Shareholding Pattern Topics PDF
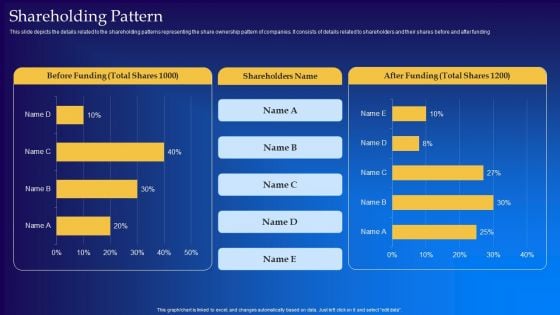
Live Audio Chat Platform Fundraising Pitch Deck Shareholding Pattern Template PDF
This slide depicts the details related to the shareholding patterns representing the share ownership pattern of companies. It consists of details related to shareholders and their shares before and after funding Present like a pro with Live Audio Chat Platform Fundraising Pitch Deck Shareholding Pattern Template PDF Create beautiful presentations together with your team, using our easy to use presentation slides. Share your ideas in real time and make changes on the fly by downloading our templates. So whether you are in the office, on the go, or in a remote location, you can stay in sync with your team and present your ideas with confidence. With Slidegeeks presentation got a whole lot easier. Grab these presentations today.
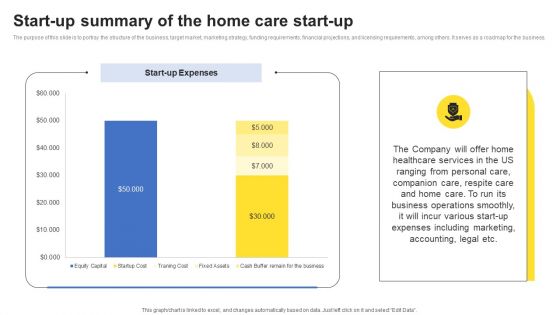
Company Analysis Of The Home Care Start Up Start Up Summary Of The Home Care Start Up Graphics PDF
The purpose of this slide is to portray the structure of the business, target market, marketing strategy, funding requirements, financial projections, and licensing requirements, among others. It serves as a roadmap for the business. Formulating a presentation can take up a lot of effort and time, so the content and message should always be the primary focus. The visuals of the PowerPoint can enhance the presenters message, so our Company Analysis Of The Home Care Start Up Start Up Summary Of The Home Care Start Up Graphics PDF was created to help save time. Instead of worrying about the design, the presenter can concentrate on the message while our designers work on creating the ideal templates for whatever situation is needed. Slidegeeks has experts for everything from amazing designs to valuable content, we have put everything into Company Analysis Of The Home Care Start Up Start Up Summary Of The Home Care Start Up Graphics PDF.
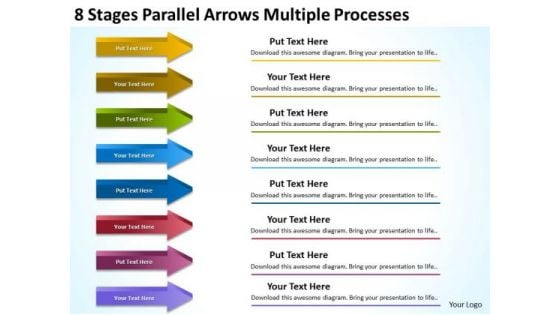
8 Stages Parallel Arrows Multiple Processes How To Present Business Plan PowerPoint Templates
We present our 8 stages parallel arrows multiple processes how to present business plan PowerPoint templates.Present our Finance PowerPoint Templates because You can Create a matrix with our PowerPoint Templates and Slides. Feel the strength of your ideas click into place. Download our Arrows PowerPoint Templates because It is Aesthetically crafted by artistic young minds. Our PowerPoint Templates and Slides are designed to display your dexterity. Use our Business PowerPoint Templates because You can Raise a toast with our PowerPoint Templates and Slides. Spread good cheer amongst your audience. Present our Process and Flows PowerPoint Templates because our PowerPoint Templates and Slides will give your ideas the shape. Present our Success PowerPoint Templates because our PowerPoint Templates and Slides are the string of your bow. Fire of your ideas and conquer the podium.Use these PowerPoint slides for presentations relating to 3d, Arrow, Banner, Business, Business Concept, Chart, Description, Development, Diagram, Direction, Element, Empty, Financial, Flow, Flowchart, Future, Gradient, Graph, Graphic, Illustration, Isolated, Mirrored, Object, Placeholder, Presentation, Process, Section, Segment, Set, Shape, Sign, Steps, Symbol, Template, Topic, Vector. The prominent colors used in the PowerPoint template are Yellow, Green, Blue. Presenters tell us our 8 stages parallel arrows multiple processes how to present business plan PowerPoint templates are designed to make your presentations professional. We assure you our Description PowerPoint templates and PPT Slides effectively help you save your valuable time. Professionals tell us our 8 stages parallel arrows multiple processes how to present business plan PowerPoint templates are readymade to fit into any presentation structure. We assure you our Development PowerPoint templates and PPT Slides provide great value for your money. Be assured of finding the best projection to highlight your words. People tell us our 8 stages parallel arrows multiple processes how to present business plan PowerPoint templates are aesthetically designed to attract attention. We guarantee that they will grab all the eyeballs you need. The feedback we get is that our Chart PowerPoint templates and PPT Slides are effectively colour coded to prioritise your plans They automatically highlight the sequence of events you desire. Back great ideas with our 8 Stages Parallel Arrows Multiple Processes How To Present Business Plan PowerPoint Templates. You will come out on top.
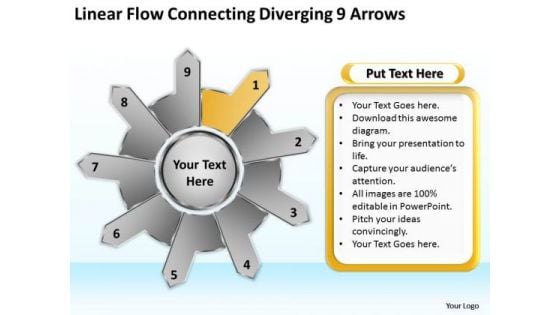
Linear Flow Connecting Diverging 9 Arrows Ppt Gear Process PowerPoint Templates
We present our linear flow connecting diverging 9 arrows ppt Gear Process PowerPoint templates.Download our Flow charts PowerPoint Templates because we provide the means to project your views. Present our Ring Charts PowerPoint Templates because brilliant ideas popping up all over the place. Use our Arrows PowerPoint Templates because it depicts Rolling along while gathering profits along the way is the aim. Download and present our Success PowerPoint Templates because your quest has taken you well onto the path of success. Download and present our Business PowerPoint Templates because watch the excitement levels rise as they realise their worth.Use these PowerPoint slides for presentations relating to Abstract, arrow, brochure, business,button, chart, circle, company, cyclic,data, demonstration, diagram,economic, financial, glossy, goal, graph,illustration, info, information, investment,manage, marketing, model, navigation,option, part, pie, presentation, process. The prominent colors used in the PowerPoint template are Yellow, Black, White. People tell us our linear flow connecting diverging 9 arrows ppt Gear Process PowerPoint templates are Cheerful. Customers tell us our cyclic PowerPoint templates and PPT Slides are Efficient. Professionals tell us our linear flow connecting diverging 9 arrows ppt Gear Process PowerPoint templates are Precious. Presenters tell us our chart PowerPoint templates and PPT Slides will make the presenter successul in his career/life. Use our linear flow connecting diverging 9 arrows ppt Gear Process PowerPoint templates provide you with a vast range of viable options. Select the appropriate ones and just fill in your text. Presenters tell us our company PowerPoint templates and PPT Slides are Functional. See your audience react before your very eyes. Our Linear Flow Connecting Diverging 9 Arrows Ppt Gear Process PowerPoint Templates extract positive delight.
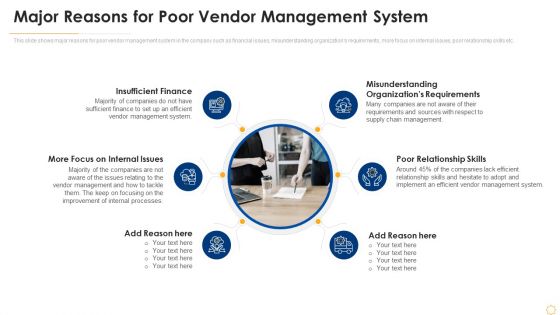
Successful Vendor Management Approaches To Boost Procurement Efficiency Major Reasons For Poor Vendor Diagrams PDF
This slide shows major reasons for poor vendor management system in the company such as financial issues, misunderstanding organizations requirements, more focus on internal issues, poor relationship skills etc. This is a successful vendor management approaches to boost procurement efficiency major reasons for poor vendor diagrams pdf template with various stages. Focus and dispense information on six stages using this creative set, that comes with editable features. It contains large content boxes to add your information on topics like insufficient finance, poor relationship skills, misunderstanding organizations requirements, more focus on internal issues. You can also showcase facts, figures, and other relevant content using this PPT layout. Grab it now.
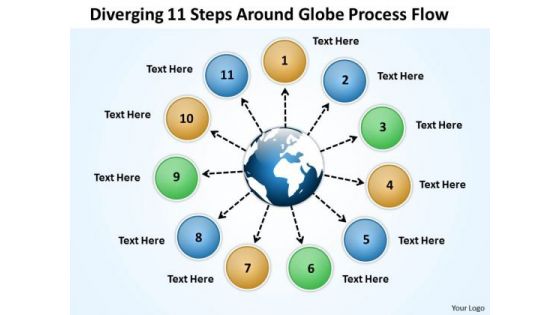
Diverging 11 Steps Around Globe Process Flow Ppt Circular Motion Chart PowerPoint Templates
We present our diverging 11 steps around globe process flow ppt Circular Motion Chart PowerPoint templates.Present our Circle Charts PowerPoint Templates because you can Be the cynosure of all eyes with our template depicting . Download our Arrows PowerPoint Templates because they will Amplify your thoughts via our appropriate templates. Download our Globe PowerPoint Templates because the ideas and plans are on your finger tips. Download our Business PowerPoint Templates because you have selected your team man for man. Download and present our Flow Charts PowerPoint Templates because it helps you to take your team up to a higher level with your thoughts.Use these PowerPoint slides for presentations relating to arrows, business, chart, circle, company, concept, continuity, continuous, cycle, dependency, diagram, direction, dynamic, endless, feeds, graph, iteration, iterative, method, path, phase, presentation, process, production, progress, progression, report, rotation, sequence, succession, vector. The prominent colors used in the PowerPoint template are Blue, Green, White. Presenters tell us our diverging 11 steps around globe process flow ppt Circular Motion Chart PowerPoint templates help you meet deadlines which are an element of today's workplace. Just browse and pick the slides that appeal to your intuitive senses. You can be sure our continuity PowerPoint templates and PPT Slides are designed by professionals Professionals tell us our diverging 11 steps around globe process flow ppt Circular Motion Chart PowerPoint templates are Energetic. People tell us our concept PowerPoint templates and PPT Slides are Wistful. People tell us our diverging 11 steps around globe process flow ppt Circular Motion Chart PowerPoint templates are Bright. Professionals tell us our continuous PowerPoint templates and PPT Slides are Nifty. Our Diverging 11 Steps Around Globe Process Flow Ppt Circular Motion Chart PowerPoint Templates create presentations that blow your audience away. With our money back guarantee you have nothing to lose.

PowerPoint Template Chart 3d Puzzle Process Ppt Slides
This compelling graphics can be used showing relations and interfaces among various marketing activities. Bridge gaps with our PowerPoint Template Chart 3d Puzzle Process Ppt Slides. Just download, type and present.
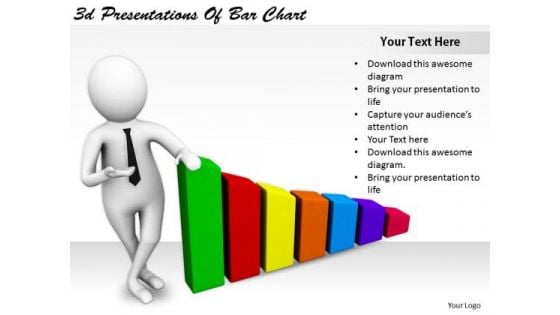
Business Strategy Innovation 3d Presentations Of Bar Chart Character Modeling
Your Thoughts Will Be The Main Course. Provide The Dressing With Our business strategy innovation 3d presentations of bar chart character modeling Powerpoint Templates. Dress Up Your Views With Our Marketing Powerpoint Templates. Deliver Your Ideas With Aplomb.
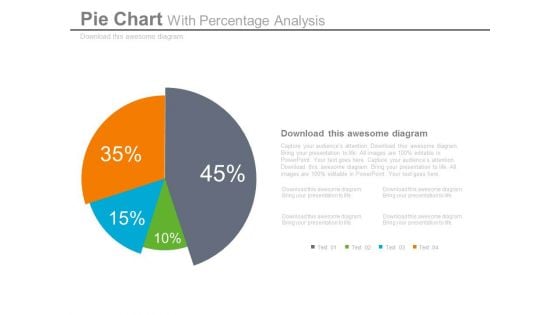
Pie Chart Dashboard Style For Percentage Analysis Powerpoint Slides
This dashboard PPT template contains graphics of pie chart. This dashboard PowerPoint template helps to display percentage analysis in a visual manner. Download this PPT slide for quick decision-making.
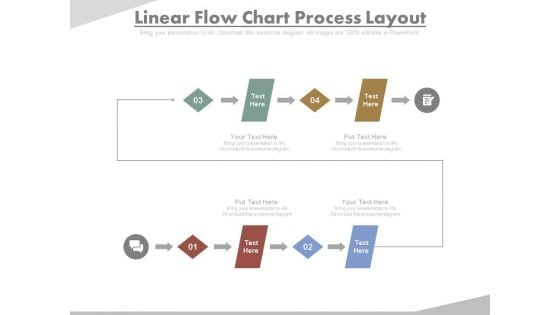
Four Steps In Linear Flow Chart Powerpoint Slides
This PowerPoint template contains design of four steps flow chart. You may download this slide to display workflow and processes. You can easily customize this template to make it more unique as per your need.
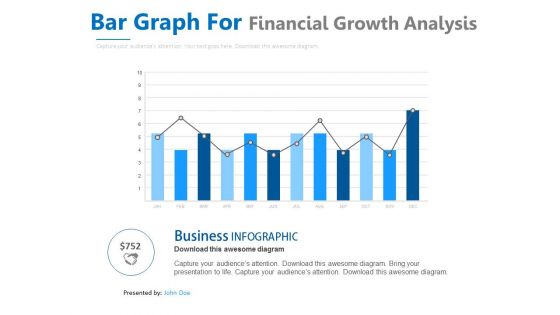
Bar Graph With Line Chart For Analysis Powerpoint Slides
This PowerPoint template contains design of bar graph with line chart. You may download this slide to display strategy steps for business growth. You can easily customize this template to make it more unique as per your need.
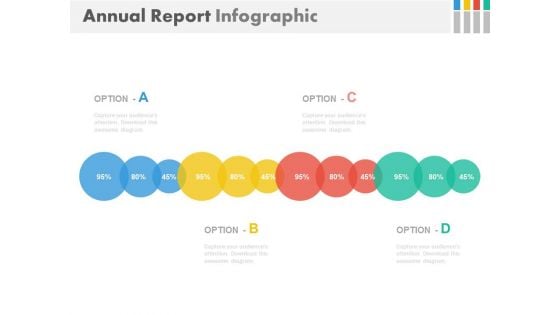
Linear Chart For Annual Business Report Powerpoint Slides
This PowerPoint template contains graphics of linear circle chart. You may download this PPT slide design to display annual business report. You can easily customize this template to make it more unique as per your need.
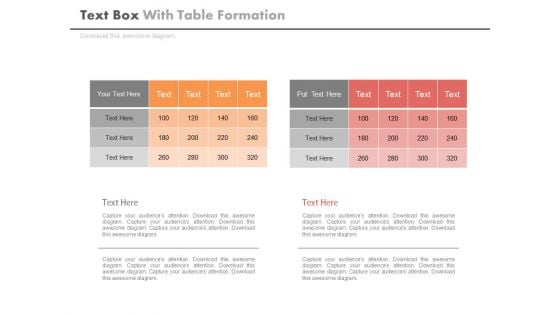
Two Table Charts For Business Data Powerpoint Slides
This PowerPoint template contains two tables chart. You may download this PPT slide to display statistical analysis. You can easily customize this template to make it more unique as per your need.
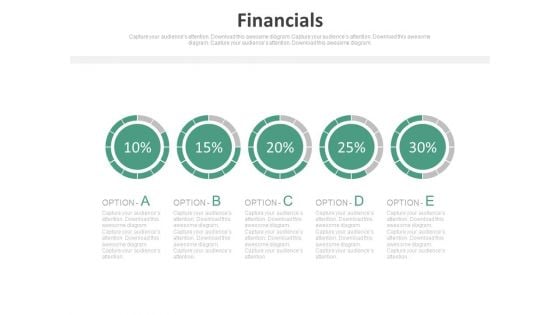
Pie Charts For Percentage Value Analysis Powerpoint Slides
Our above PPT slide displays graphics of Pie charts. This PowerPoint template may be used to display percentage value analysis. Download this template to leave permanent impression on your audience.
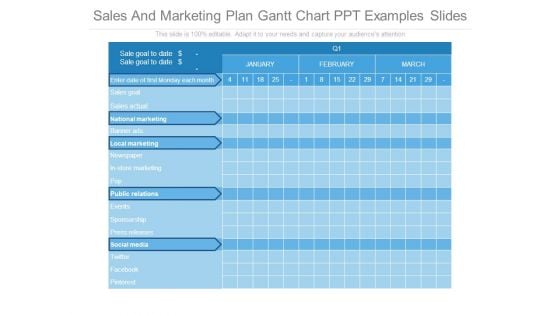
Sales And Marketing Plan Gantt Chart Ppt Examples Slides
This is a sales and marketing plan gantt chart ppt examples slides. This is a three stage process. The stages in this process are sales goal, sales actual, banner ads, newspaper, in store marketing.
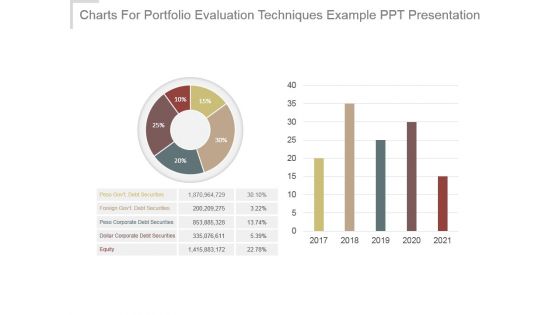
Charts For Portfolio Evaluation Techniques Example Ppt Presentation
This is a charts for portfolio evaluation techniques example ppt presentation. This is a five stage process. The stages in this process are peso govt debt securities, foreign govt debt securities, peso corporate debt securities, dollar corporate debt securities, equity.
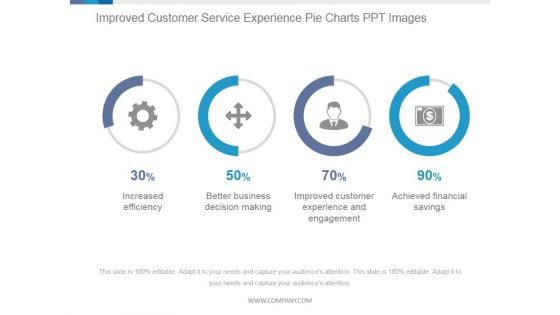
Improved Customer Service Experience Pie Charts Ppt PowerPoint Presentation Templates
This is a improved customer service experience pie charts ppt powerpoint presentation templates. This is a four stage process. The stages in this process are increased efficiency, better business decision making, improved customer experience and engagement, achieved financial savings.

Xbar And R Chart Ppt PowerPoint Presentation Example 2015
This is a xbar and r chart ppt powerpoint presentation example 2015. This is a two stage process. The stages in this process are business, strategy, marketing, success, growth strategy.
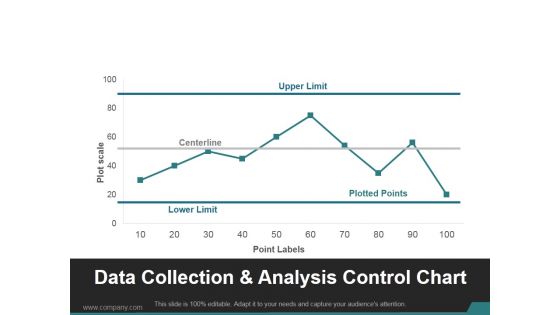
Data Collection And Analysis Control Chart Ppt PowerPoint Presentation Visuals
This is a data collection and analysis control chart ppt powerpoint presentation visuals. This is a ten stage process. The stages in this process are upper limit, centerline, lower limit, plotted points.
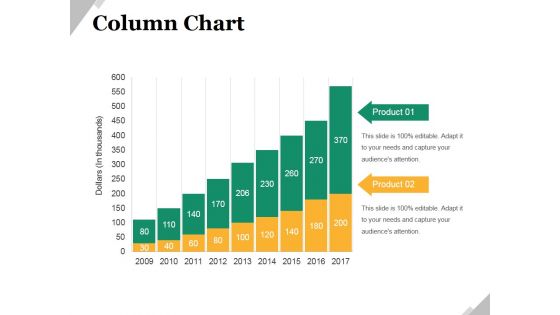
Column Chart Ppt PowerPoint Presentation Infographic Template Graphic Images
This is a column chart ppt powerpoint presentation infographic template graphic images. This is a nine stage process. The stages in this process are business, marketing, growth, product, management.
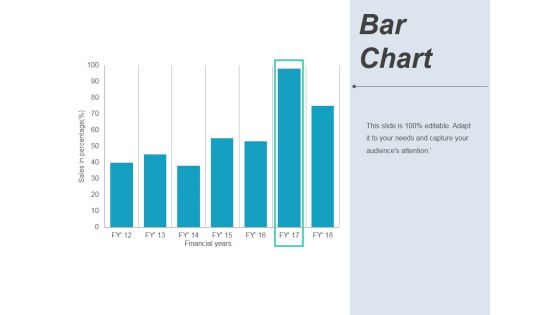
Bar Chart Ppt PowerPoint Presentation Pictures Background Image
This is a bar chart ppt powerpoint presentation pictures background image. This is a seven stage process. The stages in this process are financial years, sales in percentage, graph, business.
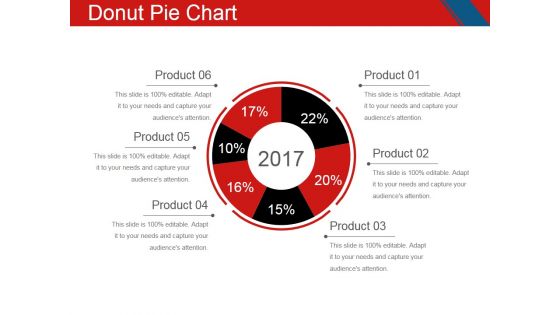
Donut Pie Chart Ppt PowerPoint Presentation Infographic Template Sample
This is a donut pie chart ppt powerpoint presentation infographic template sample. This is a six stage process. The stages in this process are business, pie, process, planning, strategy.
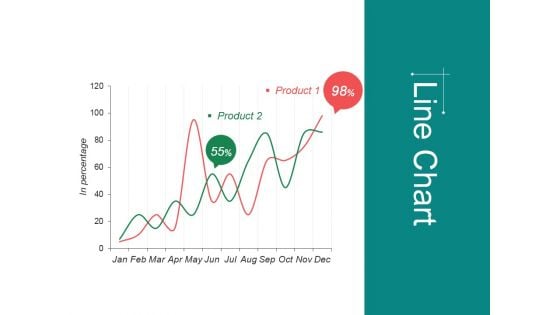
Line Chart Ppt Powerpoint Presentation Infographic Template Format
This is a line chart ppt powerpoint presentation infographic template format. This is a two stage process. The stages in this process are jan, feb, mar, apr, may, financial.
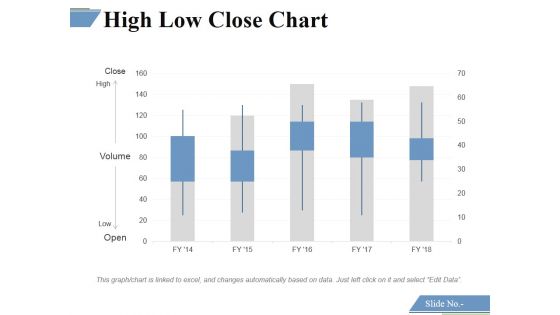
High Low Close Chart Ppt PowerPoint Presentation Professional Background Images
This is a high low close chart ppt powerpoint presentation professional background images. This is a five stage process. The stages in this process are close, high, volume, low, open.
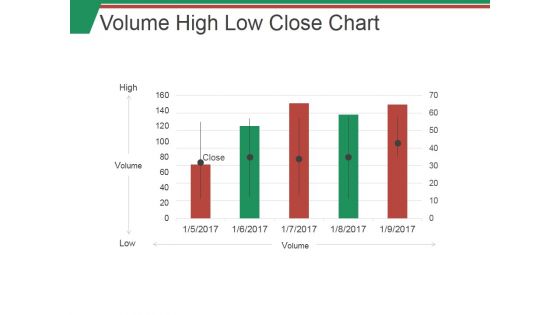
Volume High Low Close Chart Ppt PowerPoint Presentation Outline Examples
This is a volume high low close chart ppt powerpoint presentation outline examples. This is a five stage process. The stages in this process are high, low, volume, graph, business.
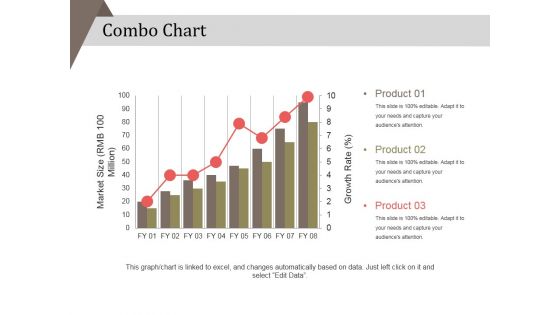
Combo Chart Ppt PowerPoint Presentation Infographic Template Brochure
This is a combo chart ppt powerpoint presentation infographic template brochure. This is a eight stage process. The stages in this process are product, market size, strategy, business, marketing.
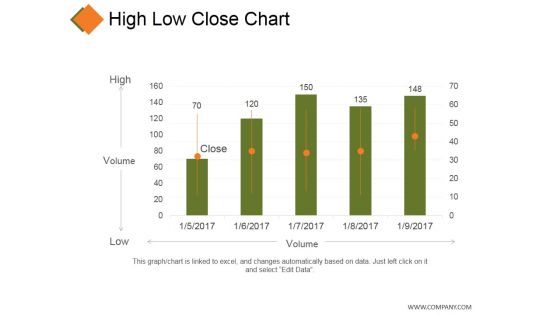
High Low Close Chart Ppt PowerPoint Presentation Model Grid
This is a high low close chart ppt powerpoint presentation model grid. This is a five stage process. The stages in this process are business, high, volume, low, marketing.
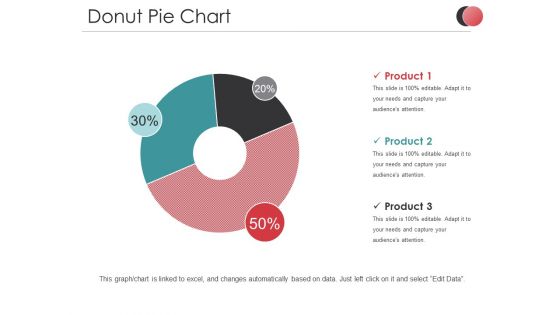
Donut Pie Chart Ppt PowerPoint Presentation Inspiration Background Image
This is a donut pie chart ppt powerpoint presentation inspiration background image. This is a three stage process. The stages in this process are product, percentage, business, marketing, process.
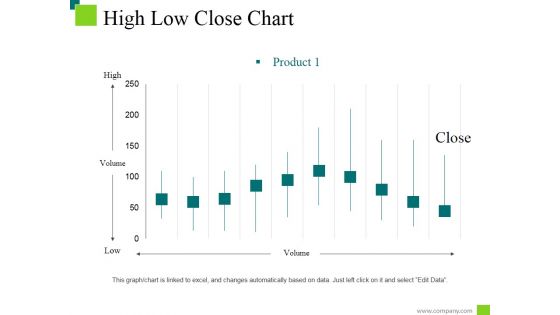
High Low Close Chart Ppt PowerPoint Presentation Styles Information
This is a high low close chart ppt powerpoint presentation styles information. This is a ten stage process. The stages in this process are low, high, product, volume, close.
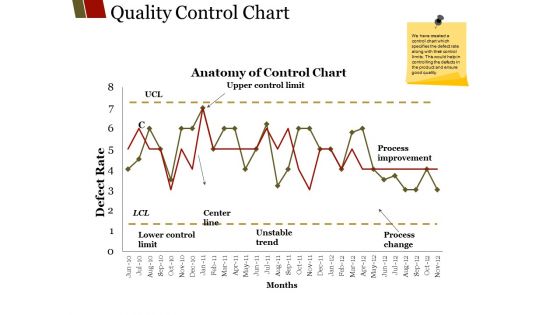
Quality Control Chart Ppt PowerPoint Presentation File Graphics Design
This is a quality control chart ppt powerpoint presentation file graphics design. This is a two stage process. The stages in this process are unstable trend, months center line, lower control limit, process improvement.
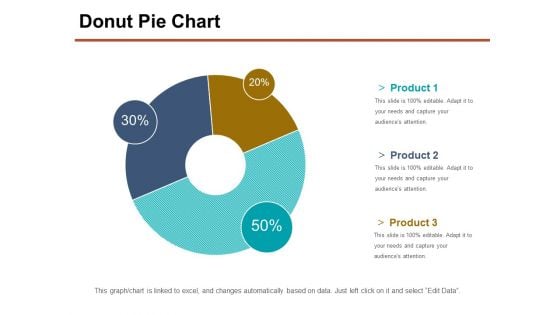
Donut Pie Chart Ppt PowerPoint Presentation Professional Slide Portrait
This is a donut pie chart ppt powerpoint presentation professional slide portrait. This is a three stage process. The stages in this process are product, percentage, business, management, process.
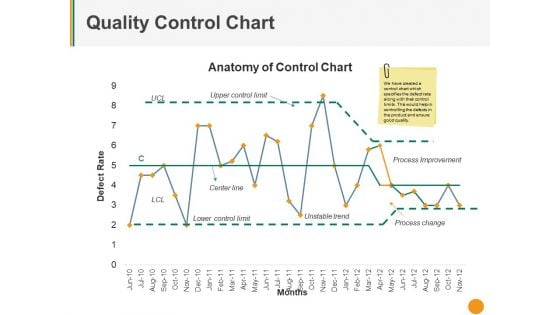
Quality Control Chart Ppt PowerPoint Presentation Pictures Deck
This is a quality control chart ppt powerpoint presentation pictures deck. This is a one stage process. The stages in this process are upper control limit, center line, unstable trend, process improvement, process change.
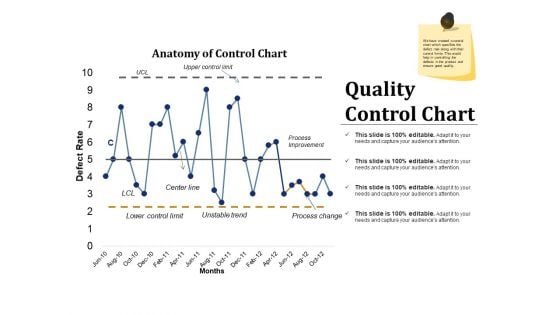
Quality Control Chart Ppt PowerPoint Presentation Inspiration Example Introduction
This is a quality control chart ppt powerpoint presentation inspiration example introduction. This is a two stage process. The stages in this process are process improvement, process change, unstable trend, lower control limit, center line.
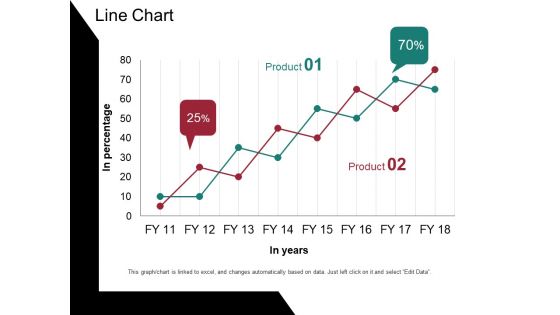
Line Chart Ppt PowerPoint Presentation Portfolio Design Templates
This is a line chart ppt powerpoint presentation portfolio design templates. This is a two stage process. The stages in this process are in percentage, in years, percentage, business, graph.
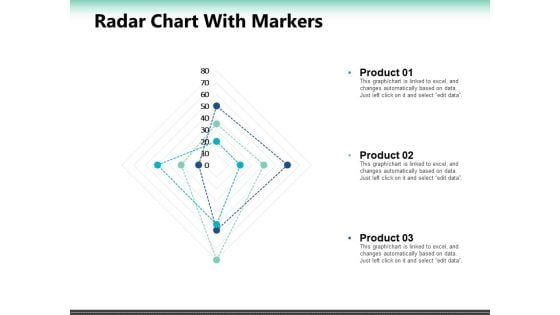
Radar Chart With Markers Ppt PowerPoint Presentation Summary Slide Portrait
This is a radar chart with markers ppt powerpoint presentation summary slide portrait. This is a seven stage process. The stages in this process are percentage, product, business, marketing.
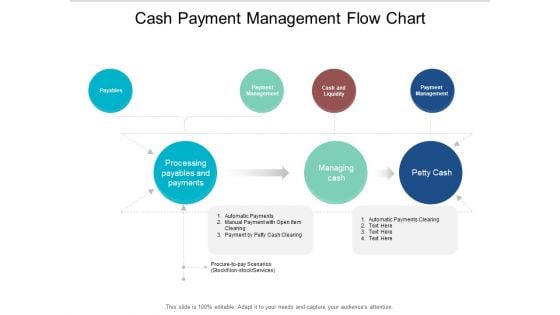
Cash Payment Management Flow Chart Ppt PowerPoint Presentation Styles Professional
This is a cash payment management flow chart ppt powerpoint presentation styles professional. This is a seven stage process. The stages in this process are liquidity, cash assets, solvency.
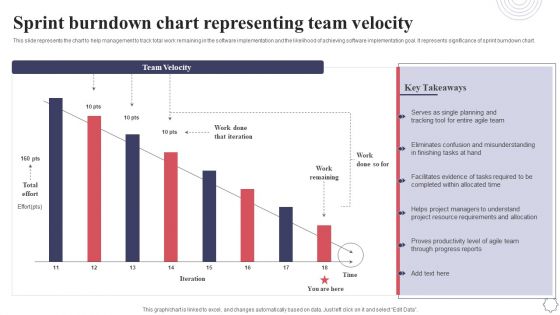
Sprint Burndown Chart Representing Team Velocity Application Deployment Project Plan Ideas PDF
This slide represents the chart to help management to track total work remaining in the software implementation and the likelihood of achieving software implementation goal. It represents significance of sprint burndown chart. Here you can discover an assortment of the finest PowerPoint and Google Slides templates. With these templates, you can create presentations for a variety of purposes while simultaneously providing your audience with an eye catching visual experience. Download Sprint Burndown Chart Representing Team Velocity Application Deployment Project Plan Ideas PDF to deliver an impeccable presentation. These templates will make your job of preparing presentations much quicker, yet still, maintain a high level of quality. Slidegeeks has experienced researchers who prepare these templates and write high quality content for you. Later on, you can personalize the content by editing the Sprint Burndown Chart Representing Team Velocity Application Deployment Project Plan Ideas PDF.
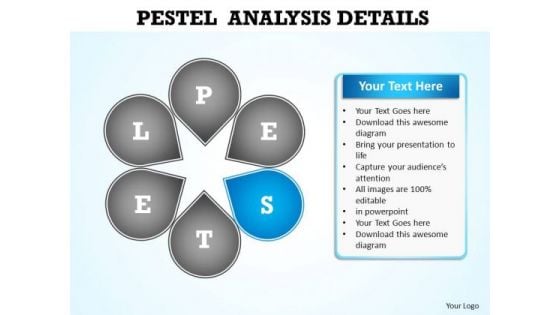
PowerPoint Slide Layout Chart Pestel Analysis Ppt Design
PowerPoint Slide layout Chart Pestel Analysis PPT Design-The Circle of Life - a concept embedded in our minds and hence easy to comprehend. Life and Business is made up of processes comprising stages that flow from one to another. An excellent graphic to attract the attention of and understanding by your audience to improve earnings. Be a conscious and capable citizen. Elaborate on your environmental concerns with our PowerPoint Slide Layout Chart Pestel Analysis Ppt Design.
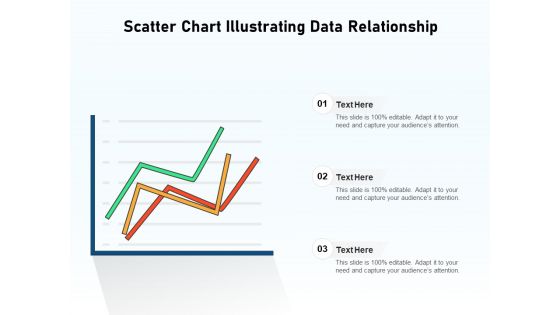
Scatter Chart Illustrating Data Relationship Ppt PowerPoint Presentation Microsoft PDF
Persuade your audience using this scatter chart illustrating data relationship ppt powerpoint presentation microsoft pdf. This PPT design covers three stages, thus making it a great tool to use. It also caters to a variety of topics including scatter chart illustrating data relationship. Download this PPT design now to present a convincing pitch that not only emphasizes the topic but also showcases your presentation skills.
2 Stages Parallel Arrows Represent Flows Business Plan Creator PowerPoint Slides
We present our 2 stages parallel arrows represent flows business plan creator PowerPoint Slides.Download and present our Finance PowerPoint Templates because Our PowerPoint Templates and Slides will give you great value for your money. Be assured of finding the best projection to highlight your words. Use our Arrows PowerPoint Templates because Our PowerPoint Templates and Slides are created by a hardworking bunch of busybees. Always flitting around with solutions gauranteed to please. Present our Business PowerPoint Templates because Our PowerPoint Templates and Slides will fulfill your every need. Use them and effectively satisfy the desires of your audience. Present our Process and Flows PowerPoint Templates because It can Conjure up grand ideas with our magical PowerPoint Templates and Slides. Leave everyone awestruck by the end of your presentation. Present our Success PowerPoint Templates because Our PowerPoint Templates and Slides will Embellish your thoughts. They will help you illustrate the brilliance of your ideas.Use these PowerPoint slides for presentations relating to 3d, Arrow, Banner, Business, Business Concept, Chart, Description, Development, Diagram, Direction, Element, Empty, Financial, Flow, Flowchart, Future, Gradient, Graph, Graphic, Illustration, Isolated, Mirrored, Object, Placeholder, Presentation, Process, Section, Segment, Set, Shape, Sign, Steps, Symbol, Template, Topic, Vector. The prominent colors used in the PowerPoint template are Blue, Black, White. Presenters tell us our 2 stages parallel arrows represent flows business plan creator PowerPoint Slides are designed by professionals We assure you our Description PowerPoint templates and PPT Slides will impress their bosses and teams. Professionals tell us our 2 stages parallel arrows represent flows business plan creator PowerPoint Slides will get their audience's attention. We assure you our Development PowerPoint templates and PPT Slides are designed by professionals People tell us our 2 stages parallel arrows represent flows business plan creator PowerPoint Slides are designed by professionals The feedback we get is that our Chart PowerPoint templates and PPT Slides will impress their bosses and teams. List your strategy succinctly with our 2 Stages Parallel Arrows Represent Flows Business Plan Creator PowerPoint Slides. You will be at the top of your game.
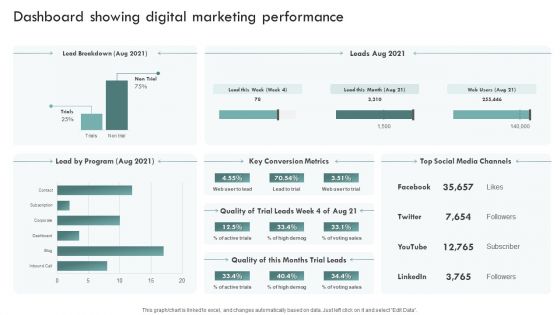
Brand Awareness Plan Dashboard Showing Digital Marketing Performance Sample PDF
This graph or chart is linked to excel, and changes automatically based on data. Just left click on it and select Edit Data. The best PPT templates are a great way to save time, energy, and resources. Slidegeeks have 100 percent editable powerpoint slides making them incredibly versatile. With these quality presentation templates, you can create a captivating and memorable presentation by combining visually appealing slides and effectively communicating your message. Download Brand Awareness Plan Dashboard Showing Digital Marketing Performance Sample PDF from Slidegeeks and deliver a wonderful presentation.
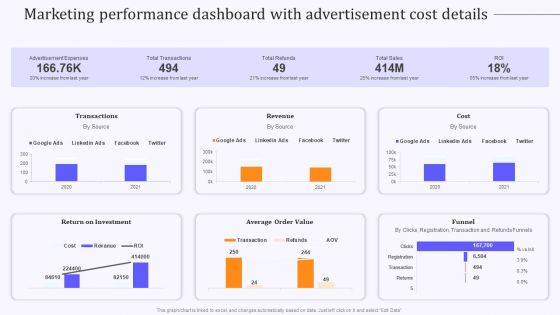
Product Marketing And Awareness Programs Marketing Performance Dashboard Information PDF
This graph or chart is linked to excel, and changes automatically based on data. Just left click on it and select Edit Data. Slidegeeks is one of the best resources for PowerPoint templates. You can download easily and regulate Product Marketing And Awareness Programs Marketing Performance Dashboard Information PDF for your personal presentations from our wonderful collection. A few clicks is all it takes to discover and get the most relevant and appropriate templates. Use our Templates to add a unique zing and appeal to your presentation and meetings. All the slides are easy to edit and you can use them even for advertisement purposes.
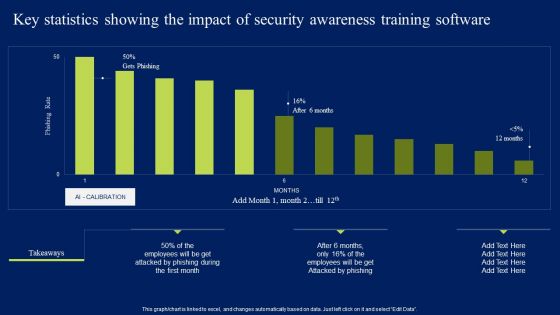
Key Statistics Showing The Impact Of Security Awareness Training Software Elements PDF
This graph or chart is linked to excel, and changes automatically based on data. Just left click on it and select Edit Data. Slidegeeks is one of the best resources for PowerPoint templates. You can download easily and regulate Key Statistics Showing The Impact Of Security Awareness Training Software Elements PDF for your personal presentations from our wonderful collection. A few clicks is all it takes to discover and get the most relevant and appropriate templates. Use our Templates to add a unique zing and appeal to your presentation and meetings. All the slides are easy to edit and you can use them even for advertisement purposes.
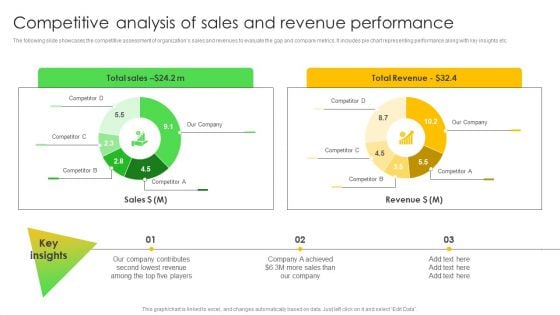
Competitive Analysis Of Sales And Revenue Performance Information PDF
The following slide showcases the competitive assessment of organizations sales and revenues to evaluate the gap and compare metrics. It includes pie chart representing performance along with key insights etc. Slidegeeks is one of the best resources for PowerPoint templates. You can download easily and regulate Competitive Analysis Of Sales And Revenue Performance Information PDF for your personal presentations from our wonderful collection. A few clicks is all it takes to discover and get the most relevant and appropriate templates. Use our Templates to add a unique zing and appeal to your presentation and meetings. All the slides are easy to edit and you can use them even for advertisement purposes.
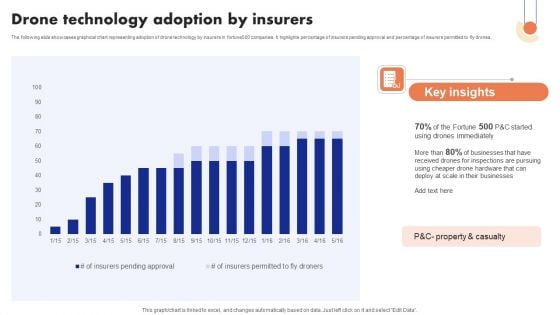
Implementation Of Digital Advancement Techniques Drone Technology Adoption Ideas PDF
The following slide showcases graphical chart representing adoption of drone technology by insurers in fortune500 companies. It highlights percentage of insurers pending approval and percentage of insurers permitted to fly drones. Slidegeeks is one of the best resources for PowerPoint templates. You can download easily and regulate Implementation Of Digital Advancement Techniques Drone Technology Adoption Ideas PDF for your personal presentations from our wonderful collection. A few clicks is all it takes to discover and get the most relevant and appropriate templates. Use our Templates to add a unique zing and appeal to your presentation and meetings. All the slides are easy to edit and you can use them even for advertisement purposes.
Business Charts For Market Statistical Analysis Ppt PowerPoint Presentation Slides Summary PDF
Presenting business charts for market statistical analysis ppt powerpoint presentation slides summary pdf to dispense important information. This template comprises three stages. It also presents valuable insights into the topics including business charts for market statistical analysis. This is a completely customizable PowerPoint theme that can be put to use immediately. So, download it and address the topic impactfully.
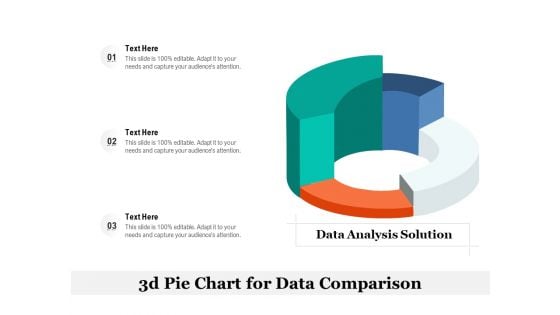
3D Pie Chart For Data Comparison Ppt Infographic Template Vector PDF
Presenting 3d pie chart for data comparison ppt infographic template vector pdf. to dispense important information. This template comprises three stages. It also presents valuable insights into the topics including data analysis solution, 3d pie chart for data comparison. This is a completely customizable PowerPoint theme that can be put to use immediately. So, download it and address the topic impactfully.
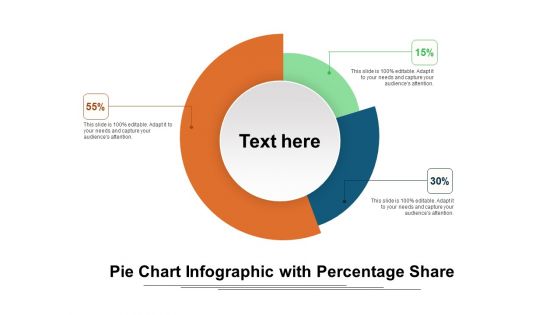
Pie Chart Infographic With Percentage Share Ppt Infographic Template Inspiration PDF
Presenting pie chart infographic with percentage share ppt infographic template inspiration pdf. to dispense important information. This template comprises three stages. It also presents valuable insights into the topics including pie chart infographic with percentage share. This is a completely customizable PowerPoint theme that can be put to use immediately. So, download it and address the topic impactfully.
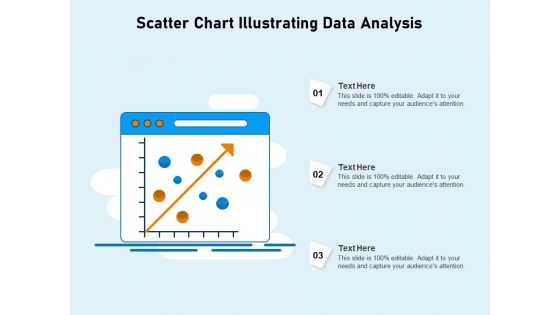
Scatter Chart Illustrating Data Analysis Ppt PowerPoint Presentation Show Graphic Tips PDF
Presenting scatter chart illustrating data analysis ppt powerpoint presentation show graphic tips pdf to dispense important information. This template comprises three stages. It also presents valuable insights into the topics including scatter chart illustrating data analysis. This is a completely customizable PowerPoint theme that can be put to use immediately. So, download it and address the topic impactfully.
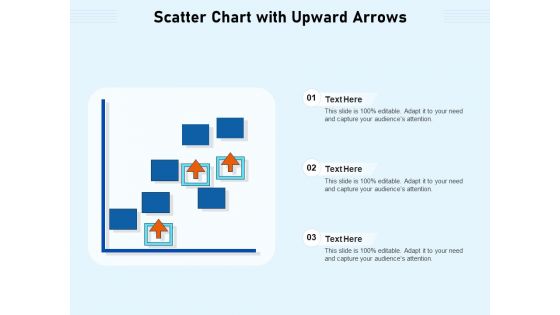
Scatter Chart With Upward Arrows Ppt PowerPoint Presentation Outline Tips PDF
Presenting scatter chart with upward arrows ppt powerpoint presentation outline tips pdf to dispense important information. This template comprises three stages. It also presents valuable insights into the topics including scatter chart with upward arrows. This is a completely customizable PowerPoint theme that can be put to use immediately. So, download it and address the topic impactfully.
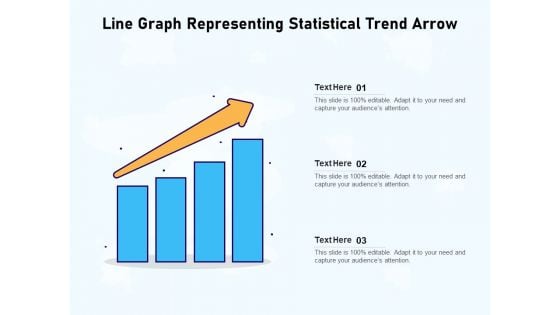
Line Chart Illustrating Business Statistical Trends Ppt PowerPoint Presentation Outline Deck PDF
Presenting line chart illustrating business statistical trends ppt powerpoint presentation outline deck pdf to dispense important information. This template comprises three stages. It also presents valuable insights into the topics including line chart illustrating business statistical trends. This is a completely customizable PowerPoint theme that can be put to use immediately. So, download it and address the topic impactfully.

Trend Arrow Chart Illustrating Business Projection Ppt PowerPoint Presentation Ideas Sample PDF
Presenting trend arrow chart illustrating business projection ppt powerpoint presentation ideas sample pdf to dispense important information. This template comprises three stages. It also presents valuable insights into the topics including trend arrow chart illustrating business projection. This is a completely customizable PowerPoint theme that can be put to use immediately. So, download it and address the topic impactfully.
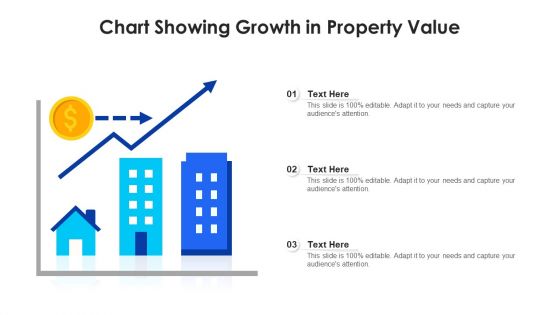
Chart Showing Growth In Property Value Ppt PowerPoint Presentation File Background Designs PDF
Presenting chart showing growth in property value ppt powerpoint presentation file background designs pdf to dispense important information. This template comprises three stages. It also presents valuable insights into the topics including chart showing growth in property value. This is a completely customizable PowerPoint theme that can be put to use immediately. So, download it and address the topic impactfully.
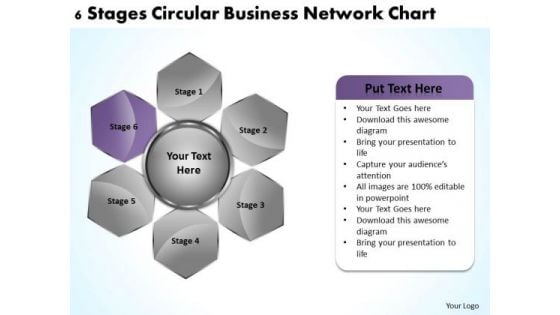
Business Process Strategy 6 Stages Circular Network Chart It
We present our business process strategy 6 stages circular network chart it.Download and present our Circle Charts PowerPoint Templates because Our PowerPoint Templates and Slides will help you be quick off the draw. Just enter your specific text and see your points hit home. Download and present our Business PowerPoint Templates because Our PowerPoint Templates and Slides will let your ideas bloom. Create a bed of roses for your audience. Download and present our Process and Flows PowerPoint Templates because They will bring a lot to the table. Their alluring flavours will make your audience salivate. Present our Shapes PowerPoint Templates because Our PowerPoint Templates and Slides are effectively colour coded to prioritise your plans They automatically highlight the sequence of events you desire. Download our Flow Charts PowerPoint Templates because You should Press the right buttons with our PowerPoint Templates and Slides. They will take your ideas down the perfect channel.Use these PowerPoint slides for presentations relating to Abstract, background, brochure, brown, business, chart, circle, concept, cross, description, development, diagram, goals, gray, guide, illustration, item, management, marketing, model, parts, purple pie, plans, presentation, reports, round, six, template, text, title, vector, website, wheel, www. The prominent colors used in the PowerPoint template are Purple, Gray, Black. Consult experts with our Business Process Strategy 6 Stages Circular Network Chart It. Download without worries with our money back guaranteee.
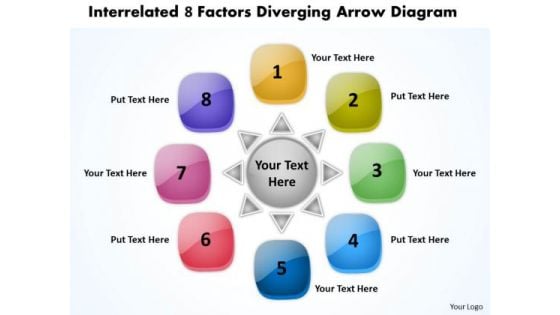
Interrelated 8 Factors Diverging Arrow Diagram Pie Network PowerPoint Templates
We present our interrelated 8 factors diverging arrow diagram Pie Network PowerPoint templates.Present our Boxes PowerPoint Templates because it is the time to bond with family, friends, colleagues and any other group of your choice. Download our Business PowerPoint Templates because the majestic tiger lord of all it surveys.It exudes power even when it is in repose. Present our Arrows PowerPoint Templates because you will be able to Highlight the various ways in which we can maintain its efficiency. Download and present our Shapes PowerPoint Templates because you can Start with the fundamental basic activities and slowly but surely hone them down to the top of the pyramid, the ultimate goal. Download our Flow Charts PowerPoint Templates because the plans are in your head, stage by stage, year by year.Use these PowerPoint slides for presentations relating to abstract, arrow, backdrop, background, banner, blank, blue, box, bright, brochure, business, chart, circle, color, colorful, concept, cube, description, design, diagram, element, empty, graphic, illustration, item, management, marketing, message, modern, network, pink, place, presentation, shape, sign, site, square, style, symbol, template, text, vector, web, website, yellow. The prominent colors used in the PowerPoint template are Red, Pink, Purple. Presenters tell us our interrelated 8 factors diverging arrow diagram Pie Network PowerPoint templates effectively help you save your valuable time. You can be sure our backdrop PowerPoint templates and PPT Slides provide great value for your money. Be assured of finding the best projection to highlight your words. Professionals tell us our interrelated 8 factors diverging arrow diagram Pie Network PowerPoint templates are Reminiscent. People tell us our bright PowerPoint templates and PPT Slides are Spectacular. People tell us our interrelated 8 factors diverging arrow diagram Pie Network PowerPoint templates are Stylish. Professionals tell us our background PowerPoint templates and PPT Slides are Zippy. Get people to listen with our Interrelated 8 Factors Diverging Arrow Diagram Pie Network PowerPoint Templates. You will come out on top.
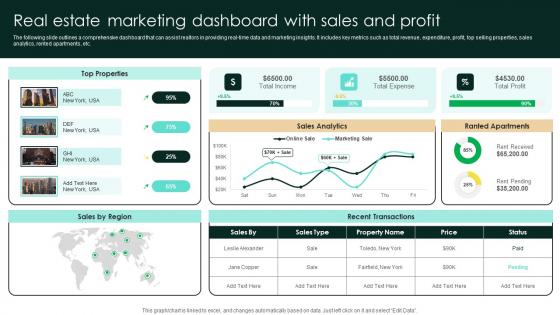
Real Estate Marketing Dashboard With Sales And Profit Strategic Real Estate Elements Pdf
The following slide outlines a comprehensive dashboard that can assist realtors in providing real-time data and marketing insights. It includes key metrics such as total revenue, expenditure, profit, top selling properties, sales analytics, rented apartments, etc. Whether you have daily or monthly meetings, a brilliant presentation is necessary. Real Estate Marketing Dashboard With Sales And Profit Strategic Real Estate Elements Pdf can be your best option for delivering a presentation. Represent everything in detail using Real Estate Marketing Dashboard With Sales And Profit Strategic Real Estate Elements Pdf and make yourself stand out in meetings. The template is versatile and follows a structure that will cater to your requirements. All the templates prepared by Slidegeeks are easy to download and edit. Our research experts have taken care of the corporate themes as well. So, give it a try and see the results. The following slide outlines a comprehensive dashboard that can assist realtors in providing real-time data and marketing insights. It includes key metrics such as total revenue, expenditure, profit, top selling properties, sales analytics, rented apartments, etc.
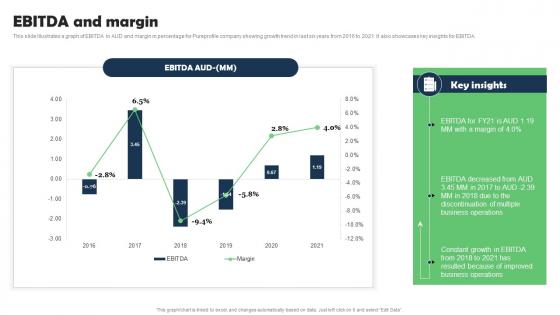
EBITDA And Margin Marketing Research Services Management Business Information Pdf
This slide illustrates a graph of EBITDA in AUD and margin in percentage for Pureprofile company showing growth trend in last six years from 2016 to 2021. It also showcases key insights for EBITDA. Whether you have daily or monthly meetings, a brilliant presentation is necessary. EBITDA And Margin Marketing Research Services Management Business Information Pdf can be your best option for delivering a presentation. Represent everything in detail using EBITDA And Margin Marketing Research Services Management Business Information Pdf and make yourself stand out in meetings. The template is versatile and follows a structure that will cater to your requirements. All the templates prepared by Slidegeeks are easy to download and edit. Our research experts have taken care of the corporate themes as well. So, give it a try and see the results. This slide illustrates a graph of EBITDA in AUD and margin in percentage for Pureprofile company showing growth trend in last six years from 2016 to 2021. It also showcases key insights for EBITDA.
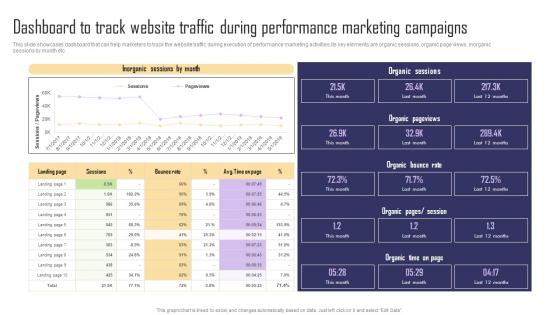
Dashboard To Track Website Traffic During Performance Paid Internet Marketing Strategy Guidelines Pdf
This slide showcases dashboard that can help marketers to track the website traffic during execution of performance marketing activities.Its key elements are organic sessions, organic page views, inorganic sessions by month etc. Whether you have daily or monthly meetings, a brilliant presentation is necessary. Dashboard To Track Website Traffic During Performance Paid Internet Marketing Strategy Guidelines Pdf can be your best option for delivering a presentation. Represent everything in detail using Dashboard To Track Website Traffic During Performance Paid Internet Marketing Strategy Guidelines Pdf and make yourself stand out in meetings. The template is versatile and follows a structure that will cater to your requirements. All the templates prepared by Slidegeeks are easy to download and edit. Our research experts have taken care of the corporate themes as well. So, give it a try and see the results. This slide showcases dashboard that can help marketers to track the website traffic during execution of performance marketing activities.Its key elements are organic sessions, organic page views, inorganic sessions by month etc.

 Home
Home