Cost Icon
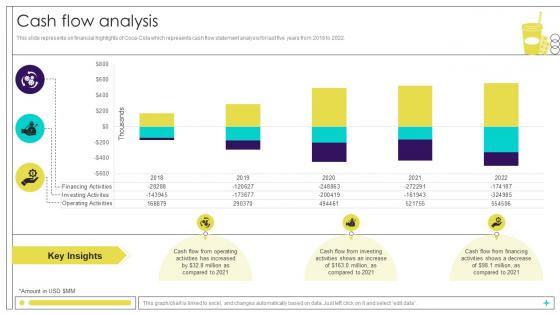
Cash Flow Analysis Beverage Manufacturer Company Profile Ppt Example CP SS V
This slide represents on financial highlights of Coca-Cola which represents cash flow statement analysis for last five years from 2018 to 2022. Do you have an important presentation coming up Are you looking for something that will make your presentation stand out from the rest Look no further than Cash Flow Analysis Beverage Manufacturer Company Profile Ppt Example CP SS V. With our professional designs, you can trust that your presentation will pop and make delivering it a smooth process. And with Slidegeeks, you can trust that your presentation will be unique and memorable. So why wait Grab Cash Flow Analysis Beverage Manufacturer Company Profile Ppt Example CP SS V today and make your presentation stand out from the rest This slide represents on financial highlights of Coca-Cola which represents cash flow statement analysis for last five years from 2018 to 2022.
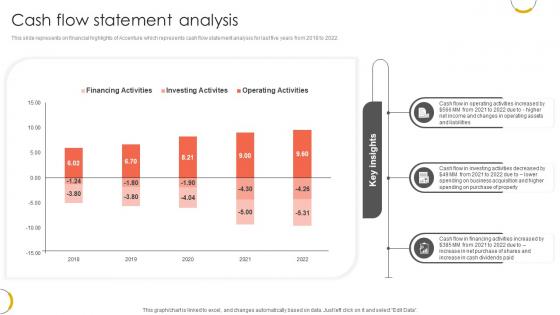
Cash Flow Statement Analysis Professional Services And Technology Consulting Ppt Example CP SS V
This slide represents on financial highlights of Accenture which represents cash flow statement analysis for last five years from 2018 to 2022. Find highly impressive Cash Flow Statement Analysis Professional Services And Technology Consulting Ppt Example CP SS V on Slidegeeks to deliver a meaningful presentation. You can save an ample amount of time using these presentation templates. No need to worry to prepare everything from scratch because Slidegeeks experts have already done a huge research and work for you. You need to download Cash Flow Statement Analysis Professional Services And Technology Consulting Ppt Example CP SS V for your upcoming presentation. All the presentation templates are 100 percent editable and you can change the color and personalize the content accordingly. Download now This slide represents on financial highlights of Accenture which represents cash flow statement analysis for last five years from 2018 to 2022.
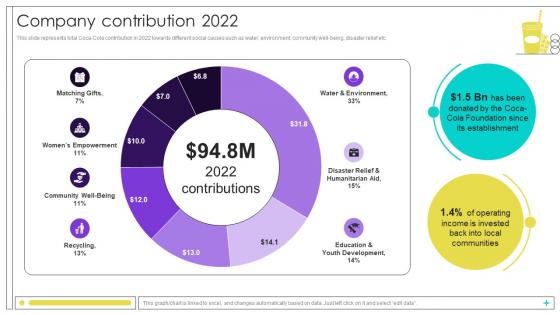
Company Contribution 2022 Beverage Manufacturer Company Profile Ppt Powerpoint CP SS V
This slide represents total Coca-Cola contribution in 2022 towards different social causes such as water, environment, community well-being, disaster relief etc. Are you in need of a template that can accommodate all of your creative concepts This one is crafted professionally and can be altered to fit any style. Use it with Google Slides or PowerPoint. Include striking photographs, symbols, depictions, and other visuals. Fill, move around, or remove text boxes as desired. Test out color palettes and font mixtures. Edit and save your work, or work with colleagues. Download Company Contribution 2022 Beverage Manufacturer Company Profile Ppt Powerpoint CP SS V and observe how to make your presentation outstanding. Give an impeccable presentation to your group and make your presentation unforgettable. This slide represents total Coca-Cola contribution in 2022 towards different social causes such as water, environment, community well-being, disaster relief etc.
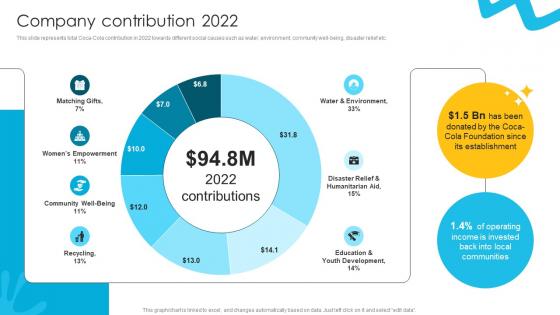
Company Contribution 2022 Liquid Refreshment Manufacturer Company Profile Ppt Template CP SS V
This slide represents total Coca-Cola contribution in 2022 towards different social causes such as water, environment, community well-being, disaster relief etc. Crafting an eye-catching presentation has never been more straightforward. Let your presentation shine with this tasteful yet straightforward Company Contribution 2022 Liquid Refreshment Manufacturer Company Profile Ppt Template CP SS V template. It offers a minimalistic and classy look that is great for making a statement. The colors have been employed intelligently to add a bit of playfulness while still remaining professional. Construct the ideal Company Contribution 2022 Liquid Refreshment Manufacturer Company Profile Ppt Template CP SS V that effortlessly grabs the attention of your audience Begin now and be certain to wow your customers This slide represents total Coca-Cola contribution in 2022 towards different social causes such as water, environment, community well-being, disaster relief etc.

Cultural Diversity Professional Services And Technology Consulting Ppt Template CP SS V
This slide represents cultural diversity overview for Accenture highlighting company board diversity and board tenure. It also covers information such as board committee members, diverse directors and average age for director nominee. Explore a selection of the finest Cultural Diversity Professional Services And Technology Consulting Ppt Template CP SS V here. With a plethora of professionally designed and pre-made slide templates, you can quickly and easily find the right one for your upcoming presentation. You can use our Cultural Diversity Professional Services And Technology Consulting Ppt Template CP SS V to effectively convey your message to a wider audience. Slidegeeks has done a lot of research before preparing these presentation templates. The content can be personalized and the slides are highly editable. Grab templates today from Slidegeeks. This slide represents cultural diversity overview for Accenture highlighting company board diversity and board tenure. It also covers information such as board committee members, diverse directors and average age for director nominee.

Employee Count Trend Professional Services And Technology Consulting Ppt Template CP SS V
This slide represents the employee count trend of Accenture from 2018 to 2022 year. It also covers information regarding new members added to workforce, total training hours etc. Slidegeeks has constructed Employee Count Trend Professional Services And Technology Consulting Ppt Template CP SS V after conducting extensive research and examination. These presentation templates are constantly being generated and modified based on user preferences and critiques from editors. Here, you will find the most attractive templates for a range of purposes while taking into account ratings and remarks from users regarding the content. This is an excellent jumping-off point to explore our content and will give new users an insight into our top-notch PowerPoint Templates. This slide represents the employee count trend of Accenture from 2018 to 2022 year. It also covers information regarding new members added to workforce, total training hours etc.
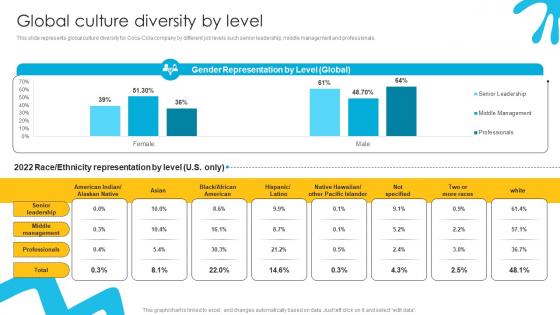
Global Culture Diversity By Level Liquid Refreshment Manufacturer Company Profile Ppt Powerpoint CP SS V
This slide represents global culture diversity for Coca-Cola company by different job levels such senior leadership, middle management and professionals. Find a pre-designed and impeccable Global Culture Diversity By Level Liquid Refreshment Manufacturer Company Profile Ppt Powerpoint CP SS V. The templates can ace your presentation without additional effort. You can download these easy-to-edit presentation templates to make your presentation stand out from others. So, what are you waiting for Download the template from Slidegeeks today and give a unique touch to your presentation. This slide represents global culture diversity for Coca-Cola company by different job levels such senior leadership, middle management and professionals.
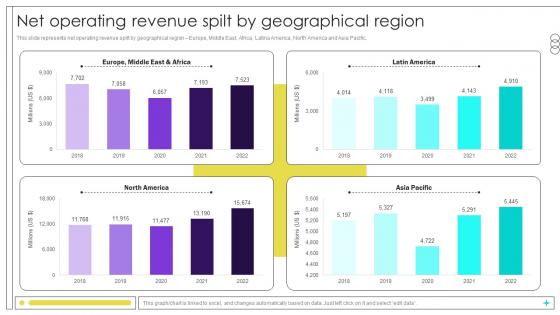
Net Operating Revenue Spilt By Geographical Region Beverage Manufacturer Company Profile Ppt Template CP SS V
This slide represents net operating revenue spilt by geographical region Europe, Middle East, Africa, Latina America, North America and Asia Pacific. Are you in need of a template that can accommodate all of your creative concepts This one is crafted professionally and can be altered to fit any style. Use it with Google Slides or PowerPoint. Include striking photographs, symbols, depictions, and other visuals. Fill, move around, or remove text boxes as desired. Test out color palettes and font mixtures. Edit and save your work, or work with colleagues. Download Net Operating Revenue Spilt By Geographical Region Beverage Manufacturer Company Profile Ppt Template CP SS V and observe how to make your presentation outstanding. Give an impeccable presentation to your group and make your presentation unforgettable. This slide represents net operating revenue spilt by geographical region Europe, Middle East, Africa, Latina America, North America and Asia Pacific.
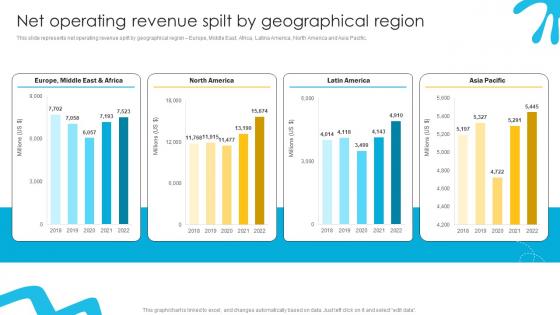
Net Operating Revenue Spilt By Liquid Refreshment Manufacturer Company Profile Ppt Example CP SS V
This slide represents net operating revenue spilt by geographical region Europe, Middle East, Africa, Latina America, North America and Asia Pacific. Crafting an eye-catching presentation has never been more straightforward. Let your presentation shine with this tasteful yet straightforward Net Operating Revenue Spilt By Liquid Refreshment Manufacturer Company Profile Ppt Example CP SS V template. It offers a minimalistic and classy look that is great for making a statement. The colors have been employed intelligently to add a bit of playfulness while still remaining professional. Construct the ideal Net Operating Revenue Spilt By Liquid Refreshment Manufacturer Company Profile Ppt Example CP SS V that effortlessly grabs the attention of your audience Begin now and be certain to wow your customers This slide represents net operating revenue spilt by geographical region Europe, Middle East, Africa, Latina America, North America and Asia Pacific.
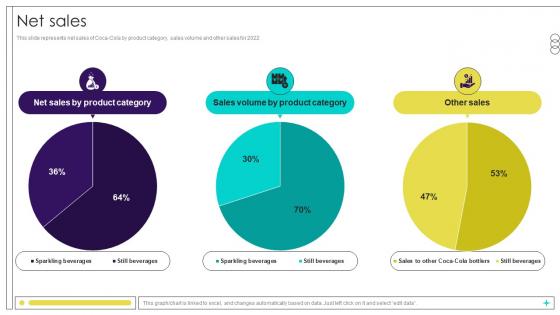
Net Sales Beverage Manufacturer Company Profile Ppt Presentation CP SS V
This slide represents net sales of Coca-Cola by product category, sales volume and other sales for 2022Make sure to capture your audiences attention in your business displays with our gratis customizable Net Sales Beverage Manufacturer Company Profile Ppt Presentation CP SS V. These are great for business strategies, office conferences, capital raising or task suggestions. If you desire to acquire more customers for your tech business and ensure they stay satisfied, create your own sales presentation with these plain slides. This slide represents net sales of Coca-Cola by product category, sales volume and other sales for 2022
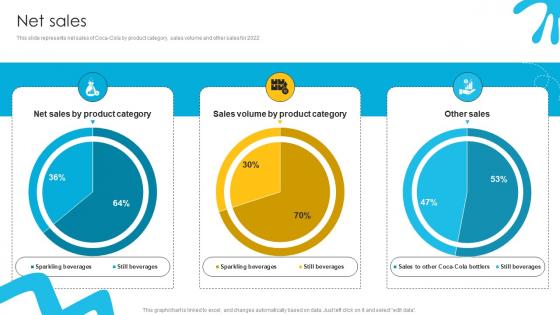
Net Sales Liquid Refreshment Manufacturer Company Profile Ppt Slides CP SS V
This slide represents net sales of Coca-Cola by product category, sales volume and other sales for 2022Formulating a presentation can take up a lot of effort and time, so the content and message should always be the primary focus. The visuals of the PowerPoint can enhance the presenters message, so our Net Sales Liquid Refreshment Manufacturer Company Profile Ppt Slides CP SS V was created to help save time. Instead of worrying about the design, the presenter can concentrate on the message while our designers work on creating the ideal templates for whatever situation is needed. Slidegeeks has experts for everything from amazing designs to valuable content, we have put everything into Net Sales Liquid Refreshment Manufacturer Company Profile Ppt Slides CP SS V. This slide represents net sales of Coca-Cola by product category, sales volume and other sales for 2022
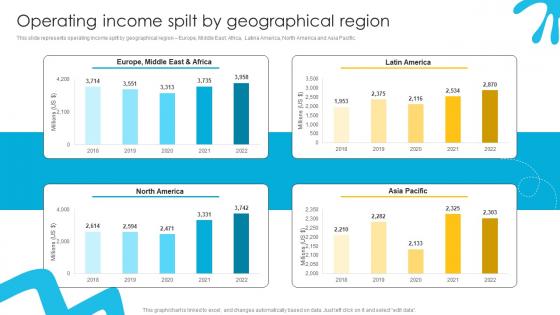
Operating Income Spilt By Geographical Liquid Refreshment Manufacturer Company Profile Ppt Example CP SS V
This slide represents operating income spilt by geographical region Europe, Middle East, Africa, Latina America, North America and Asia Pacific. Explore a selection of the finest Operating Income Spilt By Geographical Liquid Refreshment Manufacturer Company Profile Ppt Example CP SS V here. With a plethora of professionally designed and pre-made slide templates, you can quickly and easily find the right one for your upcoming presentation. You can use our Operating Income Spilt By Geographical Liquid Refreshment Manufacturer Company Profile Ppt Example CP SS V to effectively convey your message to a wider audience. Slidegeeks has done a lot of research before preparing these presentation templates. The content can be personalized and the slides are highly editable. Grab templates today from Slidegeeks. This slide represents operating income spilt by geographical region Europe, Middle East, Africa, Latina America, North America and Asia Pacific.
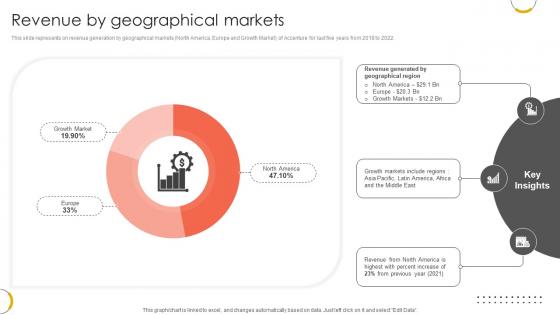
Revenue By Geographical Markets Professional Services And Technology Consulting Ppt Template CP SS V
This slide represents on revenue generation by geographical markets North America, Europe and Growth Market of Accenture for last five years from 2018 to 2022. Presenting this PowerPoint presentation, titled Revenue By Geographical Markets Professional Services And Technology Consulting Ppt Template CP SS V, with topics curated by our researchers after extensive research. This editable presentation is available for immediate download and provides attractive features when used. Download now and captivate your audience. Presenting this Revenue By Geographical Markets Professional Services And Technology Consulting Ppt Template CP SS V. Our researchers have carefully researched and created these slides with all aspects taken into consideration. This is a completely customizable Revenue By Geographical Markets Professional Services And Technology Consulting Ppt Template CP SS V that is available for immediate downloading. Download now and make an impact on your audience. Highlight the attractive features available with our PPTs. This slide represents on revenue generation by geographical markets North America, Europe and Growth Market of Accenture for last five years from 2018 to 2022.
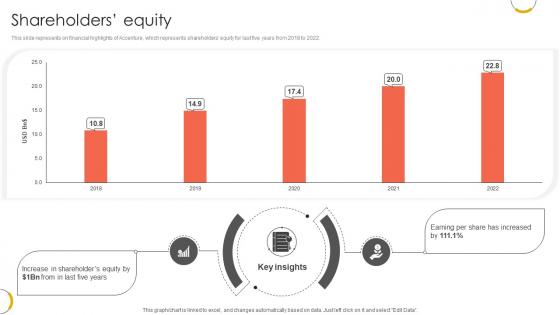
Shareholders Equity Professional Services And Technology Consulting Ppt Powerpoint CP SS V
This slide represents on financial highlights of Accenture, which represents shareholders equity for last five years from 2018 to 2022. Here you can discover an assortment of the finest PowerPoint and Google Slides templates. With these templates, you can create presentations for a variety of purposes while simultaneously providing your audience with an eye-catching visual experience. Download Shareholders Equity Professional Services And Technology Consulting Ppt Powerpoint CP SS V to deliver an impeccable presentation. These templates will make your job of preparing presentations much quicker, yet still, maintain a high level of quality. Slidegeeks has experienced researchers who prepare these templates and write high-quality content for you. Later on, you can personalize the content by editing the Shareholders Equity Professional Services And Technology Consulting Ppt Powerpoint CP SS V. This slide represents on financial highlights of Accenture, which represents shareholders equity for last five years from 2018 to 2022.
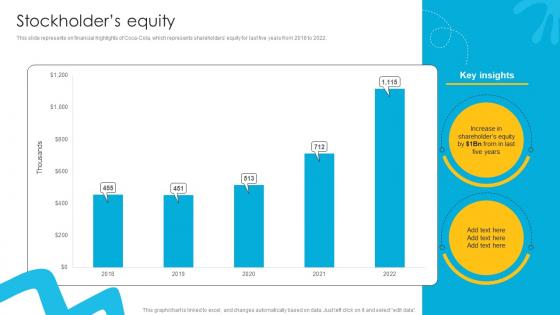
Stockholders Equity Liquid Refreshment Manufacturer Company Profile Ppt Example CP SS V
This slide represents on financial highlights of Coca-Cola, which represents shareholders equity for last five years from 2018 to 2022. Create an editable Stockholders Equity Liquid Refreshment Manufacturer Company Profile Ppt Example CP SS V that communicates your idea and engages your audience. Whether you are presenting a business or an educational presentation, pre-designed presentation templates help save time. Stockholders Equity Liquid Refreshment Manufacturer Company Profile Ppt Example CP SS V is highly customizable and very easy to edit, covering many different styles from creative to business presentations. Slidegeeks has creative team members who have crafted amazing templates. So, go and get them without any delay. This slide represents on financial highlights of Coca-Cola, which represents shareholders equity for last five years from 2018 to 2022.
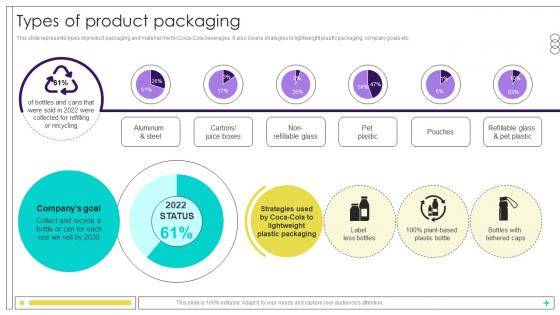
Types Of Product Packaging Beverage Manufacturer Company Profile Ppt Powerpoint CP SS V
This slide represents types of product packaging and material mix for Coca-Cola beverages. It also covers strategies to lightweight plastic packaging, company goals etc. Do you have an important presentation coming up Are you looking for something that will make your presentation stand out from the rest Look no further than Types Of Product Packaging Beverage Manufacturer Company Profile Ppt Powerpoint CP SS V. With our professional designs, you can trust that your presentation will pop and make delivering it a smooth process. And with Slidegeeks, you can trust that your presentation will be unique and memorable. So why wait Grab Types Of Product Packaging Beverage Manufacturer Company Profile Ppt Powerpoint CP SS V today and make your presentation stand out from the rest This slide represents types of product packaging and material mix for Coca-Cola beverages. It also covers strategies to lightweight plastic packaging, company goals etc.
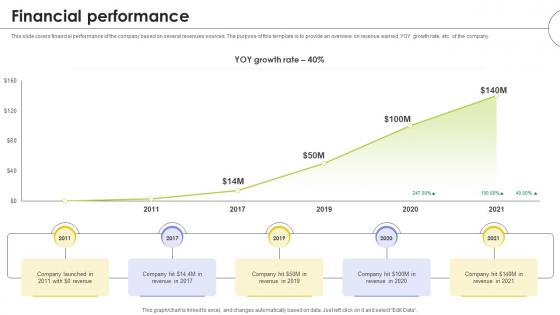
Financial Performance Web Based Automated Tool Platform Pitch Deck Ppt Slides
This slide covers financial performance of the company based on several revenues sources. The purpose of this template is to provide an overview on revenue earned, YOY growth rate, etc. of the company. From laying roadmaps to briefing everything in detail, our templates are perfect for you. You can set the stage with your presentation slides. All you have to do is download these easy-to-edit and customizable templates. Financial Performance Web Based Automated Tool Platform Pitch Deck Ppt Slides will help you deliver an outstanding performance that everyone would remember and praise you for. Do download this presentation today. This slide covers financial performance of the company based on several revenues sources. The purpose of this template is to provide an overview on revenue earned, YOY growth rate, etc. of the company.
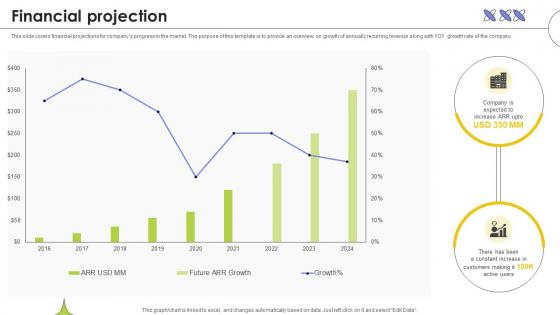
Financial Projection Web Based Automated Tool Platform Pitch Deck Ppt Template
This slide covers financial projections for companys progress in the market. The purpose of this template is to provide an overview on growth of annually recurring revenue along with YOY growth rate of the company. Present like a pro with Financial Projection Web Based Automated Tool Platform Pitch Deck Ppt Template. Create beautiful presentations together with your team, using our easy-to-use presentation slides. Share your ideas in real-time and make changes on the fly by downloading our templates. So whether you are in the office, on the go, or in a remote location, you can stay in sync with your team and present your ideas with confidence. With Slidegeeks presentation got a whole lot easier. Grab these presentations today. This slide covers financial projections for companys progress in the market. The purpose of this template is to provide an overview on growth of annually recurring revenue along with YOY growth rate of the company.
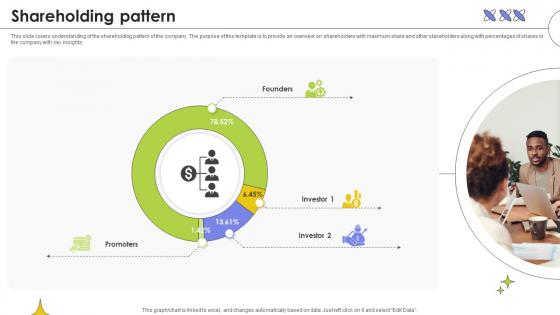
Shareholding Pattern Web Based Automated Tool Platform Pitch Deck Ppt Template
This slide covers understanding of the shareholding pattern of the company. The purpose of this template is to provide an overview on shareholders with maximum share and other stakeholders along with percentages of shares in the company with key insights. This modern and well-arranged Shareholding Pattern Web Based Automated Tool Platform Pitch Deck Ppt Template provides lots of creative possibilities. It is very simple to customize and edit with the Powerpoint Software. Just drag and drop your pictures into the shapes. All facets of this template can be edited with Powerpoint, no extra software is necessary. Add your own material, put your images in the places assigned for them, adjust the colors, and then you can show your slides to the world, with an animated slide included. This slide covers understanding of the shareholding pattern of the company. The purpose of this template is to provide an overview on shareholders with maximum share and other stakeholders along with percentages of shares in the company with key insights.
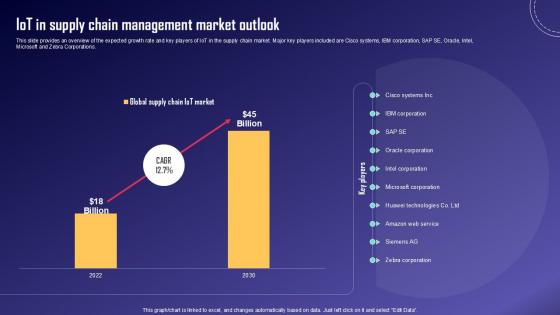
IoT In Supply Chain Management IoT Fleet Monitoring Ppt Template IoT SS V
This slide provides an overview of the expected growth rate and key players of IoT in the supply chain market. Major key players included are Cisco systems, IBM corporation, SAP SE, Oracle, Intel, Microsoft and Zebra Corporations. Here you can discover an assortment of the finest PowerPoint and Google Slides templates. With these templates, you can create presentations for a variety of purposes while simultaneously providing your audience with an eye-catching visual experience. Download IoT In Supply Chain Management IoT Fleet Monitoring Ppt Template IoT SS V to deliver an impeccable presentation. These templates will make your job of preparing presentations much quicker, yet still, maintain a high level of quality. Slidegeeks has experienced researchers who prepare these templates and write high-quality content for you. Later on, you can personalize the content by editing the IoT In Supply Chain Management IoT Fleet Monitoring Ppt Template IoT SS V. This slide provides an overview of the expected growth rate and key players of IoT in the supply chain market. Major key players included are Cisco systems, IBM corporation, SAP SE, Oracle, Intel, Microsoft and Zebra Corporations.
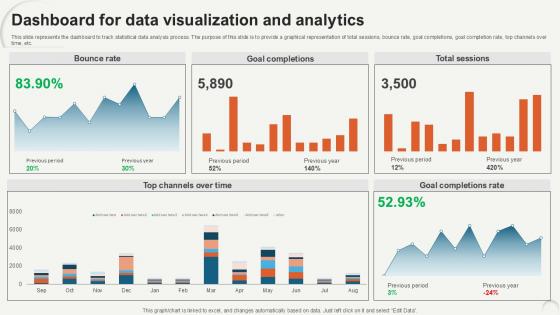
Dashboard For Data Visualization Data Analytics For Informed Decision Ppt Sample
This slide represents the dashboard to track statistical data analysis process. The purpose of this slide is to provide a graphical representation of total sessions, bounce rate, goal completions, goal completion rate, top channels over time, etc. Do you have an important presentation coming up Are you looking for something that will make your presentation stand out from the rest Look no further than Dashboard For Data Visualization Data Analytics For Informed Decision Ppt Sample. With our professional designs, you can trust that your presentation will pop and make delivering it a smooth process. And with Slidegeeks, you can trust that your presentation will be unique and memorable. So why wait Grab Dashboard For Data Visualization Data Analytics For Informed Decision Ppt Sample today and make your presentation stand out from the rest This slide represents the dashboard to track statistical data analysis process. The purpose of this slide is to provide a graphical representation of total sessions, bounce rate, goal completions, goal completion rate, top channels over time, etc.
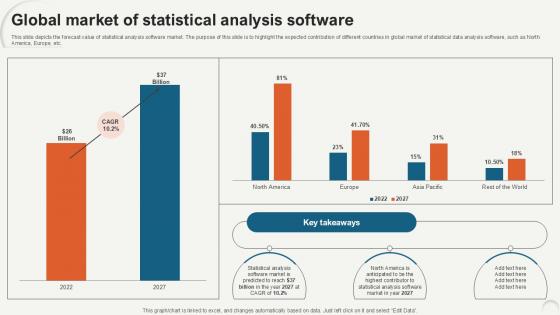
Global Market Of Statistical Data Analytics For Informed Decision Ppt PowerPoint
This slide depicts the forecast value of statistical analysis software market. The purpose of this slide is to highlight the expected contribution of different countries in global market of statistical data analysis software, such as North America, Europe, etc. Are you in need of a template that can accommodate all of your creative concepts This one is crafted professionally and can be altered to fit any style. Use it with Google Slides or PowerPoint. Include striking photographs, symbols, depictions, and other visuals. Fill, move around, or remove text boxes as desired. Test out color palettes and font mixtures. Edit and save your work, or work with colleagues. Download Global Market Of Statistical Data Analytics For Informed Decision Ppt PowerPoint and observe how to make your presentation outstanding. Give an impeccable presentation to your group and make your presentation unforgettable. This slide depicts the forecast value of statistical analysis software market. The purpose of this slide is to highlight the expected contribution of different countries in global market of statistical data analysis software, such as North America, Europe, etc.
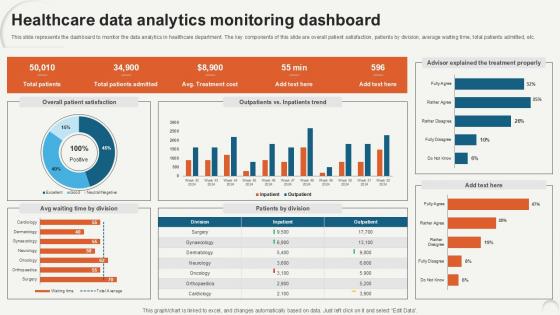
Healthcare Data Analytics Monitoring Data Analytics For Informed Decision Ppt PowerPoint
This slide represents the dashboard to monitor the data analytics in healthcare department. The key components of this slide are overall patient satisfaction, patients by division, average waiting time, total patients admitted, etc. Make sure to capture your audiences attention in your business displays with our gratis customizable Healthcare Data Analytics Monitoring Data Analytics For Informed Decision Ppt PowerPoint. These are great for business strategies, office conferences, capital raising or task suggestions. If you desire to acquire more customers for your tech business and ensure they stay satisfied, create your own sales presentation with these plain slides. This slide represents the dashboard to monitor the data analytics in healthcare department. The key components of this slide are overall patient satisfaction, patients by division, average waiting time, total patients admitted, etc.
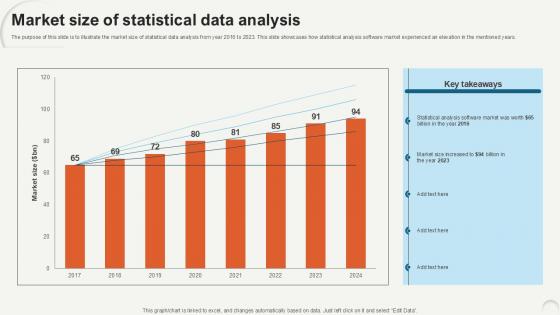
Market Size Of Statistical Data Analytics For Informed Decision Ppt Template
The purpose of this slide is to illustrate the market size of statistical data analysis from year 2016 to 2023. This slide showcases how statistical analysis software market experienced an elevation in the mentioned years. Explore a selection of the finest Market Size Of Statistical Data Analytics For Informed Decision Ppt Template here. With a plethora of professionally designed and pre-made slide templates, you can quickly and easily find the right one for your upcoming presentation. You can use our Market Size Of Statistical Data Analytics For Informed Decision Ppt Template to effectively convey your message to a wider audience. Slidegeeks has done a lot of research before preparing these presentation templates. The content can be personalized and the slides are highly editable. Grab templates today from Slidegeeks. The purpose of this slide is to illustrate the market size of statistical data analysis from year 2016 to 2023. This slide showcases how statistical analysis software market experienced an elevation in the mentioned years.
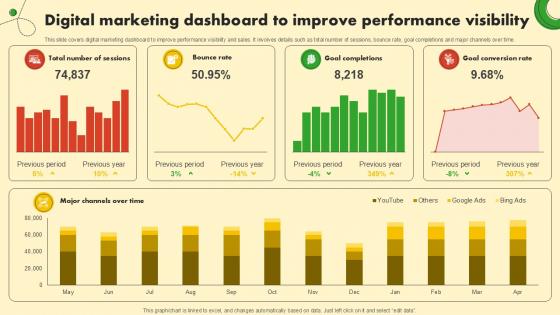
Digital Marketing Dashboard To Food And Grocery Retail Ppt Slide
This slide covers digital marketing dashboard to improve performance visibility and sales. It involves details such as total number of sessions, bounce rate, goal completions and major channels over time. Do you have an important presentation coming up Are you looking for something that will make your presentation stand out from the rest Look no further than Digital Marketing Dashboard To Food And Grocery Retail Ppt Slide. With our professional designs, you can trust that your presentation will pop and make delivering it a smooth process. And with Slidegeeks, you can trust that your presentation will be unique and memorable. So why wait Grab Digital Marketing Dashboard To Food And Grocery Retail Ppt Slide today and make your presentation stand out from the rest This slide covers digital marketing dashboard to improve performance visibility and sales. It involves details such as total number of sessions, bounce rate, goal completions and major channels over time.
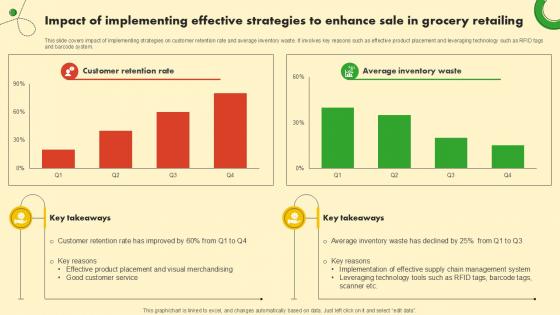
Impact Of Implementing Effective Food And Grocery Retail Ppt Presentation
This slide covers impact of implementing strategies on customer retention rate and average inventory waste. It involves key reasons such as effective product placement and leveraging technology such as RFID tags and barcode system. Find a pre-designed and impeccable Impact Of Implementing Effective Food And Grocery Retail Ppt Presentation. The templates can ace your presentation without additional effort. You can download these easy-to-edit presentation templates to make your presentation stand out from others. So, what are you waiting for Download the template from Slidegeeks today and give a unique touch to your presentation. This slide covers impact of implementing strategies on customer retention rate and average inventory waste. It involves key reasons such as effective product placement and leveraging technology such as RFID tags and barcode system.
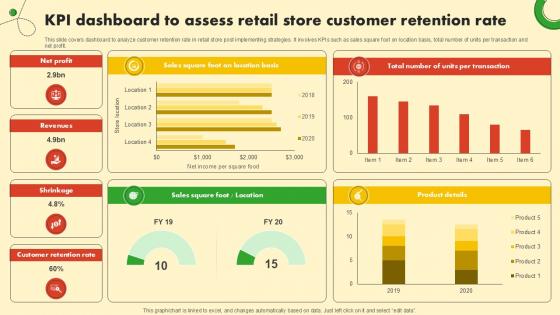
KPI Dashboard To Assess Retail Store Food And Grocery Retail Ppt Presentation
This slide covers dashboard to analyze customer retention rate in retail store post implementing strategies. It involves KPIs such as sales square foot on location basis, total number of units per transaction and net profit. Present like a pro with KPI Dashboard To Assess Retail Store Food And Grocery Retail Ppt Presentation. Create beautiful presentations together with your team, using our easy-to-use presentation slides. Share your ideas in real-time and make changes on the fly by downloading our templates. So whether you are in the office, on the go, or in a remote location, you can stay in sync with your team and present your ideas with confidence. With Slidegeeks presentation got a whole lot easier. Grab these presentations today. This slide covers dashboard to analyze customer retention rate in retail store post implementing strategies. It involves KPIs such as sales square foot on location basis, total number of units per transaction and net profit.
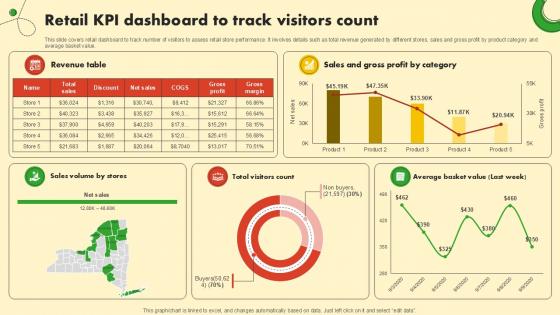
Retail KPI Dashboard To Track Food And Grocery Retail Ppt Slide
This slide covers retail dashboard to track number of visitors to assess retail store performance. It involves details such as total revenue generated by different stores, sales and gross profit by product category and average basket value. This Retail KPI Dashboard To Track Food And Grocery Retail Ppt Slide is perfect for any presentation, be it in front of clients or colleagues. It is a versatile and stylish solution for organizing your meetings. The Retail KPI Dashboard To Track Food And Grocery Retail Ppt Slide features a modern design for your presentation meetings. The adjustable and customizable slides provide unlimited possibilities for acing up your presentation. Slidegeeks has done all the homework before launching the product for you. So, do not wait, grab the presentation templates today This slide covers retail dashboard to track number of visitors to assess retail store performance. It involves details such as total revenue generated by different stores, sales and gross profit by product category and average basket value.
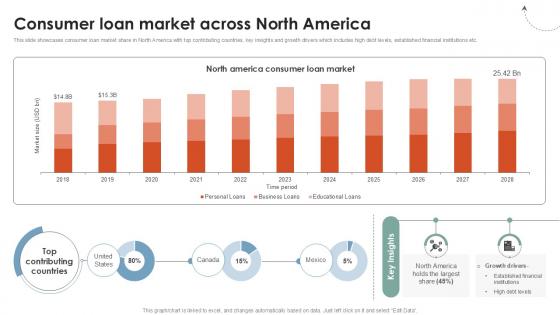
Consumer Loan Market Across Global Consumer Financial Ppt Template CRP DK SS V
This slide showcases consumer loan market share in North America with top contributing countries, key insights and growth drivers which includes high debt levels, established financial institutions etc. Want to ace your presentation in front of a live audience Our Consumer Loan Market Across Global Consumer Financial Ppt Template CRP DK SS V can help you do that by engaging all the users towards you. Slidegeeks experts have put their efforts and expertise into creating these impeccable powerpoint presentations so that you can communicate your ideas clearly. Moreover, all the templates are customizable, and easy-to-edit and downloadable. Use these for both personal and commercial use. This slide showcases consumer loan market share in North America with top contributing countries, key insights and growth drivers which includes high debt levels, established financial institutions etc.
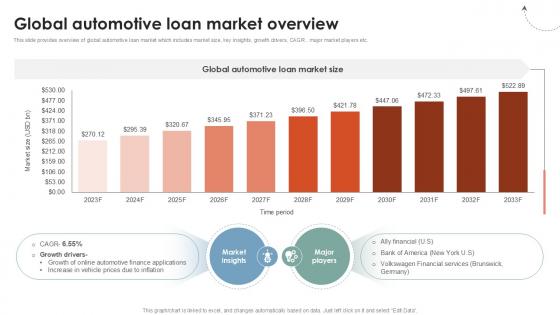
Global Automotive Loan Market Global Consumer Financial Ppt Slide CRP DK SS V
This slide provides overview of global automotive loan market which includes market size, key insights, growth drivers, CAGR , major market players etc. From laying roadmaps to briefing everything in detail, our templates are perfect for you. You can set the stage with your presentation slides. All you have to do is download these easy-to-edit and customizable templates. Global Automotive Loan Market Global Consumer Financial Ppt Slide CRP DK SS V will help you deliver an outstanding performance that everyone would remember and praise you for. Do download this presentation today. This slide provides overview of global automotive loan market which includes market size, key insights, growth drivers, CAGR , major market players etc.
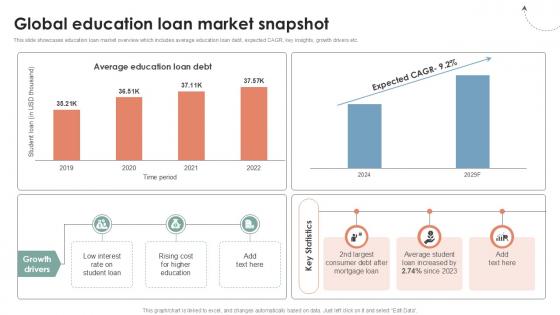
Global Education Loan Global Consumer Financial Ppt Sample CRP DK SS V
This slide showcases education loan market overview which includes average education loan debt, expected CAGR, key insights, growth drivers etc. Are you in need of a template that can accommodate all of your creative concepts This one is crafted professionally and can be altered to fit any style. Use it with Google Slides or PowerPoint. Include striking photographs, symbols, depictions, and other visuals. Fill, move around, or remove text boxes as desired. Test out color palettes and font mixtures. Edit and save your work, or work with colleagues. Download Global Education Loan Global Consumer Financial Ppt Sample CRP DK SS V and observe how to make your presentation outstanding. Give an impeccable presentation to your group and make your presentation unforgettable. This slide showcases education loan market overview which includes average education loan debt, expected CAGR, key insights, growth drivers etc.
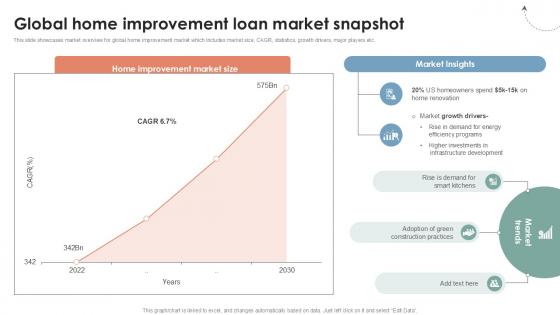
Global Home Improvement Loan Global Consumer Financial Ppt Slide CRP DK SS V
This slide showcases market overview for global home improvement market which includes market size, CAGR, statistics, growth drivers, major players etc. Make sure to capture your audiences attention in your business displays with our gratis customizable Global Home Improvement Loan Global Consumer Financial Ppt Slide CRP DK SS V. These are great for business strategies, office conferences, capital raising or task suggestions. If you desire to acquire more customers for your tech business and ensure they stay satisfied, create your own sales presentation with these plain slides. This slide showcases market overview for global home improvement market which includes market size, CAGR, statistics, growth drivers, major players etc.
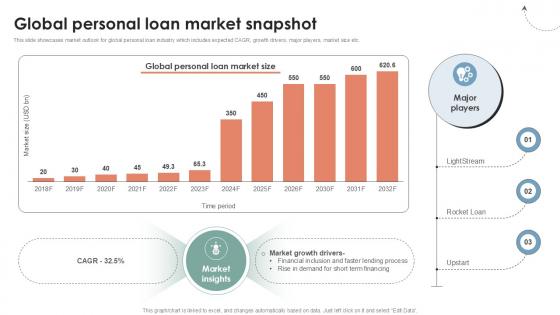
Global Personal Loan Market Global Consumer Financial Ppt Template CRP DK SS V
This slide showcases market outlook for global personal loan industry which includes expected CAGR, growth drivers, major players, market size etc. Explore a selection of the finest Global Personal Loan Market Global Consumer Financial Ppt Template CRP DK SS V here. With a plethora of professionally designed and pre-made slide templates, you can quickly and easily find the right one for your upcoming presentation. You can use our Global Personal Loan Market Global Consumer Financial Ppt Template CRP DK SS V to effectively convey your message to a wider audience. Slidegeeks has done a lot of research before preparing these presentation templates. The content can be personalized and the slides are highly editable. Grab templates today from Slidegeeks. This slide showcases market outlook for global personal loan industry which includes expected CAGR, growth drivers, major players, market size etc.
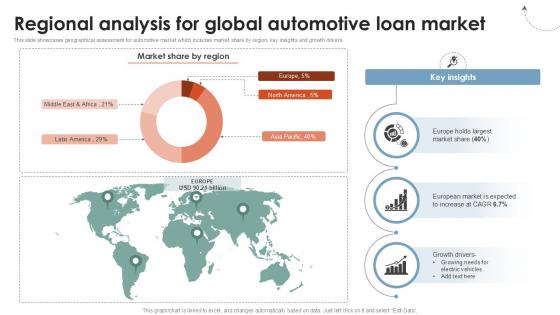
Regional Analysis For Global Consumer Financial Ppt Example CRP DK SS V
This slide showcases geographical assessment for automotive market which includes market share by region, key insights and growth drivers. Make sure to capture your audiences attention in your business displays with our gratis customizable Regional Analysis For Global Consumer Financial Ppt Example CRP DK SS V. These are great for business strategies, office conferences, capital raising or task suggestions. If you desire to acquire more customers for your tech business and ensure they stay satisfied, create your own sales presentation with these plain slides. This slide showcases geographical assessment for automotive market which includes market share by region, key insights and growth drivers.
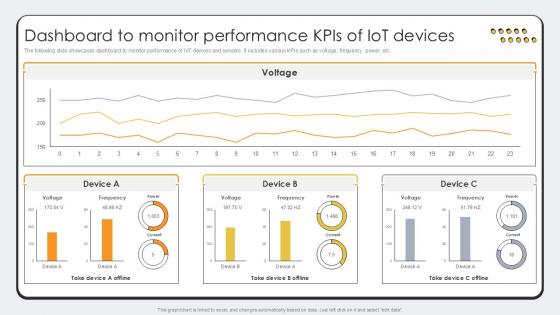
Dashboard To Monitor Performance Revolutionizing Production IoT Ppt Template
The following slide showcases dashboard to monitor performance of IoT devices and sensors. It includes various KPIs such as voltage, frequency, power, etc. Find highly impressive Dashboard To Monitor Performance Revolutionizing Production IoT Ppt Template on Slidegeeks to deliver a meaningful presentation. You can save an ample amount of time using these presentation templates. No need to worry to prepare everything from scratch because Slidegeeks experts have already done a huge research and work for you. You need to download Dashboard To Monitor Performance Revolutionizing Production IoT Ppt Template for your upcoming presentation. All the presentation templates are 100 percent editable and you can change the color and personalize the content accordingly. Download now The following slide showcases dashboard to monitor performance of IoT devices and sensors. It includes various KPIs such as voltage, frequency, power, etc.
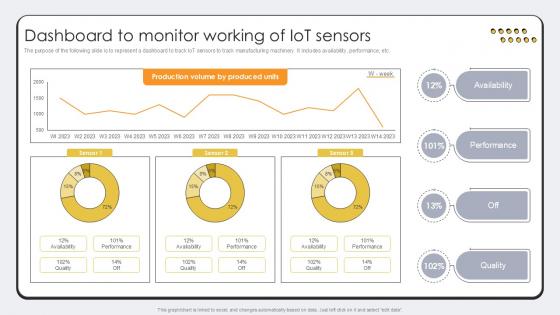
Dashboard To Monitor Working Of Revolutionizing Production IoT Ppt Presentation
The purpose of the following slide is to represent a dashboard to track IoT sensors to track manufacturing machinery. It includes availability, performance, etc. If your project calls for a presentation, then Slidegeeks is your go-to partner because we have professionally designed, easy-to-edit templates that are perfect for any presentation. After downloading, you can easily edit Dashboard To Monitor Working Of Revolutionizing Production IoT Ppt Presentation and make the changes accordingly. You can rearrange slides or fill them with different images. Check out all the handy templates The purpose of the following slide is to represent a dashboard to track IoT sensors to track manufacturing machinery. It includes availability, performance, etc.
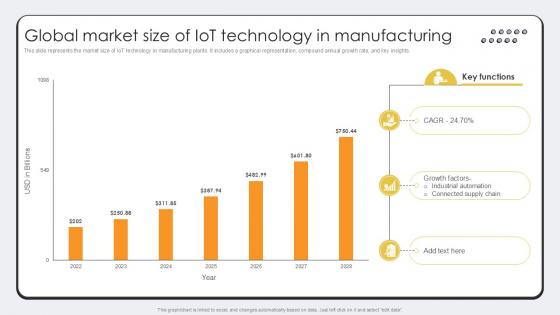
Global Market Size Of IoT Technology Revolutionizing Production IoT Ppt Presentation
This slide represents the market size of IoT technology in manufacturing plants. It includes a graphical representation, compound annual growth rate, and key insights. Coming up with a presentation necessitates that the majority of the effort goes into the content and the message you intend to convey. The visuals of a PowerPoint presentation can only be effective if it supplements and supports the story that is being told. Keeping this in mind our experts created Global Market Size Of IoT Technology Revolutionizing Production IoT Ppt Presentation to reduce the time that goes into designing the presentation. This way, you can concentrate on the message while our designers take care of providing you with the right template for the situation. This slide represents the market size of IoT technology in manufacturing plants. It includes a graphical representation, compound annual growth rate, and key insights.
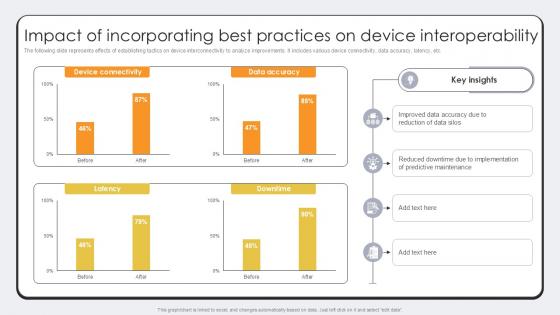
Impact Of Incorporating Best Practices Revolutionizing Production IoT Ppt Template
The following slide represents effects of establishing tactics on device interconnectivity to analyze improvements. It includes various device connectivity, data accuracy, latency, etc. Explore a selection of the finest Impact Of Incorporating Best Practices Revolutionizing Production IoT Ppt Template here. With a plethora of professionally designed and pre-made slide templates, you can quickly and easily find the right one for your upcoming presentation. You can use our Impact Of Incorporating Best Practices Revolutionizing Production IoT Ppt Template to effectively convey your message to a wider audience. Slidegeeks has done a lot of research before preparing these presentation templates. The content can be personalized and the slides are highly editable. Grab templates today from Slidegeeks. The following slide represents effects of establishing tactics on device interconnectivity to analyze improvements. It includes various device connectivity, data accuracy, latency, etc.
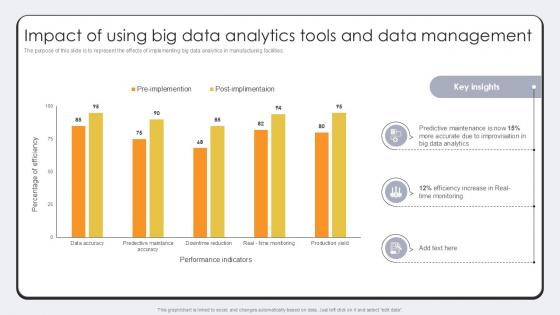
Impact Of Using Big Data Analytics Revolutionizing Production IoT Ppt Sample
The purpose of this slide is to represent the effects of implementing big data analytics in manufacturing facilities. The Impact Of Using Big Data Analytics Revolutionizing Production IoT Ppt Sample is a compilation of the most recent design trends as a series of slides. It is suitable for any subject or industry presentation, containing attractive visuals and photo spots for businesses to clearly express their messages. This template contains a variety of slides for the user to input data, such as structures to contrast two elements, bullet points, and slides for written information. Slidegeeks is prepared to create an impression. The purpose of this slide is to represent the effects of implementing big data analytics in manufacturing facilities.
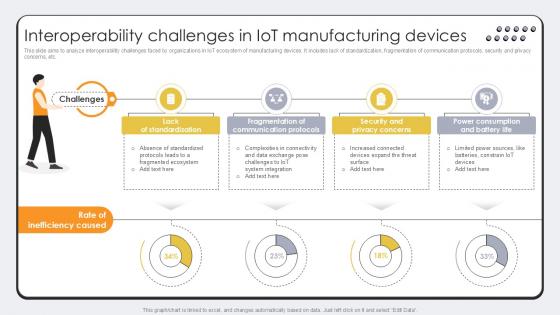
Interoperability Challenges In Revolutionizing Production IoT Ppt Sample
This slide aims to analyze interoperability challenges faced by organizations in IoT ecosystem of manufacturing devices. It includes lack of standardization, fragmentation of communication protocols, security and privacy concerns, etc. Slidegeeks has constructed Interoperability Challenges In Revolutionizing Production IoT Ppt Sample after conducting extensive research and examination. These presentation templates are constantly being generated and modified based on user preferences and critiques from editors. Here, you will find the most attractive templates for a range of purposes while taking into account ratings and remarks from users regarding the content. This is an excellent jumping-off point to explore our content and will give new users an insight into our top-notch PowerPoint Templates. This slide aims to analyze interoperability challenges faced by organizations in IoT ecosystem of manufacturing devices. It includes lack of standardization, fragmentation of communication protocols, security and privacy concerns, etc.
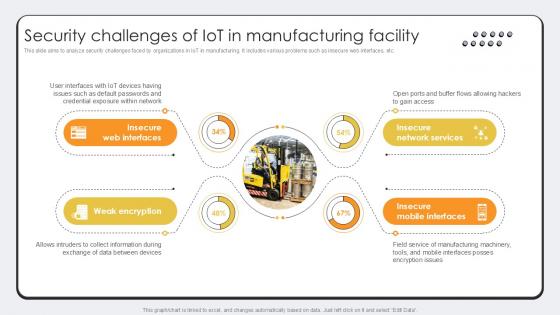
Security Challenges Of IoT In Revolutionizing Production IoT Ppt Example
This slide aims to analyze security challenges faced by organizations in IoT in manufacturing. It includes various problems such as insecure web interfaces, etc. Here you can discover an assortment of the finest PowerPoint and Google Slides templates. With these templates, you can create presentations for a variety of purposes while simultaneously providing your audience with an eye-catching visual experience. Download Security Challenges Of IoT In Revolutionizing Production IoT Ppt Example to deliver an impeccable presentation. These templates will make your job of preparing presentations much quicker, yet still, maintain a high level of quality. Slidegeeks has experienced researchers who prepare these templates and write high-quality content for you. Later on, you can personalize the content by editing the Security Challenges Of IoT In Revolutionizing Production IoT Ppt Example. This slide aims to analyze security challenges faced by organizations in IoT in manufacturing. It includes various problems such as insecure web interfaces, etc.
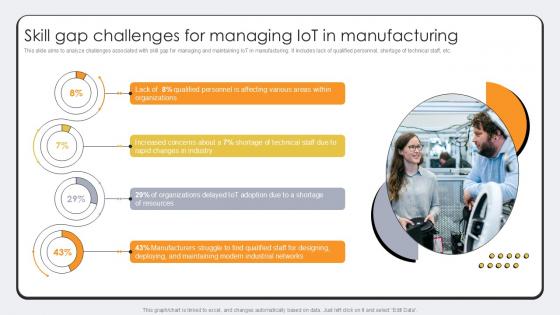
Skill Gap Challenges For Managing Revolutionizing Production IoT Ppt Sample
This slide aims to analyze challenges associated with skill gap for managing and maintaining IoT in manufacturing. It includes lack of qualified personnel, shortage of technical staff, etc. This Skill Gap Challenges For Managing Revolutionizing Production IoT Ppt Sample from Slidegeeks makes it easy to present information on your topic with precision. It provides customization options, so you can make changes to the colors, design, graphics, or any other component to create a unique layout. It is also available for immediate download, so you can begin using it right away. Slidegeeks has done good research to ensure that you have everything you need to make your presentation stand out. Make a name out there for a brilliant performance. This slide aims to analyze challenges associated with skill gap for managing and maintaining IoT in manufacturing. It includes lack of qualified personnel, shortage of technical staff, etc.
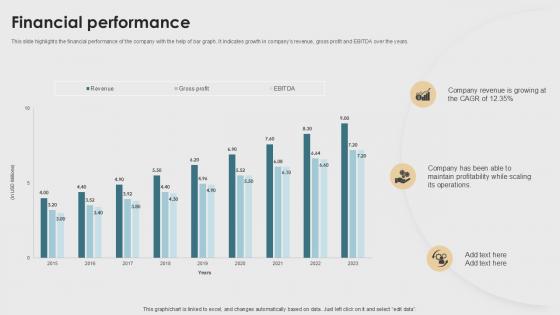
Financial Performance Property Listings Platform Pitch Deck PPT Sample
This slide highlights the financial performance of the company with the help of bar graph. It indicates growth in companys revenue, gross profit and EBITDA over the years. Present like a pro with Financial Performance Property Listings Platform Pitch Deck PPT Sample. Create beautiful presentations together with your team, using our easy to use presentation slides. Share your ideas in real time and make changes on the fly by downloading our templates. So whether you are in the office, on the go, or in a remote location, you can stay in sync with your team and present your ideas with confidence. With Slidegeeks presentation got a whole lot easier. Grab these presentations today. This slide highlights the financial performance of the company with the help of bar graph.It indicates growth in companys revenue, gross profit and EBITDA over the years.
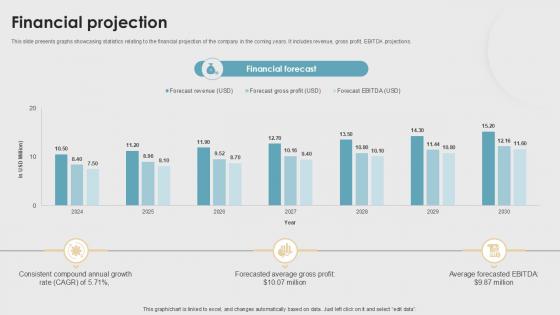
Financial Projection Property Listings Platform Pitch Deck PPT Sample
This slide presents graphs showcasing statistics relating to the financial projection of the company in the coming years. It includes revenue, gross profit, EBITDA projections. Slidegeeks is here to make your presentations a breeze with Financial Projection Property Listings Platform Pitch Deck PPT Sample With our easy to use and customizable templates, you can focus on delivering your ideas rather than worrying about formatting. With a variety of designs to choose from, you are sure to find one that suits your needs. And with animations and unique photos, illustrations, and fonts, you can make your presentation pop. So whether you are giving a sales pitch or presenting to the board, make sure to check out Slidegeeks first This slide presents graphs showcasing statistics relating to the financial projection of the company in the coming years.It includes revenue, gross profit, EBITDA projections.

Market Potential Property Listings Platform Pitch Deck PPT Sample
This slide presents a line graph showcasing the real estate platform market potential in Latin America. It also highlights market opportunities by highlighting market size forecast, CAGR, active user numbers in Latin America. Are you in need of a template that can accommodate all of your creative concepts This one is crafted professionally and can be altered to fit any style. Use it with Google Slides or PowerPoint. Include striking photographs, symbols, depictions, and other visuals. Fill, move around, or remove text boxes as desired. Test out color palettes and font mixtures. Edit and save your work, or work with colleagues. Download Market Potential Property Listings Platform Pitch Deck PPT Sample and observe how to make your presentation outstanding. Give an impeccable presentation to your group and make your presentation unforgettable. This slide presents a line graph showcasing the real estate platform market potential in Latin America.It also highlights market opportunities by highlighting market size forecast, CAGR, active user numbers in Latin America.
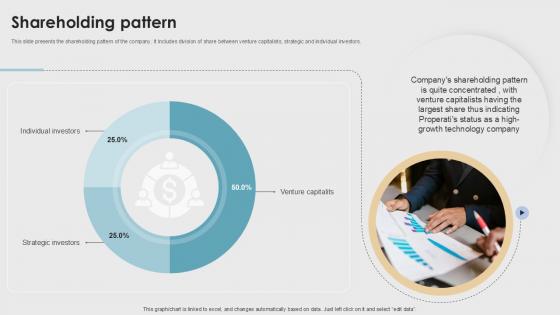
Shareholding Pattern Property Listings Platform Pitch Deck PPT Example
This slide presents the shareholding pattern of the company. It includes division of share between venture capitalists, strategic and individual investors. This Shareholding Pattern Property Listings Platform Pitch Deck PPT Example is perfect for any presentation, be it in front of clients or colleagues. It is a versatile and stylish solution for organizing your meetings. The Shareholding Pattern Property Listings Platform Pitch Deck PPT Example features a modern design for your presentation meetings. The adjustable and customizable slides provide unlimited possibilities for acing up your presentation. Slidegeeks has done all the homework before launching the product for you. So, do not wait, grab the presentation templates today This slide presents the shareholding pattern of the company.It includes division of share between venture capitalists, strategic and individual investors.
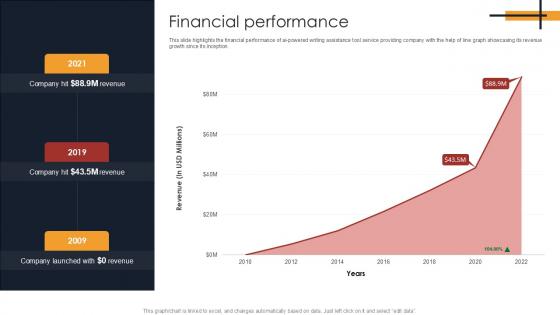
Financial Performance Writing Enhancement Software Pitch Deck PPT Example
This slide highlights the financial performance of ai powered writing assistance tool service providing company with the help of line graph showcasing its revenue growth since its inception. Find a pre designed and impeccable Financial Performance Writing Enhancement Software Pitch Deck PPT Example. The templates can ace your presentation without additional effort. You can download these easy to edit presentation templates to make your presentation stand out from others. So, what are you waiting for Download the template from Slidegeeks today and give a unique touch to your presentation. This slide highlights the financial performance of ai powered writing assistance tool service providing company with the help of line graph showcasing its revenue growth since its inception.
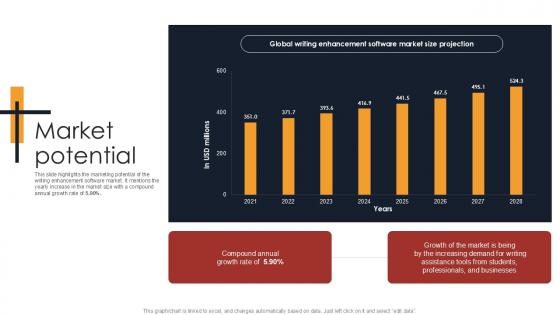
Market Potential Writing Enhancement Software Pitch Deck PPT Example
This slide highlights the marketing potential of the writing enhancement software market. It mentions the yearly increase in the market size with a compound annual growth rate of 5.90 Percent. Get a simple yet stunning designed Market Potential Writing Enhancement Software Pitch Deck PPT Example. It is the best one to establish the tone in your meetings. It is an excellent way to make your presentations highly effective. So, download this PPT today from Slidegeeks and see the positive impacts. Our easy to edit Market Potential Writing Enhancement Software Pitch Deck PPT Example can be your go to option for all upcoming conferences and meetings. So, what are you waiting for Grab this template today. This slide highlights the marketing potential of the writing enhancement software market.It mentions the yearly increase in the market size with a compound annual growth rate of 5.90 Percent.
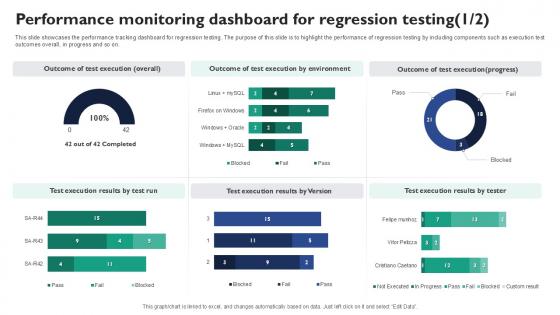
Performance Monitoring Dashboard For Corrective Regression Testing Ppt Example
This slide showcases the performance tracking dashboard for regression testing. The purpose of this slide is to highlight the performance of regression testing by including components such as execution test outcomes overall, in progress and so on. Want to ace your presentation in front of a live audience Our Performance Monitoring Dashboard For Corrective Regression Testing Ppt Example can help you do that by engaging all the users towards you. Slidegeeks experts have put their efforts and expertise into creating these impeccable powerpoint presentations so that you can communicate your ideas clearly. Moreover, all the templates are customizable, and easy-to-edit and downloadable. Use these for both personal and commercial use. This slide showcases the performance tracking dashboard for regression testing. The purpose of this slide is to highlight the performance of regression testing by including components such as execution test outcomes overall, in progress and so on.

Analysing Results Of Partner Satisfaction Survey Partner Relationship Ppt Slides
This slide analyzes the survey of respondents who were asked to rate their level of satisfaction with the company. Partnership satisfaction were assessed based on values of collaboration, accountability, respect, and excellence.Create an editable Analysing Results Of Partner Satisfaction Survey Partner Relationship Ppt Slides that communicates your idea and engages your audience. Whether you are presenting a business or an educational presentation, pre-designed presentation templates help save time. Analysing Results Of Partner Satisfaction Survey Partner Relationship Ppt Slides is highly customizable and very easy to edit, covering many different styles from creative to business presentations. Slidegeeks has creative team members who have crafted amazing templates. So, go and get them without any delay. This slide analyzes the survey of respondents who were asked to rate their level of satisfaction with the company. Partnership satisfaction were assessed based on values of collaboration, accountability, respect, and excellence.
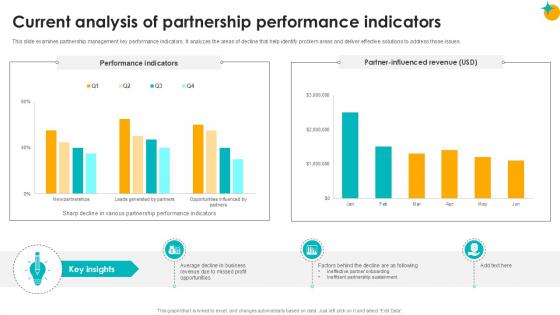
Current Analysis Of Partnership Performance Partner Relationship Ppt Template
This slide examines partnership management key performance indicators. It analyzes the areas of decline that help identify problem areas and deliver effective solutions to address those issues. Create an editable Current Analysis Of Partnership Performance Partner Relationship Ppt Template that communicates your idea and engages your audience. Whether you are presenting a business or an educational presentation, pre-designed presentation templates help save time. Current Analysis Of Partnership Performance Partner Relationship Ppt Template is highly customizable and very easy to edit, covering many different styles from creative to business presentations. Slidegeeks has creative team members who have crafted amazing templates. So, go and get them without any delay. This slide examines partnership management key performance indicators. It analyzes the areas of decline that help identify problem areas and deliver effective solutions to address those issues.
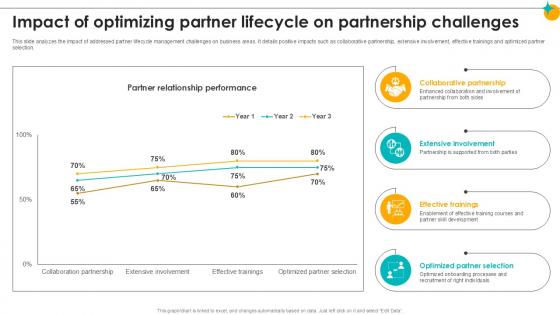
Impact Of Optimizing Partner Lifecycle On Partnership Partner Relationship Ppt Slides
This slide analyzes the impact of addressed partner lifecycle management challenges on business areas. It details positive impacts such as collaborative partnership, extensive involvement, effective trainings and optimized partner selection. Present like a pro with Impact Of Optimizing Partner Lifecycle On Partnership Partner Relationship Ppt Slides. Create beautiful presentations together with your team, using our easy-to-use presentation slides. Share your ideas in real-time and make changes on the fly by downloading our templates. So whether you are in the office, on the go, or in a remote location, you can stay in sync with your team and present your ideas with confidence. With Slidegeeks presentation got a whole lot easier. Grab these presentations today. This slide analyzes the impact of addressed partner lifecycle management challenges on business areas. It details positive impacts such as collaborative partnership, extensive involvement, effective trainings and optimized partner selection.
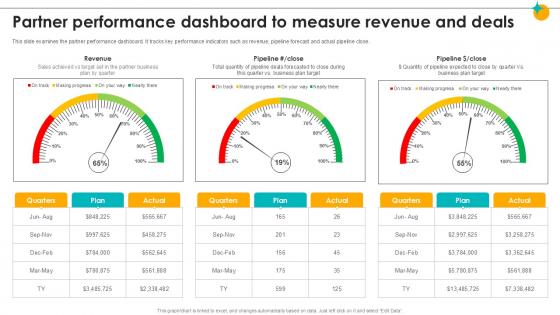
Partner Performance Dashboard To Measure Revenue Partner Relationship Ppt Template
This slide examines the partner performance dashboard. It tracks key performance indicators such as revenue, pipeline forecast and actual pipeline close. Are you in need of a template that can accommodate all of your creative concepts This one is crafted professionally and can be altered to fit any style. Use it with Google Slides or PowerPoint. Include striking photographs, symbols, depictions, and other visuals. Fill, move around, or remove text boxes as desired. Test out color palettes and font mixtures. Edit and save your work, or work with colleagues. Download Partner Performance Dashboard To Measure Revenue Partner Relationship Ppt Template and observe how to make your presentation outstanding. Give an impeccable presentation to your group and make your presentation unforgettable. This slide examines the partner performance dashboard. It tracks key performance indicators such as revenue, pipeline forecast and actual pipeline close.
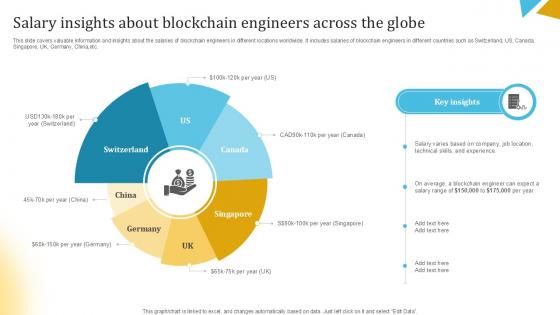
Salary Insights About Blockchain Engineers Across The Globe Ppt Presentation BCT SS V
This slide covers valuable information and insights about the salaries of blockchain engineers in different locations worldwide. It includes salaries of blockchain engineers in different countries such as Switzerland, US, Canada, Singapore, UK, Germany, China,etc. From laying roadmaps to briefing everything in detail, our templates are perfect for you. You can set the stage with your presentation slides. All you have to do is download these easy-to-edit and customizable templates. Salary Insights About Blockchain Engineers Across The Globe PPT Presentation BCT SS V will help you deliver an outstanding performance that everyone would remember and praise you for. Do download this presentation today. This slide covers valuable information and insights about the salaries of blockchain engineers in different locations worldwide. It includes salaries of blockchain engineers in different countries such as Switzerland, US, Canada, Singapore, UK, Germany, China,etc.
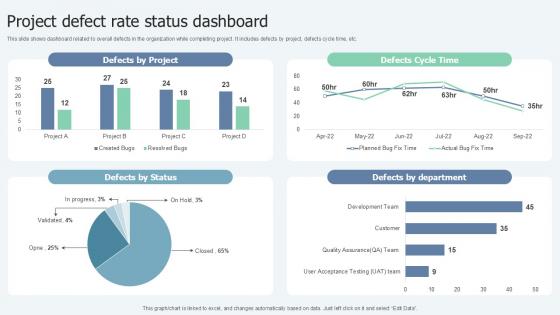
Project Defect Rate Status Dashboard Lean Six Sigma In Manufacturing Ppt Sample
This slide shows dashboard related to overall defects in the organization while completing project. It includes defects by project, defects cycle time, etc. Slidegeeks is here to make your presentations a breeze with Project Defect Rate Status Dashboard Lean Six Sigma In Manufacturing Ppt Sample With our easy-to-use and customizable templates, you can focus on delivering your ideas rather than worrying about formatting. With a variety of designs to choose from, you are sure to find one that suits your needs. And with animations and unique photos, illustrations, and fonts, you can make your presentation pop. So whether you are giving a sales pitch or presenting to the board, make sure to check out Slidegeeks first This slide shows dashboard related to overall defects in the organization while completing project. It includes defects by project, defects cycle time, etc.
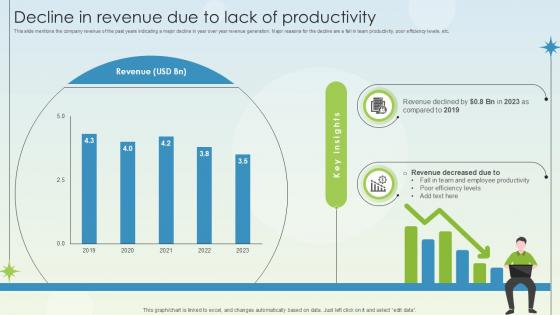
Decline In Revenue Due To Lack Of Productivity Business Growth Ppt Powerpoint
This slide mentions the company revenue of the past years indicating a major decline in year over year revenue generation. Major reasons for the decline are a fall in team productivity, poor efficiency levels, etc. Slidegeeks is here to make your presentations a breeze with Decline In Revenue Due To Lack Of Productivity Business Growth Ppt Powerpoint With our easy-to-use and customizable templates, you can focus on delivering your ideas rather than worrying about formatting. With a variety of designs to choose from, you are sure to find one that suits your needs. And with animations and unique photos, illustrations, and fonts, you can make your presentation pop. So whether you are giving a sales pitch or presenting to the board, make sure to check out Slidegeeks first This slide mentions the company revenue of the past years indicating a major decline in year over year revenue generation. Major reasons for the decline are a fall in team productivity, poor efficiency levels, etc.
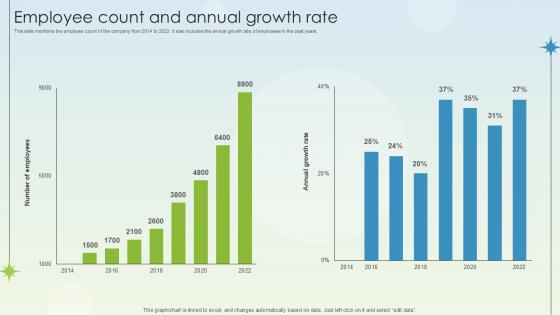
Employee Count And Annual Growth Rate Business Growth Ppt Example
This slide mentions the employee count of the company from 2014 to 2022. It also includes the annual growth rate of employees in the past years. Create an editable Employee Count And Annual Growth Rate Business Growth Ppt Example that communicates your idea and engages your audience. Whether you are presenting a business or an educational presentation, pre-designed presentation templates help save time. Employee Count And Annual Growth Rate Business Growth Ppt Example is highly customizable and very easy to edit, covering many different styles from creative to business presentations. Slidegeeks has creative team members who have crafted amazing templates. So, go and get them without any delay. This slide mentions the employee count of the company from 2014 to 2022. It also includes the annual growth rate of employees in the past years.

Expected Impact Of Team Restructuring On Business Growth Ppt Sample
This slide represents the key statistics highlighting impact of team restructuring strategy on an organization. It includes stats such as the percentage increase in productivity, decision making, accountability, etc. after tea restructuring. Do you have to make sure that everyone on your team knows about any specific topic I yes, then you should give Expected Impact Of Team Restructuring On Business Growth Ppt Sample a try. Our experts have put a lot of knowledge and effort into creating this impeccable Expected Impact Of Team Restructuring On Business Growth Ppt Sample. You can use this template for your upcoming presentations, as the slides are perfect to represent even the tiniest detail. You can download these templates from the Slidegeeks website and these are easy to edit. So grab these today This slide represents the key statistics highlighting impact of team restructuring strategy on an organization. It includes stats such as the percentage increase in productivity, decision making, accountability, etc. after tea restructuring.
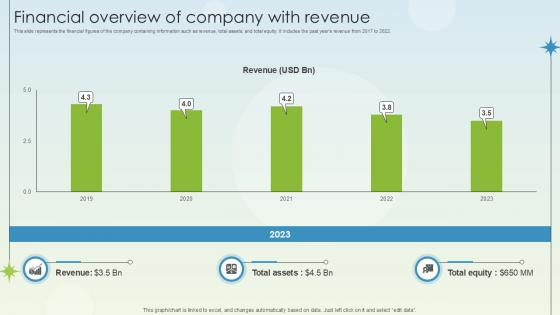
Financial Overview Of Company With Revenue Business Growth Ppt Slides
This slide represents the financial figures of the company containing information such as revenue, total assets, and total equity. It includes the past years revenue from 2017 to 2022. Get a simple yet stunning designed Financial Overview Of Company With Revenue Business Growth Ppt Slides. It is the best one to establish the tone in your meetings. It is an excellent way to make your presentations highly effective. So, download this PPT today from Slidegeeks and see the positive impacts. Our easy-to-edit Financial Overview Of Company With Revenue Business Growth Ppt Slides can be your go-to option for all upcoming conferences and meetings. So, what are you waiting for Grab this template today. This slide represents the financial figures of the company containing information such as revenue, total assets, and total equity. It includes the past years revenue from 2017 to 2022.
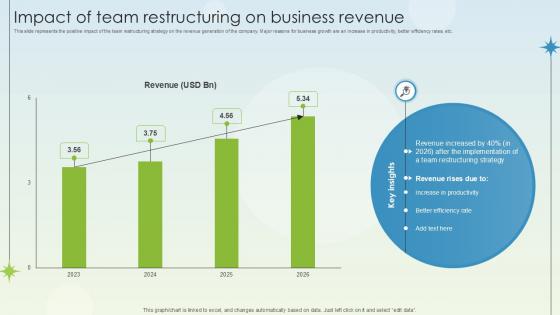
Impact Of Team Restructuring On Business Revenue Business Growth Ppt Sample
This slide represents the positive impact of the team restructuring strategy on the revenue generation of the company. Major reasons for business growth are an increase in productivity, better efficiency rates, etc. Do you have an important presentation coming up Are you looking for something that will make your presentation stand out from the rest Look no further than Impact Of Team Restructuring On Business Revenue Business Growth Ppt Sample. With our professional designs, you can trust that your presentation will pop and make delivering it a smooth process. And with Slidegeeks, you can trust that your presentation will be unique and memorable. So why wait Grab Impact Of Team Restructuring On Business Revenue Business Growth Ppt Sample today and make your presentation stand out from the rest This slide represents the positive impact of the team restructuring strategy on the revenue generation of the company. Major reasons for business growth are an increase in productivity, better efficiency rates, etc.

 Home
Home