Cost Icon
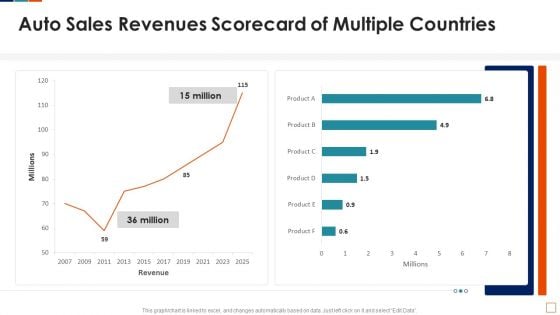
Auto Sales Revenues Scorecard Of Multiple Countries Inspiration PDF
This graph or chart is linked to excel, and changes automatically based on data. Just left click on it and select Edit Data. Deliver an awe inspiring pitch with this creative Auto Sales Revenues Scorecard Of Multiple Countries Inspiration PDF bundle. Topics like Auto Sales Revenues, Scorecard Multiple Countries can be discussed with this completely editable template. It is available for immediate download depending on the needs and requirements of the user.
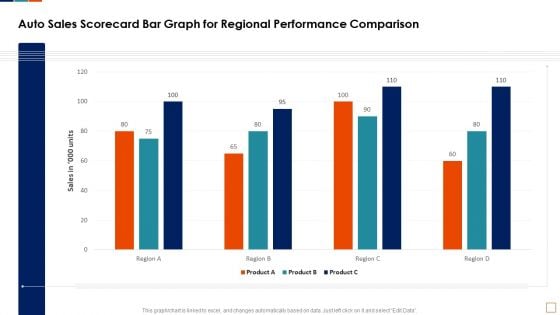
Auto Sales Scorecard Bar Graph For Regional Performance Comparison Infographics PDF
This graph or chart is linked to excel, and changes automatically based on data. Just left click on it and select Edit Data. Deliver an awe inspiring pitch with this creative Auto Sales Scorecard Bar Graph For Regional Performance Comparison Infographics PDF bundle. Topics like Auto Sales Scorecard, Bar Graph Regional, Performance Comparison Product can be discussed with this completely editable template. It is available for immediate download depending on the needs and requirements of the user.
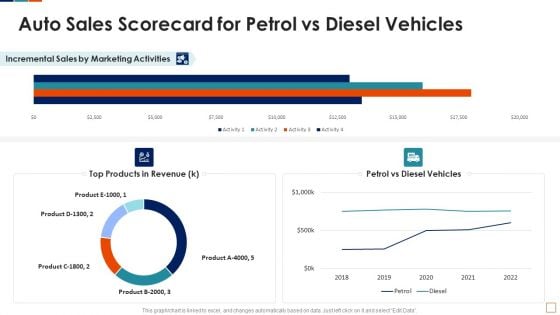
Auto Sales Scorecard For Petrol Vs Diesel Vehicles Template PDF
This graph or chart is linked to excel, and changes automatically based on data. Just left click on it and select Edit Data. Deliver an awe inspiring pitch with this creative Auto Sales Scorecard For Petrol Vs Diesel Vehicles Template PDF bundle. Topics like Top Products Revenue, Petrol Vs Diesel, Vehicles Incremental Sales, Marketing Activities Product can be discussed with this completely editable template. It is available for immediate download depending on the needs and requirements of the user.
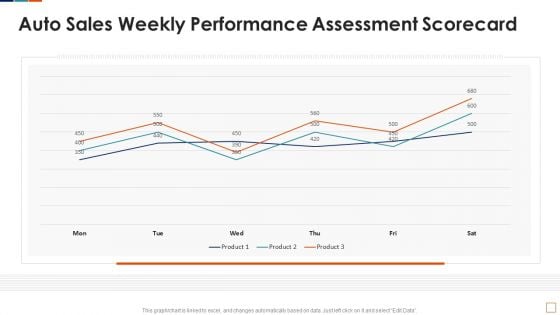
Auto Sales Weekly Performance Assessment Scorecard Background PDF
This graph or chart is linked to excel, and changes automatically based on data. Just left click on it and select Edit Data. Deliver and pitch your topic in the best possible manner with this Auto Sales Weekly Performance Assessment Scorecard Background PDF. Use them to share invaluable insights on Auto Sales Weekly, Performance Assessment Scorecard and impress your audience. This template can be altered and modified as per your expectations. So, grab it now.
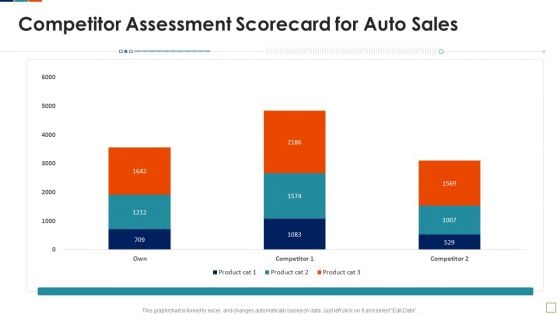
Automobile Sales Scorecard Competitor Assessment Scorecard For Auto Sales Demonstration PDF
This graph or chart is linked to excel, and changes automatically based on data. Just left click on it and select Edit Data. Deliver an awe inspiring pitch with this creative Automobile Sales Scorecard Competitor Assessment Scorecard For Auto Sales Demonstration PDF bundle. Topics like Competitor Assessment Scorecard, Auto Sales Product can be discussed with this completely editable template. It is available for immediate download depending on the needs and requirements of the user.
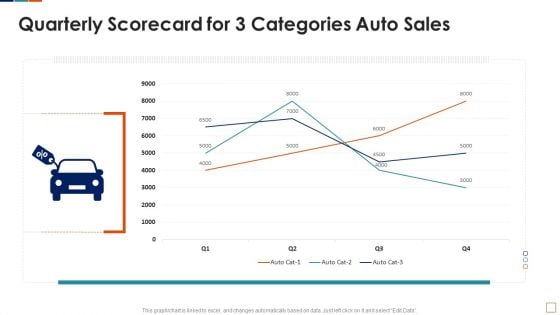
Automobile Sales Scorecard Quarterly Scorecard For 3 Categories Auto Sales Microsoft PDF
This graph or chart is linked to excel, and changes automatically based on data. Just left click on it and select Edit Data. Deliver an awe inspiring pitch with this creative Automobile Sales Scorecard Quarterly Scorecard For 3 Categories Auto Sales Microsoft PDF bundle. Topics like Quarterly Scorecard Three, Categories Auto Sales can be discussed with this completely editable template. It is available for immediate download depending on the needs and requirements of the user.
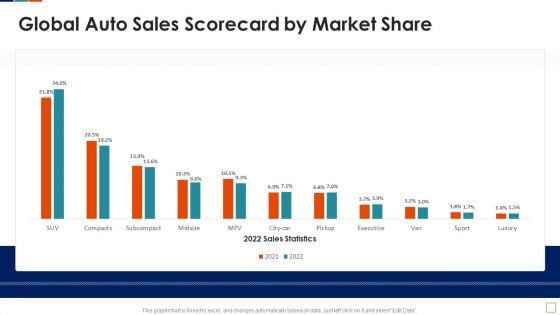
Global Auto Sales Scorecard By Market Share Ideas PDF
This graph or chart is linked to excel, and changes automatically based on data. Just left click on it and select Edit Data. Deliver an awe inspiring pitch with this creative Global Auto Sales Scorecard By Market Share Ideas PDF bundle. Topics like 2022 Sales Statistics, Global Auto Sales, Scorecard Market Share can be discussed with this completely editable template. It is available for immediate download depending on the needs and requirements of the user.
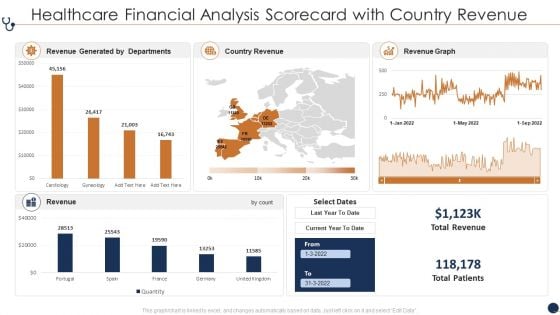
Healthcare Financial Analysis Scorecard With Country Revenue Ppt Layouts PDF
This graph or chart is linked to excel, and changes automatically based on data. Just left click on it and select Edit Data. Deliver an awe inspiring pitch with this creative Healthcare Financial Analysis Scorecard With Country Revenue Ppt Layouts PDF bundle. Topics like Revenue Generated Departments, Country Revenue Current can be discussed with this completely editable template. It is available for immediate download depending on the needs and requirements of the user.
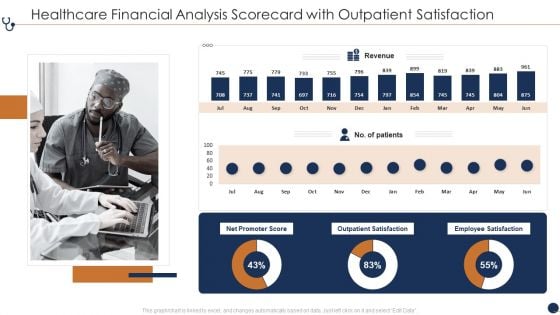
Healthcare Financial Analysis Scorecard With Outpatient Satisfaction Ppt Professional Background Image PDF
This graph or chart is linked to excel, and changes automatically based on data. Just left click on it and select Edit Data. Deliver and pitch your topic in the best possible manner with this Healthcare Financial Analysis Scorecard With Outpatient Satisfaction Ppt Professional Background Image PDF. Use them to share invaluable insights on Net Promoter Score, Outpatient Satisfaction Employee, Revenue Satisfaction Patients and impress your audience. This template can be altered and modified as per your expectations. So, grab it now.
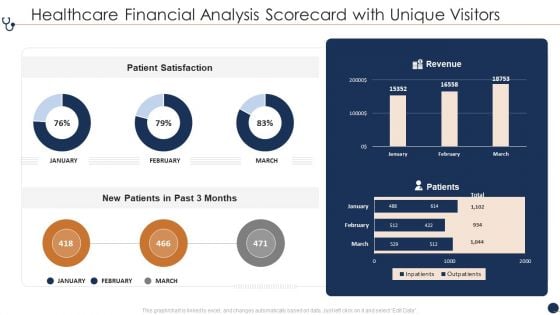
Healthcare Financial Analysis Scorecard With Unique Visitors Ppt File Visuals PDF
This graph or chart is linked to excel, and changes automatically based on data. Just left click on it and select Edit Data. Deliver an awe inspiring pitch with this creative Healthcare Financial Analysis Scorecard With Unique Visitors Ppt File Visuals PDF bundle. Topics like Patient Satisfaction Revenue, New Patients Past can be discussed with this completely editable template. It is available for immediate download depending on the needs and requirements of the user.
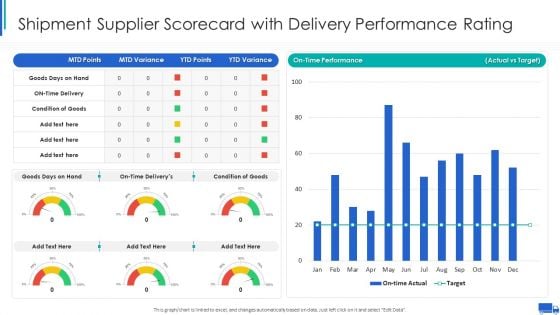
Shipment Supplier Scorecard With Delivery Performance Rating Ppt Ideas Graphic Tips PDF
This graph or chart is linked to excel, and changes automatically based on data. Just left click on it and select Edit Data. Deliver an awe inspiring pitch with this creative Shipment Supplier Scorecard With Delivery Performance Rating Ppt Ideas Graphic Tips PDF bundle. Topics like On Time Performance, Actual Vs Target, Goods Days Hand can be discussed with this completely editable template. It is available for immediate download depending on the needs and requirements of the user.
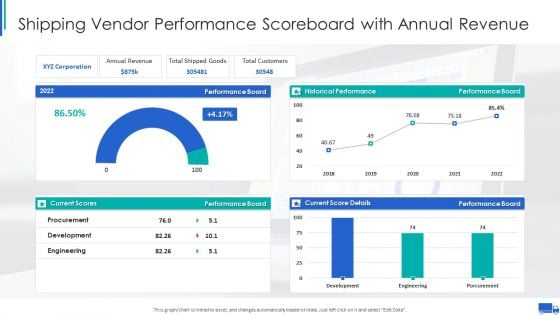
Shipping Vendor Performance Scoreboard With Annual Revenue Ppt Infographics Graphics PDF
This graph or chart is linked to excel, and changes automatically based on data. Just left click on it and select Edit Data. Deliver an awe inspiring pitch with this creative Shipping Vendor Performance Scoreboard With Annual Revenue Ppt Infographics Graphics PDF bundle. Topics like Annual Revenue Board, Total Shipped Goods, Total Customers Performance can be discussed with this completely editable template. It is available for immediate download depending on the needs and requirements of the user.
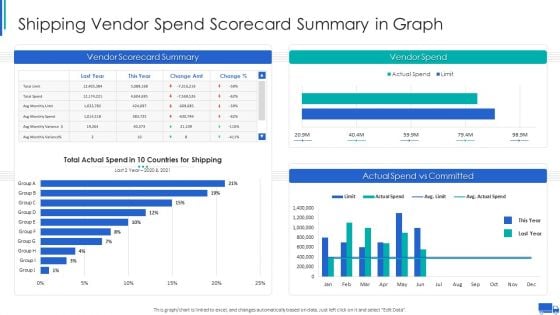
Shipping Vendor Spend Scorecard Summary In Graph Ppt Pictures Introduction PDF
This graph or chart is linked to excel, and changes automatically based on data. Just left click on it and select Edit Data. Deliver and pitch your topic in the best possible manner with this Shipping Vendor Spend Scorecard Summary In Graph Ppt Pictures Introduction PDF. Use them to share invaluable insights on Vendor Scorecard Summary, Vendor Spend Shipping, Actual Spend Vs and impress your audience. This template can be altered and modified as per your expectations. So, grab it now.
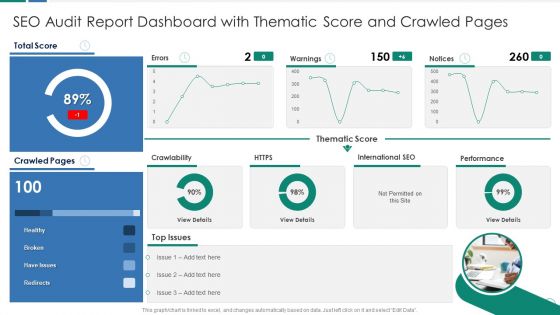
SEO Audit Report Dashboard With Thematic Score And Crawled Pages Download PDF
This graph or chart is linked to excel, and changes automatically based on data. Just left click on it and select Edit Data. Deliver and pitch your topic in the best possible manner with this SEO Audit Report Dashboard With Thematic Score And Crawled Pages Download PDF. Use them to share invaluable insights on Thematic Score Warnings, International SEO Performance, Total Score Healthy and impress your audience. This template can be altered and modified as per your expectations. So, grab it now.
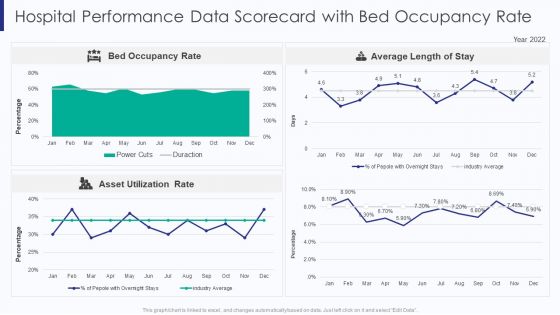
Healthcare Hospital Performance Data Scorecard With Bed Occupancy Rate Ppt Professional Graphics Tutorials PDF
This graphor chart is linked to excel, and changes automatically based on data. Just left click on it and select Edit Data. Deliver an awe inspiring pitch with this creative Healthcare Hospital Performance Data Scorecard With Bed Occupancy Rate Ppt Professional Graphics Tutorials PDF bundle. Topics like Bed Occupancy Rate, Average Length Stay, Asset Utilization Rate can be discussed with this completely editable template. It is available for immediate download depending on the needs and requirements of the user.
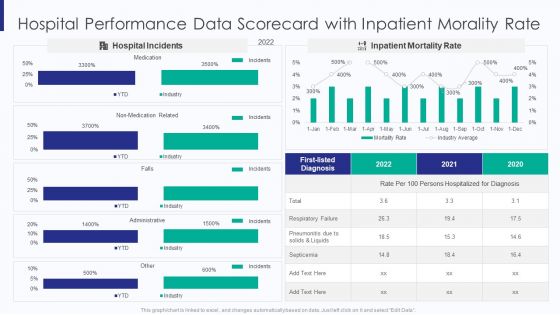
Healthcare Hospital Performance Data Scorecard With Inpatient Morality Rate Ppt Gallery Designs Download PDF
This graphor chart is linked to excel, and changes automatically based on data. Just left click on it and select Edit Data. Deliver an awe inspiring pitch with this creative Healthcare Hospital Performance Data Scorecard With Inpatient Morality Rate Ppt Gallery Designs Download PDF bundle. Topics like Hospital Incidents 2022, Inpatient Mortality Rate can be discussed with this completely editable template. It is available for immediate download depending on the needs and requirements of the user.
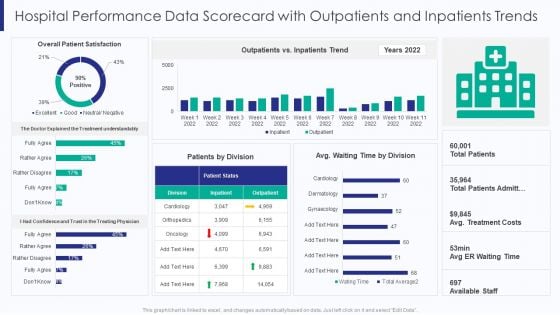
Healthcare Hospital Performance Data Scorecard With Outpatients And Inpatients Trends Ppt Summary Good PDF
This graphor chart is linked to excel, and changes automatically based on data. Just left click on it and select Edit Data. Deliver and pitch your topic in the best possible manner with this Healthcare Hospital Performance Data Scorecard With Outpatients And Inpatients Trends Ppt Summary Good PDF. Use them to share invaluable insights on Overall Patient Satisfaction, Outpatients Vs Inpatients, Trend Years 2022 and impress your audience. This template can be altered and modified as per your expectations. So, grab it now.

Healthcare Hospital Performance Data Scorecard With Overall Patient Satisfaction Ppt File Deck PDF
This graphor chart is linked to excel, and changes automatically based on data. Just left click on it and select Edit Data. Deliver an awe inspiring pitch with this creative Healthcare Hospital Performance Data Scorecard With Overall Patient Satisfaction Ppt File Deck PDF bundle. Topics like Overall Patient Satisfaction, Doctors Treatment Plan, Available Staff Per can be discussed with this completely editable template. It is available for immediate download depending on the needs and requirements of the user.
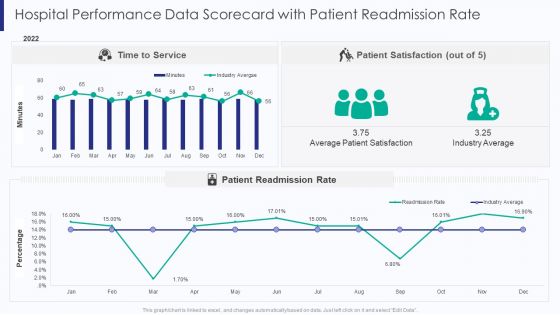
Healthcare Hospital Performance Data Scorecard With Patient Readmission Rate Ppt Model Objects PDF
This graphor chart is linked to excel, and changes automatically based on data. Just left click on it and select Edit Data. Deliver and pitch your topic in the best possible manner with this Healthcare Hospital Performance Data Scorecard With Patient Readmission Rate Ppt Model Objects PDF. Use them to share invaluable insights on Time To Service, Average Patient Satisfaction, Patient Readmission Rate and impress your audience. This template can be altered and modified as per your expectations. So, grab it now.
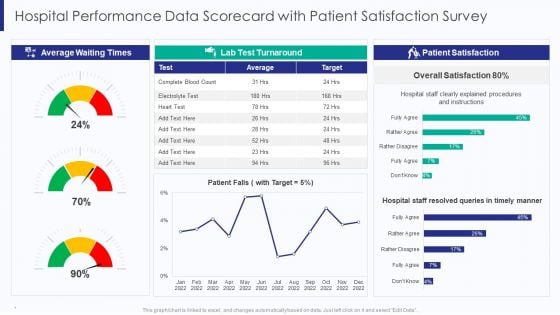
Healthcare Hospital Performance Data Scorecard With Patient Satisfaction Survey Ppt Design Ideas PDF
This graphor chart is linked to excel, and changes automatically based on data. Just left click on it and select Edit Data. Deliver an awe inspiring pitch with this creative Healthcare Hospital Performance Data Scorecard With Patient Satisfaction Survey Ppt Design Ideas PDF bundle. Topics like Average Waiting Times, Lab Test Turnaround, Patient Satisfaction Manner can be discussed with this completely editable template. It is available for immediate download depending on the needs and requirements of the user.
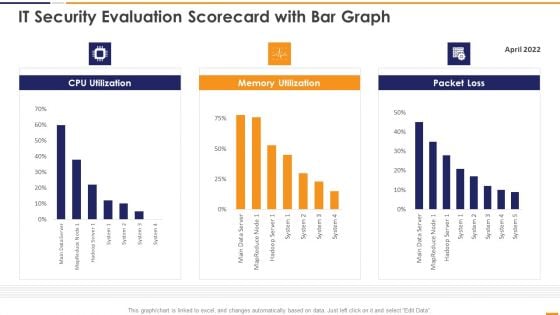
IT Security Evaluation Scorecard With Bar Graph Ppt Gallery Design Templates PDF
This graph or chart is linked to excel, and changes automatically based on data. Just left click on it and select Edit Data. Deliver and pitch your topic in the best possible manner with this IT Security Evaluation Scorecard With Bar Graph Ppt Gallery Design Templates PDF. Use them to share invaluable insights on CPU Utilization Memory, Utilization Packet Loss and impress your audience. This template can be altered and modified as per your expectations. So, grab it now.
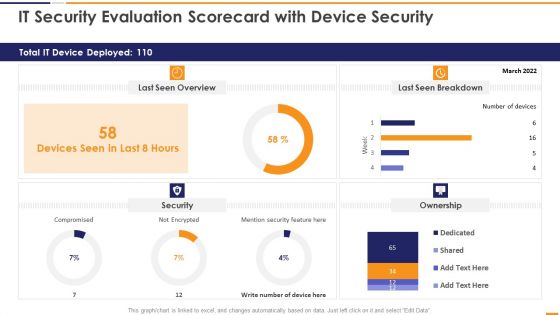
IT Security Evaluation Scorecard With Device Security Ppt Slides Good PDF
This graph or chart is linked to excel, and changes automatically based on data. Just left click on it and select Edit Data. Deliver an awe inspiring pitch with this creative IT Security Evaluation Scorecard With Device Security Ppt Slides Good PDF bundle. Topics like Total IT Device, Last Seen Overview, Last Seen Breakdown, Mention Security Feature can be discussed with this completely editable template. It is available for immediate download depending on the needs and requirements of the user.
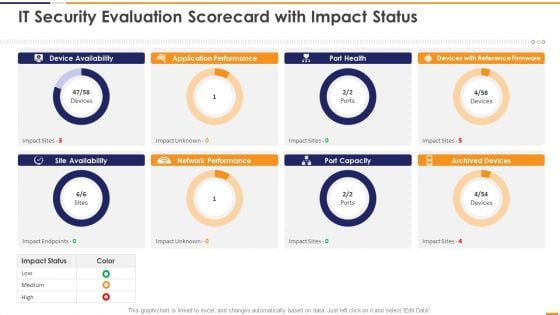
IT Security Evaluation Scorecard With Impact Status Ppt Portfolio Guidelines PDF
This graph or chart is linked to excel, and changes automatically based on data. Just left click on it and select Edit Data. Deliver and pitch your topic in the best possible manner with this IT Security Evaluation Scorecard With Impact Status Ppt Portfolio Guidelines PDF. Use them to share invaluable insights on Device Availability Application, Performance Port Health, Devices Reference Firmware and impress your audience. This template can be altered and modified as per your expectations. So, grab it now.
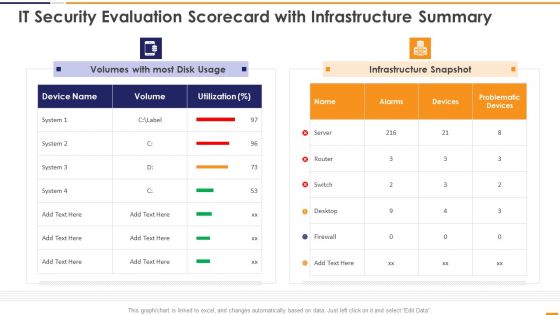
IT Security Evaluation Scorecard With Infrastructure Summary Ppt Slides Portrait PDF
This graph or chart is linked to excel, and changes automatically based on data. Just left click on it and select Edit Data. Deliver an awe inspiring pitch with this creative IT Security Evaluation Scorecard With Infrastructure Summary Ppt Slides Portrait PDF bundle. Topics like Volumes Most Disk, Usage Infrastructure Snapshot can be discussed with this completely editable template. It is available for immediate download depending on the needs and requirements of the user.
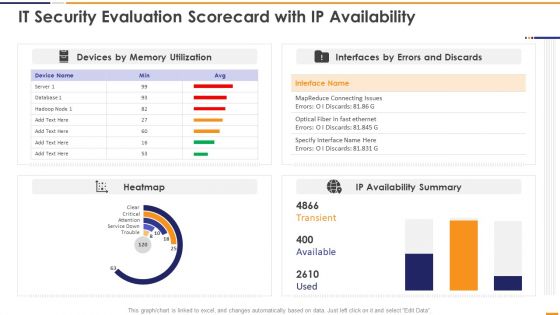
IT Security Evaluation Scorecard With Ip Availability Ppt Pictures Portrait PDF
This graph or chart is linked to excel, and changes automatically based on data. Just left click on it and select Edit Data. Deliver and pitch your topic in the best possible manner with this IT Security Evaluation Scorecard With Ip Availability Ppt Pictures Portrait PDF. Use them to share invaluable insights on Devices Memory Utilization, Interfaces Errors Discards, IP Availability Summary and impress your audience. This template can be altered and modified as per your expectations. So, grab it now.
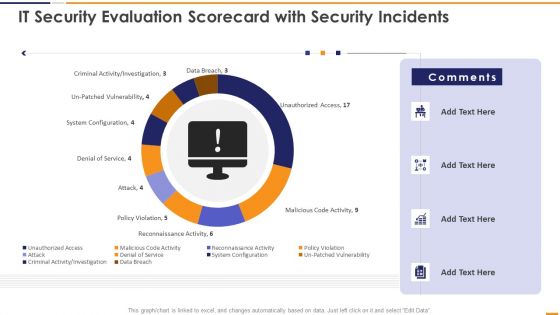
IT Security Evaluation Scorecard With Security Incidents Ppt Pictures Vector PDF
This graph or chart is linked to excel, and changes automatically based on data. Just left click on it and select Edit Data. Deliver and pitch your topic in the best possible manner with this IT Security Evaluation Scorecard With Security Incidents Ppt Pictures Vector PDF. Use them to share invaluable insights on Unauthorized Access Sales, Malicious Code Activity, Reconnaissance Activity Attack and impress your audience. This template can be altered and modified as per your expectations. So, grab it now.
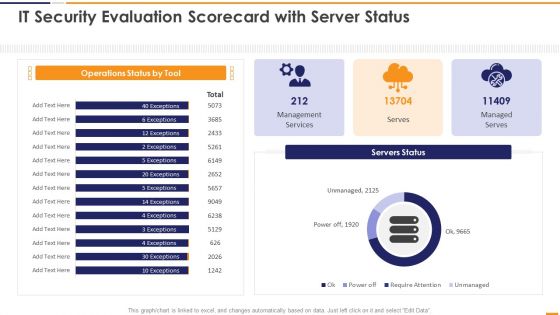
IT Security Evaluation Scorecard With Server Status Ppt Professional Images PDF
This graph or chart is linked to excel, and changes automatically based on data. Just left click on it and select Edit Data. Deliver an awe inspiring pitch with this creative IT Security Evaluation Scorecard With Server Status Ppt Professional Images PDF bundle. Topics like Operations Status Tool, Management Services Managed can be discussed with this completely editable template. It is available for immediate download depending on the needs and requirements of the user.
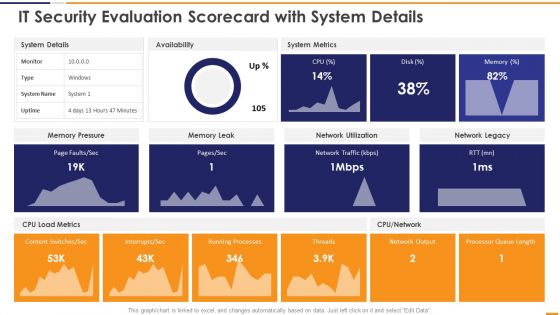
IT Security Evaluation Scorecard With System Details Ppt Inspiration Vector PDF
This graph or chart is linked to excel, and changes automatically based on data. Just left click on it and select Edit Data. Deliver and pitch your topic in the best possible manner with this IT Security Evaluation Scorecard With System Details Ppt Inspiration Vector PDF. Use them to share invaluable insights on System Details Availability, System Metrics Memory, Pressure Memory Leak and impress your audience. This template can be altered and modified as per your expectations. So, grab it now.
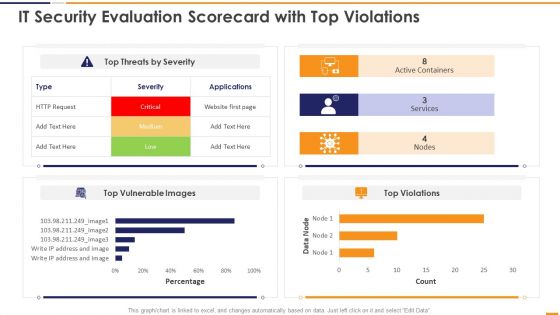
IT Security Evaluation Scorecard With Top Violations Ppt Portfolio Deck PDF
This graph or chart is linked to excel, and changes automatically based on data. Just left click on it and select Edit Data. Deliver an awe inspiring pitch with this creative IT Security Evaluation Scorecard With Top Violations Ppt Portfolio Deck PDF bundle. Topics like Top Threats Severity, Active Containers Services, Top Vulnerable Images can be discussed with this completely editable template. It is available for immediate download depending on the needs and requirements of the user.
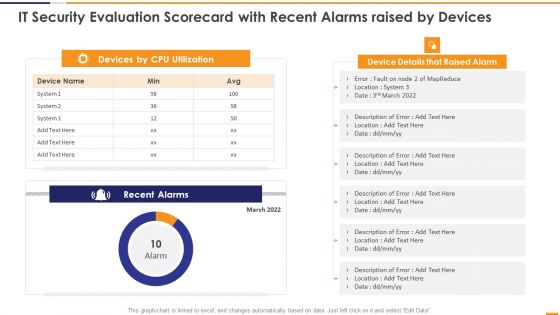
IT Security Evaluation Scorecard With Recent Alarms Raised By Devices Guidelines PDF
This graph or chart is linked to excel, and changes automatically based on data. Just left click on it and select Edit Data. Deliver an awe inspiring pitch with this creative IT Security Evaluation Scorecard With Recent Alarms Raised By Devices Guidelines PDF bundle. Topics like Devices CPU Utilization, Device Details Raised can be discussed with this completely editable template. It is available for immediate download depending on the needs and requirements of the user.

IT Security Evaluation Scorecard With Response Time And Availability Brochure PDF
This graph or chart is linked to excel, and changes automatically based on data. Just left click on it and select Edit Data. Deliver and pitch your topic in the best possible manner with this IT Security Evaluation Scorecard With Response Time And Availability Brochure PDF. Use them to share invaluable insights on Response Time 2022, Disk Utilization Availability and impress your audience. This template can be altered and modified as per your expectations. So, grab it now.
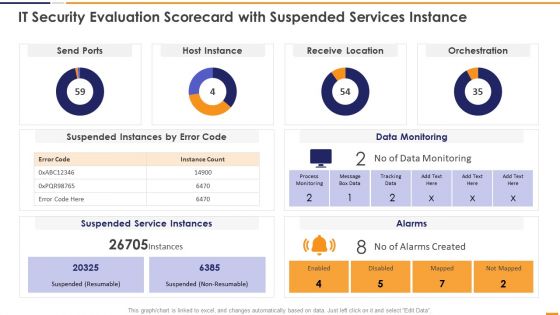
IT Security Evaluation Scorecard With Suspended Services Instance Graphics PDF
This graph or chart is linked to excel, and changes automatically based on data. Just left click on it and select Edit Data. Deliver and pitch your topic in the best possible manner with this IT Security Evaluation Scorecard With Suspended Services Instance Graphics PDF. Use them to share invaluable insights on Send Ports Alarms, Host Instance Orchestration, Receive Location Data and impress your audience. This template can be altered and modified as per your expectations. So, grab it now.
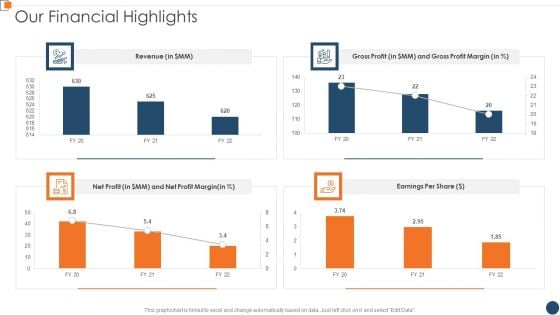
BANT Sales Lead Qualification Model Our Financial Highlights Background PDF
This graph or chart is linked to excel and change automatically based on data. Just left click on it and select Edit Data. Deliver an awe inspiring pitch with this creative BANT Sales Lead Qualification Model Our Financial Highlights Background PDF bundle. Topics like Gross Profit, Net Profit, Earnings Per can be discussed with this completely editable template. It is available for immediate download depending on the needs and requirements of the user.
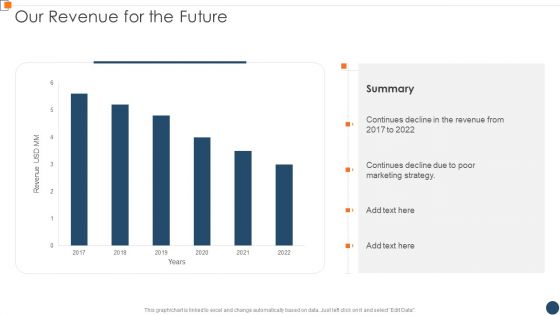
BANT Sales Lead Qualification Model Our Revenue For The Future Mockup PDF
This graph or chart is linked to excel and change automatically based on data. Just left click on it and select Edit Data. Deliver an awe inspiring pitch with this creative BANT Sales Lead Qualification Model Our Revenue For The Future Mockup PDF bundle. Topics like Continues Decline, Marketing Strategy, 2017 To 2022 can be discussed with this completely editable template. It is available for immediate download depending on the needs and requirements of the user.
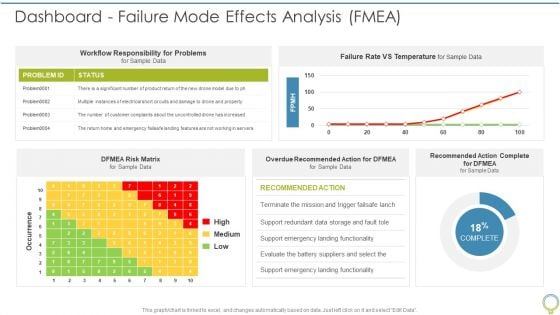
FMEA To Determine Potential Dashboard Failure Mode Effects Analysis FMEA Brochure PDF
This graph or chart is linked to excel, and changes automatically based on data. Just left click on it and select Edit Data. Deliver an awe inspiring pitch with this creative FMEA To Determine Potential Dashboard Failure Mode Effects Analysis FMEA Brochure PDF bundle. Topics like Workflow Responsibility, High Medium, Recommended Action can be discussed with this completely editable template. It is available for immediate download depending on the needs and requirements of the user.
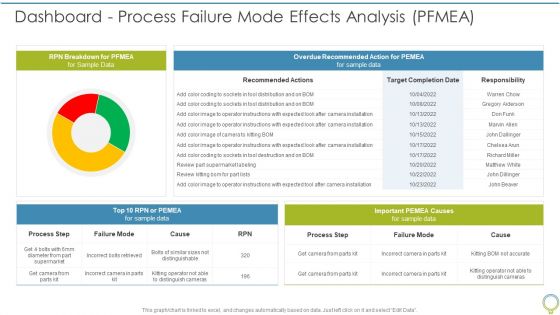
FMEA To Determine Potential Dashboard Process Failure Mode Effects Analysis PFMEA Elements PDF
This graph or chart is linked to excel, and changes automatically based on data. Just left click on it and select Edit Data. Deliver and pitch your topic in the best possible manner with this FMEA To Determine Potential Dashboard Process Failure Mode Effects Analysis PFMEA Elements PDF. Use them to share invaluable insights on RPN Breakdown, Overdue Recommended, Process Step and impress your audience. This template can be altered and modified as per your expectations. So, grab it now.
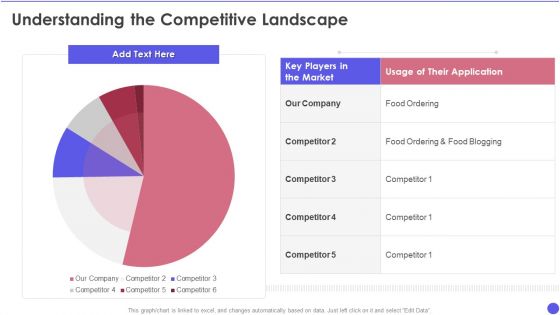
Openfin Capital Raising Understanding The Competitive Landscape Ppt Portfolio Layouts PDF
This graph or chart is linked to excel, and changes automatically based on data. Just left click on it and select Edit Data. Deliver and pitch your topic in the best possible manner with this Openfin Capital Raising Understanding The Competitive Landscape Ppt Portfolio Layouts PDF. Use them to share invaluable insights on Usage Application, Food Ordering, Food Blogging and impress your audience. This template can be altered and modified as per your expectations. So, grab it now.
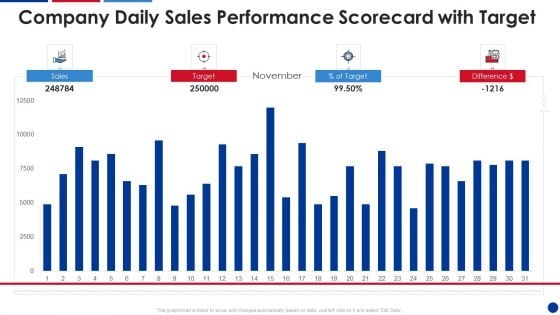
Company Daily Sales Performance Scorecard With Target Download PDF
This graph or chart is linked to excel, and changes automatically based on data. Just left click on it and select Edit Data. Deliver an awe inspiring pitch with this creative Company Daily Sales Performance Scorecard With Target Download PDF bundle. Topics like Sales Target can be discussed with this completely editable template. It is available for immediate download depending on the needs and requirements of the user.
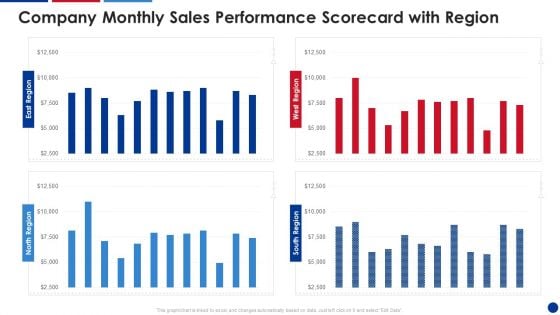
Company Monthly Sales Performance Scorecard With Region Sample PDF
This graph or chart is linked to excel, and changes automatically based on data. Just left click on it and select Edit Data. Deliver and pitch your topic in the best possible manner with this Company Monthly Sales Performance Scorecard With Region Sample PDF. Use them to share invaluable insights on Company Monthly, Sales Performance, Scorecard Region and impress your audience. This template can be altered and modified as per your expectations. So, grab it now.
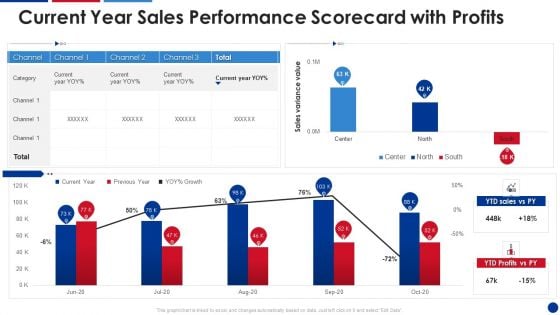
Current Year Sales Performance Scorecard With Profits Structure PDF
This graph or chart is linked to excel, and changes automatically based on data. Just left click on it and select Edit Data. Deliver and pitch your topic in the best possible manner with this Current Year Sales Performance Scorecard With Profits Structure PDF. Use them to share invaluable insights on Current Year, YTD Sales, Previous Year and impress your audience. This template can be altered and modified as per your expectations. So, grab it now.
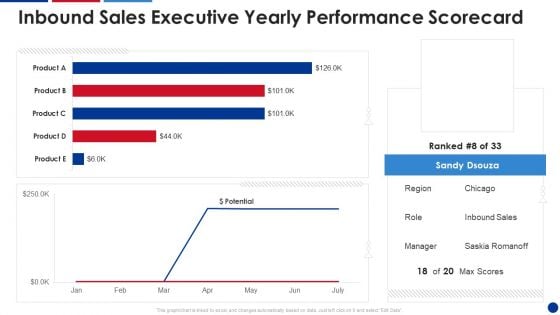
Inbound Sales Executive Yearly Performance Scorecard Information PDF
This graph or chart is linked to excel, and changes automatically based on data. Just left click on it and select Edit Data. Deliver and pitch your topic in the best possible manner with this Inbound Sales Executive Yearly Performance Scorecard Information PDF. Use them to share invaluable insights on Inbound Sales, Executive Yearly, Performance Scorecard and impress your audience. This template can be altered and modified as per your expectations. So, grab it now.
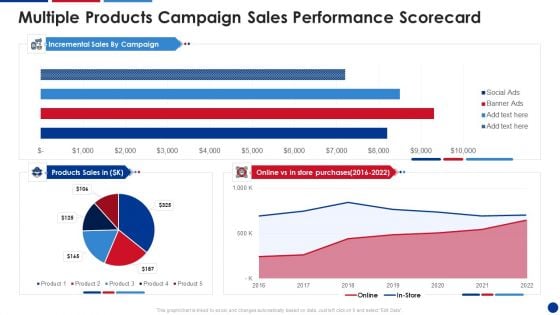
Multiple Products Campaign Sales Performance Scorecard Download PDF
This graph or chart is linked to excel, and changes automatically based on data. Just left click on it and select Edit Data. Deliver an awe inspiring pitch with this creative Multiple Products Campaign Sales Performance Scorecard Download PDF bundle. Topics like Incremental Sales, Products Sales, Store Purchases can be discussed with this completely editable template. It is available for immediate download depending on the needs and requirements of the user.
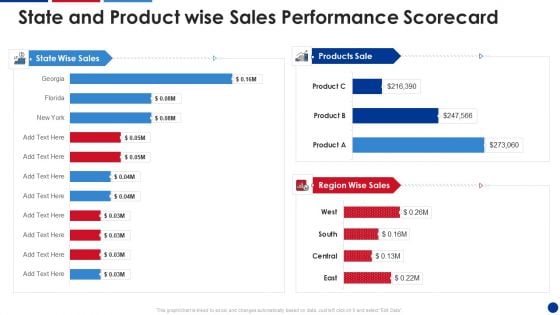
State And Product Wise Sales Performance Scorecard Summary PDF
This graph or chart is linked to excel, and changes automatically based on data. Just left click on it and select Edit Data. Deliver an awe inspiring pitch with this creative State And Product Wise Sales Performance Scorecard Summary PDF bundle. Topics like State Wise Sales, Products Sale, Region Wise Sales can be discussed with this completely editable template. It is available for immediate download depending on the needs and requirements of the user.
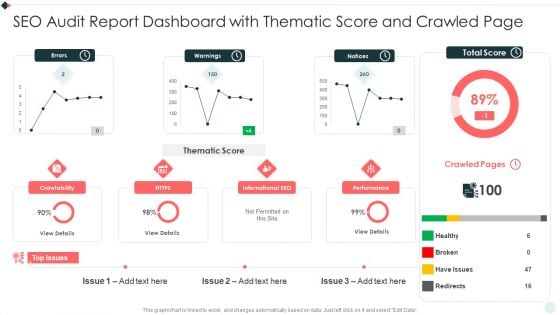
SEO Audit Summary To Increase SEO Audit Report Dashboard With Thematic Score Download PDF
This graph or chart is linked to excel, and changes automatically based on data. Just left click on it and select Edit Data. Deliver an awe inspiring pitch with this creative SEO Audit Summary To Increase SEO Audit Report Dashboard With Thematic Score Download PDF bundle. Topics like Total Score, Crawled Pages, Top Issues can be discussed with this completely editable template. It is available for immediate download depending on the needs and requirements of the user.
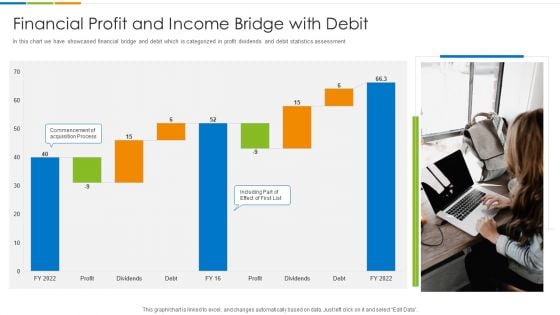
Financial Profit And Income Bridge With Debit Ppt PowerPoint Presentation File Outline PDF
In this chart we have showcased financial bridge and debit which is categorized in profit dividends and debit statistics assessment. Pitch your topic with ease and precision using this Financial Profit And Income Bridge With Debit Ppt PowerPoint Presentation File Outline PDF. This layout presents information on Profit Dividends, Debt Commencement, Acquisition Process. It is also available for immediate download and adjustment. So, changes can be made in the color, design, graphics or any other component to create a unique layout.
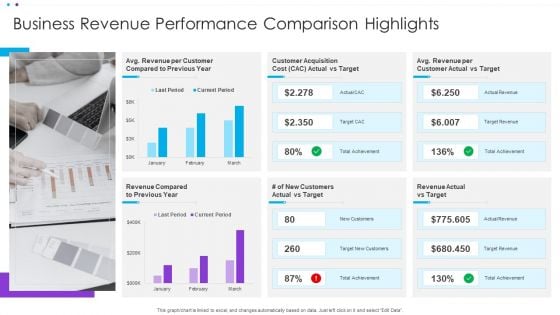
Business Revenue Performance Comparison Highlights Ppt Summary Rules PDF
This graph or chart is linked to excel, and changes automatically based on data. Just left click on it and select Edit Data. Showcasing this set of slides titled Business Revenue Performance Comparison Highlights Ppt Summary Rules PDF. The topics addressed in these templates are Customer Acquisition, Customer Actual, Revenue Compared. All the content presented in this PPT design is completely editable. Download it and make adjustments in color, background, font etc. as per your unique business setting.
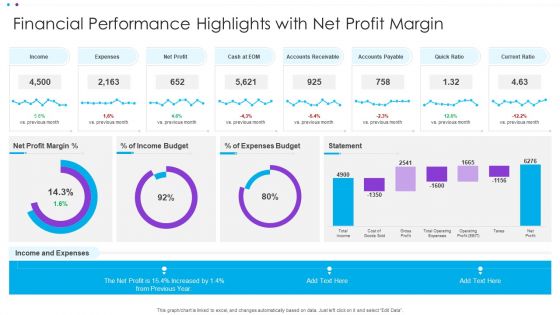
Financial Performance Highlights With Net Profit Margin Ppt Model Ideas PDF
This graph or chart is linked to excel, and changes automatically based on data. Just left click on it and select Edit Data. Pitch your topic with ease and precision using this Financial Performance Highlights With Net Profit Margin Ppt Model Ideas PDF. This layout presents information on Net Profit, Accounts Receivable, Accounts Payable. It is also available for immediate download and adjustment. So, changes can be made in the color, design, graphics or any other component to create a unique layout.
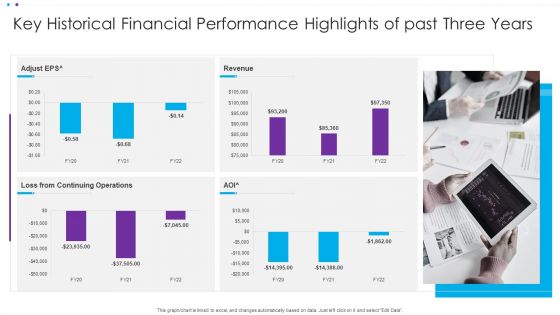
Key Historical Financial Performance Highlights Of Past Three Years Ppt Ideas Background PDF
This graph or chart is linked to excel, and changes automatically based on data. Just left click on it and select Edit Data. Showcasing this set of slides titled Key Historical Financial Performance Highlights Of Past Three Years Ppt Ideas Background PDF. The topics addressed in these templates are Continuing Operations, Adjust EP. All the content presented in this PPT design is completely editable. Download it and make adjustments in color, background, font etc. as per your unique business setting.
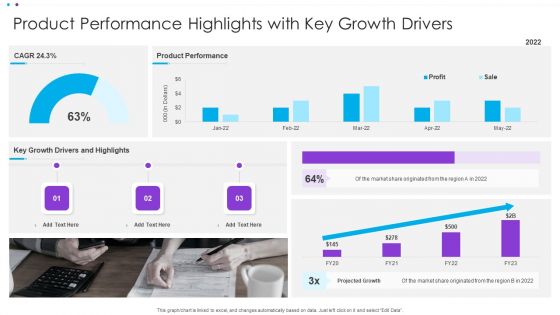
Product Performance Highlights With Key Growth Drivers Ppt Pictures Design Templates PDF
This graph or chart is linked to excel, and changes automatically based on data. Just left click on it and select Edit Data. Pitch your topic with ease and precision using this Product Performance Highlights With Key Growth Drivers Ppt Pictures Design Templates PDF. This layout presents information on Product Performance, Key Growth, Projected Growth. It is also available for immediate download and adjustment. So, changes can be made in the color, design, graphics or any other component to create a unique layout.
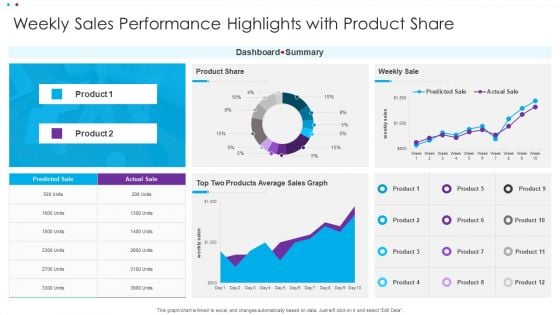
Weekly Sales Performance Highlights With Product Share Ppt File Information PDF
This graph or chart is linked to excel, and changes automatically based on data. Just left click on it and select Edit Data. Pitch your topic with ease and precision using this Weekly Sales Performance Highlights With Product Share Ppt File Information PDF. This layout presents information on Dashboard Summary, Weekly Sale, Product Share. It is also available for immediate download and adjustment. So, changes can be made in the color, design, graphics or any other component to create a unique layout.
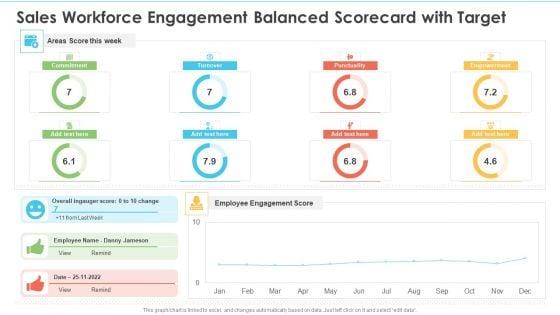
Sales Workforce Engagement Balanced Scorecard With Target Ppt Professional Designs Download PDF
This graph or chart is linked to excel, and changes automatically based on data. Just left click on it and select edit data. Deliver an awe inspiring pitch with this creative Sales Workforce Engagement Balanced Scorecard With Target Ppt Professional Designs Download PDF bundle. Topics like Areas Score Week, Employee Engagement Score, Overall Ingauger Score can be discussed with this completely editable template. It is available for immediate download depending on the needs and requirements of the user.
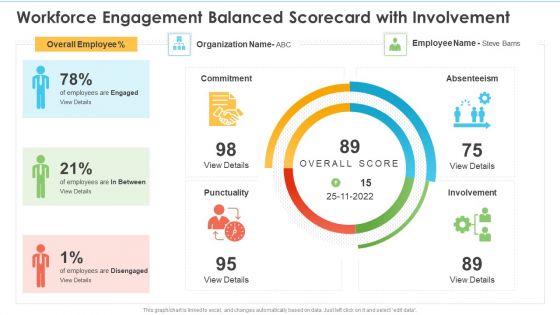
Workforce Engagement Balanced Scorecard With Involvement Ppt Portfolio Background Images PDF
This graph or chart is linked to excel, and changes automatically based on data. Just left click on it and select edit data. Deliver and pitch your topic in the best possible manner with this Workforce Engagement Balanced Scorecard With Involvement Ppt Portfolio Background Images PDF. Use them to share invaluable insights on Employee, Organization, Overall Employee and impress your audience. This template can be altered and modified as per your expectations. So, grab it now.
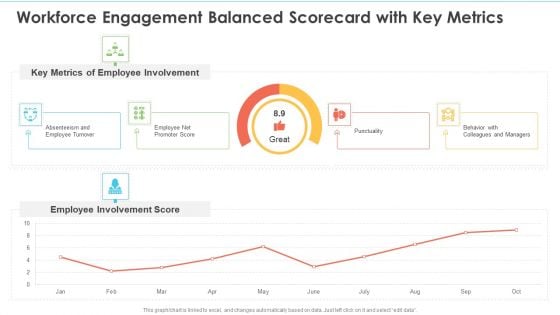
Workforce Engagement Balanced Scorecard With Key Metrics Ppt Inspiration Deck PDF
This graph or chart is linked to excel, and changes automatically based on data. Just left click on it and select edit data. Deliver an awe inspiring pitch with this creative Workforce Engagement Balanced Scorecard With Key Metrics Ppt Inspiration Deck PDF bundle. Topics like Key Metrics, Employee Involvement, Employee Involvement Score can be discussed with this completely editable template. It is available for immediate download depending on the needs and requirements of the user.
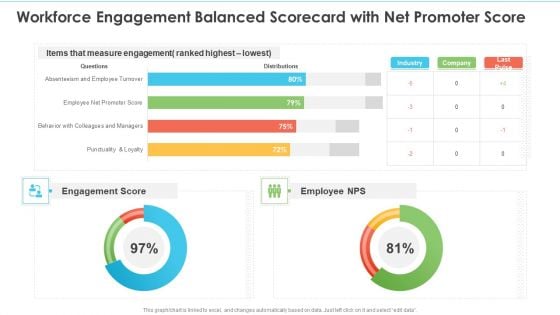
Workforce Engagement Balanced Scorecard With Net Promoter Score Ppt Slides Display PDF
This graph or chart is linked to excel, and changes automatically based on data. Just left click on it and select edit data. Deliver an awe inspiring pitch with this creative Workforce Engagement Balanced Scorecard With Net Promoter Score Ppt Slides Display PDF bundle. Topics like Measure Engagement, Engagement Score, Employee NPS can be discussed with this completely editable template. It is available for immediate download depending on the needs and requirements of the user.
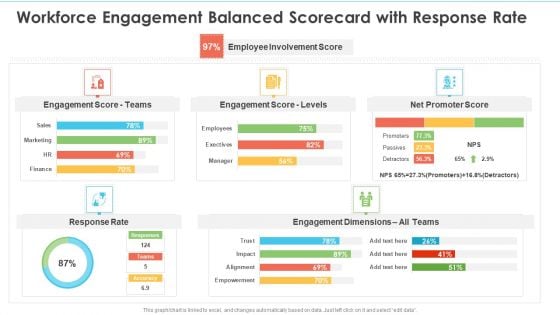
Workforce Engagement Balanced Scorecard With Response Rate Ppt Deck PDF
This graph or chart is linked to excel, and changes automatically based on data. Just left click on it and select edit data. Deliver an awe inspiring pitch with this creative Workforce Engagement Balanced Scorecard With Response Rate Ppt Deck PDF bundle. Topics like Engagement Score Teams, Engagement Score Levels, Net Promoter Score can be discussed with this completely editable template. It is available for immediate download depending on the needs and requirements of the user.
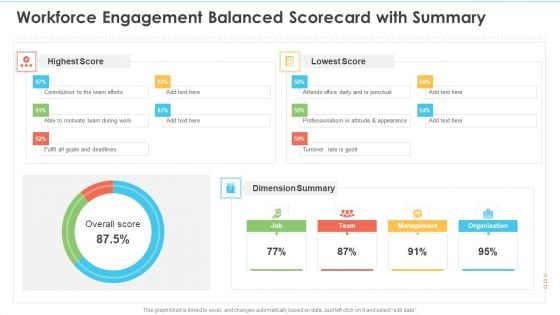
Workforce Engagement Balanced Scorecard With Summary Ppt Layouts Template PDF
This graph or chart is linked to excel, and changes automatically based on data. Just left click on it and select edit data. Deliver and pitch your topic in the best possible manner with this Workforce Engagement Balanced Scorecard With Summary Ppt Layouts Template PDF. Use them to share invaluable insights on Highest Score, Lowest Score, Dimension Summary and impress your audience. This template can be altered and modified as per your expectations. So, grab it now.
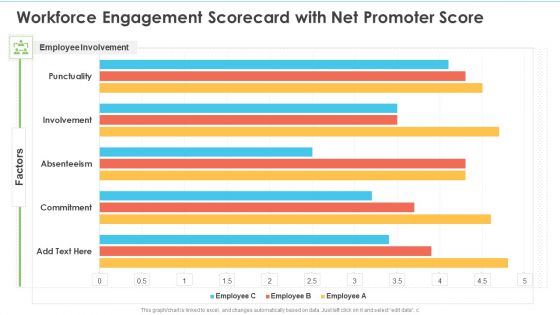
Workforce Engagement Scorecard With Net Promoter Score Ppt Portfolio Images PDF
This graph or chart is linked to excel, and changes automatically based on data. Just left click on it and select edit data. Deliver and pitch your topic in the best possible manner with this Workforce Engagement Scorecard With Net Promoter Score Ppt Portfolio Images PDF. Use them to share invaluable insights on Employee Involvement, Punctuality Involvement, Absenteeism and impress your audience. This template can be altered and modified as per your expectations. So, grab it now.
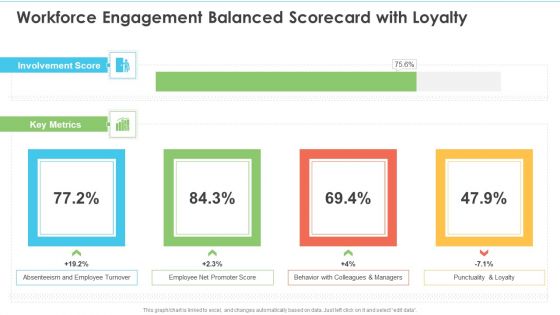
Workforce Engagement Balanced Scorecard With Loyalty Ppt Styles Good PDF
This graph or chart is linked to excel, and changes automatically based on data. Just left click on it and select edit data. Deliver an awe inspiring pitch with this creative Workforce Engagement Balanced Scorecard With Loyalty Ppt Styles Good PDF bundle. Topics like Involvement Score, Key Metrics, Employee Turnover can be discussed with this completely editable template. It is available for immediate download depending on the needs and requirements of the user.
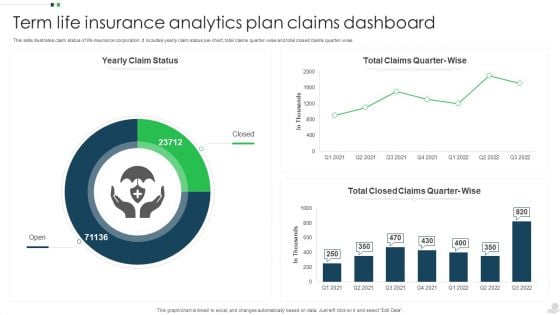
Term Life Insurance Analytics Plan Claims Dashboard Structure PDF
This slide illustrates claim status of life insurance corporation. It includes yearly claim status pie chart, total claims quarter-wise and total closed claims quarter wise. Pitch your topic with ease and precision using this Term Life Insurance Analytics Plan Claims Dashboard Structure PDF. This layout presents information on Insurance Analytics, Plan Claims Dashboard. It is also available for immediate download and adjustment. So, changes can be made in the color, design, graphics or any other component to create a unique layout.

Implementing Moscow Task Prioritization Model Resolving Chicken And Egg Problem In Organization Pictures PDF
This slide covers the task and priority table with estimated effort and chart for the tasks performed based on Moscow prioritization model.Deliver an awe inspiring pitch with this creative Implementing Moscow Task Prioritization Model Resolving Chicken And Egg Problem In Organization Pictures PDF bundle. Topics like Estimated Effort, Task And Priority, Total Estimated can be discussed with this completely editable template. It is available for immediate download depending on the needs and requirements of the user.
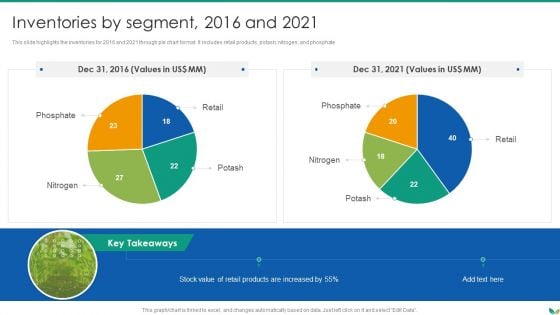
Agricultural Business Company Profile Inventories By Segment 2016 And 2021 Sample PDF
This slide highlights the inventories for 2016 and 2021 through pie chart format. It includes retail products, potash, nitrogen, and phosphate.Deliver and pitch your topic in the best possible manner with this Agricultural Business Company Profile Inventories By Segment 2016 And 2021 Sample PDF Use them to share invaluable insights on Retail Products, Phosphate, Retail and impress your audience. This template can be altered and modified as per your expectations. So, grab it now.
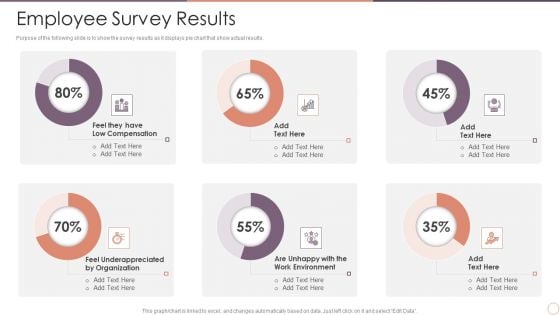
Managing Employee Turnover Employee Survey Results Microsoft PDF
Purpose of the following slide is to show the survey results as it displays pie chart that show actual results. Deliver an awe inspiring pitch with this creative Managing Employee Turnover Employee Survey Results Microsoft PDF bundle. Topics like Low Compensation, Underappreciated, Work Environment can be discussed with this completely editable template. It is available for immediate download depending on the needs and requirements of the user.
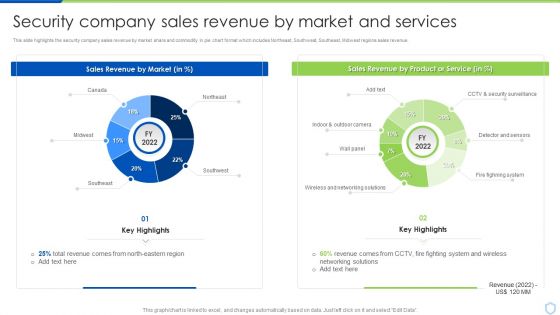
Security And Surveillance Company Profile Security Company Sales Revenue Clipart PDF
This slide highlights the security company sales revenue by market share and commodity in pie chart format which includes Northeast, Southwest, Southeast, Midwest regions sales revenue.Deliver an awe inspiring pitch with this creative Security And Surveillance Company Profile Security Company Sales Revenue Clipart PDF bundle. Topics like Sales Revenue, Security Surveillance, Networking Solutions can be discussed with this completely editable template. It is available for immediate download depending on the needs and requirements of the user.
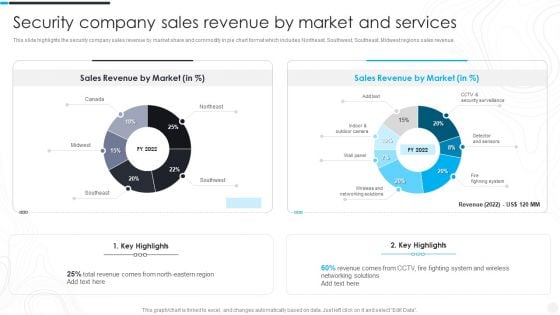
Security Camera System Company Profile Security Company Sales Revenue Template PDF
This slide highlights the security company sales revenue by market share and commodity in pie chart format which includes Northeast, Southwest, Southeast, Midwest regions sales revenue.Deliver an awe inspiring pitch with this creative Security Camera System Company Profile Security Company Sales Revenue Template PDF bundle. Topics like Detector And Sensors, Fighning System, Security Surveillance can be discussed with this completely editable template. It is available for immediate download depending on the needs and requirements of the user.
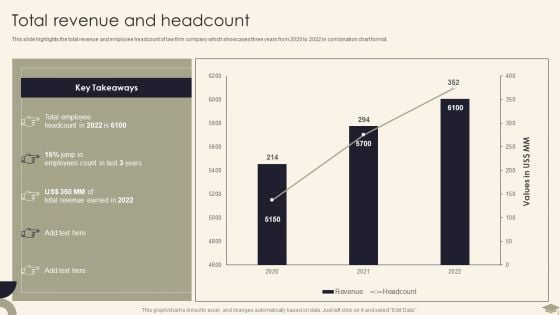
Legal Advisory Company Description Total Revenue And Headcount Graphics PDF
This slide highlights the total revenue and employee headcount of law firm company which showcases three years from 2020 to 2022 in combination chart format.Deliver and pitch your topic in the best possible manner with this Legal Advisory Company Description Total Revenue And Headcount Graphics PDF. Use them to share invaluable insights on Total Employee, Revenue Earned, Employees Count and impress your audience. This template can be altered and modified as per your expectations. So, grab it now.
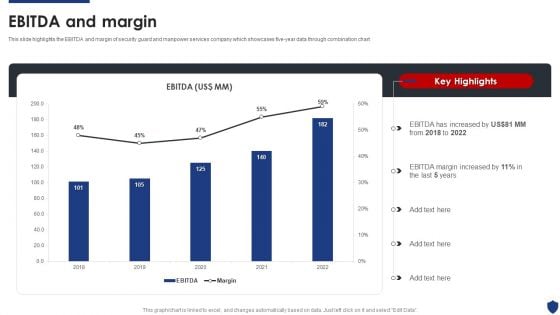
Security Officer Service Company Profile Ebitda And Margin Ppt PowerPoint Presentation File Deck PDF
This slide highlights the EBITDA and margin of security guard and manpower services company which showcases five-year data through combination chart. Deliver and pitch your topic in the best possible manner with this Security Officer Service Company Profile Ebitda And Margin Ppt PowerPoint Presentation File Deck PDF. Use them to share invaluable insights on EBITDA Increased, 2018 To 2022, EBITDA Margin Increased and impress your audience. This template can be altered and modified as per your expectations. So, grab it now.
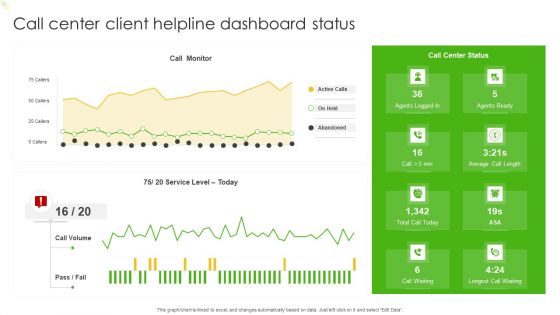
Call Center Client Helpline Dashboard Status Ppt Show Graphics Design PDF
This graph or chart is linked to excel, and changes automatically based on data. Just left click on it and select Edit Data. Showcasing this set of slides titled Call Center Client Helpline Dashboard Status Ppt Show Graphics Design PDF. The topics addressed in these templates are Call Monitor, Active Calls, Abandoned, Agents Ready. All the content presented in this PPT design is completely editable. Download it and make adjustments in color, background, font etc. as per your unique business setting.
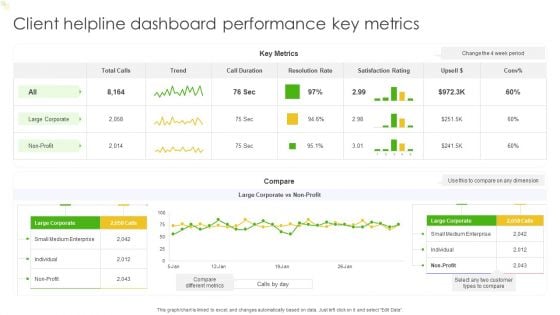
Client Helpline Dashboard Performance Key Metrics Ppt Outline Deck PDF
This graph or chart is linked to excel, and changes automatically based on data. Just left click on it and select Edit Data. Pitch your topic with ease and precision using this Client Helpline Dashboard Performance Key Metrics Ppt Outline Deck PDF. This layout presents information on Key Metrics, Trend, Compare. It is also available for immediate download and adjustment. So, changes can be made in the color, design, graphics or any other component to create a unique layout.
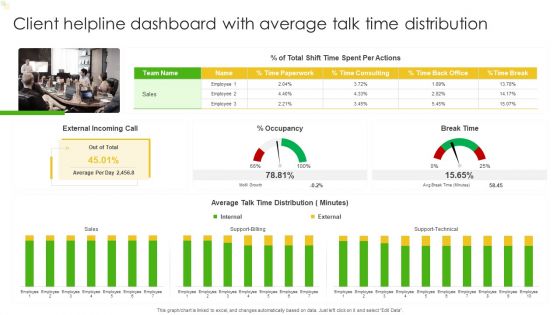
Client Helpline Dashboard With Average Talk Time Distribution Ppt Gallery Backgrounds PDF
This graph or chart is linked to excel, and changes automatically based on data. Just left click on it and select Edit Data. Showcasing this set of slides titled Client Helpline Dashboard With Average Talk Time Distribution Ppt Gallery Backgrounds PDF. The topics addressed in these templates are External Incoming Call, Occupancy, Break Time, Sales. All the content presented in this PPT design is completely editable. Download it and make adjustments in color, background, font etc. as per your unique business setting.
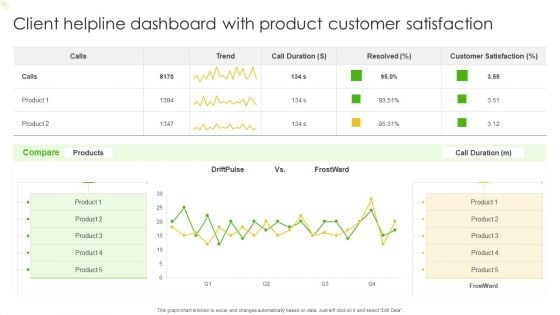
Client Helpline Dashboard With Product Customer Satisfaction Ppt Slides Graphics Template PDF
This graph or chart is linked to excel, and changes automatically based on data. Just left click on it and select Edit Data. Pitch your topic with ease and precision using this Client Helpline Dashboard With Product Customer Satisfaction Ppt Slides Graphics Template PDF. This layout presents information on Customer Satisfaction, Product, Compare. It is also available for immediate download and adjustment. So, changes can be made in the color, design, graphics or any other component to create a unique layout.
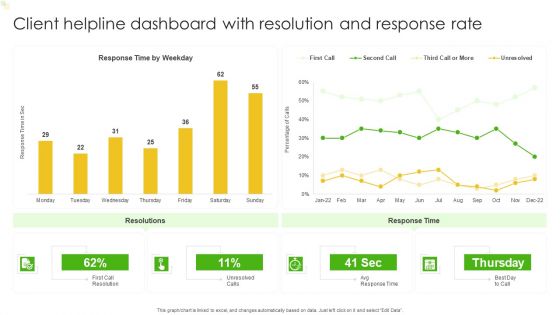
Client Helpline Dashboard With Resolution And Response Rate Ppt File Example Topics PDF
This graph or chart is linked to excel, and changes automatically based on data. Just left click on it and select Edit Data. Showcasing this set of slides titled Client Helpline Dashboard With Resolution And Response Rate Ppt File Example Topics PDF. The topics addressed in these templates are Resolutions, Response Time, Response Time Weekday. All the content presented in this PPT design is completely editable. Download it and make adjustments in color, background, font etc. as per your unique business setting.
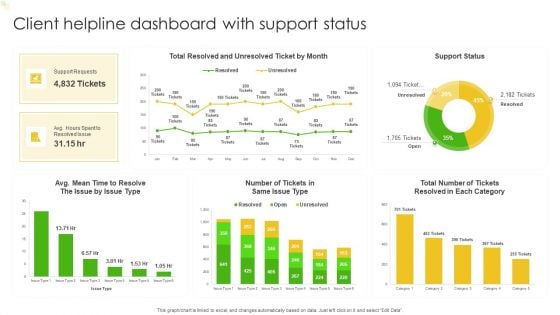
Client Helpline Dashboard With Support Status Ppt Portfolio Rules PDF
This graph or chart is linked to excel, and changes automatically based on data. Just left click on it and select Edit Data. Showcasing this set of slides titled Client Helpline Dashboard With Support Status Ppt Portfolio Rules PDF. The topics addressed in these templates are Total Number, Support Requests, Total Resolved, Support Status. All the content presented in this PPT design is completely editable. Download it and make adjustments in color, background, font etc. as per your unique business setting.
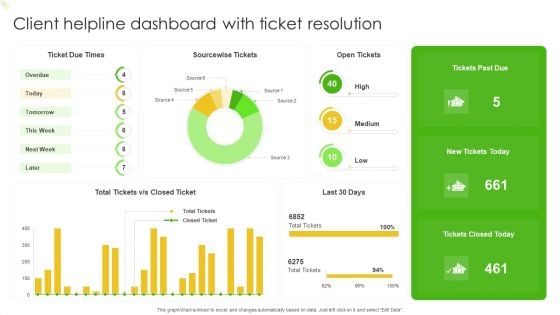
Client Helpline Dashboard With Ticket Resolution Ppt Model Graphics Design PDF
This graph or chart is linked to excel, and changes automatically based on data. Just left click on it and select Edit Data. Pitch your topic with ease and precision using this Client Helpline Dashboard With Ticket Resolution Ppt Model Graphics Design PDF. This layout presents information on Ticket Due Times, Sourcewise Tickets, Open Tickets. It is also available for immediate download and adjustment. So, changes can be made in the color, design, graphics or any other component to create a unique layout.
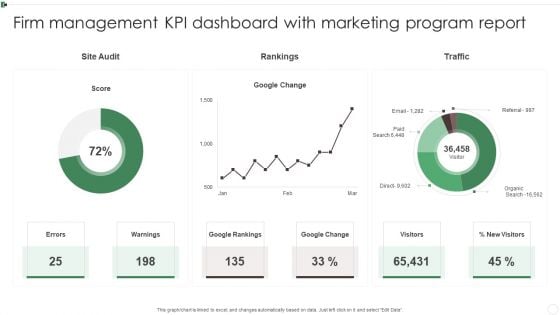
Firm Management KPI Dashboard With Marketing Program Report Ppt Styles Introduction PDF
This graph or chart is linked to excel, and changes automatically based on data. Just left click on it and select Edit Data. Showcasing this set of slides titled Firm Management KPI Dashboard With Marketing Program Report Ppt Styles Introduction PDF. The topics addressed in these templates are Google Rankings, Google Change, Warnings, Visitors. All the content presented in this PPT design is completely editable. Download it and make adjustments in color, background, font etc. as per your unique business setting.
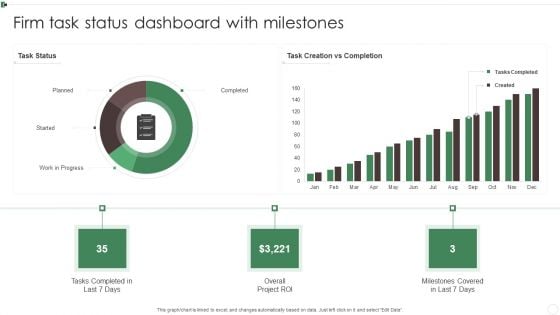
Firm Task Status Dashboard With Milestones Ppt Show Sample PDF
This graph or chart is linked to excel, and changes automatically based on data. Just left click on it and select Edit Data. Showcasing this set of slides titled Firm Task Status Dashboard With Milestones Ppt Show Sample PDF. The topics addressed in these templates are Tasks Completed, Planned, Work Progress, Overall Project ROI. All the content presented in this PPT design is completely editable. Download it and make adjustments in color, background, font etc. as per your unique business setting.
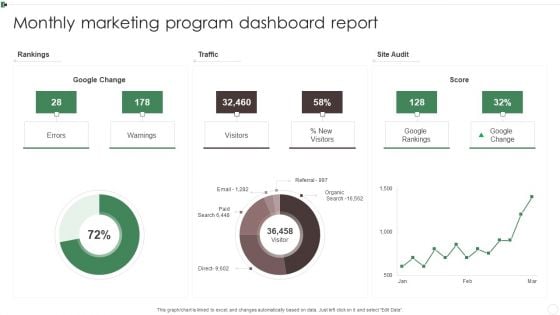
Monthly Marketing Program Dashboard Report Ppt Inspiration Information PDF
This graph or chart is linked to excel, and changes automatically based on data. Just left click on it and select Edit Data. Pitch your topic with ease and precision using this Monthly Marketing Program Dashboard Report Ppt Inspiration Information PDF. This layout presents information on Rankings, Traffic, Site Audit, Warnings. It is also available for immediate download and adjustment. So, changes can be made in the color, design, graphics or any other component to create a unique layout.
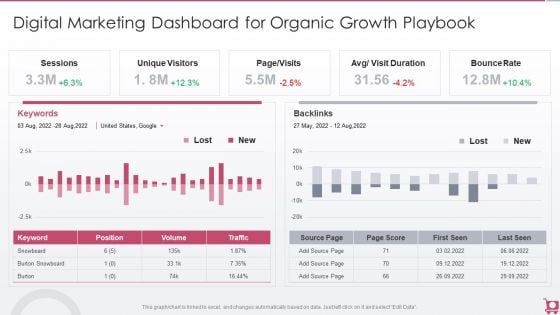
Playbook For Sales Growth Strategies Digital Marketing Dashboard For Organic Growth Designs PDF
This graph or chart is linked to excel, and changes automatically based on data. Just left click on it and select Edit Data. Deliver and pitch your topic in the best possible manner with this Playbook For Sales Growth Strategies Digital Marketing Dashboard For Organic Growth Designs PDF. Use them to share invaluable insights on Unique Visitors, Sessions, Bounce Rate and impress your audience. This template can be altered and modified as per your expectations. So, grab it now.
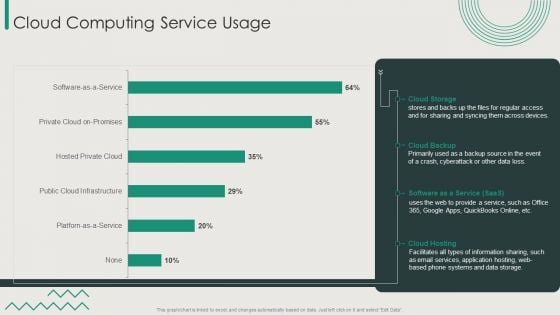
Organization Transition Cloud Computing Service Usage Ppt PowerPoint Presentation File Outfit PDF
This graph or chart is linked to excel, and changes automatically based on data. Just left click on it and select Edit Data. Deliver an awe inspiring pitch with this creative Organization Transition Cloud Computing Service Usage Ppt PowerPoint Presentation File Outfit PDF bundle. Topics like Cloud Storage, Cloud Backup, Cloud Hosting can be discussed with this completely editable template. It is available for immediate download depending on the needs and requirements of the user.
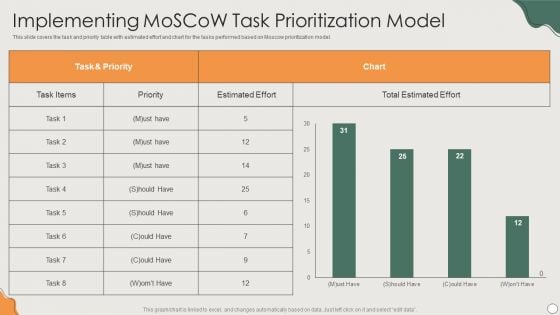
Platform Business Model Implementation In Firm Implementing Moscow Task Prioritization Model Inspiration PDF
This slide covers the task and priority table with estimated effort and chart for the tasks performed based on Moscow prioritization model.Deliver and pitch your topic in the best possible manner with this Platform Business Model Implementation In Firm Implementing Moscow Task Prioritization Model Inspiration PDF. Use them to share invaluable insights on Estimated Effort, Total Estimated, Task Priority and impress your audience. This template can be altered and modified as per your expectations. So, grab it now.
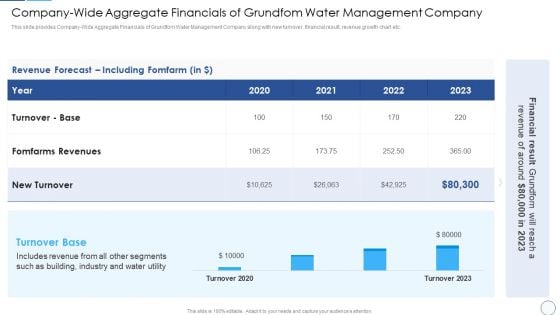
Company Wide Aggregate Financials Of Grundfom Water Management Company Background PDF
This slide provides Company-Wide Aggregate Financials of Grundfom Water Management Company along with new turnover, financial result, revenue growth chart etc. Deliver an awe inspiring pitch with this creative Company Wide Aggregate Financials Of Grundfom Water Management Company Background PDF bundle. Topics like Fomfarms Revenues, Turnover Base, Including Fomfarm can be discussed with this completely editable template. It is available for immediate download depending on the needs and requirements of the user.
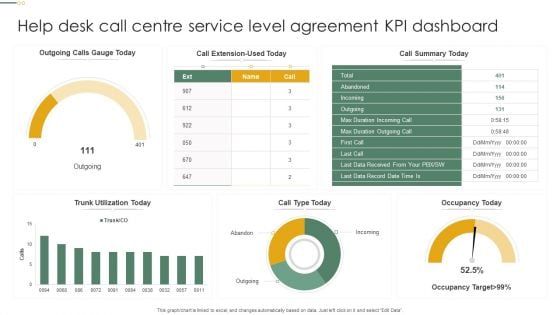
Help Desk Call Centre Service Level Agreement KPI Dashboard Pictures PDF
This graph or chart is linked to excel, and changes automatically based on data. Just left click on it and select Edit Data. Showcasing this set of slides titled Help Desk Call Centre Service Level Agreement KPI Dashboard Pictures PDF. The topics addressed in these templates are Call Type Today, Occupancy Today, Call Summary Today. All the content presented in this PPT design is completely editable. Download it and make adjustments in color, background, font etc. as per your unique business setting.
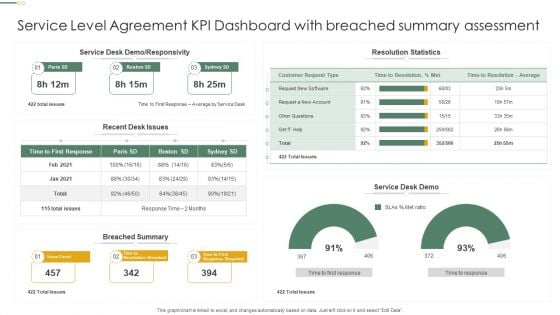
Service Level Agreement KPI Dashboard With Breached Summary Assessment Professional PDF
This graph or chart is linked to excel, and changes automatically based on data. Just left click on it and select Edit Data. Pitch your topic with ease and precision using this Service Level Agreement KPI Dashboard With Breached Summary Assessment Professional PDF. This layout presents information on Resolution Statistics, Service Desk Demo, Breached Summary. It is also available for immediate download and adjustment. So, changes can be made in the color, design, graphics or any other component to create a unique layout.
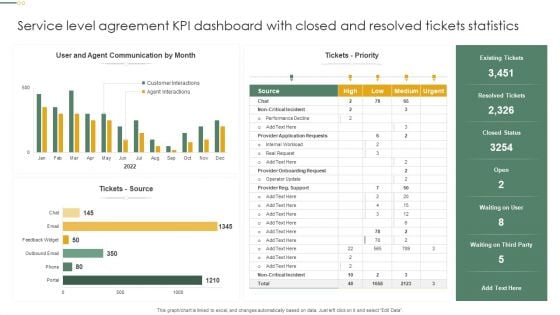
Service Level Agreement KPI Dashboard With Closed And Resolved Tickets Statistics Inspiration PDF
This graph or chart is linked to excel, and changes automatically based on data. Just left click on it and select Edit Data. Showcasing this set of slides titled Service Level Agreement KPI Dashboard With Closed And Resolved Tickets Statistics Inspiration PDF. The topics addressed in these templates are Tickets Priority, Tickets Source, Resolved Tickets. All the content presented in this PPT design is completely editable. Download it and make adjustments in color, background, font etc. as per your unique business setting.
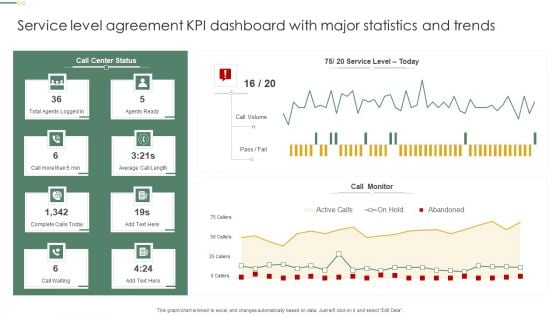
Service Level Agreement KPI Dashboard With Major Statistics And Trends Pictures PDF
This graph or chart is linked to excel, and changes automatically based on data. Just left click on it and select Edit Data. Pitch your topic with ease and precision using this Service Level Agreement KPI Dashboard With Major Statistics And Trends Pictures PDF. This layout presents information on Call Monitor, Call Volume, Agents Ready. It is also available for immediate download and adjustment. So, changes can be made in the color, design, graphics or any other component to create a unique layout.
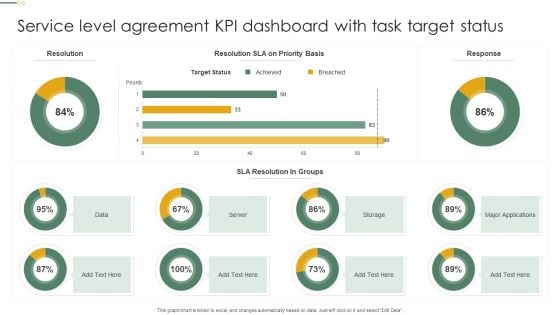
Service Level Agreement KPI Dashboard With Task Target Status Microsoft PDF
This graph or chart is linked to excel, and changes automatically based on data. Just left click on it and select Edit Data. Pitch your topic with ease and precision using this Service Level Agreement KPI Dashboard With Task Target Status Microsoft PDF. This layout presents information on Target Status, Sla Resolution, Groups, Server. It is also available for immediate download and adjustment. So, changes can be made in the color, design, graphics or any other component to create a unique layout.
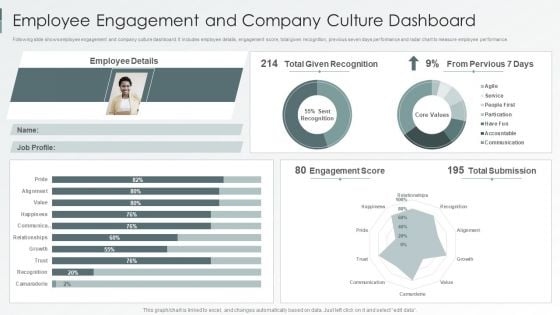
Enterprise Sustainability Performance Metrics Employee Engagement And Company Culture Dashboard Background PDF
Following slide shows employee engagement and company culture dashboard. It includes employee details, engagement score, total given recognition, previous seven days performance and radar chart to measure employee performance.Deliver and pitch your topic in the best possible manner with this Enterprise Sustainability Performance Metrics Employee Engagement And Company Culture Dashboard Background PDF. Use them to share invaluable insights on Given Recognition, Pervious, Engagement Score and impress your audience. This template can be altered and modified as per your expectations. So, grab it now.
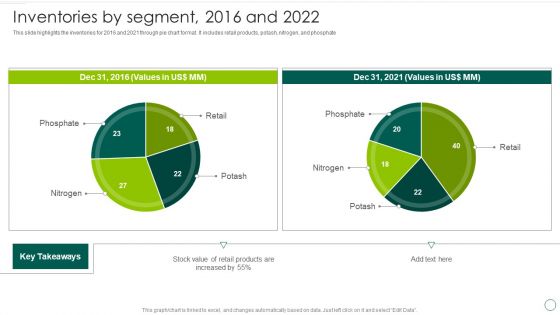
Food And Agro Company Outline Inventories By Segment 2016 And 2022 Background PDF
This slide highlights the inventories for 2016 and 2021 through pie chart format. It includes retail products, potash, nitrogen, and phosphate. Deliver an awe inspiring pitch with this creative Food And Agro Company Outline Inventories By Segment 2016 And 2022 Background PDF bundle. Topics like 2016, Stock Value, Retail Products can be discussed with this completely editable template. It is available for immediate download depending on the needs and requirements of the user.
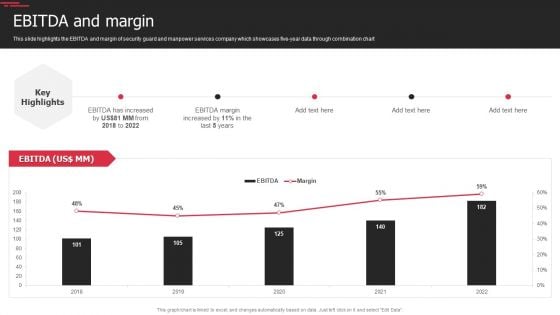
Security Agency Business Profile Ebitda And Margin Pictures PDF
This slide highlights the EBITDA and margin of security guard and manpower services company which showcases five year data through combination chart. Deliver an awe inspiring pitch with this creative Security Agency Business Profile Ebitda And Margin Pictures PDF bundle. Topics like Ebitda And Margin can be discussed with this completely editable template. It is available for immediate download depending on the needs and requirements of the user.
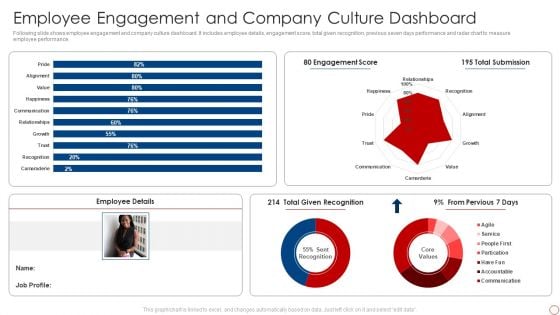
Kpis For Evaluating Business Sustainability Employee Engagement And Company Graphics PDF
Following slide shows employee engagement and company culture dashboard. It includes employee details, engagement score, total given recognition, previous seven days performance and radar chart to measure employee performance. Deliver an awe inspiring pitch with this creative Kpis For Evaluating Business Sustainability Employee Engagement And Company Graphics PDF bundle. Topics like 80 Engagement Score, 195 Total Submission, Employee Details can be discussed with this completely editable template. It is available for immediate download depending on the needs and requirements of the user.
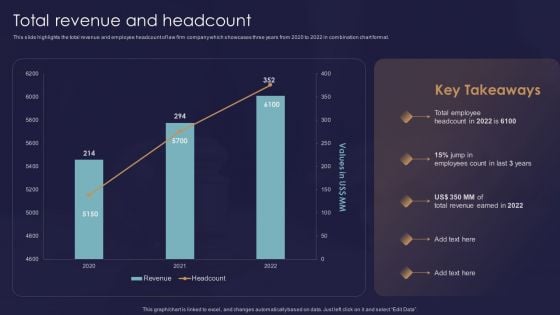
Legal And Law Assistance LLP Business Total Revenue And Headcount Template PDF
This slide highlights the total revenue and employee headcount of law firm company which showcases three years from 2020 to 2022 in combination chart format. Deliver an awe inspiring pitch with this creative Legal And Law Assistance LLP Business Total Revenue And Headcount Template PDF bundle. Topics like Total Employee, Employees Count, Total Revenue Earned can be discussed with this completely editable template. It is available for immediate download depending on the needs and requirements of the user.
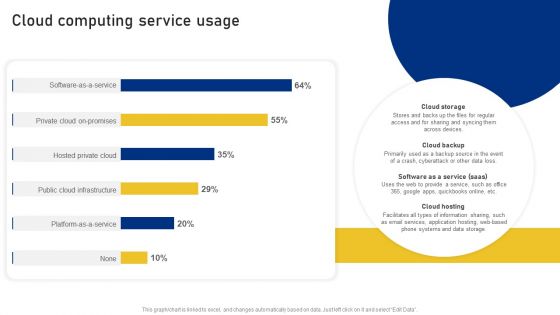
Reshaping Business In Digital Cloud Computing Service Usage Formats PDF
This graph or chart is linked to excel, and changes automatically based on data. Just left click on it and select Edit Data. Deliver an awe inspiring pitch with this creative Reshaping Business In Digital Cloud Computing Service Usage Formats PDF bundle. Topics like Private Cloud Promises, Hosted Private Cloud, Public Cloud Infrastructure can be discussed with this completely editable template. It is available for immediate download depending on the needs and requirements of the user.
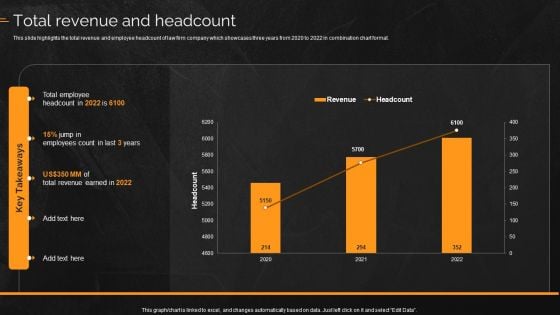
Law And Enforcement Company Profile Total Revenue And Headcount Topics PDF
This slide highlights the total revenue and employee headcount of law firm company which showcases three years from 2020 to 2022 in combination chart format. Deliver and pitch your topic in the best possible manner with this Law And Enforcement Company Profile Total Revenue And Headcount Topics PDF. Use them to share invaluable insights on Employees, Revenue and impress your audience. This template can be altered and modified as per your expectations. So, grab it now.
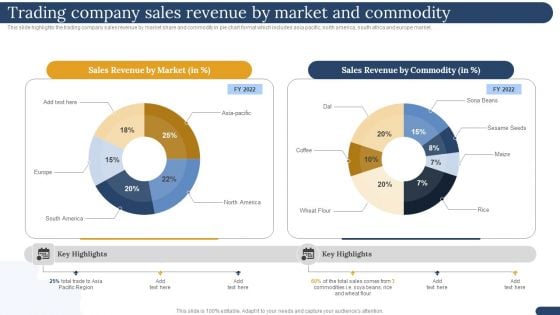
International Trading Business Export Company Trading Company Sales Revenue By Market And Commodity Elements PDF
This slide highlights the trading company sales revenue by market share and commodity in pie chart format which includes asia pacific, north america, south africa and europe market.Deliver an awe inspiring pitch with this creative International Trading Business Export Company Trading Company Sales Revenue By Market And Commodity Elements PDF bundle. Topics like Sales Revenue, Revenue Commodity, Sales Comes can be discussed with this completely editable template. It is available for immediate download depending on the needs and requirements of the user.
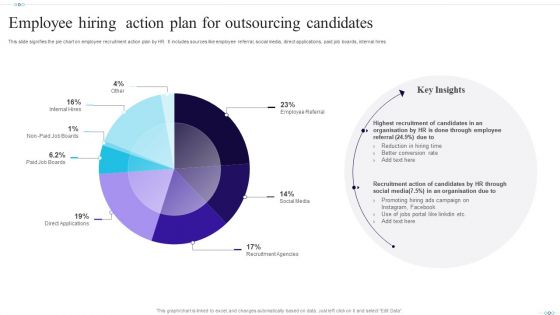
Employee Hiring Action Plan For Outsourcing Candidates Template PDF
This slide signifies the pie chart on employee recruitment action plan by HR. It includes sources like employee referral, social media, direct applications, paid job boards, internal hires. Showcasing this set of slides titled Employee Hiring Action Plan For Outsourcing Candidates Template PDF. The topics addressed in these templates are Employee Hiring Action Plan, Outsourcing Candidates. All the content presented in this PPT design is completely editable. Download it and make adjustments in color, background, font etc. as per your unique business setting.
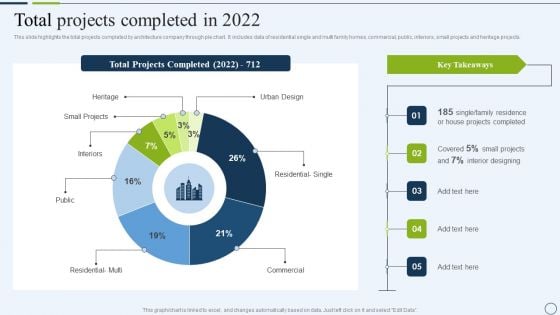
Commercial And Urban Architect Business Profile Total Projects Completed In 2022 Formats PDF
This slide highlights the total projects completed by architecture company through pie chart. It includes data of residential single and multi family homes, commercial, public, interiors, small projects and heritage projects. Deliver an awe inspiring pitch with this creative Commercial And Urban Architect Business Profile Total Projects Completed In 2022 Formats PDF bundle. Topics like Urban Design, Commercial, Small Projects can be discussed with this completely editable template. It is available for immediate download depending on the needs and requirements of the user.
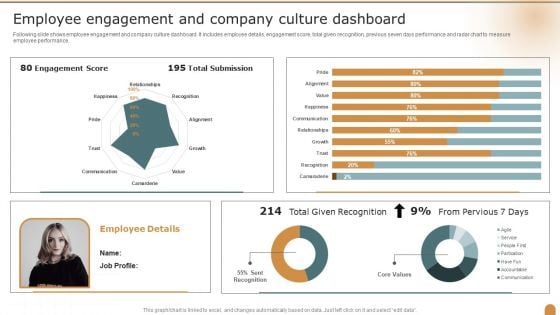
Employee Engagement And Company Culture Dashboard Company Performance Evaluation Using KPI Pictures PDF
Following slide shows employee engagement and company culture dashboard. It includes employee details, engagement score, total given recognition, previous seven days performance and radar chart to measure employee performance. Deliver an awe inspiring pitch with this creative Employee Engagement And Company Culture Dashboard Company Performance Evaluation Using KPI Pictures PDF bundle. Topics like Employee Engagement, Company, Culture Dashboard can be discussed with this completely editable template. It is available for immediate download depending on the needs and requirements of the user.
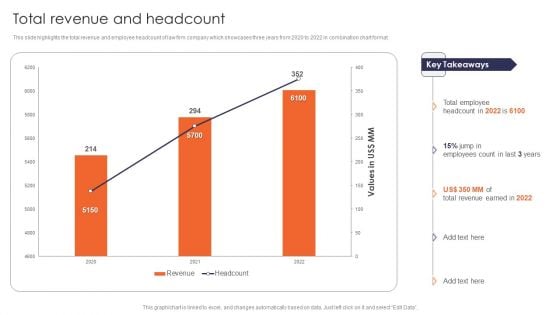
Total Revenue And Headcount Multinational Legal Firm Company Profile Graphics PDF
This slide highlights the total revenue and employee headcount of law firm company which showcases three years from 2020 to 2022 in combination chart format. Deliver an awe inspiring pitch with this creative Total Revenue And Headcount Multinational Legal Firm Company Profile Graphics PDF bundle. Topics like Total Revenue, Headcount can be discussed with this completely editable template. It is available for immediate download depending on the needs and requirements of the user.
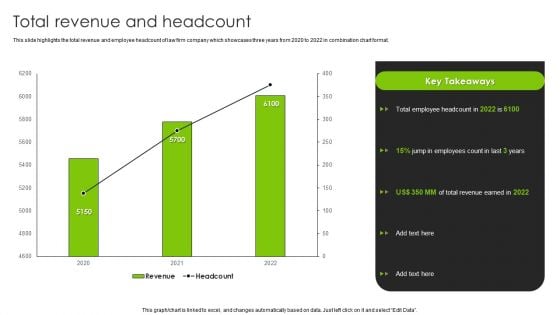
International Legal And Business Services Company Profile Total Revenue And Headcount Professional PDF
This slide highlights the total revenue and employee headcount of law firm company which showcases three years from 2020 to 2022 in combination chart format. Deliver and pitch your topic in the best possible manner with this International Legal And Business Services Company Profile Total Revenue And Headcount Professional PDF. Use them to share invaluable insights on Total Revenue, Headcount and impress your audience. This template can be altered and modified as per your expectations. So, grab it now.
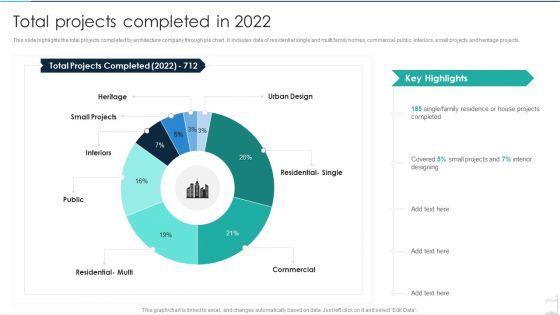
Commercial Construction And Architecture Firm Total Projects Completed In 2022 Brochure PDF
This slide highlights the total projects completed by architecture company through pie chart. It includes data of residential single and multi family homes, commercial, public, interiors, small projects and heritage projects. Deliver an awe inspiring pitch with this creative Commercial Construction And Architecture Firm Total Projects Completed In 2022 Brochure PDF bundle. Topics like Revenue, Services, Retail can be discussed with this completely editable template. It is available for immediate download depending on the needs and requirements of the user.
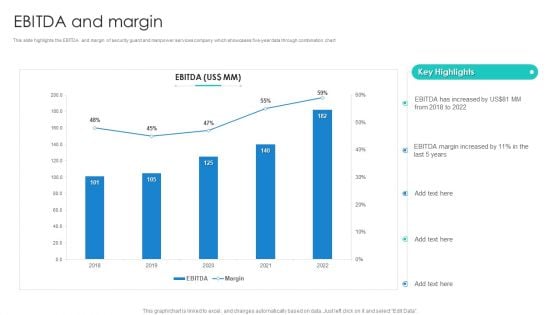
Manpower Corporate Security Business Profile Ebitda And Margin Portrait PDF
This slide highlights the EBITDA and margin of security guard and manpower services company which showcases five year data through combination chart. Deliver an awe inspiring pitch with this creative Manpower Corporate Security Business Profile Ebitda And Margin Portrait PDF bundle. Topics like EBITDA And Margin can be discussed with this completely editable template. It is available for immediate download depending on the needs and requirements of the user.
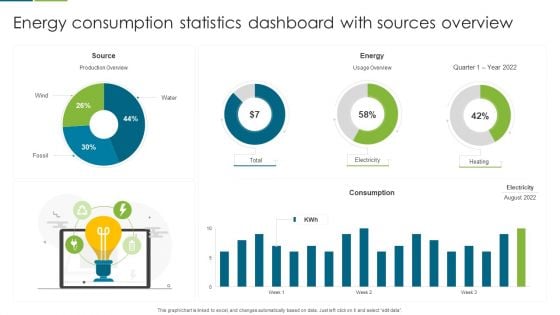
Energy Consumption Statistics Dashboard With Sources Overview Template PDF
This graph or chart is linked to excel, and changes automatically based on data. Just left click on it and select edit data. Pitch your topic with ease and precision using this Energy Consumption Statistics Dashboard With Sources Overview Template PDF. This layout presents information on Source, Energy, Consumption. It is also available for immediate download and adjustment. So, changes can be made in the color, design, graphics or any other component to create a unique layout.
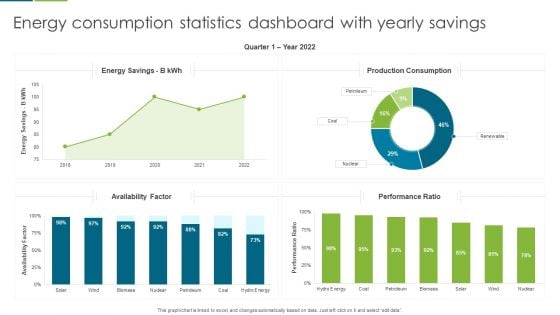
Energy Consumption Statistics Dashboard With Yearly Savings Guidelines PDF
This graph or chart is linked to excel, and changes automatically based on data. Just left click on it and select edit data. Showcasing this set of slides titled Energy Consumption Statistics Dashboard With Yearly Savings Guidelines PDF. The topics addressed in these templates are Production Consumption, Energy Savings, Performance Ratio. All the content presented in this PPT design is completely editable. Download it and make adjustments in color, background, font etc. as per your unique business setting.
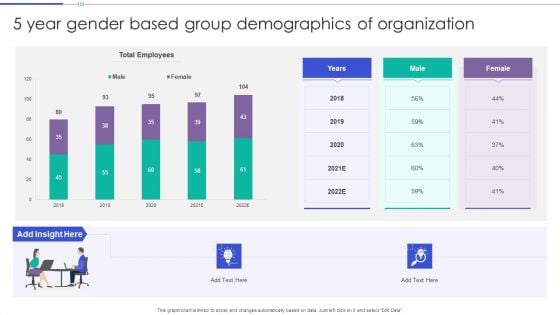
5 Year Gender Based Group Demographics Of Organization Background PDF
This graph or chart is linked to excel, and changes automatically based on data. Just left click on it and select Edit Data. Showcasing this set of slides titled 5 Year Gender Based Group Demographics Of Organization Background PDF. The topics addressed in these templates are Total Employees, Male, Female. All the content presented in this PPT design is completely editable. Download it and make adjustments in color, background, font etc. as per your unique business setting.
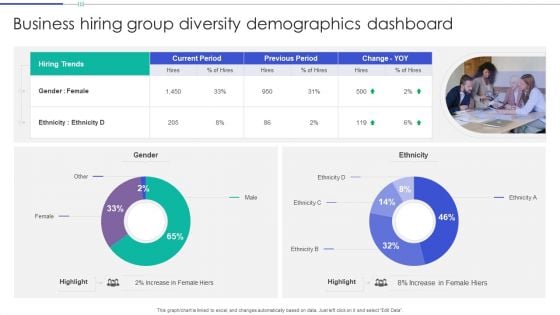
Business Hiring Group Diversity Demographics Dashboard Guidelines PDF
This graph or chart is linked to excel, and changes automatically based on data. Just left click on it and select Edit Data. Showcasing this set of slides titled Business Hiring Group Diversity Demographics Dashboard Guidelines PDF. The topics addressed in these templates are Hiring Trends, Current Period, Previous Period. All the content presented in this PPT design is completely editable. Download it and make adjustments in color, background, font etc. as per your unique business setting.
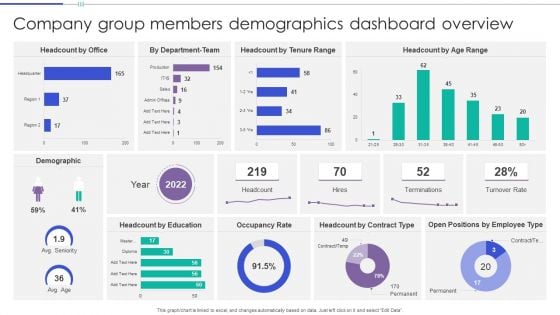
Company Group Members Demographics Dashboard Overview Clipart PDF
This graph or chart is linked to excel, and changes automatically based on data. Just left click on it and select Edit Data. Pitch your topic with ease and precision using this Company Group Members Demographics Dashboard Overview Clipart PDF. This layout presents information on Headcount Office, Headcount Tenure Range, Headcount Age Range. It is also available for immediate download and adjustment. So, changes can be made in the color, design, graphics or any other component to create a unique layout.
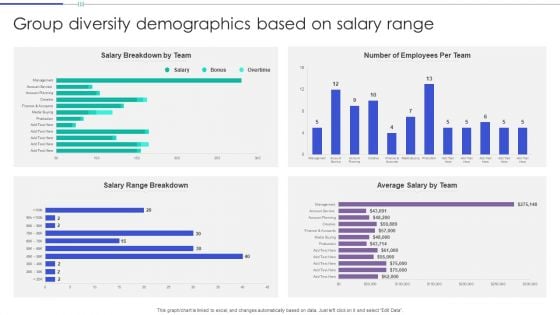
Group Diversity Demographics Based On Salary Range Portrait PDF
This graph or chart is linked to excel, and changes automatically based on data. Just left click on it and select Edit Data. Showcasing this set of slides titled Group Diversity Demographics Based On Salary Range Portrait PDF. The topics addressed in these templates are Salary Breakdown Team, Number Employees, Per Team. All the content presented in this PPT design is completely editable. Download it and make adjustments in color, background, font etc. as per your unique business setting.
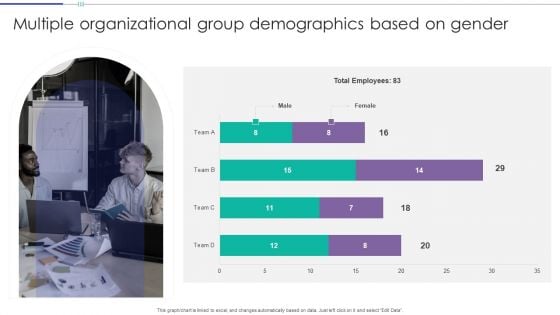
Multiple Organizational Group Demographics Based On Gender Download PDF
This graph or chart is linked to excel, and changes automatically based on data. Just left click on it and select Edit Data. Showcasing this set of slides titled Multiple Organizational Group Demographics Based On Gender Download PDF. The topics addressed in these templates are Total Employees, Team, Female. All the content presented in this PPT design is completely editable. Download it and make adjustments in color, background, font etc. as per your unique business setting.
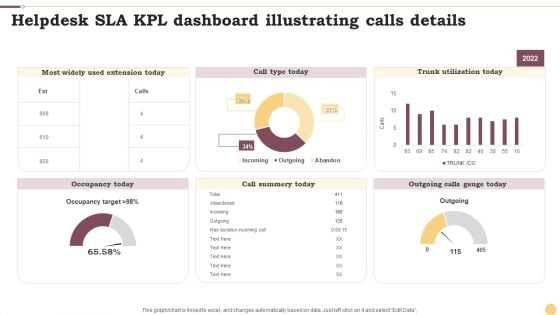
Helpdesk SLA KPL Dashboard Illustrating Calls Details Ppt Slides Show PDF
This graph or chart is linked to excel, and changes automatically based on data. Just left click on it and select Edit Data. Showcasing this set of slides titled Helpdesk SLA KPL Dashboard Illustrating Calls Details Ppt Slides Show PDF. The topics addressed in these templates are Call Type Today, Trunk Utilization Today, Call Summery Today. All the content presented in this PPT design is completely editable. Download it and make adjustments in color, background, font etc. as per your unique business setting.
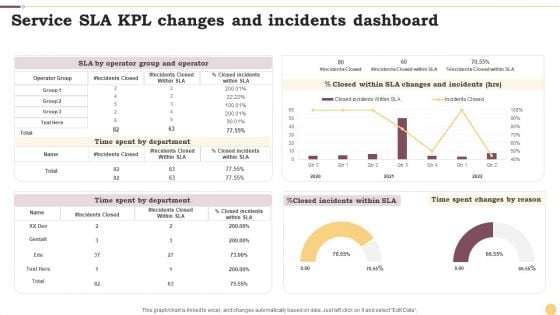
Service SLA KPL Changes And Incidents Dashboard Ppt Inspiration Infographics PDF
This graph or chart is linked to excel, and changes automatically based on data. Just left click on it and select Edit Data. Pitch your topic with ease and precision using this Service SLA KPL Changes And Incidents Dashboard Ppt Inspiration Infographics PDF. This layout presents information on Time Spent Department, Incidents Closed, Operator Group. It is also available for immediate download and adjustment. So, changes can be made in the color, design, graphics or any other component to create a unique layout.
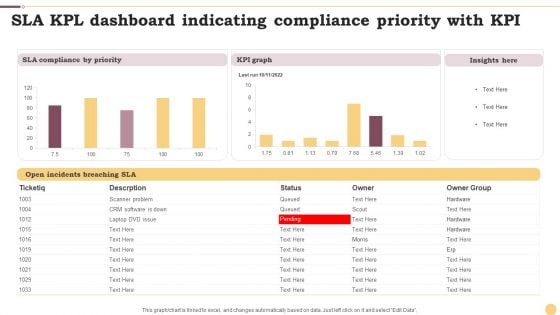
SLA KPL Dashboard Indicating Compliance Priority With KPI Ppt File Format PDF
This graph or chart is linked to excel, and changes automatically based on data. Just left click on it and select Edit Data. Showcasing this set of slides titled SLA KPL Dashboard Indicating Compliance Priority With KPI Ppt File Format PDF. The topics addressed in these templates are KPI Graph, Insights Here, SLA Compliance Priority. All the content presented in this PPT design is completely editable. Download it and make adjustments in color, background, font etc. as per your unique business setting.
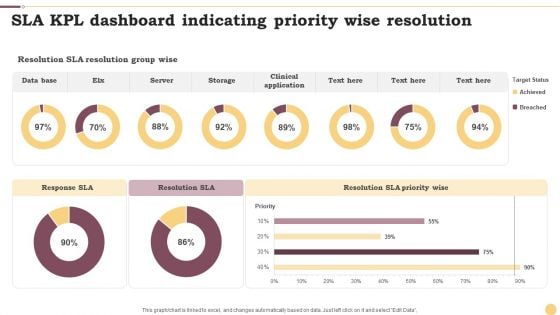
SLA KPL Dashboard Indicating Priority Wise Resolution Ppt Infographics Example File PDF
This graph or chart is linked to excel, and changes automatically based on data. Just left click on it and select Edit Data. Pitch your topic with ease and precision using this SLA KPL Dashboard Indicating Priority Wise Resolution Ppt Infographics Example File PDF. This layout presents information on Data Base, Server, Storage. It is also available for immediate download and adjustment. So, changes can be made in the color, design, graphics or any other component to create a unique layout.
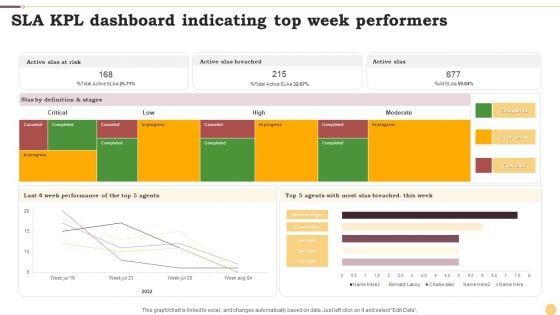
SLA KPL Dashboard Indicating Top Week Performers Ppt Infographics Examples PDF
This graph or chart is linked to excel, and changes automatically based on data. Just left click on it and select Edit Data. Showcasing this set of slides titled SLA KPL Dashboard Indicating Top Week Performers Ppt Infographics Examples PDF. The topics addressed in these templates are Active Slas Risk, Active Slas Breached, Active Slas. All the content presented in this PPT design is completely editable. Download it and make adjustments in color, background, font etc. as per your unique business setting.
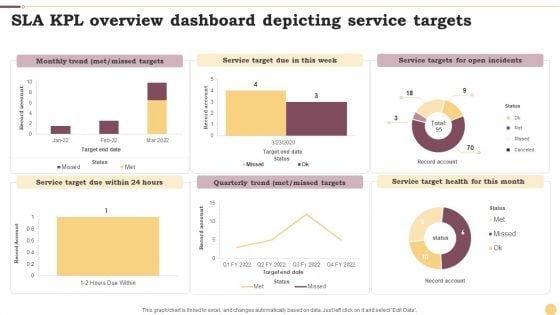
SLA KPL Overview Dashboard Depicting Service Targets Ppt Slides Maker PDF
This graph or chart is linked to excel, and changes automatically based on data. Just left click on it and select Edit Data. Pitch your topic with ease and precision using this SLA KPL Overview Dashboard Depicting Service Targets Ppt Slides Maker PDF. This layout presents information on Monthly Trend, Service Target, Quarterly Trend. It is also available for immediate download and adjustment. So, changes can be made in the color, design, graphics or any other component to create a unique layout.
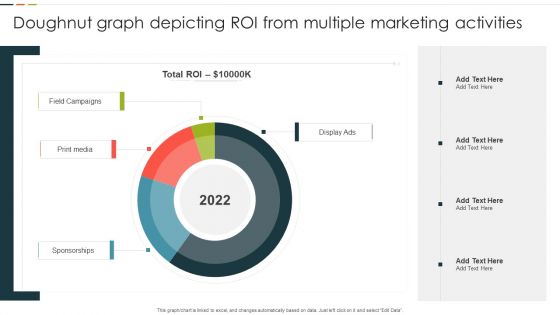
Doughnut Graph Depicting ROI From Multiple Marketing Activities Rules PDF
This graph or chart is linked to excel, and changes automatically based on data. Just left click on it and select Edit Data. Pitch your topic with ease and precision using this Doughnut Graph Depicting ROI From Multiple Marketing Activities Rules PDF. This layout presents information on Total ROI, Field Campaigns, Print Media, Display Ads. It is also available for immediate download and adjustment. So, changes can be made in the color, design, graphics or any other component to create a unique layout.
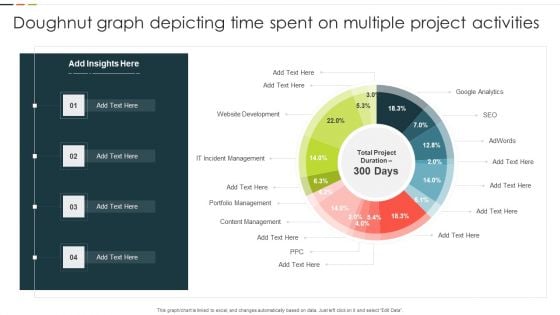
Doughnut Graph Depicting Time Spent On Multiple Project Activities Microsoft PDF
This graph or chart is linked to excel, and changes automatically based on data. Just left click on it and select Edit Data. Showcasing this set of slides titled Doughnut Graph Depicting Time Spent On Multiple Project Activities Microsoft PDF. The topics addressed in these templates are Website Development, IT Incident Management, Portfolio Management. All the content presented in this PPT design is completely editable. Download it and make adjustments in color, background, font etc. as per your unique business setting.
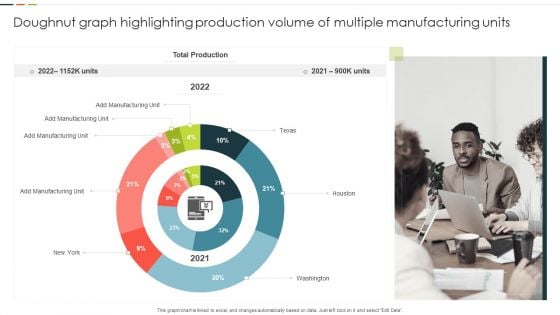
Doughnut Graph Highlighting Production Volume Of Multiple Manufacturing Units Guidelines PDF
This graph or chart is linked to excel, and changes automatically based on data. Just left click on it and select Edit Data. Showcasing this set of slides titled Doughnut Graph Highlighting Production Volume Of Multiple Manufacturing Units Guidelines PDF. The topics addressed in these templates are Total Production, Manufacturing Unit, Washington. All the content presented in this PPT design is completely editable. Download it and make adjustments in color, background, font etc. as per your unique business setting.
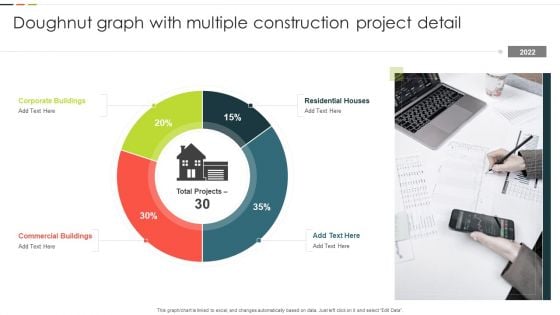
Doughnut Graph With Multiple Construction Project Detail Structure PDF
This graph or chart is linked to excel, and changes automatically based on data. Just left click on it and select Edit Data. Showcasing this set of slides titled Doughnut Graph With Multiple Construction Project Detail Structure PDF. The topics addressed in these templates are Corporate Buildings, Residential Houses, Commercial Buildings. All the content presented in this PPT design is completely editable. Download it and make adjustments in color, background, font etc. as per your unique business setting.
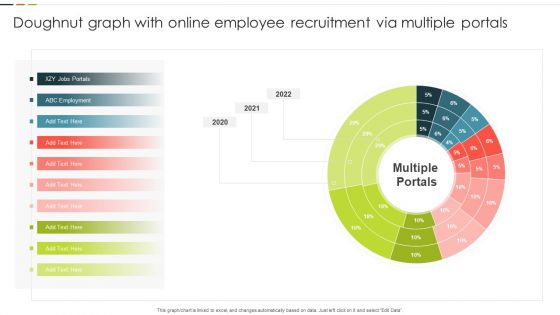
Doughnut Graph With Online Employee Recruitment Via Multiple Portals Mockup PDF
This graph or chart is linked to excel, and changes automatically based on data. Just left click on it and select Edit Data. Pitch your topic with ease and precision using this Doughnut Graph With Online Employee Recruitment Via Multiple Portals Mockup PDF. This layout presents information on ABC Employment, Multiple Portals, 2020 To 2022. It is also available for immediate download and adjustment. So, changes can be made in the color, design, graphics or any other component to create a unique layout.
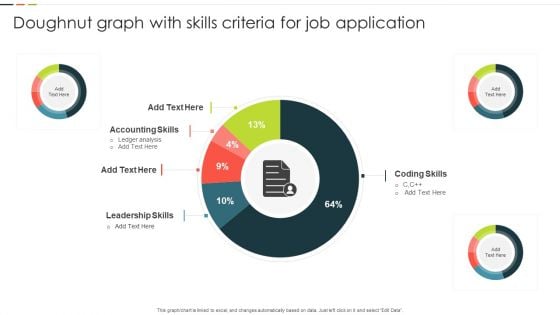
Doughnut Graph With Skills Criteria For Job Application Designs PDF
This graph or chart is linked to excel, and changes automatically based on data. Just left click on it and select Edit Data. Showcasing this set of slides titled Doughnut Graph With Skills Criteria For Job Application Designs PDF. The topics addressed in these templates are Accounting Skills, Leadership Skills, Coding Skills. All the content presented in this PPT design is completely editable. Download it and make adjustments in color, background, font etc. as per your unique business setting.
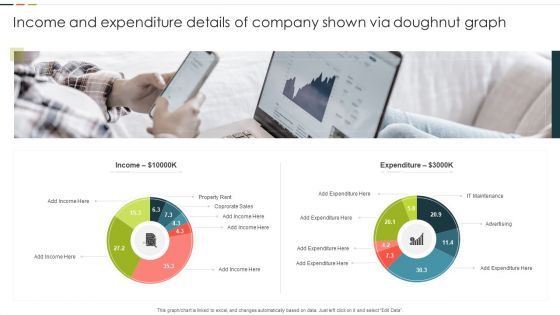
Income And Expenditure Details Of Company Shown Via Doughnut Graph Graphics PDF
This graph or chart is linked to excel, and changes automatically based on data. Just left click on it and select Edit Data. Pitch your topic with ease and precision using this Income And Expenditure Details Of Company Shown Via Doughnut Graph Graphics PDF. This layout presents information on Property Rent, Corporate Sales, Expenditure. It is also available for immediate download and adjustment. So, changes can be made in the color, design, graphics or any other component to create a unique layout.
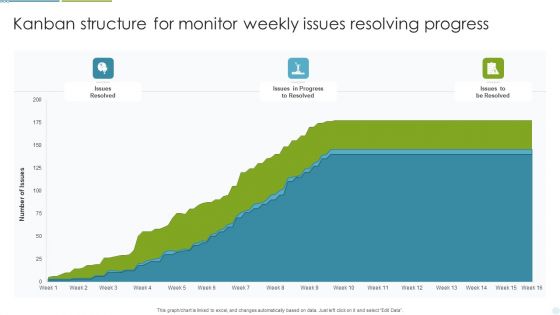
Kanban Structure For Monitor Weekly Issues Resolving Progress Ppt Professional Outline PDF
This graph or chart is linked to excel, and changes automatically based on data. Just left click on it and select Edit Data. Showcasing this set of slides titled Kanban Structure For Monitor Weekly Issues Resolving Progress Ppt Professional Outline PDF. The topics addressed in these templates are Issues Resolved, Progress To Resolved, Issues To Resolved. All the content presented in this PPT design is completely editable. Download it and make adjustments in color, background, font etc. as per your unique business setting.
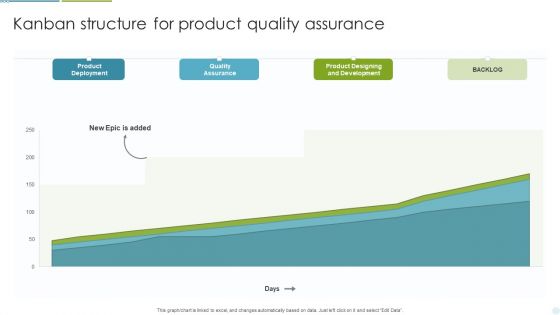
Kanban Structure For Product Quality Assurance Ppt Portfolio Deck PDF
This graph or chart is linked to excel, and changes automatically based on data. Just left click on it and select Edit Data. Pitch your topic with ease and precision using this Kanban Structure For Product Quality Assurance Ppt Portfolio Deck PDF. This layout presents information on Product Deployment, Quality Assurance, Product, Designing And Development. It is also available for immediate download and adjustment. So, changes can be made in the color, design, graphics or any other component to create a unique layout.
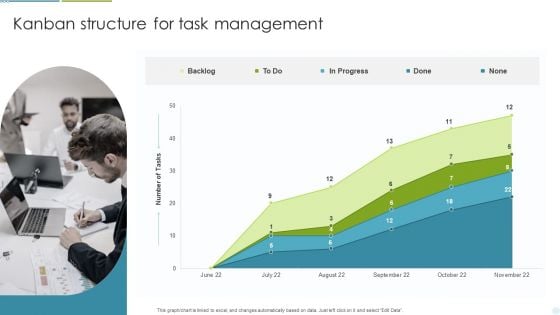
Kanban Structure For Task Management Ppt Summary Information PDF
This graph or chart is linked to excel, and changes automatically based on data. Just left click on it and select Edit Data. Showcasing this set of slides titled Kanban Structure For Task Management Ppt Summary Information PDF. The topics addressed in these templates are Backlog, In Progress, New Epic Added. All the content presented in this PPT design is completely editable. Download it and make adjustments in color, background, font etc. as per your unique business setting.
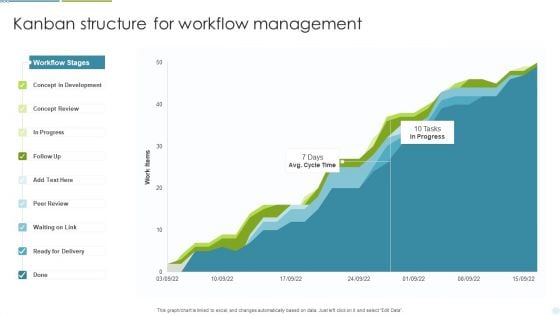
Kanban Structure For Workflow Management Ppt Inspiration Template PDF
This graph or chart is linked to excel, and changes automatically based on data. Just left click on it and select Edit Data. Pitch your topic with ease and precision using this Kanban Structure For Workflow Management Ppt Inspiration Template PDF. This layout presents information on Concept Development, Concept Review, Ready For Delivery. It is also available for immediate download and adjustment. So, changes can be made in the color, design, graphics or any other component to create a unique layout.
Kanban Structure For Yearly Project Progress Tracking Ppt File Example Introduction PDF
This graph or chart is linked to excel, and changes automatically based on data. Just left click on it and select Edit Data. Showcasing this set of slides titled Kanban Structure For Yearly Project Progress Tracking Ppt File Example Introduction PDF. The topics addressed in these templates are Number Projects, Backlog Approved, Final Review. All the content presented in this PPT design is completely editable. Download it and make adjustments in color, background, font etc. as per your unique business setting.
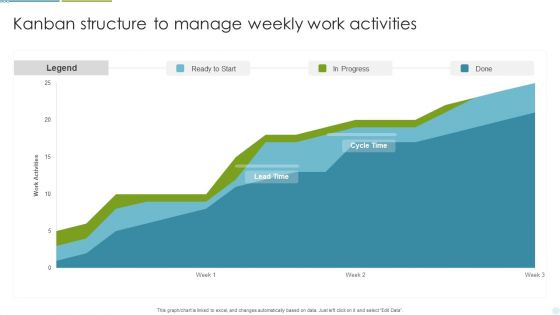
Kanban Structure To Manage Weekly Work Activities Ppt Professional Aids PDF
This graph or chart is linked to excel, and changes automatically based on data. Just left click on it and select Edit Data. Pitch your topic with ease and precision using this Kanban Structure To Manage Weekly Work Activities Ppt Professional Aids PDF. This layout presents information on Legend, Ready To Start, In Progress. It is also available for immediate download and adjustment. So, changes can be made in the color, design, graphics or any other component to create a unique layout.
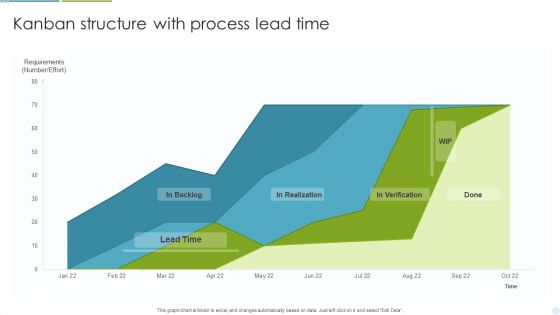
Kanban Structure With Process Lead Time Ppt Gallery Template PDF
This graph or chart is linked to excel, and changes automatically based on data. Just left click on it and select Edit Data. Showcasing this set of slides titled Kanban Structure With Process Lead Time Ppt Gallery Template PDF. The topics addressed in these templates are Lead Time, In Realization, Requirements. All the content presented in this PPT design is completely editable. Download it and make adjustments in color, background, font etc. as per your unique business setting.
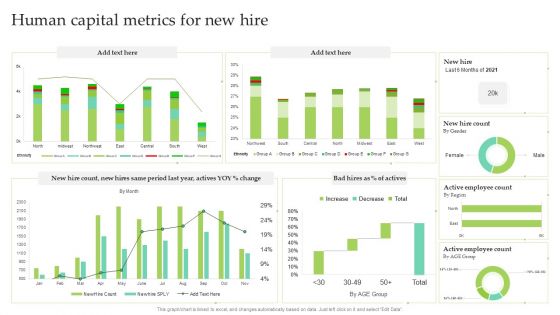
Human Capital Metrics For New Hire Ppt Pictures Brochure PDF
This graph or chart is linked to excel, and changes automatically based on data. Just left click on it and select Edit Data. Pitch your topic with ease and precision using this Human Capital Metrics For New Hire Ppt Pictures Brochure PDF. This layout presents information on Active Employee Count, New Hire Count, New Hire. It is also available for immediate download and adjustment. So, changes can be made in the color, design, graphics or any other component to create a unique layout.
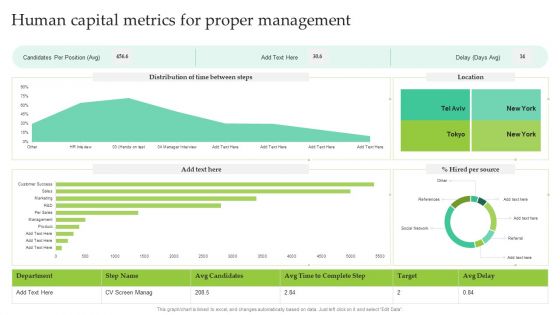
Human Capital Metrics For Proper Management Ppt Show Inspiration PDF
This graph or chart is linked to excel, and changes automatically based on data. Just left click on it and select Edit Data. Showcasing this set of slides titled Human Capital Metrics For Proper Management Ppt Show Inspiration PDF. The topics addressed in these templates are Candidates Per Position, Hired Per Source, Location. All the content presented in this PPT design is completely editable. Download it and make adjustments in color, background, font etc. as per your unique business setting.
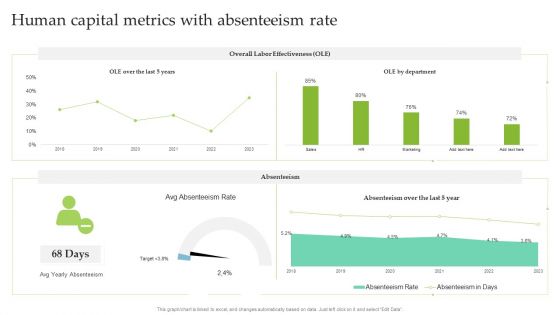
Human Capital Metrics With Absenteeism Rate Ppt Infographic Template Ideas PDF
This graph or chart is linked to excel, and changes automatically based on data. Just left click on it and select Edit Data. Pitch your topic with ease and precision using this Human Capital Metrics With Absenteeism Rate Ppt Infographic Template Ideas PDF. This layout presents information on Overall Labor Effectiveness, OLE Department, Absenteeism. It is also available for immediate download and adjustment. So, changes can be made in the color, design, graphics or any other component to create a unique layout.
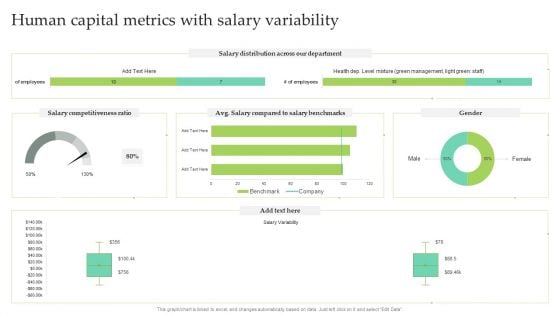
Human Capital Metrics With Salary Variability Ppt Infographic Template Designs PDF
This graph or chart is linked to excel, and changes automatically based on data. Just left click on it and select Edit Data. Pitch your topic with ease and precision using this Human Capital Metrics With Salary Variability Ppt Infographic Template Designs PDF. This layout presents information on Salary Distribution, Salary Competitiveness Ratio, Male. It is also available for immediate download and adjustment. So, changes can be made in the color, design, graphics or any other component to create a unique layout.
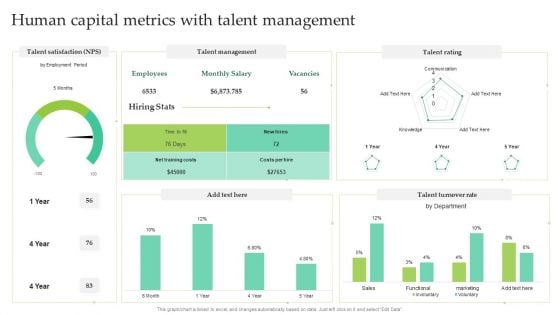
Human Capital Metrics With Talent Management Ppt Layouts Mockup PDF
This graph or chart is linked to excel, and changes automatically based on data. Just left click on it and select Edit Data. Showcasing this set of slides titled Human Capital Metrics With Talent Management Ppt Layouts Mockup PDF. The topics addressed in these templates are Talent Management, Talent Rating, Talent Turnover Rate. All the content presented in this PPT design is completely editable. Download it and make adjustments in color, background, font etc. as per your unique business setting.
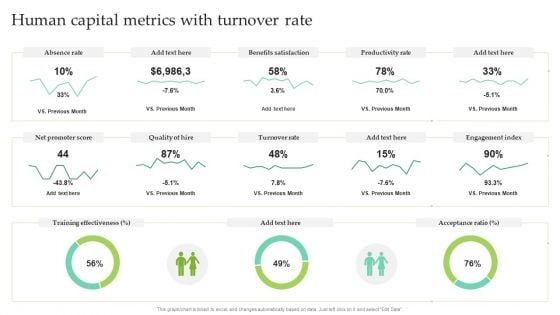
Human Capital Metrics With Turnover Rate Ppt Pictures Outline PDF
This graph or chart is linked to excel, and changes automatically based on data. Just left click on it and select Edit Data. Pitch your topic with ease and precision using this Human Capital Metrics With Turnover Rate Ppt Pictures Outline PDF. This layout presents information on Absence Rate, Benefits Satisfaction, Productivity Rate. It is also available for immediate download and adjustment. So, changes can be made in the color, design, graphics or any other component to create a unique layout.
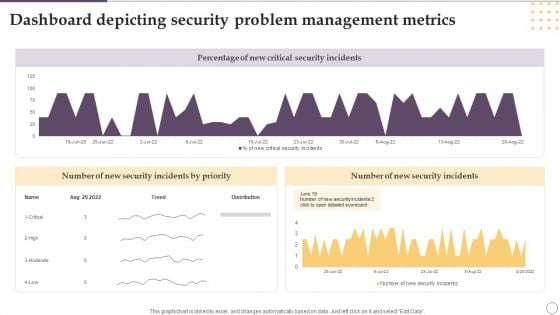
Dashboard Depicting Security Problem Management Metrics Ppt Gallery Designs PDF
This graph or chart is linked to excel, and changes automatically based on data. Just left click on it and select Edit Data. Showcasing this set of slides titled Dashboard Depicting Security Problem Management Metrics Ppt Gallery Designs PDF. The topics addressed in these templates are Percentage, New Critical, Security Incidents. All the content presented in this PPT design is completely editable. Download it and make adjustments in color, background, font etc. as per your unique business setting.
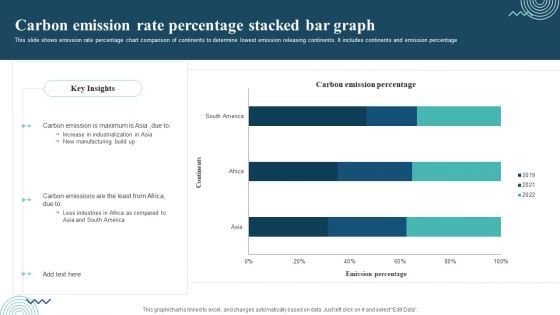
Carbon Emission Rate Percentage Stacked Bar Graph Rules PDF
This slide shows emission rate percentage chart comparison of continents to determine lowest emission releasing continents. It includes continents and emission percentage Showcasing this set of slides titled Carbon Emission Rate Percentage Stacked Bar Graph Rules PDF. The topics addressed in these templates are Carbon Emission, Increase In Industrialization, New Manufacturing. All the content presented in this PPT design is completely editable. Download it and make adjustments in color, background, font etc. as per your unique business setting.

Carbon Emissions Of Countries Bar Graph Professional PDF
This slide depicts emissions chart of various countries to avoid the worst impacts of climate change. It includes countries and carbon emissions in million metric tons. Pitch your topic with ease and precision using this Carbon Emissions Of Countries Bar Graph Professional PDF. This layout presents information on Maximum Production, Consumer Goods, Carbon Emissions. It is also available for immediate download and adjustment. So, changes can be made in the color, design, graphics or any other component to create a unique layout.
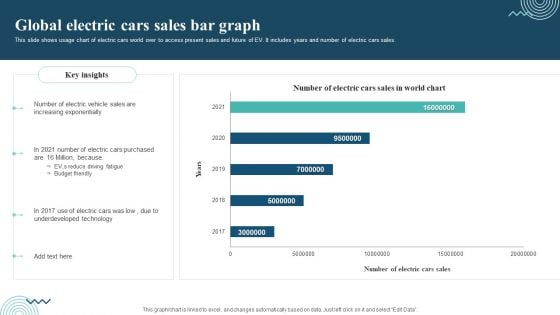
Global Electric Cars Sales Bar Graph Graphics PDF
This slide shows usage chart of electric cars world over to access present sales and future of EV. It includes years and number of electric cars sales. Showcasing this set of slides titled Global Electric Cars Sales Bar Graph Graphics PDF. The topics addressed in these templates are Electric Vehicle Sales, Electric Cars Purchased, Underdeveloped Technology. All the content presented in this PPT design is completely editable. Download it and make adjustments in color, background, font etc. as per your unique business setting.
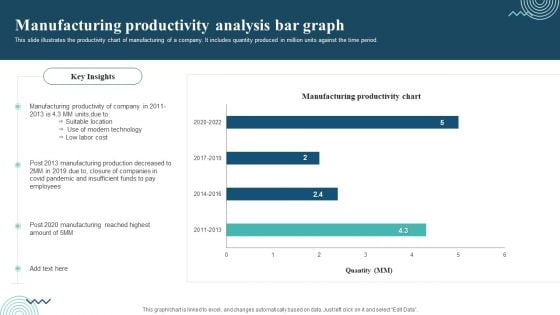
Manufacturing Productivity Analysis Bar Graph Introduction PDF
This slide illustrates the productivity chart of manufacturing of a company. It includes quantity produced in million units against the time period. Pitch your topic with ease and precision using this Manufacturing Productivity Analysis Bar Graph Introduction PDF. This layout presents information on Manufacturing Productivity, Production Decreased, Closure Of Companies. It is also available for immediate download and adjustment. So, changes can be made in the color, design, graphics or any other component to create a unique layout.
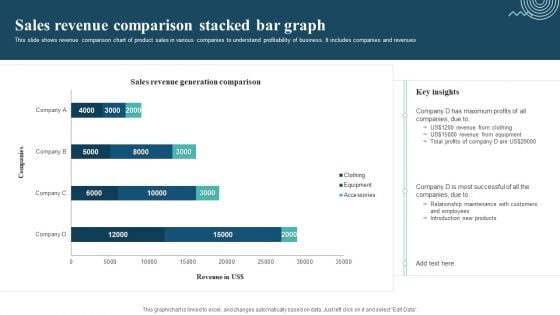
Sales Revenue Comparison Stacked Bar Graph Mockup PDF
This slide shows revenue comparison chart of product sales in various companies to understand profitability of business. It includes companies and revenues. Showcasing this set of slides titled Sales Revenue Comparison Stacked Bar Graph Mockup PDF. The topics addressed in these templates are Sales Revenue Comparison, Revenue From Clothing, Revenue From Equipment. All the content presented in this PPT design is completely editable. Download it and make adjustments in color, background, font etc. as per your unique business setting.
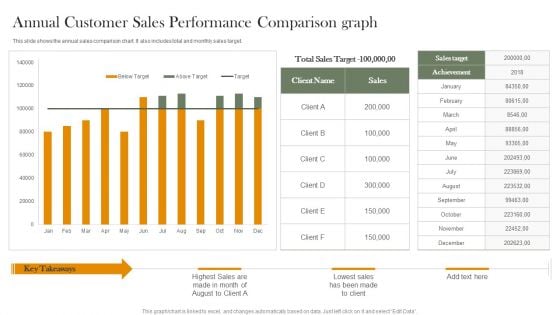
Annual Customer Sales Performance Comparison Graph Portrait PDF
This slide shows the annual sales comparison chart. It also includes total and monthly sales target. Pitch your topic with ease and precision using this Annual Customer Sales Performance Comparison Graph Portrait PDF. This layout presents information on Total Sales Target, Sales Target, Achievement. It is also available for immediate download and adjustment. So, changes can be made in the color, design, graphics or any other component to create a unique layout.
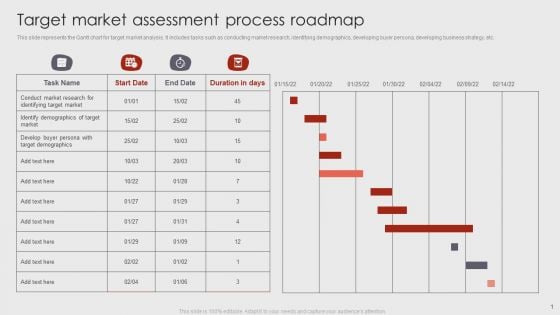
Target Market Assessment Process Roadmap Demonstration PDF
This slide represents the Gantt chart for target market analysis. It includes tasks such as conducting market research, identifying demographics, developing buyer persona, developing business strategy, etc. Showcasing this set of slides titled Target Market Assessment Process Roadmap Demonstration PDF. The topics addressed in these templates are Develop, Target Demographics, Target Market. All the content presented in this PPT design is completely editable. Download it and make adjustments in color, background, font etc. as per your unique business setting.
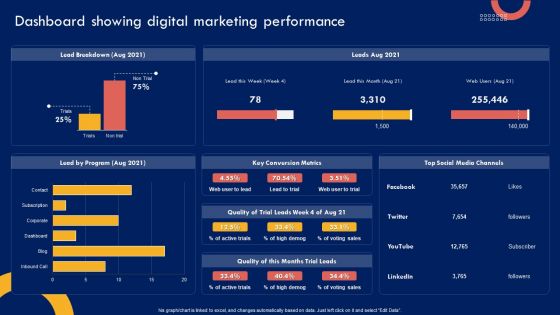
Product Marketing Leadership Dashboard Showing Digital Marketing Performance Download PDF
This graph OR chart is linked to excel, and changes automatically based on data. Just left click on it and select Edit Data. There are so many reasons you need a Product Marketing Leadership Dashboard Showing Digital Marketing Performance Download PDF. The first reason is you cant spend time making everything from scratch, Thus, Slidegeeks has made presentation templates for you too. You can easily download these templates from our website easily.
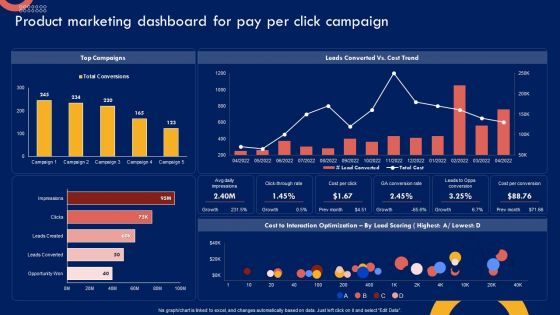
Product Marketing Leadership Product Marketing Dashboard For Pay Per Microsoft PDF
This graph or chart is linked to excel, and changes automatically based on data. Just left click on it and select Edit Data. Find a pre-designed and impeccable Product Marketing Leadership Product Marketing Dashboard For Pay Per Microsoft PDF. The templates can ace your presentation without additional effort. You can download these easy-to-edit presentation templates to make your presentation stand out from others. So, what are you waiting for Download the template from Slidegeeks today and give a unique touch to your presentation.
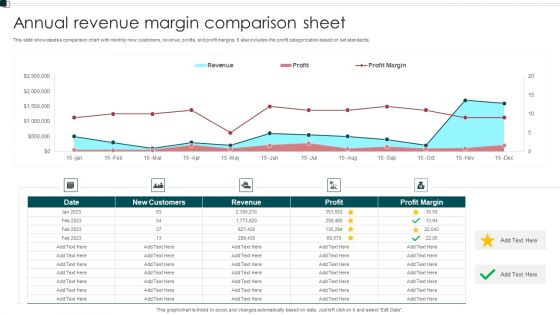
Annual Revenue Margin Comparison Sheet Information PDF
This slide showcases a comparison chart with monthly new customers, revenue, profits, and profit margins. It also includes the profit categorization based on set standards. Showcasing this set of slides titled Annual Revenue Margin Comparison Sheet Information PDF. The topics addressed in these templates are Customers, Revenue, Profit Margin. All the content presented in this PPT design is completely editable. Download it and make adjustments in color, background, font etc. as per your unique business setting.
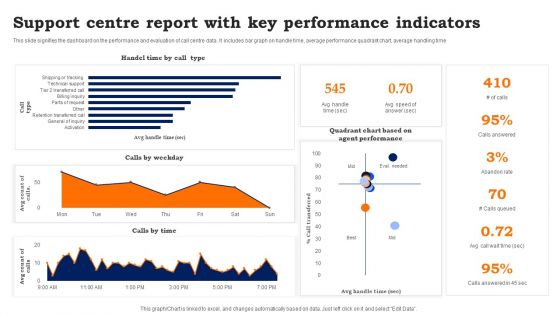
Support Centre Report With Key Performance Indicators Information PDF
This slide signifies the dashboard on the performance and evaluation of call centre data. It includes bar graph on handle time, average performance quadrant chart, average handling time. Showcasing this set of slides titled Support Centre Report With Key Performance Indicators Information PDF. The topics addressed in these templates are Support Centre Report, Key Performance Indicators. All the content presented in this PPT design is completely editable. Download it and make adjustments in color, background, font etc. as per your unique business setting.
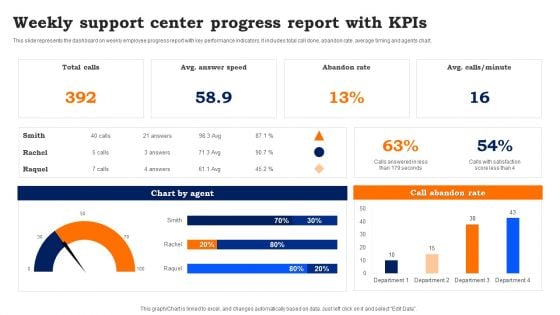
Weekly Support Center Progress Report With Kpis Template PDF
This slide represents the dashboard on weekly employee progress report with key performance indicators. It includes total call done, abandon rate, average timing and agents chart. Pitch your topic with ease and precision using this Weekly Support Center Progress Report With Kpis Template PDF. This layout presents information on Weekly Support, Center Progress Report. It is also available for immediate download and adjustment. So, changes can be made in the color, design, graphics or any other component to create a unique layout.
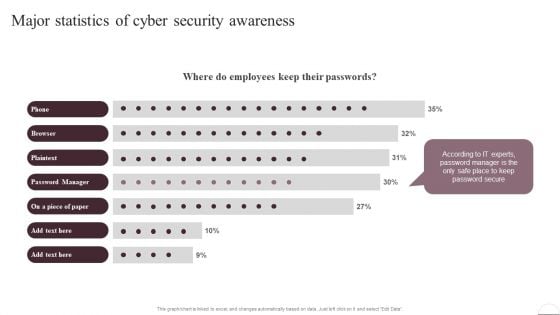
Prevention Of Information Major Statistics Of Cyber Security Awareness Pictures PDF
This graph or chart is linked to excel, and changes automatically based on data. Just left click on it and select Edit Data. There are so many reasons you need a Prevention Of Information Major Statistics Of Cyber Security Awareness Pictures PDF. The first reason is you cant spend time making everything from scratch, Thus, Slidegeeks has made presentation templates for you too. You can easily download these templates from our website easily.
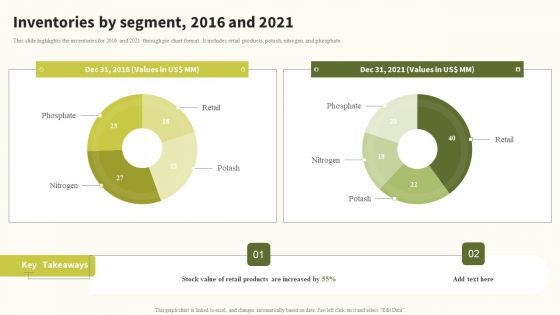
Inventories By Segment 2016 And 2021 Global Food Products Company Profile Summary PDF
This slide highlights the inventories for 2016 and 2021 through pie chart format. It includes retail products, potash, nitrogen, and phosphateFind a pre-designed and impeccable Inventories By Segment 2016 And 2021 Global Food Products Company Profile Summary PDF. The templates can ace your presentation without additional effort. You can download these easy-to-edit presentation templates to make your presentation stand out from others. So, what are you waiting for Download the template from Slidegeeks today and give a unique touch to your presentation.
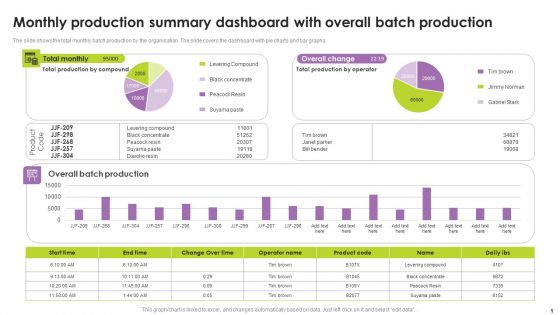
Monthly Production Summary Dashboard With Overall Batch Production Portrait PDF
The slide shows the total monthly batch production by the organisation. The slide covers the dashboard with pie charts and bar graphs. Showcasing this set of slides titled Monthly Production Summary Dashboard With Overall Batch Production Portrait PDF. The topics addressed in these templates are Monthly Production Summary Dashboard, Overall Batch Production. All the content presented in this PPT design is completely editable. Download it and make adjustments in color, background, font etc. as per your unique business setting.
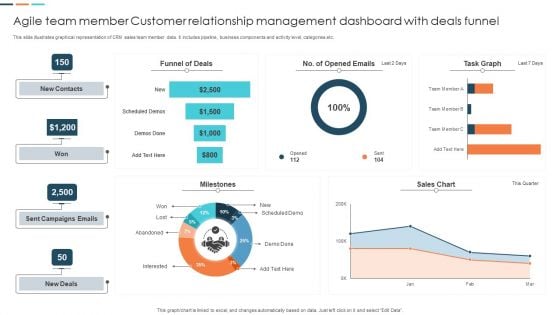
Agile Team Member Customer Relationship Management Dashboard With Deals Funnel Mockup PDF
This slide illustrates graphical representation of CRM sales team member data. It includes pipeline, business components and activity level, categories etc. Pitch your topic with ease and precision using this Agile Team Member Customer Relationship Management Dashboard With Deals Funnel Mockup PDF. This layout presents information on Funnel Of Deals, Sent Campaigns Emails, Sales Chart. It is also available for immediate download and adjustment. So, changes can be made in the color, design, graphics or any other component to create a unique layout.
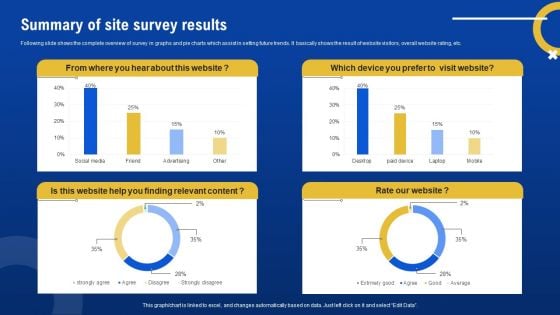
Summary Of Site Survey Results Survey SS
Following slide shows the complete overview of survey in graphs and pie charts which assist in setting future trends. It basically shows the result of website visitors, overall website rating, etc. Showcasing this set of slides titled Summary Of Site Survey Results Survey SS. The topics addressed in these templates are Summary, Site Survey Results. All the content presented in this PPT design is completely editable. Download it and make adjustments in color, background, font etc. as per your unique business setting.
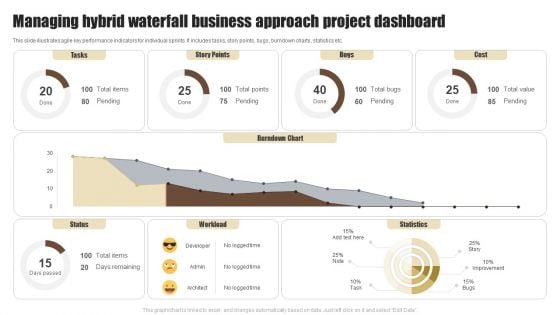
Managing Hybrid Waterfall Business Approach Project Dashboard Summary PDF
This slide illustrates agile key performance indicators for individual sprints. It includes tasks, story points, bugs, burndown charts, statistics etc. Showcasing this set of slides titled Managing Hybrid Waterfall Business Approach Project Dashboard Summary PDF. The topics addressed in these templates are Tasks, Story Points, Bugs. All the content presented in this PPT design is completely editable. Download it and make adjustments in color, background, font etc. as per your unique business setting.
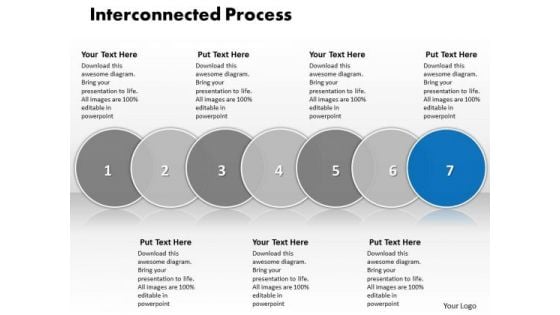
Ppt Interconnected Seven Stages Of Writing Process PowerPoint Presentation Templates
PPT interconnected seven stages of writing process powerpoint presentation Templates-This diagram is a graphical illustration of the relationships between and among sets of data, groups of objects that share something in common. This diagram is made up of overlapping circles that show all possible logical relations. Deliver amazing presentations to mesmerize your audience.-PPT interconnected seven stages of writing process powerpoint presentation Templates-3, Advice, Analysis, Analyze, Answer, Area, Career, Chart, Choice, Circles, Concept, Determination, Diagram, Graph, Idea, Illustration, Intersect, Measurement, Opportunities, Options, Overlap, Overlapped, Overlapping, Passion, Passionate, Prioritize, Priority, Profession Target your audience with our Ppt Interconnected Seven Stages Of Writing Process PowerPoint Presentation Templates. Download without worries with our money back guaranteee.
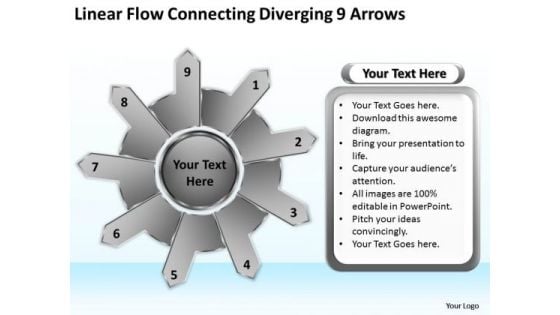
Linear Flow Connecting Diverging 9 Arrows Gear Process PowerPoint Templates
We present our linear flow connecting diverging 9 arrows Gear Process PowerPoint templates.Use our Arrows PowerPoint Templates because this diagram depicts the essence of this chain reaction like sequence of events. Present our Success PowerPoint Templates because iT outlines the entire thought process for the benefit of others. Tell it to the world with your characteristic aplomb. Download and present our Signs PowerPoint Templates because you can gain the success to desired levels in one go. Download our Shapes PowerPoint Templates because you should take your team soaring to the pinnacle they crave. Download our Process and Flows PowerPoint Templates because you can come forth with the plans you have so carefully laid out.Use these PowerPoint slides for presentations relating to Abstract, arrow, brochure, business,button, chart, circle, company, cyclic,data, demonstration, diagram,economic, financial, glossy, goal, graph,illustration, info, information, investment,manage, marketing, model, navigation,option, part, pie, presentation, process,result, section, segmented, sharing,sphere. The prominent colors used in the PowerPoint template are Gray, Black, White. People tell us our linear flow connecting diverging 9 arrows Gear Process PowerPoint templates are Enchanting. Customers tell us our business PowerPoint templates and PPT Slides are Stunning. Professionals tell us our linear flow connecting diverging 9 arrows Gear Process PowerPoint templates are Glamorous. Presenters tell us our business PowerPoint templates and PPT Slides are Wistful. Use our linear flow connecting diverging 9 arrows Gear Process PowerPoint templates are Tranquil. Presenters tell us our button PowerPoint templates and PPT Slides will help you be quick off the draw. Just enter your specific text and see your points hit home. Benefit from diverse contributions with our Linear Flow Connecting Diverging 9 Arrows Gear Process PowerPoint Templates. They contain the best from all around.

Idea Symbol In Box Business PowerPoint Templates And PowerPoint Themes 0712
Idea Symbol In Box Business PowerPoint Templates And PowerPoint Themes 0712-Microsoft Powerpoint Templates and Background with cardboard box with idea symbol Get the largest value at the lowest price with our Idea Symbol In Box Business PowerPoint Templates And PowerPoint Themes 0712. Dont waste time struggling with PowerPoint. Let us do it for you.
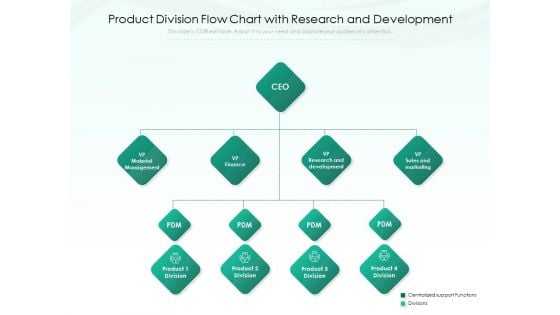
Product Division Flow Chart With Research And Development Ppt PowerPoint Presentation File Design Inspiration PDF
Persuade your audience using this product division flow chart with research and development ppt powerpoint presentation file design inspiration pdf. This PPT design covers two stages, thus making it a great tool to use. It also caters to a variety of topics including finance, management, development. Download this PPT design now to present a convincing pitch that not only emphasizes the topic but also showcases your presentation skills.
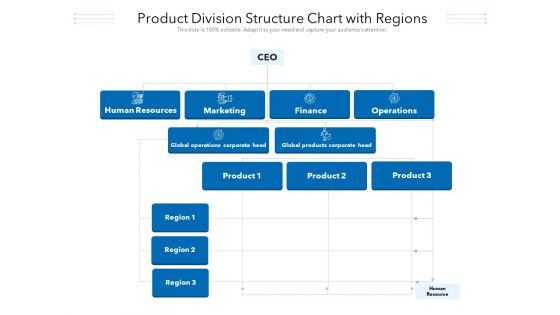
Product Division Structure Chart With Regions Ppt PowerPoint Presentation File Infographic Template PDF
Persuade your audience using this product division structure chart with regions ppt powerpoint presentation file infographic template pdf. This PPT design covers three stages, thus making it a great tool to use. It also caters to a variety of topics including marketing, finance, operations. Download this PPT design now to present a convincing pitch that not only emphasizes the topic but also showcases your presentation skills.
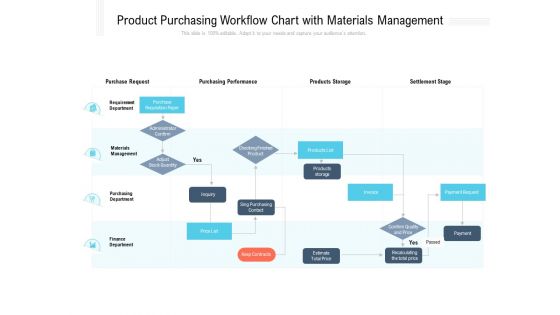
Product Purchasing Workflow Chart With Materials Management Ppt PowerPoint Presentation File Master Slide PDF
Persuade your audience using this product purchasing workflow chart with materials management ppt powerpoint presentation file master slide pdf. This PPT design covers four stages, thus making it a great tool to use. It also caters to a variety of topics including finance, management, department. Download this PPT design now to present a convincing pitch that not only emphasizes the topic but also showcases your presentation skills.
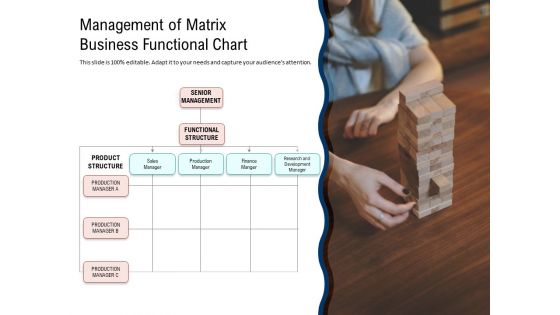
Management Of Matrix Business Functional Chart Ppt PowerPoint Presentation Show Visual Aids PDF
Pitch your topic with ease and precision using this management of matrix business functional chart ppt powerpoint presentation show visual aids pdf. This layout presents information on finance manger, production manager, sales manager, functional structure, product structure. It is also available for immediate download and adjustment. So, changes can be made in the color, design, graphics or any other component to create a unique layout.
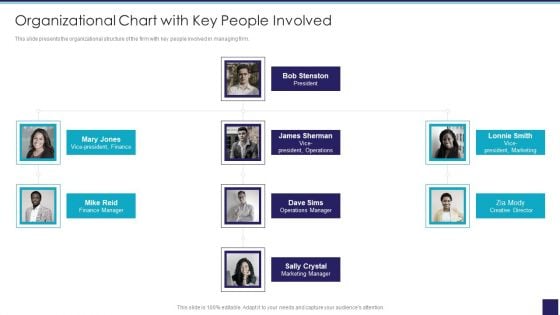
Organizational Issue Resolution Tool Organizational Chart With Key People Involved Graphics PDF
This slide presents the organizational structure of the firm with key people involved in managing firm. Presenting Organizational Issue Resolution Tool Organizational Chart With Key People Involved Graphics PDF to provide visual cues and insights. Share and navigate important information on one stage that need your due attention. This template can be used to pitch topics like Finance Manager, President, Marketing, Operations Manager. In addtion, this PPT design contains high resolution images, graphics, etc, that are easily editable and available for immediate download.

Positive Impact Of New Team Performance Management System Building Efficient Template PDF
This slide illustrates learning and development programs for various teams. It provides information about communication, spreadsheet management, task management, reporting, finance, trading, analytics, dashboard, email writing, etc.This modern and well-arranged Positive Impact Of New Team Performance Management System Building Efficient Template PDF provides lots of creative possibilities. It is very simple to customize and edit with the Powerpoint Software. Just drag and drop your pictures into the shapes. All facets of this template can be edited with Powerpoint no extra software is necessary. Add your own material, put your images in the places assigned for them, adjust the colors, and then you can show your slides to the world, with an animated slide included.
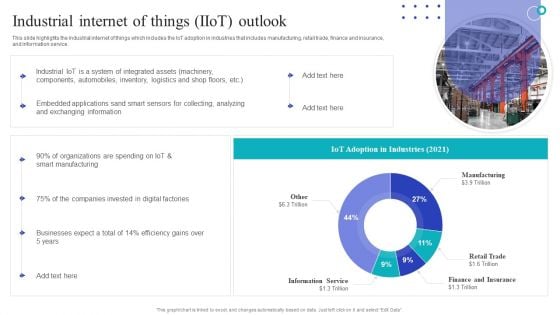
Global Internet Of Things In Manufacturing Industrial Internet Of Things Iiot Outlook Designs PDF
This slide highlights the industrial internet of things which includes the IoT adoption in industries that includes manufacturing, retail trade, finance and insurance, and information service. Slidegeeks is here to make your presentations a breeze with Global Internet Of Things In Manufacturing Industrial Internet Of Things Iiot Outlook Designs PDF With our easy-to-use and customizable templates, you can focus on delivering your ideas rather than worrying about formatting. With a variety of designs to choose from, youre sure to find one that suits your needs. And with animations and unique photos, illustrations, and fonts, you can make your presentation pop. So whether youre giving a sales pitch or presenting to the board, make sure to check out Slidegeeks first.
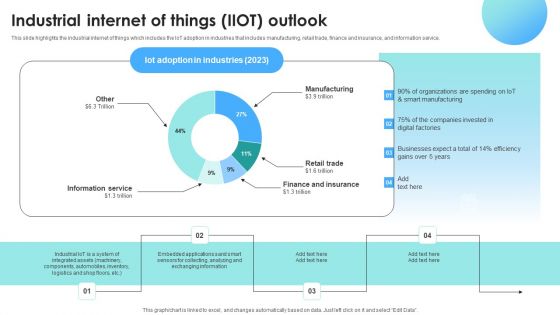
IOT Use Cases For Manufacturing Industrial Internet Of Things IIOT Outlook Graphics PDF
This slide highlights the industrial internet of things which includes the IoT adoption in industries that includes manufacturing, retail trade, finance and insurance, and information service. Slidegeeks is here to make your presentations a breeze with IOT Use Cases For Manufacturing Industrial Internet Of Things IIOT Outlook Graphics PDF With our easy to use and customizable templates, you can focus on delivering your ideas rather than worrying about formatting. With a variety of designs to choose from, you are sure to find one that suits your needs. And with animations and unique photos, illustrations, and fonts, you can make your presentation pop. So whether you are giving a sales pitch or presenting to the board, make sure to check out Slidegeeks first.
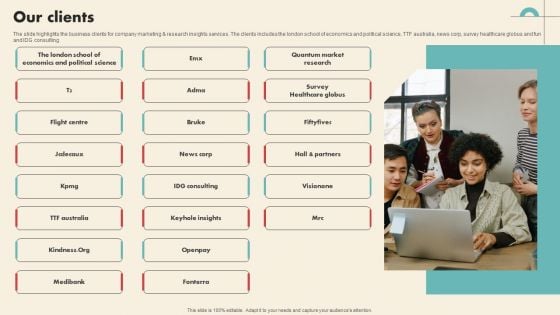
Data Driven Marketing Solutions Firm Company Profile Our Clients Themes PDF
The slide highlights the business clients for company marketing and research insights services. The clients includes the london school of economics and political science, TTF australia, news corp, survey healthcare globus and fun and IDG consulting Retrieve professionally designed Data Driven Marketing Solutions Firm Company Profile Our Clients Themes PDF to effectively convey your message and captivate your listeners. Save time by selecting pre made slideshows that are appropriate for various topics, from business to educational purposes. These themes come in many different styles, from creative to corporate, and all of them are easily adjustable and can be edited quickly. Access them as PowerPoint templates or as Google Slides themes. You do not have to go on a hunt for the perfect presentation because Slidegeeks got you covered from everywhere.
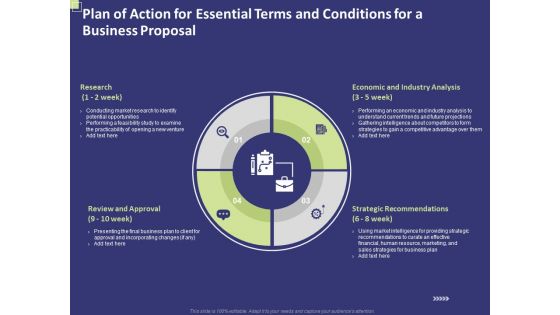
Plan Of Action For Essential Terms And Conditions For A Business Proposal Ppt PowerPoint Presentation Visual Aids Diagrams PDF
Presenting plan of action for essential terms and conditions for a business proposal ppt powerpoint presentation visual aids diagrams pdf to provide visual cues and insights. Share and navigate important information on four stages that need your due attention. This template can be used to pitch topics like research, economic and industry analysis, strategic recommendations, review and approval. In addition, this PPT design contains high-resolution images, graphics, etc, that are easily editable and available for immediate download.
Business Diagram Pros And Cons For Strategy And Business Presentation Template
This business slide displays hanging films for pros and cons. Use this professional slide, in your presentations to depict pros and cons of business strategy. This diagram will bring the depth of your knowledge to the fore.
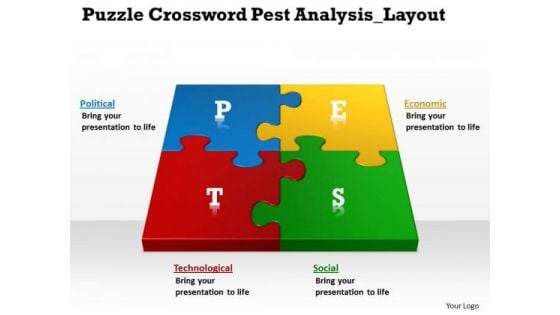
Puzzle Crossword Pest Analysis Layout Circular Flow Diagram PowerPoint Templates
We present our puzzle crossword pest analysis layout Circular Flow Diagram PowerPoint templates.Download and present our Puzzles or Jigsaws PowerPoint Templates because colours generate instant reactions in our brains. Download our Business PowerPoint Templates because it illustrates the city with a lasting tryst with resilience. You epitomise the qualities that give your city its fame. Present our Marketing PowerPoint Templates because networking is an imperative in todays world. You need to access the views of others. Similarly you need to give access to them of your abilities. Download our Shapes PowerPoint Templates because it helps to anticipate the doubts and questions in the minds of your colleagues and enlighten them with your inspired strategy to garner desired success. Use our Symbol PowerPoint Templates because you should go for Gold and not just silver.Use these PowerPoint slides for presentations relating to Analysis, Business, Chalk, Chalkboard, Chart, Component, Concept, Diagram, Direction, Economic, Education, Environmental, Factors, Framework, Graph, Graphics, Illustration, Law, Leadership, Management, Market, Research, Model, Operations, Pest, Political, Position, Potential, Research. The prominent colors used in the PowerPoint template are Blue, Yellow, Green. We assure you our puzzle crossword pest analysis layout Circular Flow Diagram PowerPoint templates are Breathtaking. Customers tell us our Concept PowerPoint templates and PPT Slides are Festive. The feedback we get is that our puzzle crossword pest analysis layout Circular Flow Diagram PowerPoint templates are Bright. We assure you our Concept PowerPoint templates and PPT Slides are Ritzy. People tell us our puzzle crossword pest analysis layout Circular Flow Diagram PowerPoint templates are Adorable. We assure you our Chalkboard PowerPoint templates and PPT Slides will generate and maintain the level of interest you desire. They will create the impression you want to imprint on your audience. Experience fantasy with our Puzzle Crossword Pest Analysis Layout Circular Flow Diagram PowerPoint Templates. Energise the creativity of your audience.
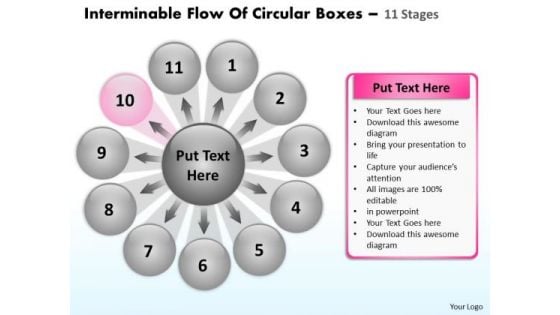
Interminable Flow Of Circular Boxes 11 Stages Ppt Process Diagram PowerPoint Slides
We present our interminable flow of circular boxes 11 stages ppt Process Diagram PowerPoint Slides.Use our Arrows PowerPoint Templates because you have the ideas to develop the teams vision of where they need to be in the future. Download and present our Business PowerPoint Templates because the great Bald headed Eagle embodies your personality. the eagle eye to seize upon the smallest of opportunities. Present our Signs PowerPoint Templates because the structure of our templates allows you to effectively highlight the key issues concerning the growth of your business. Present our Shapes PowerPoint Templates because the plans are in your head, stage by stage, year by year. Use our Spheres PowerPoint Templates because there are a bucketful of brilliant ideas swirling around within your group.Use these PowerPoint slides for presentations relating to Arrows, Business, Chart, Circular, Commerce, Concept, Contribution, Cycle, Development, Diagram, Global, Idea, Informative, Internet, Join, Making, Manage, Management, Market, Marketing, Partner, Paying, Performance, Plans, Process, Productive, Productivity, Profit, Profitable, Project. The prominent colors used in the PowerPoint template are Pink, Black, Gray. Professionals tell us our interminable flow of circular boxes 11 stages ppt Process Diagram PowerPoint Slides are Vintage. You can be sure our Commerce PowerPoint templates and PPT Slides are Nifty. Customers tell us our interminable flow of circular boxes 11 stages ppt Process Diagram PowerPoint Slides are Playful. Professionals tell us our Cycle PowerPoint templates and PPT Slides are the best it can get when it comes to presenting. People tell us our interminable flow of circular boxes 11 stages ppt Process Diagram PowerPoint Slides are Fashionable. People tell us our Development PowerPoint templates and PPT Slides are Dazzling. Bask in the attention our Interminable Flow Of Circular Boxes 11 Stages Ppt Process Diagram PowerPoint Slides attract. Their excellence will rub off on you.
Advantage Of Parallel Processing 6 Arrows Demonstration PowerPoint Slides
We present our advantage of parallel processing 6 arrows demonstration PowerPoint Slides.Present our Arrows PowerPoint Templates because Your ideas provide food for thought. Our PowerPoint Templates and Slides will help you create a dish to tickle the most discerning palate. Use our Business PowerPoint Templates because Our PowerPoint Templates and Slides will let you Leave a lasting impression to your audiences. They possess an inherent longstanding recall factor. Present our Success PowerPoint Templates because It is Aesthetically crafted by artistic young minds. Our PowerPoint Templates and Slides are designed to display your dexterity. Present our Shapes PowerPoint Templates because You should Kick up a storm with our PowerPoint Templates and Slides. The heads of your listeners will swirl with your ideas. Use our Symbol PowerPoint Templates because Our PowerPoint Templates and Slides are topically designed to provide an attractive backdrop to any subject.Use these PowerPoint slides for presentations relating to accounting, arrow, ascending, background, bank, blue, business, charts, compare, comparison, computer, corporate, count, descending, fame, famous, finance, generated, gradient, grow, growth, illustration, income, international, linear, money, papers, parallel, percentage, point, record, scale, shares, signs, stock, success, symbols, tax, tip, vary, white, world. The prominent colors used in the PowerPoint template are Purple, Gray, White. You can be sure our advantage of parallel processing 6 arrows demonstration PowerPoint Slides help you meet deadlines which are an element of today's workplace. Just browse and pick the slides that appeal to your intuitive senses. People tell us our compare PowerPoint templates and PPT Slides will make you look like a winner. You can be sure our advantage of parallel processing 6 arrows demonstration PowerPoint Slides are second to none. Use our blue PowerPoint templates and PPT Slides are topically designed to provide an attractive backdrop to any subject. Presenters tell us our advantage of parallel processing 6 arrows demonstration PowerPoint Slides will save the presenter time. We assure you our bank PowerPoint templates and PPT Slides will help them to explain complicated concepts. Question doubts with our Advantage Of Parallel Processing 6 Arrows Demonstration PowerPoint Slides. Download without worries with our money back guaranteee.
Advantage Of Parallel Processing 6 Arrows Demonstration Ppt PowerPoint Slides
We present our advantage of parallel processing 6 arrows demonstration ppt PowerPoint Slides.Download our Arrows PowerPoint Templates because Our PowerPoint Templates and Slides will let you Leave a lasting impression to your audiences. They possess an inherent longstanding recall factor. Download our Business PowerPoint Templates because You should Throw the gauntlet with our PowerPoint Templates and Slides. They are created to take up any challenge. Use our Success PowerPoint Templates because You have belief amd faith in your futuristic plans. Chalk them out for your team with our PowerPoint Templates and Slides. Download and present our Shapes PowerPoint Templates because Our PowerPoint Templates and Slides are created by a hardworking bunch of busybees. Always flitting around with solutions gauranteed to please. Download and present our Symbol PowerPoint Templates because Our PowerPoint Templates and Slides are endowed to endure. Ideas conveyed through them will pass the test of time.Use these PowerPoint slides for presentations relating to accounting, arrow, ascending, background, bank, blue, business, charts, compare, comparison, computer, corporate, count, descending, fame, famous, finance, generated, gradient, grow, growth, illustration, income, international, linear, money, papers, parallel, percentage, point, record, scale, shares, signs, stock, success, symbols, tax, tip, vary, white, world. The prominent colors used in the PowerPoint template are Pink, Gray, White. You can be sure our advantage of parallel processing 6 arrows demonstration ppt PowerPoint Slides provide great value for your money. Be assured of finding the best projection to highlight your words. People tell us our background PowerPoint templates and PPT Slides will help them to explain complicated concepts. You can be sure our advantage of parallel processing 6 arrows demonstration ppt PowerPoint Slides are topically designed to provide an attractive backdrop to any subject. Use our bank PowerPoint templates and PPT Slides are designed by professionals Presenters tell us our advantage of parallel processing 6 arrows demonstration ppt PowerPoint Slides have awesome images to get your point across. We assure you our blue PowerPoint templates and PPT Slides are the best it can get when it comes to presenting. Burst on to the scene with our Advantage Of Parallel Processing 6 Arrows Demonstration Ppt PowerPoint Slides. Set the stage ablaze with your ideas.
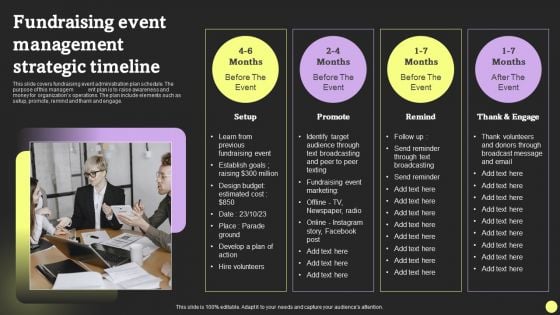
Fundraising Event Management Strategic Timeline Diagrams PDF
This slide covers fundraising event administration plan schedule. The purpose of this management plan is to raise awareness and money for organizations operations. The plan include elements such as setup, promote, remind and thank and engage. Persuade your audience using this Fundraising Event Management Strategic Timeline Diagrams PDF. This PPT design covers Four stages, thus making it a great tool to use. It also caters to a variety of topics including Setup, Promote, Remind, Thank And Engage. Download this PPT design now to present a convincing pitch that not only emphasizes the topic but also showcases your presentation skills.
Steady Way To Present Four Step Procedure Business Plan Flow Chart PowerPoint Templates
We present our steady way to present four step procedure business plan flow chart PowerPoint templates.Use our Arrows PowerPoint Templates because,It Highlights the results of you thought process and convinces your team of the reasons for selecting a particular path to follow. Use our Leadership PowerPoint Templates because,It demonstrates the seeds of many of our successes. Use our Business PowerPoint Templates because,You can Flutter your wings and enchant the world. Impress them with the innate attractiveness of your thoughts and words Use our Symbol PowerPoint Templates because,It have all to represent to your viewers. Use our Process and Flows PowerPoint Templates because, You can Refine them all as you take them through the numerous filtering stages of the funnel of your quality control process.Use these PowerPoint slides for presentations relating to Arrow, Arrows, Block, Business, Chart, Design, Development, Diagram, Direction, Element, Flow, Flowchart, Graph, Linear, Management, Organization, Process, Program, Section, Sign, Solution, Symbol. The prominent colors used in the PowerPoint template are Green, Gray, Black. People tell us our steady way to present four step procedure business plan flow chart PowerPoint templates are Youthful. PowerPoint presentation experts tell us our Development PowerPoint templates and PPT Slides are Colorful. PowerPoint presentation experts tell us our steady way to present four step procedure business plan flow chart PowerPoint templates are Nice. Professionals tell us our Diagram PowerPoint templates and PPT Slides are Enchanting. Professionals tell us our steady way to present four step procedure business plan flow chart PowerPoint templates are Reminiscent. People tell us our Development PowerPoint templates and PPT Slides are Pretty. Lead teams with our Steady Way To Present Four Step Procedure Business Plan Flow Chart PowerPoint Templates. Download without worries with our money back guaranteee.
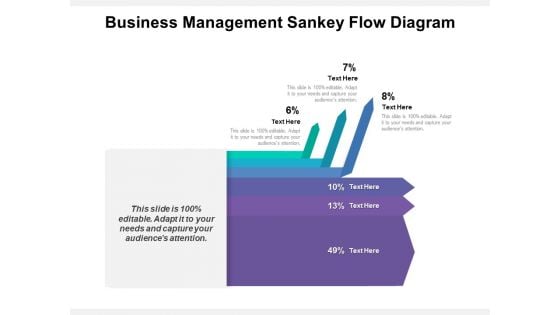
Business Management Sankey Flow Diagram Ppt PowerPoint Presentation Pictures Samples PDF
Presenting business management sankey flow diagram ppt powerpoint presentation pictures samples pdf to dispense important information. This template comprises three stages. It also presents valuable insights into the topics including business management sankey flow diagram. This is a completely customizable PowerPoint theme that can be put to use immediately. So, download it and address the topic impactfully.
Board Of Dreams Diagram For Earnings Growth Rate Ppt PowerPoint Presentation Gallery Layout PDF
Presenting board of dreams diagram for earnings growth rate ppt powerpoint presentation gallery layout pdf to dispense important information. This template comprises four stages. It also presents valuable insights into the topics including board of dreams diagram for earnings growth rate. This is a completely customizable PowerPoint theme that can be put to use immediately. So, download it and address the topic impactfully.
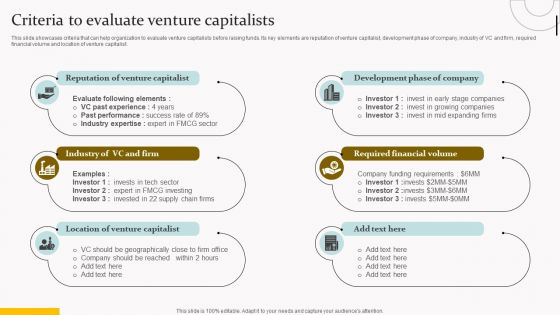
Capital Acquisition Strategy For Startup Business Criteria To Evaluate Venture Capitalists Template PDF
This slide showcases criteria that can help organization to evaluate venture capitalists before raising funds. Its key elements are reputation of venture capitalist, development phase of company, industry of VC and firm, required financial volume and location of venture capitalist. Do you have to make sure that everyone on your team knows about any specific topic I yes, then you should give Capital Acquisition Strategy For Startup Business Criteria To Evaluate Venture Capitalists Template PDF a try. Our experts have put a lot of knowledge and effort into creating this impeccable Capital Acquisition Strategy For Startup Business Criteria To Evaluate Venture Capitalists Template PDF. You can use this template for your upcoming presentations, as the slides are perfect to represent even the tiniest detail. You can download these templates from the Slidegeeks website and these are easy to edit. So grab these today.
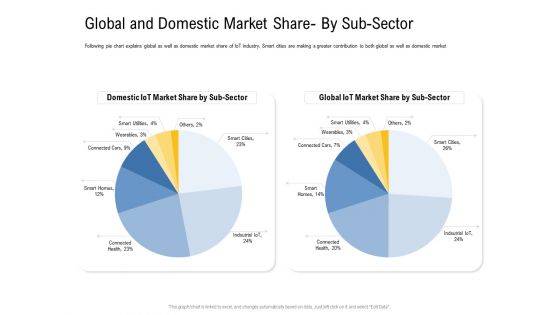
IOT Industry Assessment Global And Domestic Market Share By Sub Sector Ppt Layouts Graphics PDF
Following pie chart explains global as well as domestic market share of IoT industry. Smart cities are making a greater contribution to both global as well as domestic market. Deliver an awe inspiring pitch with this creative iot industry assessment global and domestic market share by sub sector ppt layouts graphics pdf bundle. Topics like global and domestic market share by sub sector can be discussed with this completely editable template. It is available for immediate download depending on the needs and requirements of the user.

Talent Acquisition And Recruitment Methods Used By Hiring Department Ppt PowerPoint Presentation Layouts Templates PDF
This graph or chart is linked to excel, and changes automatically based on data. Just left click on it and select Edit Data. Showcasing this set of slides titled talent acquisition and recruitment methods used by hiring department ppt powerpoint presentation layouts templates pdf. The topics addressed in these templates are other methods, paid software, job fairs, employee referrals, jobs boards, social networks. All the content presented in this PPT design is completely editable. Download it and make adjustments in color, background, font etc. as per your unique business setting.
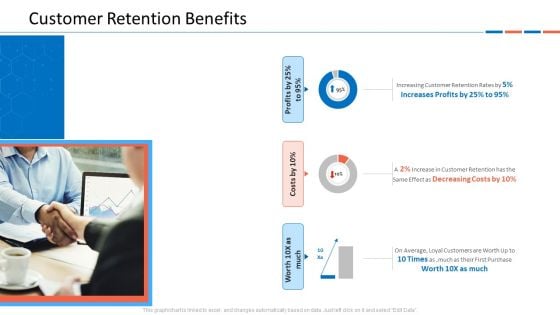
Customer Relationship Management Dashboard Customer Retention Benefits Inspiration PDF
This graph or chart is linked to excel, and changes automatically based on data. Just left click on it and select Edit Data.Deliver an awe inspiring pitch with this creative customer relationship management dashboard customer retention benefits inspiration pdf bundle. Topics like increasing customer retention rates, on average, loyal customers are worth up to 10 times as ,much as their first purchase, profits by 25percent to 95percent can be discussed with this completely editable template. It is available for immediate download depending on the needs and requirements of the user.
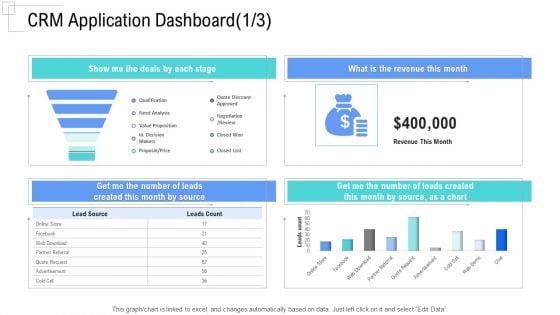
Managing Customer Experience CRM Application Dashboard Month Mockup PDF
This graph or chart is linked to excel, and changes automatically based on data. Just left click on it and select Edit Data.Deliver an awe-inspiring pitch with this creative managing customer experience crm application dashboard month mockup pdf bundle. Topics like show me the deals by each stage, what is the revenue this month, get me the number of leads created this month by source can be discussed with this completely editable template. It is available for immediate download depending on the needs and requirements of the user.

Managing Customer Experience CRM Data Analysis Sales Pictures PDF
This graph or chart is linked to excel, and changes automatically based on data. Just left click on it and select Edit Data.Deliver and pitch your topic in the best possible manner with this managing customer experience crm data analysis sales pictures pdf. Use them to share invaluable insights on entities by rep, completed activities l, biz notes this month, phone calls last 3 months, activity last 3 months and impress your audience. This template can be altered and modified as per your expectations. So, grab it now.

 Home
Home