Cost Icon
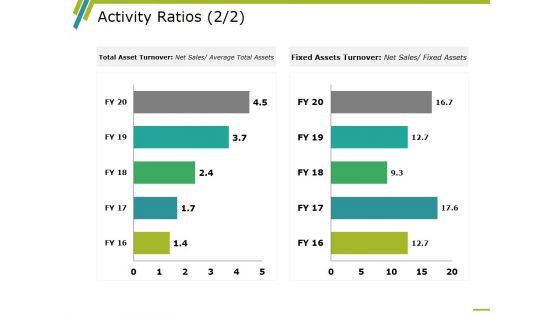
Activity Ratios Template 3 Ppt PowerPoint Presentation Professional Graphic Tips
This is a activity ratios template 3 ppt powerpoint presentation professional graphic tips. This is a two stage process. The stages in this process are business, finance, marketing, strategy, analysis.
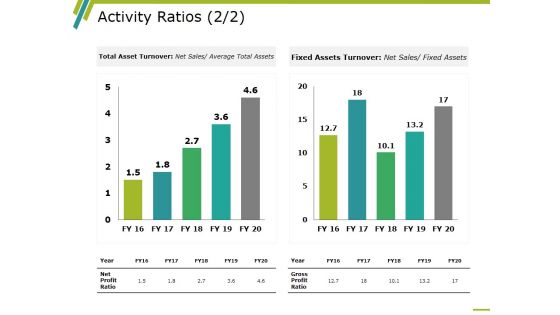
Activity Ratios Template 4 Ppt PowerPoint Presentation Gallery Slides
This is a activity ratios template 4 ppt powerpoint presentation gallery slides. This is a two stage process. The stages in this process are business, finance, marketing, strategy, analysis.
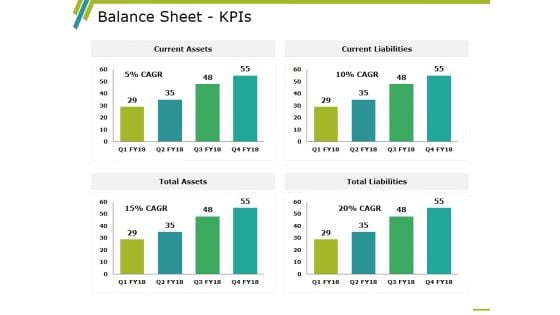
Balance Sheet Kpis Template 3 Ppt PowerPoint Presentation Infographic Template Demonstration
This is a balance sheet kpis template 3 ppt powerpoint presentation infographic template demonstration. This is a four stage process. The stages in this process are balance sheet, finance, marketing, strategy, analysis.
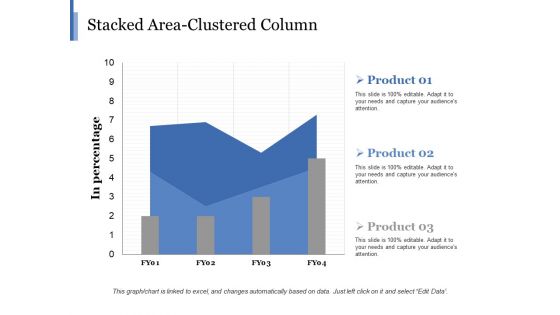
Stacked Area Clustered Column Ppt PowerPoint Presentation Show Elements
This is a stacked area clustered column ppt powerpoint presentation show elements. This is a three stage process. The stages in this process are business, in percentage, marketing, finance, graph.
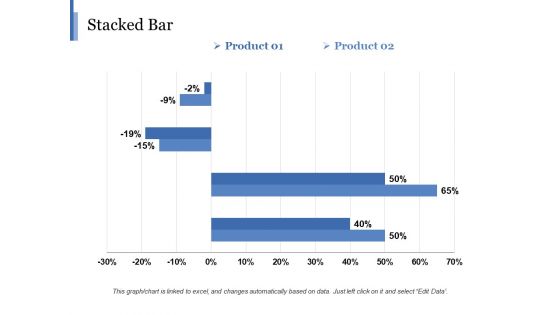
Stacked Bar Template 2 Ppt PowerPoint Presentation Gallery Background
This is a stacked bar template 2 ppt powerpoint presentation gallery background. This is a two stage process. The stages in this process are business, marketing, finance, graph, strategy, percentage.
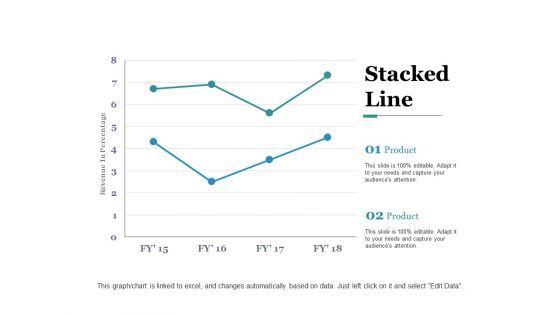
Stacked Line Ppt PowerPoint Presentation Professional Graphics Pictures
This is a stacked line ppt powerpoint presentation professional graphics pictures. This is a two stage process. The stages in this process are revenue in percentage, business, marketing, graph, finance.
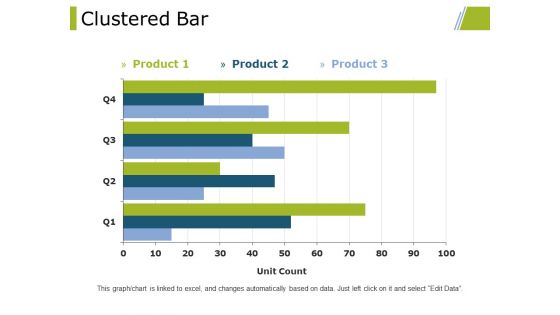
Clustered Bar Ppt PowerPoint Presentation Professional Designs Download
This is a clustered bar ppt powerpoint presentation professional designs download. This is a three stage process. The stages in this process are clustered bar, finance, marketing, strategy, business.
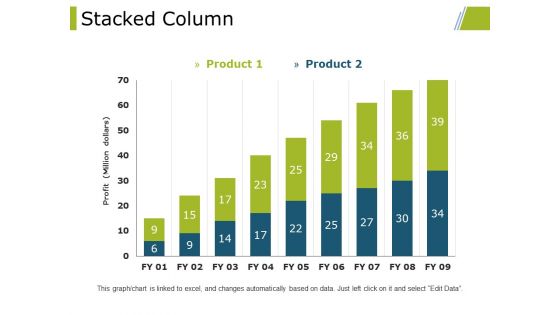
Stacked Column Ppt PowerPoint Presentation Styles Graphic Images
This is a stacked column ppt powerpoint presentation styles graphic images. This is a two stage process. The stages in this process are stacked column, finance, marketing, strategy, business.
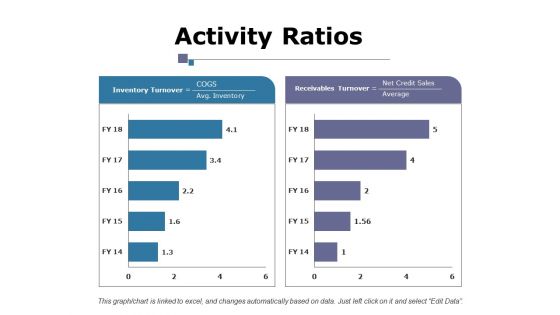
Activity Ratios Ppt PowerPoint Presentation Gallery Slide Portrait
This is a activity ratios ppt powerpoint presentation gallery slide portrait. This is a two stage process. The stages in this process are business, inventory turnover, receivables turnover, marketing, finance.
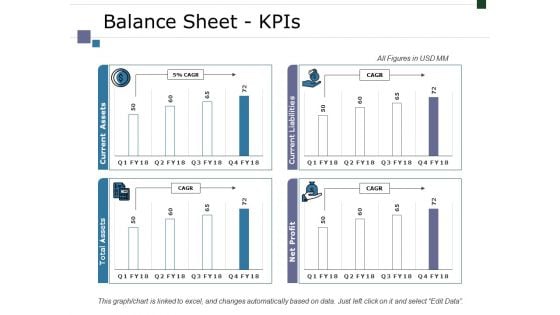
Balance Sheet Kpis Ppt PowerPoint Presentation Infographic Template Designs
This is a balance sheet kpis ppt powerpoint presentation infographic template designs. This is a four stage process. The stages in this process are business, marketing, finance, graph, strategy.
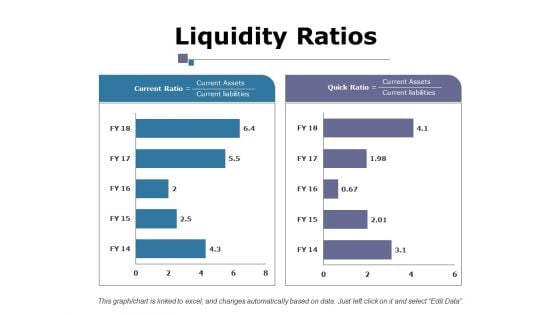
Liquidity Ratios Ppt PowerPoint Presentation Layouts Example File
This is a liquidity ratios ppt powerpoint presentation layouts example file. This is a two stage process. The stages in this process are business, current ratio, quick ratio, marketing, finance, graph.
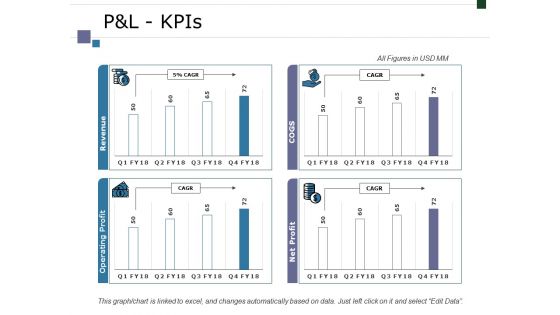
Pandl Kpis Ppt PowerPoint Presentation Infographic Template Graphics Tutorials
This is a pandl kpis ppt powerpoint presentation infographic template graphics tutorials. This is a four stage process. The stages in this process are business, marketing, finance, graph, strategy.
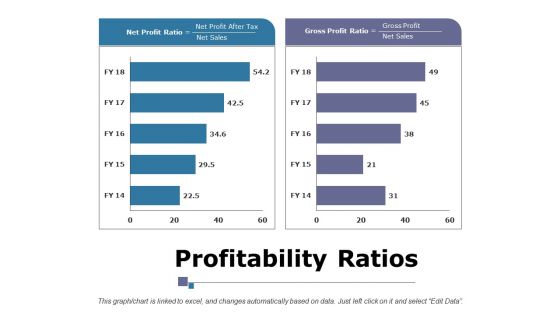
Profitability Ratios Ppt PowerPoint Presentation Infographic Template Portrait
This is a profitability ratios ppt powerpoint presentation infographic template portrait. This is a two stage process. The stages in this process are business, marketing, finance, net profit ratio, gross profit ratio.
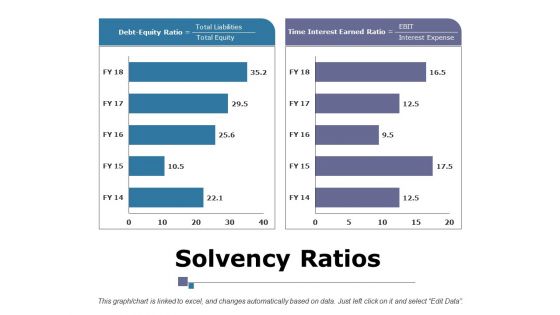
Solvency Ratios Ppt PowerPoint Presentation Summary Layouts
This is a solvency ratios ppt powerpoint presentation summary layouts. This is a two stage process. The stages in this process are business, marketing, strategy, debt equity ratio, time interest earned ratio, finance.
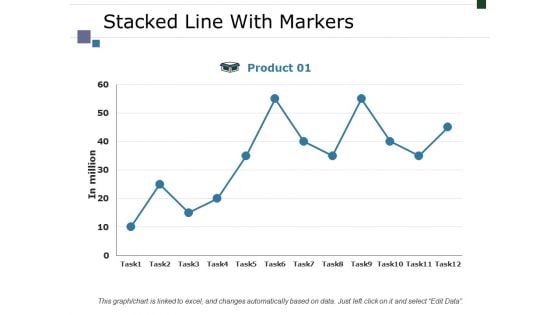
Stacked Line With Markers Ppt PowerPoint Presentation Layouts Display
This is a stacked line with markers ppt powerpoint presentation layouts display. This is a one stage process. The stages in this process are business, marketing, strategy, in million, finance.
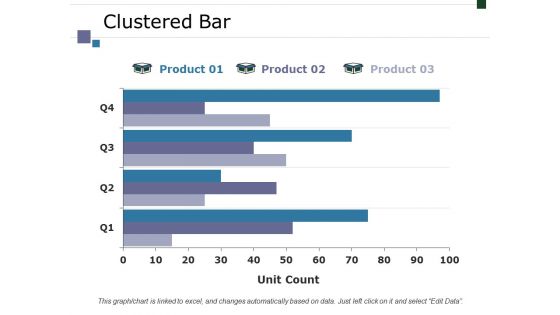
Clustered Bar Ppt PowerPoint Presentation Styles Graphics
This is a clustered bar ppt powerpoint presentation styles graphics. This is a three stage process. The stages in this process are business, marketing, finance, graph, strategy, unit count.
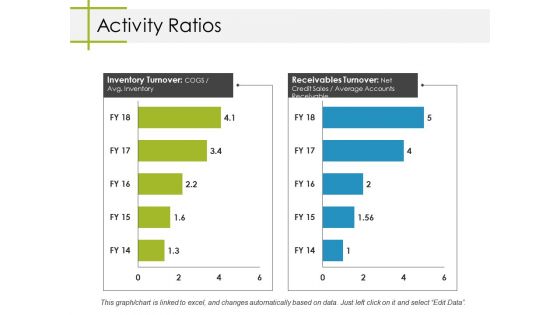
Activity Ratios Ppt PowerPoint Presentation Summary Mockup
This is a activity ratios ppt powerpoint presentation summary mockup. This is a two stage process. The stages in this process are business, inventory turnover, receivables turnover, marketing, finance.
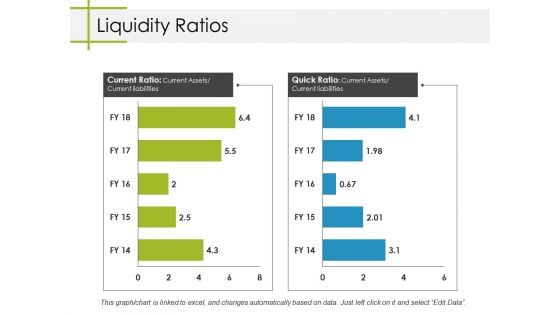
Liquidity Ratios Ppt PowerPoint Presentation Layouts Gridlines
This is a liquidity ratios ppt powerpoint presentation layouts gridlines. This is a two stage process. The stages in this process are business, marketing, current ratio, quick ratio, finance.
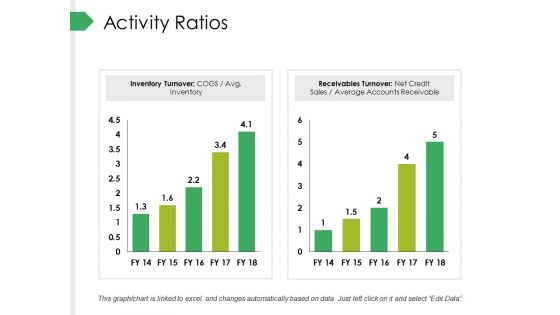
Activity Ratios Ppt PowerPoint Presentation Styles Infographic Template
This is a activity ratios ppt powerpoint presentation styles infographic template. This is a two stage process. The stages in this process are inventory turnover, receivables turnover, business, marketing, finance.
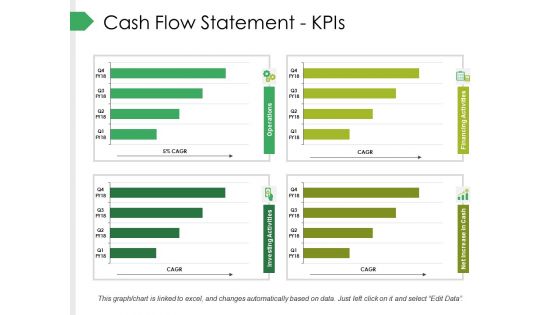
Cash Flow Statement Kpis Ppt PowerPoint Presentation Pictures Graphics
This is a cash flow statement kpis ppt powerpoint presentation pictures graphics. This is a four stage process. The stages in this process are business, marketing, graph, finance, strategy.
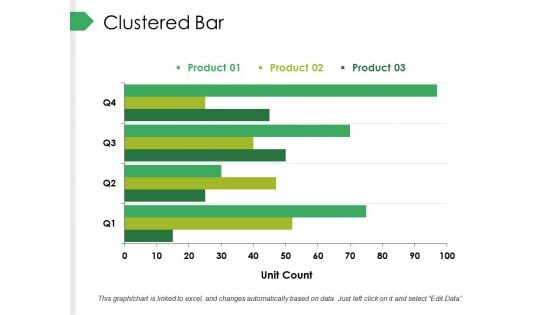
Clustered Bar Ppt PowerPoint Presentation Pictures Clipart Images
This is a clustered bar ppt powerpoint presentation pictures clipart images. This is a three stage process. The stages in this process are business, marketing, graph, finance, strategy, unit count.
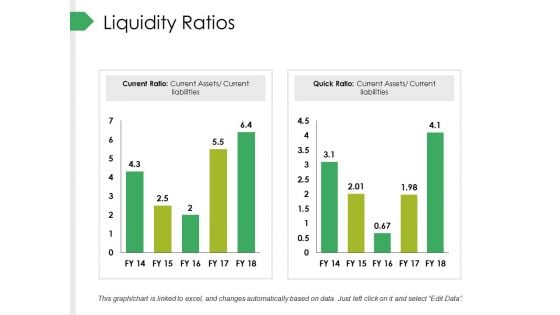
Liquidity Ratios Ppt PowerPoint Presentation Infographic Template Ideas
This is a liquidity ratios ppt powerpoint presentation infographic template ideas. This is a two stage process. The stages in this process are business, marketing, current ratio, quick ratio, finance.
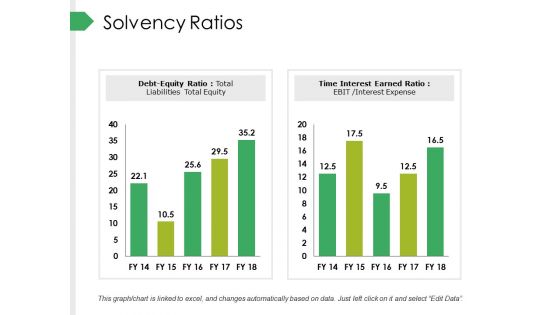
Solvency Ratios Ppt PowerPoint Presentation Outline Ideas
This is a solvency ratios ppt powerpoint presentation outline ideas. This is a two stage process. The stages in this process are business, marketing, debt equity ratio, time interest earned ratio, finance.
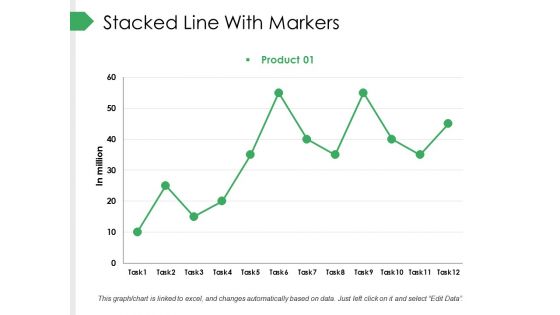
Stacked Line With Markers Ppt PowerPoint Presentation Pictures Design Templates
This is a stacked line with markers ppt powerpoint presentation pictures design templates. This is a one stage process. The stages in this process are business, marketing, finance, in million, graph.
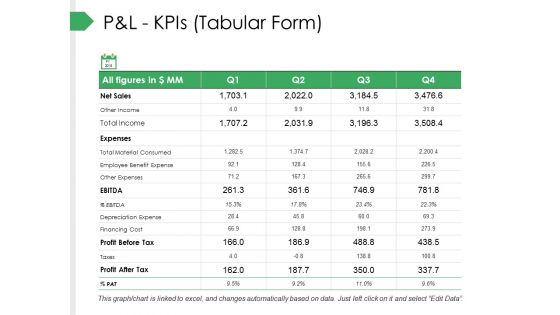
P And L Kpis Tabular Form Ppt PowerPoint Presentation Pictures Gallery
This is a p and l kpis tabular form ppt powerpoint presentation pictures gallery. This is a four stage process. The stages in this process are business, marketing, graph, strategy, finance.
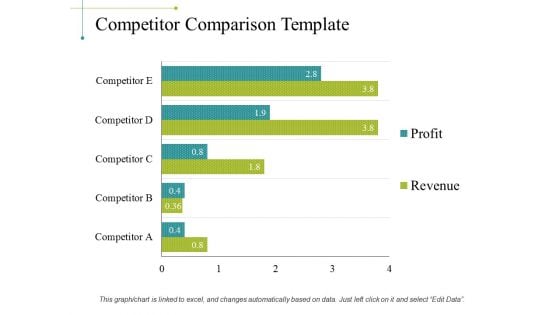
Competitor Comparison Template 1 Ppt PowerPoint Presentation Infographic Template Mockup
This is a competitor comparison template 1 ppt powerpoint presentation infographic template mockup. This is a five stage process. The stages in this process are business, marketing, graph, finance, strategy.
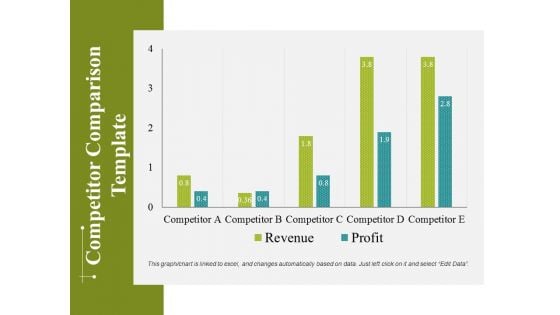
Competitor Comparison Template 2 Ppt PowerPoint Presentation Infographics Objects
This is a competitor comparison template 2 ppt powerpoint presentation infographics objects. This is a five stage process. The stages in this process are business, marketing, graph, finance, strategy.

Competitor Market Share And Sales Revenues Ppt PowerPoint Presentation Summary Influencers
This is a competitor market share and sales revenues ppt powerpoint presentation summary influencers. This is a four stage process. The stages in this process are business, marketing, graph, finance, strategy.
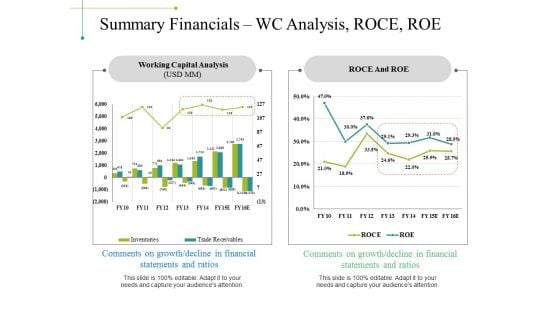
Summary Financials Wc Analysis Roce Roe Ppt PowerPoint Presentation Design Templates
This is a summary financials wc analysis roce roe ppt powerpoint presentation design templates. This is a two stage process. The stages in this process are business, marketing, working capital analysis, roce and roe, finance.
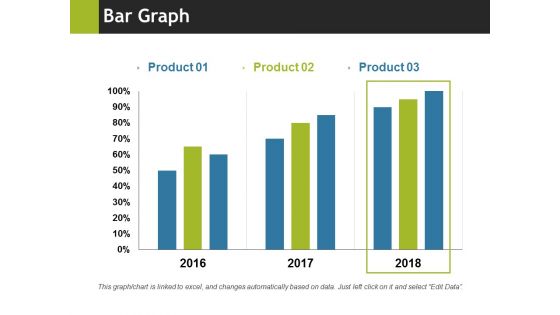
Bar Graph Ppt PowerPoint Presentation Summary Format
This is a bar graph ppt powerpoint presentation summary format. This is a three stage process. The stages in this process are bar graph, business, marketing, years, percentage, finance.
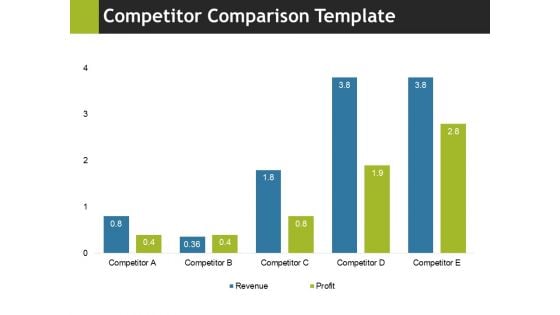
Competitor Comparison Template 1 Ppt PowerPoint Presentation Layouts Slide Portrait
This is a competitor comparison template 1 ppt powerpoint presentation layouts slide portrait. This is a four stage process. The stages in this process are business, marketing, graph, finance, strategy.
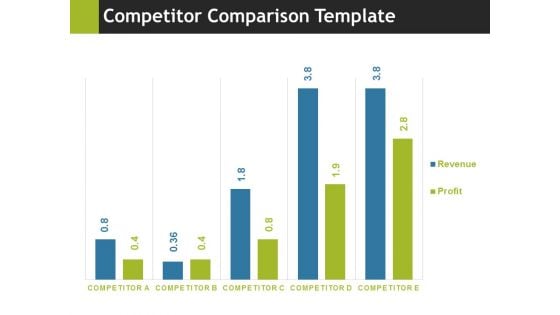
Competitor Comparison Template 2 Ppt PowerPoint Presentation Inspiration Images
This is a competitor comparison template 2 ppt powerpoint presentation inspiration images. This is a five stage process. The stages in this process are business, marketing, graph, finance, strategy.

Competitor Market Share And Sales Revenues Ppt PowerPoint Presentation File Demonstration
This is a competitor market share and sales revenues ppt powerpoint presentation file demonstration. This is a six stage process. The stages in this process are business, marketing, finance, your figures, development.
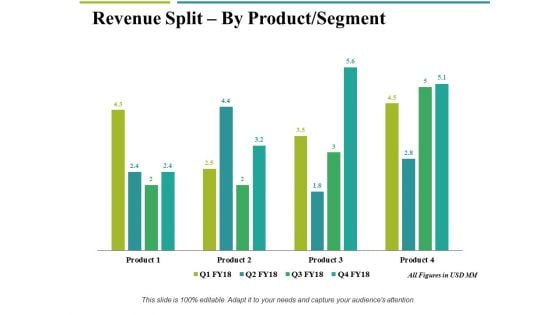
Revenue Split By Product Segment Template 2 Ppt PowerPoint Presentation Gallery Example File
This is a revenue split by product segment template 2 ppt powerpoint presentation gallery example file. This is a four stage process. The stages in this process are business, marketing, graph, finance, revenue split.
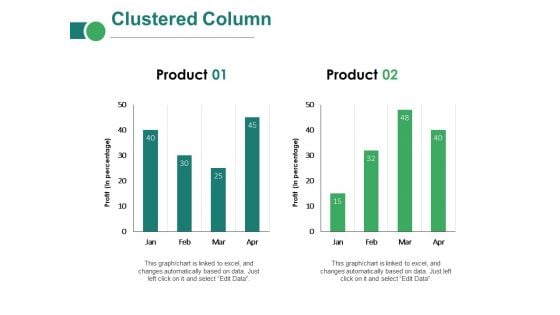
Clustered Column Ppt PowerPoint Presentation Inspiration Introduction
This is a clustered column ppt powerpoint presentation inspiration introduction. This is a two stage process. The stages in this process are business, marketing, in percentage, finance, graph, strategy.
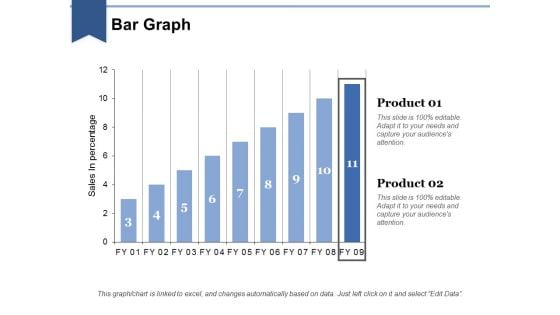
Bar Graph Ppt PowerPoint Presentation Layouts Influencers
This is a bar graph ppt powerpoint presentation layouts influencers. This is a two stage process. The stages in this process are business, marketing, in bar graph, sales in percentage, finance.
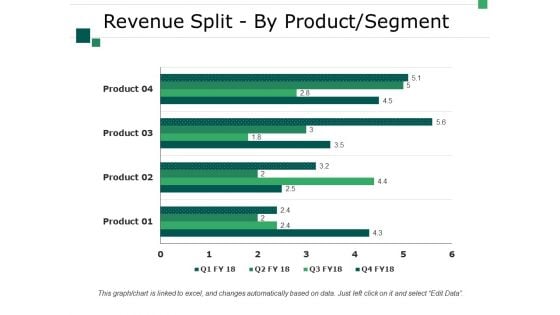
Revenue Split By Product Segment Template 2 Ppt PowerPoint Presentation Summary Good
This is a revenue split by product segment template 2 ppt powerpoint presentation summary good. This is a four stage process. The stages in this process are business, marketing, finance, strategy, graph.
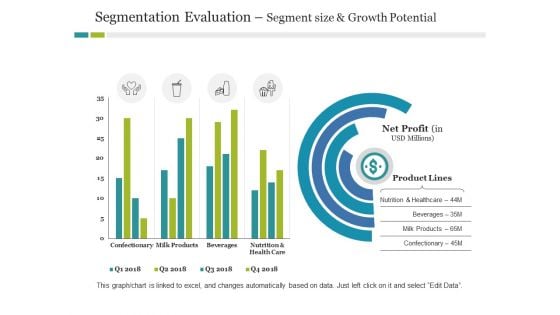
Segmentation Evaluation Segment Size And Growth Potential Ppt PowerPoint Presentation Infographic Template Outline
This is a segmentation evaluation segment size and growth potential ppt powerpoint presentation infographic template outline. This is a two stage process. The stages in this process are business, product lines, finance, marketing, strategy.
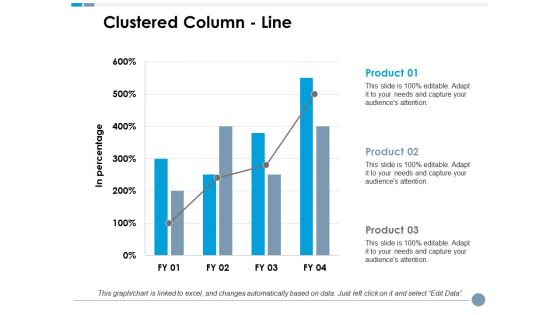
Clustered Column Line Ppt PowerPoint Presentation Model Graphics Tutorials
This is a clustered column line ppt powerpoint presentation model graphics tutorials. This is a three stage process. The stages in this process are business, marketing, in percentage, finance, graph.
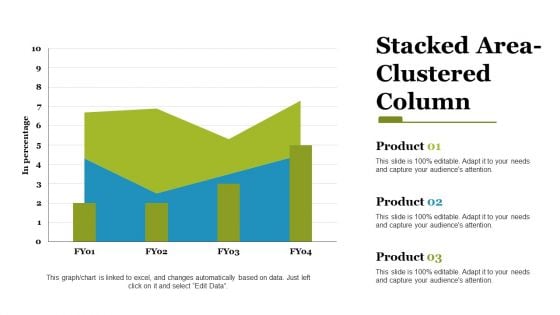
stacked area clustered column ppt powerpoint presentation styles files
This is a stacked area clustered column ppt powerpoint presentation styles files. This is a three stage process. The stages in this process are stacked area, clustered column, finance, marketing, strategy, business.
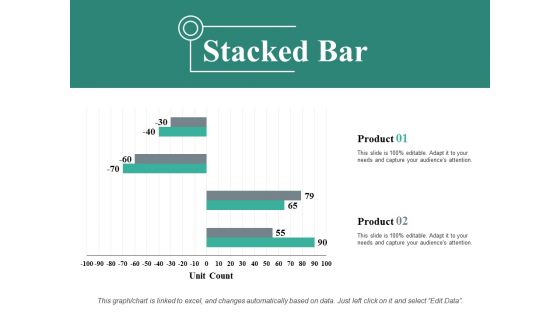
Stacked Bar Ppt PowerPoint Presentation Show Background Designs
This is a stacked bar ppt powerpoint presentation show background designs. This is a two stage process. The stages in this process are stacked bar, business, marketing, finance, unit count.
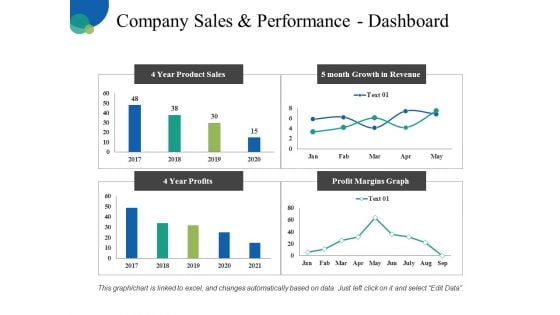
Company Sales And Performance Dashboard Ppt PowerPoint Presentation Pictures Infographic Template
This is a company sales and performance dashboard ppt powerpoint presentation pictures infographic template. This is a four stage process. The stages in this process are business, finance, analysis, management, marketing.
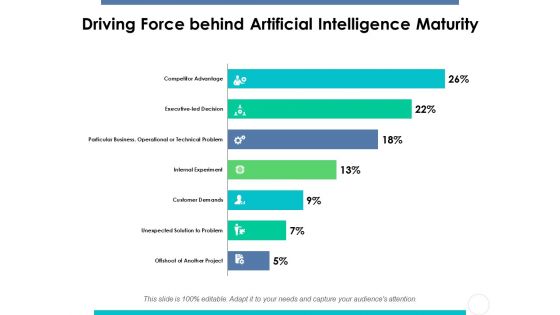
Driving Force Behind Artificial Intelligence Maturity Ppt PowerPoint Presentation Gallery Slides
This is a driving force behind artificial intelligence maturity ppt powerpoint presentation gallery slides. This is a seven stage process. The stages in this process are driving force, artificial, intelligence, maturity, finance.
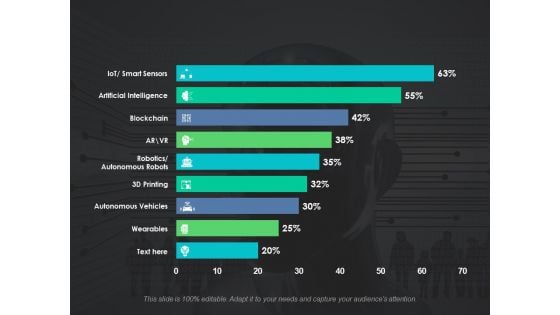
Survey On Adoption Of Emerging Technologies Ppt PowerPoint Presentation Model Format Ideas
This is a survey on adoption of emerging technologies ppt powerpoint presentation model format ideas. This is a nine stages process. The stages in this process are artificial intelligence, blockchain, autonomous robots, autonomous vehicles, wearable, finance.
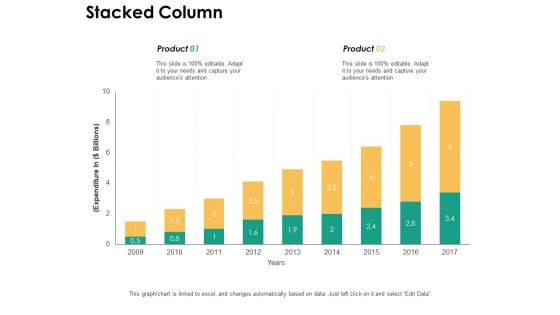
Stacked Column With Growth Ppt PowerPoint Presentation Pictures Guidelines
This is a stacked column with growth ppt powerpoint presentation pictures guidelines. This is a two stage process. The stages in this process are finance, business, planning, marketing, stacked column.
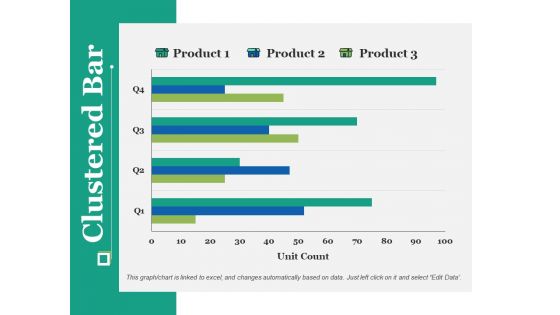
Clustered Bar Ppt PowerPoint Presentation Portfolio Design Templates
This is a clustered bar ppt powerpoint presentation portfolio design templates. This is a three stage process. The stages in this process are clustered bar, finance, business, planning, marketing.
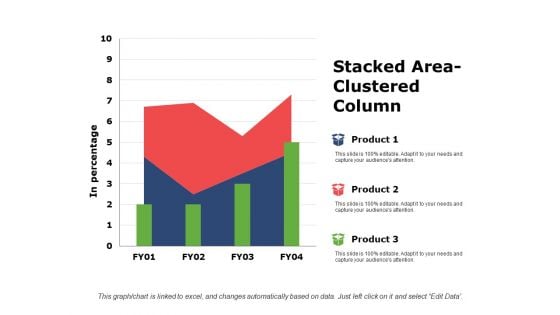
Stacked Area Clustered Column Ppt PowerPoint Presentation Show Outline
This is a stacked area clustered column ppt powerpoint presentation show outline. This is a three stage process. The stages in this process are stacked area, clustered column, finance, marketing, management.
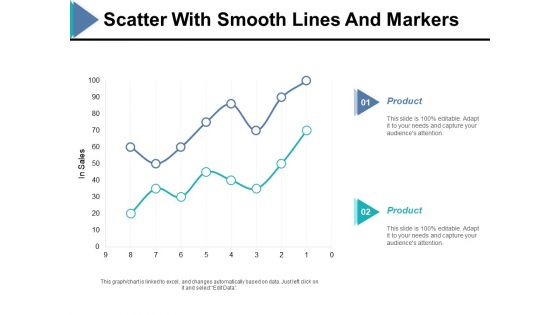
Scatter With Smooth Lines And Markers Ppt PowerPoint Presentation Ideas Example
This is a scatter with smooth lines and markers ppt powerpoint presentation ideas example. This is a two stage process. The stages in this process are in sales, finance, bar graph, product, business.
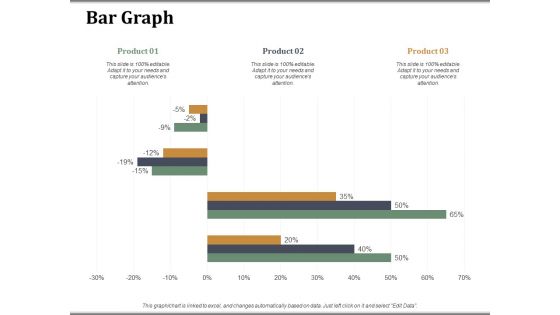
Bar Graph Companys Business Model Canvas Ppt PowerPoint Presentation Visual Aids Model
This is a bar graph companys business model canvas ppt powerpoint presentation visual aids model. This is a three stage process. The stages in this process are bar graph, finance, marketing, strategy, analysis, business.
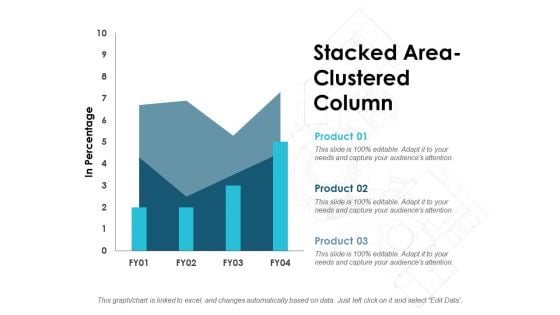
Stacked Area Clustered Column Ppt PowerPoint Presentation Summary Portfolio
This is a stacked area clustered column ppt powerpoint presentation summary portfolio. This is a three stage process. The stages in this process are stacked bar, finance, marketing, management, analysis.
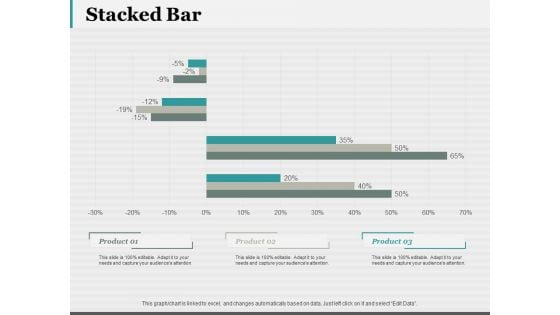
Stacked Bar 7 QC Tools Ppt PowerPoint Presentation Portfolio Smartart
This is a stacked bar 7 qc tools ppt powerpoint presentation portfolio smartart. This is a three stage process. The stages in this process are stacked bar, finance, marketing, strategy, business.
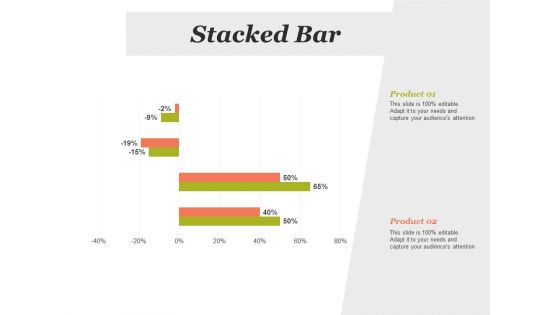
Stacked Bar Financial Analysis Ppt PowerPoint Presentation Infographic Template Slides
This is a stacked bar financial analysis ppt powerpoint presentation infographic template slides. This is a two stage process. The stages in this process are stacked bar, finance, marketing, strategy, analysis.
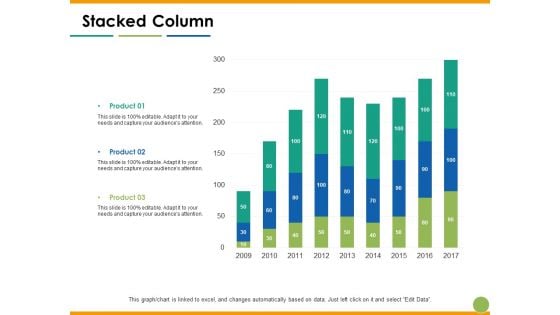
Stacked Column Capability Maturity Matrix Ppt PowerPoint Presentation Model Shapes
This is a stacked column capability maturity matrix ppt powerpoint presentation model shapes. This is a three stage process. The stages in this process are stacked column, product, year, finance, business.
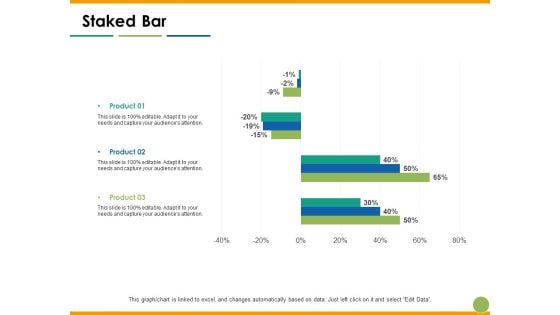
Staked Bar Capability Maturity Matrix Ppt PowerPoint Presentation Slides Outfit
This is a staked bar capability maturity matrix ppt powerpoint presentation slides outfit. This is a three stage process. The stages in this process are staked bar, product, year, finance, percentage.

Comparison Slide Male Female Marketing Ppt PowerPoint Presentation File Slideshow
This is a comparison slide male female marketing ppt powerpoint presentation file slideshow. This is a three stage process. The stages in this process are finance, marketing, management, comparison.
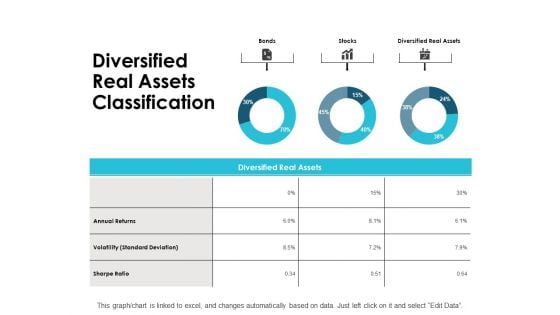
Diversified Real Assets Classification Ppt PowerPoint Presentation Ideas Graphics
This is a diversified real assets classification ppt powerpoint presentation ideas graphics. This is a three stage process. The stages in this process are management, marketing, business, strategy, finance.
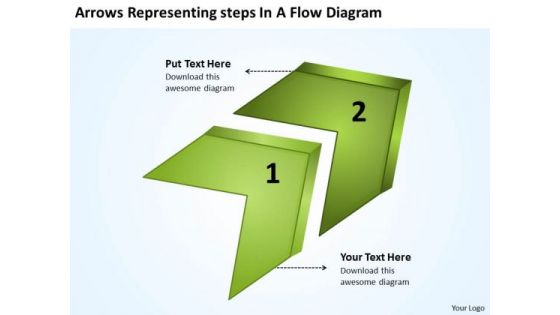
Arrows Representing Steps Flow Diagram Flowchart Application PowerPoint Templates
We present our arrows representing steps flow diagram flowchart application PowerPoint templates.Present our Arrows PowerPoint Templates because our presentation designs are for those on the go. Download and present our Shapes PowerPoint Templates because clarity of thought has been the key to your growth. Download our Business PowerPoint Templates because this is the unerring accuracy in reaching the target. the effortless ability to launch into flight. Download and present our Leadership PowerPoint Templates because you will be able to Highlight your ideas broad-based on strong fundamentals and illustrate how they step by step acheive the set growth factor. Download and present our Process and Flows PowerPoint Templates because you know Coincidentally it will always point to the top.Use these PowerPoint slides for presentations relating to 3d, Abstract, Around, Arrows, Blue, Border, Business, Center, Circle, Circular, Concept, Connections, Copy, Curve, Cycle, Directions, Distribution, Illustration, Management, Middle, Objects, Pieces, Plan, Pointing, Process, Recycle, Rounded, Shadows, Space, System. The prominent colors used in the PowerPoint template are Green, Green dark , Black. Customers tell us our arrows representing steps flow diagram flowchart application PowerPoint templates are Fabulous. The feedback we get is that our Blue PowerPoint templates and PPT Slides are Quaint. Professionals tell us our arrows representing steps flow diagram flowchart application PowerPoint templates are topically designed to provide an attractive backdrop to any subject. People tell us our Blue PowerPoint templates and PPT Slides are Fancy. Customers tell us our arrows representing steps flow diagram flowchart application PowerPoint templates are Graceful. Professionals tell us our Border PowerPoint templates and PPT Slides are Clever. Critique plans with our Arrows Representing Steps Flow Diagram Flowchart Application PowerPoint Templates. Download without worries with our money back guaranteee.
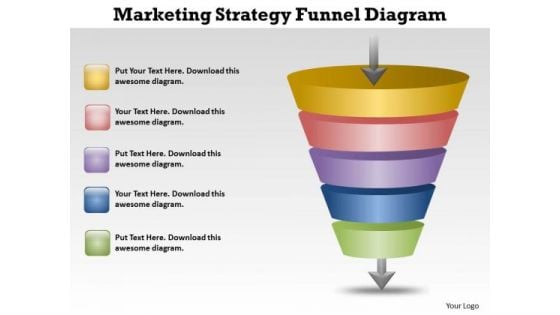
Marketing Strategy Funnel Diagram Cycle Process PowerPoint Templates
We present our marketing strategy funnel diagram Cycle Process PowerPoint templates.Download and present our Marketing PowerPoint Templates because The marketplace is the merger of your dreams and your ability. Present our Business PowerPoint Templates because you have had a great year or so business wise. It is time to celebrate the efforts of your team. Present our Funnels PowerPoint Templates because analyse your plans with equal sincerity. Download and present our Arrows PowerPoint Templates because your listeners do not have to put on their thinking caps. Download our Layers PowerPoint Templates because Our PowerPoint Templates and Slides are conceived by a dedicated team. Use them and give form to your wondrous ideas.Use these PowerPoint slides for presentations relating to Arrows, Abstract, Assemblage, Assembly, Blue, Build, Coherence, Construction, Cooperate, Corporate, Crew, Finalize, Floor, Form, Four, Game, Graphic, Green, Group, Illustration, Improve, Infrastructure, Ingenious, Interface, Link, Piece. The prominent colors used in the PowerPoint template are Yellow, Pink, Purple. We assure you our marketing strategy funnel diagram Cycle Process PowerPoint templates are designed to make your presentations professional. Customers tell us our Cooperate PowerPoint templates and PPT Slides will make you look like a winner. The feedback we get is that our marketing strategy funnel diagram Cycle Process PowerPoint templates provide great value for your money. Be assured of finding the best projection to highlight your words. We assure you our Cooperate PowerPoint templates and PPT Slides are the best it can get when it comes to presenting. People tell us our marketing strategy funnel diagram Cycle Process PowerPoint templates are Multicolored. We assure you our Assembly PowerPoint templates and PPT Slides are Lush. Gain confidence in your ability to achieve. Our Marketing Strategy Funnel Diagram Cycle Process PowerPoint Templates drive doubts away.
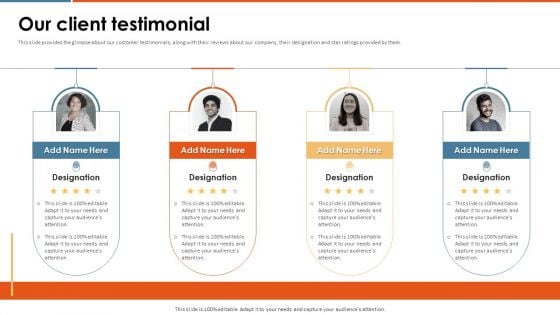
Enterprise Pitch Deck Our Client Testimonial Ppt PowerPoint Presentation File Microsoft PDF
This slide provides the glimpse about our customer testimonials, along with their reviews about our company, their designation and star ratings provided by them. Slidegeeks is one of the best resources for PowerPoint templates. You can download easily and regulate Enterprise Pitch Deck Our Client Testimonial Ppt PowerPoint Presentation File Microsoft PDF for your personal presentations from our wonderful collection. A few clicks is all it takes to discover and get the most relevant and appropriate templates. Use our Templates to add a unique zing and appeal to your presentation and meetings. All the slides are easy to edit and you can use them even for advertisement purposes.
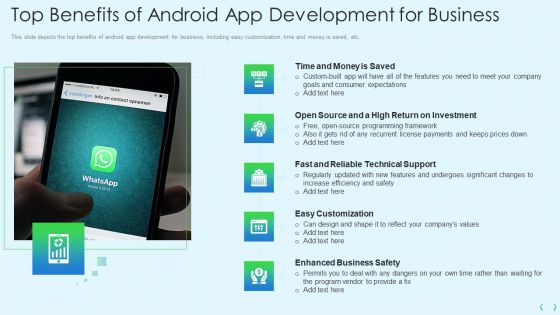
Smartphone Operating System Development IT Top Benefits Of Android App Development For Business Diagrams PDF
This slide depicts the top benefits of android app development for business, including easy customization, time and money is saved, etc.This is a smartphone operating system development it top benefits of android app development for business diagrams pdf template with various stages. Focus and dispense information on five stages using this creative set, that comes with editable features. It contains large content boxes to add your information on topics like open source and a high, fast and reliable, easy customization You can also showcase facts, figures, and other relevant content using this PPT layout. Grab it now.

 Home
Home