Cost Improvement
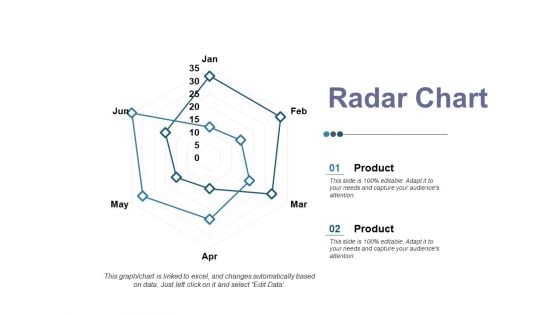
Radar Chart Ppt PowerPoint Presentation Professional Master Slide
This is a radar chart ppt powerpoint presentation professional master slide. This is a two stage process. The stages in this process are product, radar chart, financial, business, shape.

Brand Equity Ppt PowerPoint Presentation Complete Deck With Slides
This is a brand equity ppt powerpoint presentation complete deck with slides. This is a one stage process. The stages in this process are brand, equity, business, financial, technology.
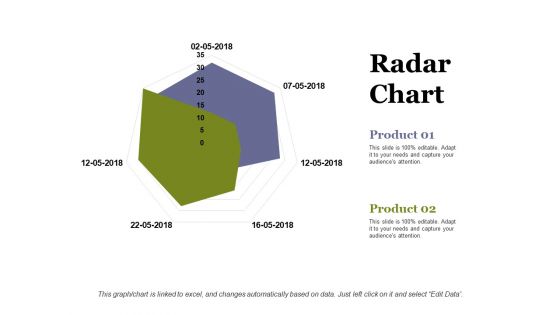
Radar Chart Ppt PowerPoint Presentation Infographic Template Information
This is a radar chart ppt powerpoint presentation infographic template information. This is a two stage process. The stages in this process are radar chart, product, business, marketing, shape.
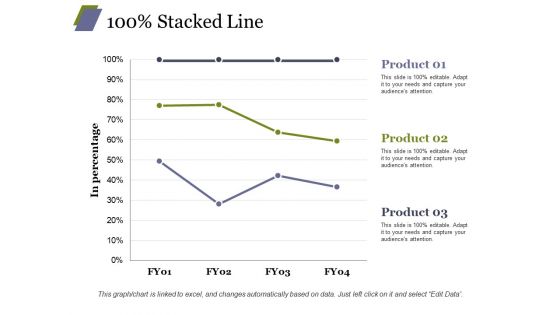
Stacked Line Ppt PowerPoint Presentation Infographics Vector
This is a stacked line ppt powerpoint presentation infographics vector. This is a three stage process. The stages in this process are product, stacked line, business, marketing, in percentage.
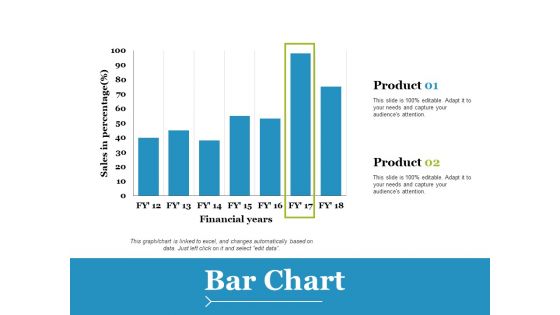
Bar Chart Ppt PowerPoint Presentation Slides Example File
This is a bar chart ppt powerpoint presentation slides example file. This is a two stage process. The stages in this process are product, financial years, sales in percentage.
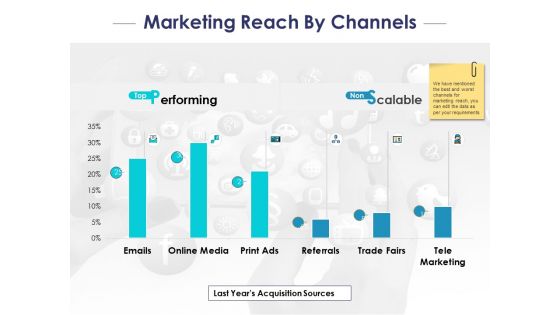
Marketing Reach By Channels Ppt PowerPoint Presentation Styles Professional
This is a marketing reach by channels ppt powerpoint presentation styles professional. This is a six stage process. The stages in this process are top performing, non scalable, emails, print ads, inline media.
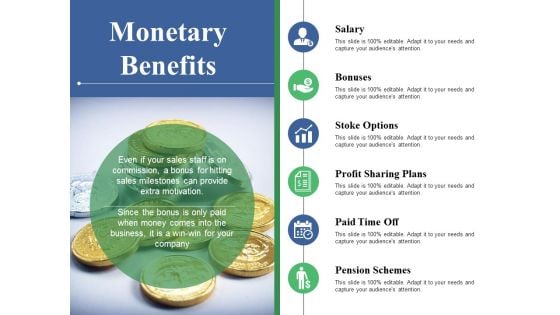
Monetary Benefits Ppt PowerPoint Presentation Ideas Design Inspiration
This is a monetary benefits ppt powerpoint presentation ideas design inspiration. This is a six stage process. The stages in this process are salary, bonuses, stoke options, profit sharing plans, paid time off.
Contingency Plan Template 2 Ppt PowerPoint Presentation Inspiration Icons
This is a contingency plan template 2 ppt powerpoint presentation inspiration icons. This is a four stage process. The stages in this process are scenario, operational support plan, response strategy, implementation plan, refugees.
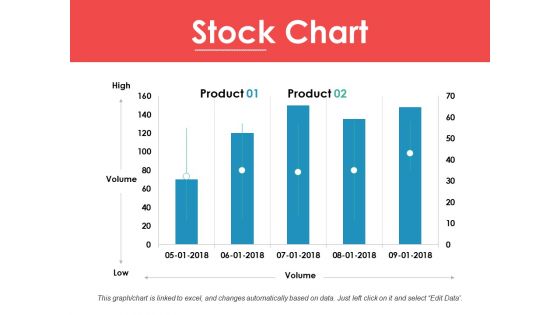
Stock Chart Ppt PowerPoint Presentation Ideas Infographic Template
This is a stock chart ppt powerpoint presentation ideas infographic template. This is a two stage process. The stages in this process are high, volume, low, product, stock chart.
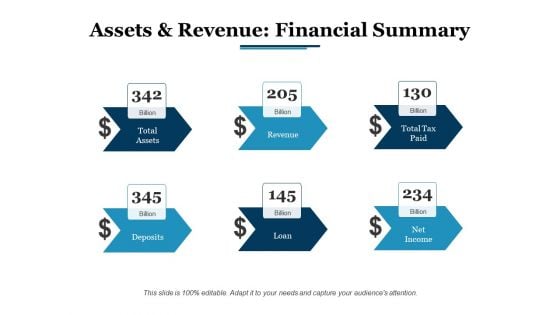
Assets And Revenue Financial Summary Ppt PowerPoint Presentation Diagram Lists
This is a assets and revenue financial summary ppt powerpoint presentation diagram lists. This is a six stage process. The stages in this process are total assets, revenue, deposits, loan, net income.
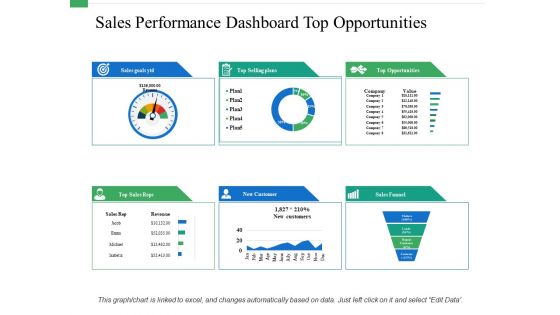
Sales Performance Dashboard Top Opportunities Ppt PowerPoint Presentation Layouts Template
This is a sales performance dashboard top opportunities ppt powerpoint presentation layouts template. This is a eight stage process. The stages in this process are revenue, new customer, gross profit, customer satisfaction, brand profitability.
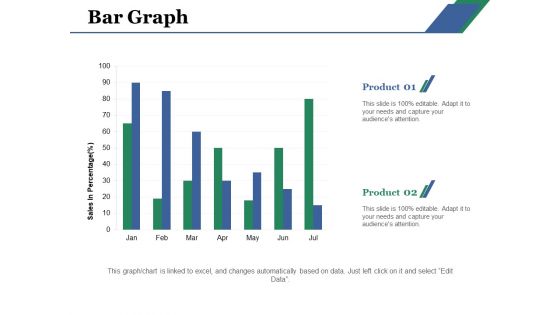
Bar Graph Ppt PowerPoint Presentation Infographic Template Demonstration
This is a bar graph ppt powerpoint presentation infographic template demonstration. This is a two stage process. The stages in this process are bar graph, product, sales, percentage, financial.
Volume Open High Low Close Chart Ppt PowerPoint Presentation Icon Design Inspiration
This is a volume open high low close chart ppt powerpoint presentation icon design inspiration. This is a three stage process. The stages in this process are close, high, low, volume, open.
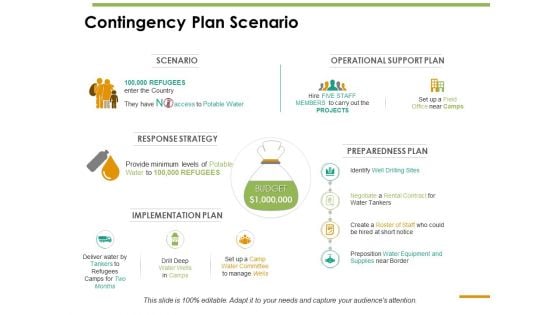
Contingency Plan Scenario Ppt PowerPoint Presentation Summary Samples
This is a contingency plan scenario ppt powerpoint presentation summary samples. This is a one stage process. The stages in this process are scenario, operational support plan, response strategy, preparedness plan, implementation plan.

Our Mission Compettitive Analysis Ppt PowerPoint Presentation File Slide Download
This is a our mission compettitive analysis ppt powerpoint presentation file slide download. This is a three stage process. The stages in this process are our mission, our vision, our goal.
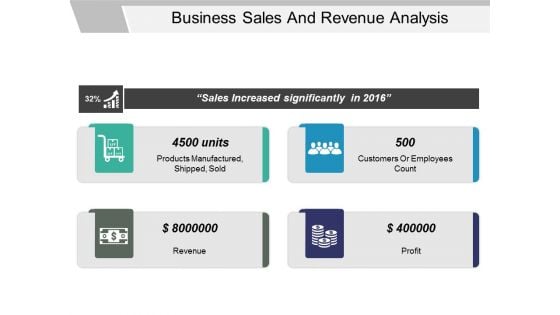
Business Sales And Revenue Analysis Ppt PowerPoint Presentation Layouts Display
This is a business sales and revenue analysis ppt powerpoint presentation layouts display. This is a four stage process. The stages in this process are goals, results, output, deliverables.
Quantitative Research Methodology Supply Chain Forum Financial Management Ppt PowerPoint Presentation Layouts Icon
This is a quantitative research methodology supply chain forum financial management ppt powerpoint presentation layouts icon. This is a four stage process. The stages in this process are quantitative research methodology, supply chain forum, financial management.
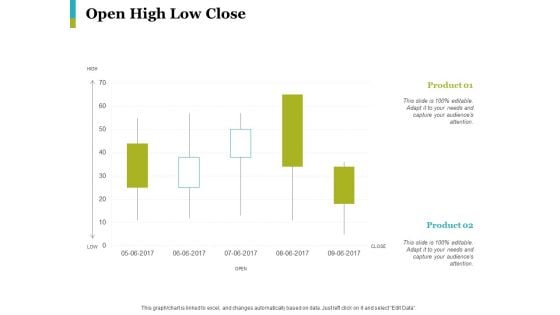
Open High Low Close Ppt PowerPoint Presentation Styles Graphics Example
This is a open high low close ppt powerpoint presentation styles graphics example.This is a two stage process. The stages in this process are product, percentage, chart, management, marketing.
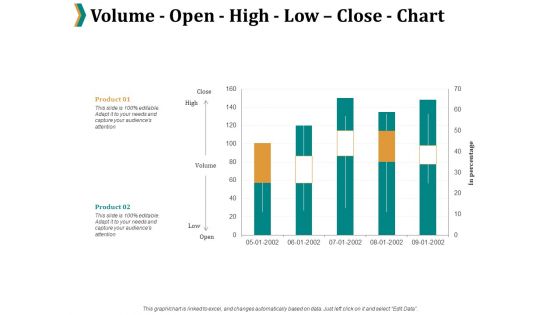
Volume Open High Low Close Chart Ppt PowerPoint Presentation Professional Maker
This is a volume open high low close chart ppt powerpoint presentation professional maker. This is a two stage process. The stages in this process are percentage, product, marketing.
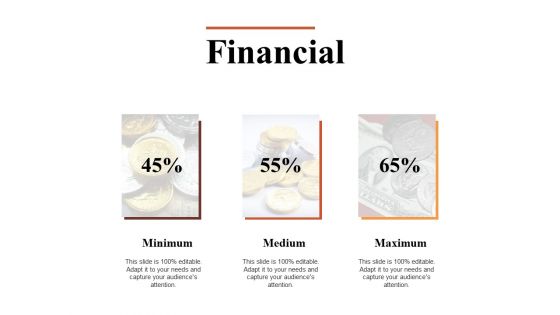
Financial Minimum Maximum Ppt PowerPoint Presentation Layouts Design Ideas
This is a financial minimum maximum ppt powerpoint presentation layouts design ideas. This is a three stage process. The stages in this process are financial, maximum, medium, minimum, marketing.
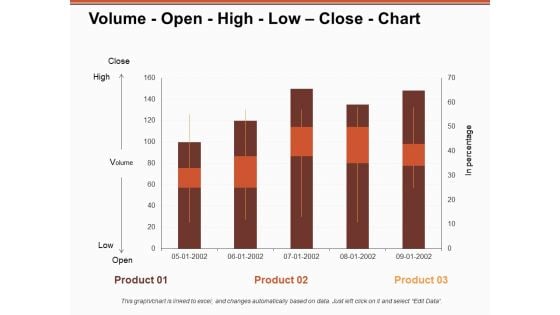
Volume Open High Low Close Chart Ppt PowerPoint Presentation Model Inspiration
This is a volume open high low close chart ppt powerpoint presentation model inspiration. This is a three stage process. The stages in this process are business, management, strategy, marketing, sales.
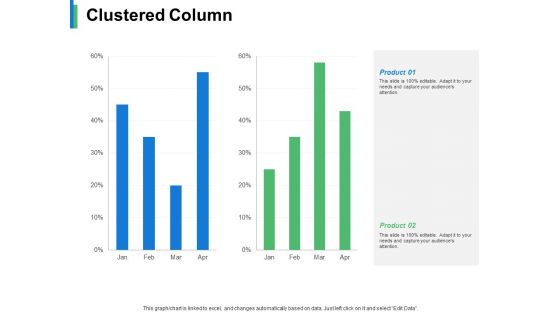
Clustered Column Product Ppt PowerPoint Presentation Inspiration Infographic Template
This is a clustered column product ppt powerpoint presentation inspiration infographic template. This is a two stage process. The stages in this process are business, management, marketing, strategy, sales.
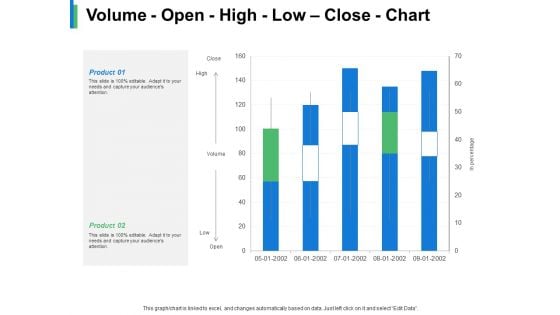
Volume Open High Low Close Chart Product Ppt PowerPoint Presentation Gallery Example
This is a volume open high low close chart product ppt powerpoint presentation gallery example. This is a two stage process. The stages in this process are business, management, strategy, marketing, sales.
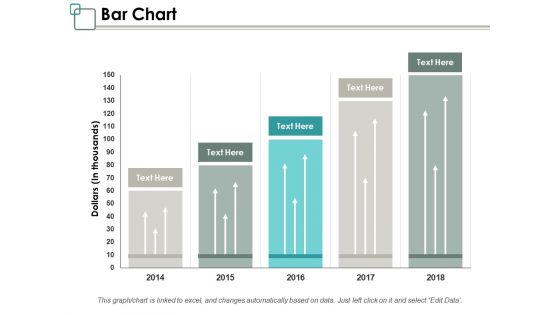
Bar Chart Ppt PowerPoint Presentation Infographic Template Graphics Design
This is a bar chart ppt powerpoint presentation infographic template graphics design. This is a five stage process. The stages in this process are management, marketing, business, percentage, product.
Project Management Dashboard Testing Ppt PowerPoint Presentation Icon File Formats
This is a project management dashboard testing ppt powerpoint presentation icon file formats. This is a three stage process. The stages in this process are business, management, marketing, percentage.
Financial Bizbok Business Design Ppt PowerPoint Presentation Pictures Graphics
This is a financial bizbok business design ppt powerpoint presentation pictures graphics. This is a three stage process. The stages in this process are business, management, strategy, analysis, financial.
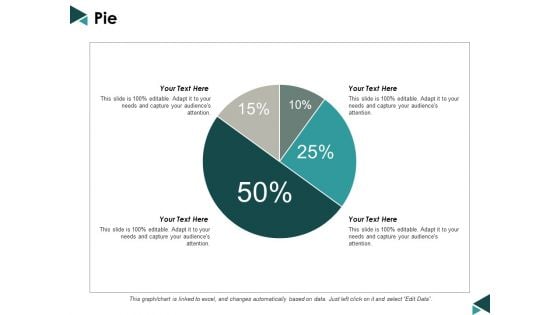
Pie Business Analysis Ppt Powerpoint Presentation Model Graphics
This is a pie business analysis ppt powerpoint presentation model graphics. This is a four stage process. The stages in this process are pie chart, percentage, marketing, business, analysis.
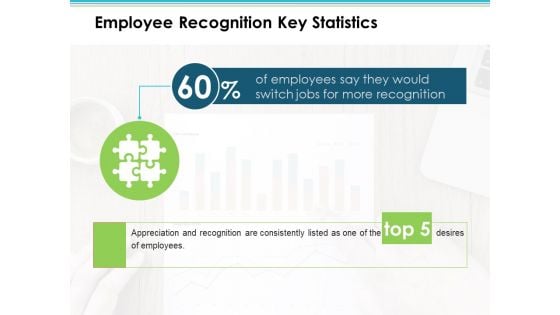
Employee Recognition Key Statistics Employee Value Proposition Ppt PowerPoint Presentation Layouts Mockup
This is a employee recognition key statistics employee value proposition ppt powerpoint presentation layouts mockup. This is a one stage process. The stages in this process are business, management, strategy, analysis, marketing.
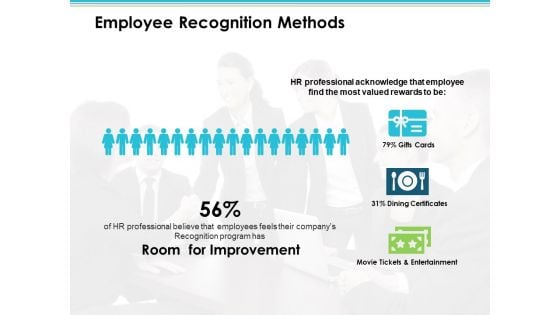
Employee Recognition Methods Employee Value Proposition Ppt PowerPoint Presentation Infographics Example
This is a employee recognition methods employee value proposition ppt powerpoint presentation infographics example. This is a three stage process. The stages in this process are business, management, strategy, analysis, icons.
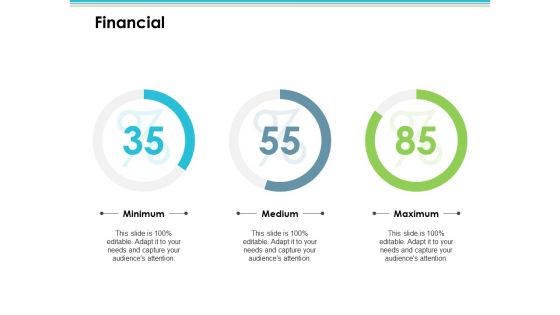
Financial Employee Value Proposition Ppt PowerPoint Presentation Show Slides
This is a financial employee value proposition ppt powerpoint presentation show slides. This is a three stage process. The stages in this process are business, management, strategy, analysis, marketing.
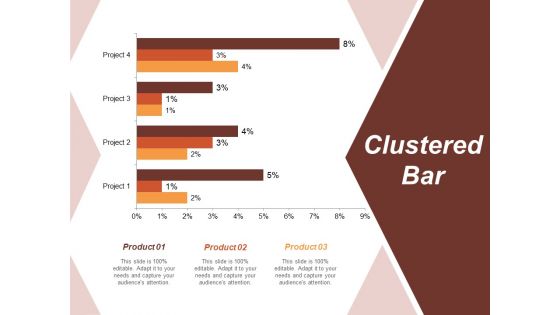
Clustered Bar Risk Estimator Ppt PowerPoint Presentation Layouts Mockup
This is a clustered bar risk estimator ppt powerpoint presentation layouts mockup. This is a four stage process. The stages in this process are business, management, strategy, analysis, marketing.
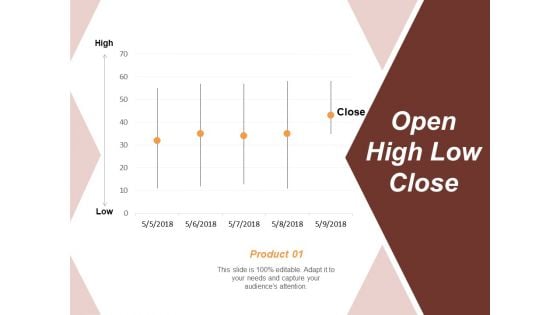
Open High Low Close Risk Estimator Ppt PowerPoint Presentation Infographics Vector
This is a open high low close risk estimator ppt powerpoint presentation infographics vector. This is a five stage process. The stages in this process are business, management, strategy, analysis, marketing.
Quantitative Risk Analysis Risk Estimator Ppt PowerPoint Presentation Icon Designs
This is a quantitative risk analysis risk estimator ppt powerpoint presentation icon designs. This is a four stage process. The stages in this process are business, management, strategy, analysis, marketing.
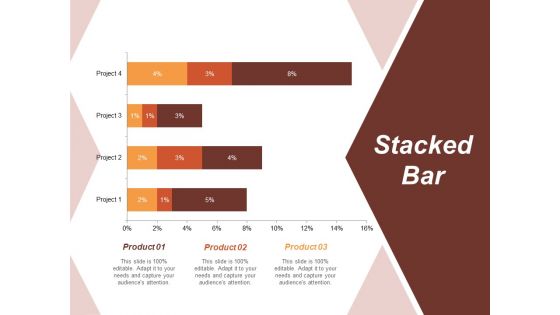
Stacked Bar Risk Estimator Ppt PowerPoint Presentation Gallery Design Templates
This is a stacked bar risk estimator ppt powerpoint presentation gallery design templates. This is a four stage process. The stages in this process are business, management, strategy, analysis, marketing.
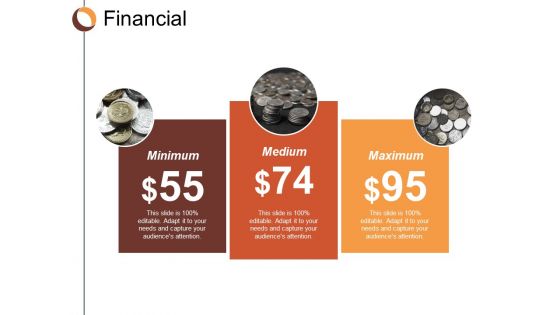
Financial Minimum Medium Maximum Ppt Powerpoint Presentation Infographics Introduction
This is a financial minimum medium maximum ppt powerpoint presentation infographics introduction. This is a three stage process. The stages in this process are financial, minimum, maximum, marketing, strategy.
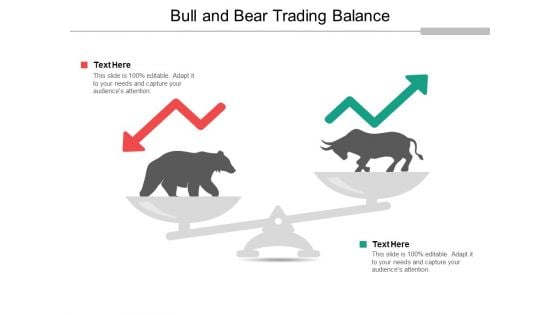
Bull And Bear Trading Balance Ppt Powerpoint Presentation Infographics Designs
This is a bull and bear trading balance ppt powerpoint presentation infographics designs. This is a two stage process. The stages in this process are stock market, financial market, bull market.
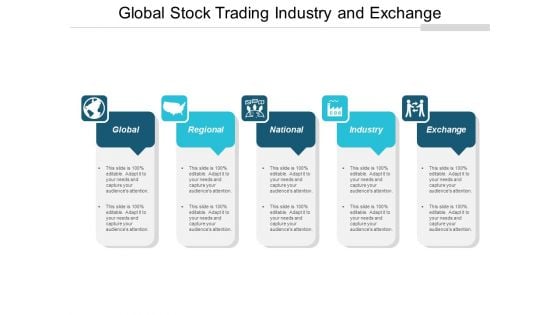
Global Stock Trading Industry And Exchange Ppt Powerpoint Presentation Ideas Summary
This is a global stock trading industry and exchange ppt powerpoint presentation ideas summary. This is a five stage process. The stages in this process are stock market, financial market, bull market.
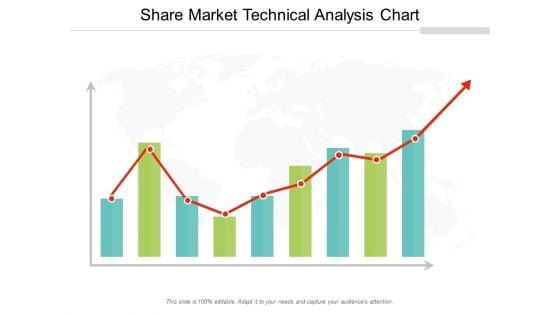
Share Market Technical Analysis Chart Ppt Powerpoint Presentation Professional Rules
This is a share market technical analysis chart ppt powerpoint presentation professional rules. This is a three stage process. The stages in this process are stock market, financial market, bull market.
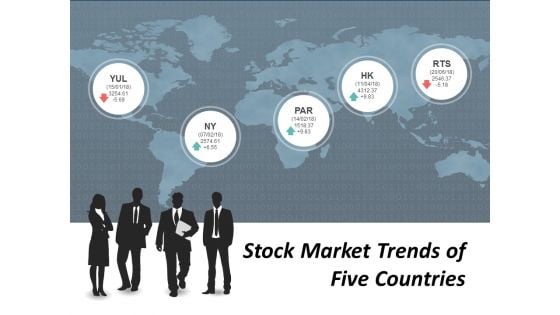
Stock Market Trends Of Five Countries Ppt Powerpoint Presentation Model Guidelines
This is a stock market trends of five countries ppt powerpoint presentation model guidelines. This is a four stage process. The stages in this process are stock market, financial market, bull market.
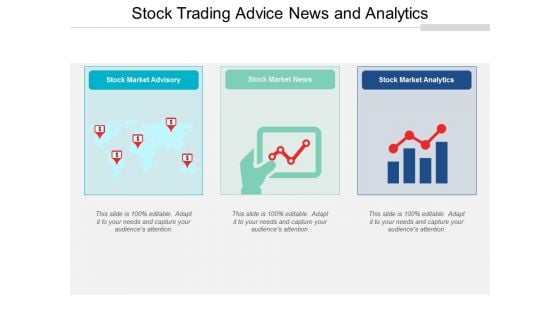
Stock Trading Advice News And Analytics Ppt Powerpoint Presentation Show Design Inspiration
This is a stock trading advice news and analytics ppt powerpoint presentation show design inspiration. This is a three stage process. The stages in this process are stock market, financial market, bull market.

Stocks Best And Worst Performance Contribution Ppt PowerPoint Presentation Gallery Tips
This is a stocks best and worst performance contribution ppt powerpoint presentation gallery tips. This is a two stage process. The stages in this process are finanace, marketing, business, management, strategy.
Computer Screen With Cloud Icon Ppt Powerpoint Presentation Infographics Display
This is a computer screen with cloud icon ppt powerpoint presentation infographics display. This is a three stage process. The stages in this process are data visualization icon, data management icon.
Data Analysis Reports Under Magnifying Glass Ppt Powerpoint Presentation Summary Slideshow
This is a data analysis reports under magnifying glass ppt powerpoint presentation summary slideshow. This is a three stage process. The stages in this process are data visualization icon, data management icon.
Data Analytics Vector Icon Ppt Powerpoint Presentation Icon Designs
This is a data analytics vector icon ppt powerpoint presentation icon designs. This is a four stage process. The stages in this process are data visualization icon, data management icon.
Data Reports Visualization Vector Ppt Powerpoint Presentation Portfolio Grid
This is a data reports visualization vector ppt powerpoint presentation portfolio grid. This is a three stage process. The stages in this process are data visualization icon, data management icon.
Data Representation Vector Icon Ppt Powerpoint Presentation Infographic Template Example File
This is a data representation vector icon ppt powerpoint presentation infographic template example file. This is a four stage process. The stages in this process are data visualization icon, data management icon.
Human Eye Observation And Monitoring Icon Ppt Powerpoint Presentation Slides Background Designs
This is a human eye observation and monitoring icon ppt powerpoint presentation slides background designs. This is a three stage process. The stages in this process are data visualization icon, data management icon.
Personal Data Visualization On Computer Screen Ppt Powerpoint Presentation Infographics Vector
This is a personal data visualization on computer screen ppt powerpoint presentation infographics vector. This is a three stage process. The stages in this process are data visualization icon, data management icon.
Pie Chart For Data Presentation Vector Ppt Powerpoint Presentation Summary Display
This is a pie chart for data presentation vector ppt powerpoint presentation summary display. This is a three stage process. The stages in this process are data visualization icon, data management icon.
Visual Analytics Vector Icon Ppt Powerpoint Presentation Infographics Show
This is a visual analytics vector icon ppt powerpoint presentation infographics show. This is a three stage process. The stages in this process are data visualization icon, data management icon.
Visual Representation Of Data Ppt Powerpoint Presentation Model Images
This is a visual representation of data ppt powerpoint presentation model images. This is a four stage process. The stages in this process are data visualization icon, data management icon.
Annual Report Vector Icon Ppt Powerpoint Presentation File Gridlines
This is a annual report vector icon ppt powerpoint presentation file gridlines. This is a three stage process. The stages in this process are financial statements icon, accounting ratio icon, balance sheet icon.
Balance Sheet Vector Icon Ppt Powerpoint Presentation Designs Download
This is a balance sheet vector icon ppt powerpoint presentation designs download. This is a three stage process. The stages in this process are financial statements icon, accounting ratio icon, balance sheet icon.
Business Report Vector Icon Ppt Powerpoint Presentation Summary Guidelines
This is a business report vector icon ppt powerpoint presentation summary guidelines. This is a three stage process. The stages in this process are financial statements icon, accounting ratio icon, balance sheet icon.
Financial Document With Euro Symbol Vector Ppt Powerpoint Presentation Inspiration Graphics
This is a financial document with euro symbol vector ppt powerpoint presentation inspiration graphics. This is a four stage process. The stages in this process are financial statements icon, accounting ratio icon, balance sheet icon.
Financial Document With Pen And Dollar Icon Ppt Powerpoint Presentation Summary Slide Portrait
This is a financial document with pen and dollar icon ppt powerpoint presentation summary slide portrait. This is a four stage process. The stages in this process are financial statements icon, accounting ratio icon, balance sheet icon.
Financial Performance Report Vector Icon Ppt Powerpoint Presentation Pictures Background Image
This is a financial performance report vector icon ppt powerpoint presentation pictures background image. This is a four stage process. The stages in this process are financial statements icon, accounting ratio icon, balance sheet icon.
Financial Reporting Icon Computer Screen With Graph And Dollar Ppt Powerpoint Presentation Layouts Model
This is a financial reporting icon computer screen with graph and dollar ppt powerpoint presentation layouts model. This is a four stage process. The stages in this process are financial statements icon, accounting ratio icon, balance sheet icon.
Income Statement And Auditing Vector Icon Ppt Powerpoint Presentation Clipart
This is a income statement and auditing vector icon ppt powerpoint presentation clipart. This is a three stage process. The stages in this process are financial statements icon, accounting ratio icon, balance sheet icon.

Introduction Financial Management Goals Ppt Powerpoint Presentation File Example
This is a introduction financial management goals ppt powerpoint presentation file example. This is a one stage process. The stages in this process are introduction, financial management goals, business, management, marketing.


 Continue with Email

 Home
Home


