Cost Management
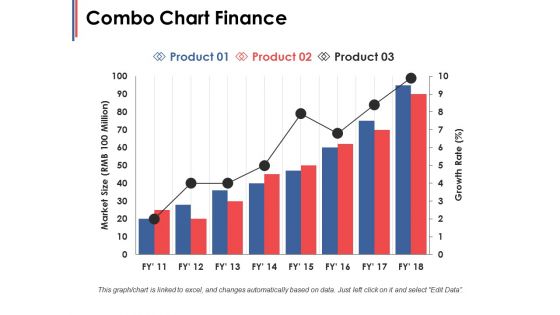
Combo Chart Finance Ppt PowerPoint Presentation Infographic Template Microsoft
This is a combo chart finance ppt powerpoint presentation infographic template microsoft. This is a three stage process. The stages in this process are finance, marketing, management, investment, analysis.
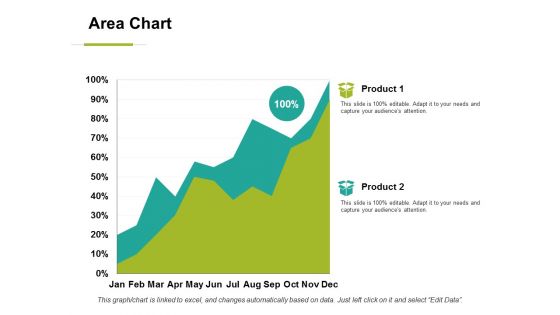
Area Chart Finance Ppt PowerPoint Presentation Professional Display
This is a area chart finance ppt powerpoint presentation professional display. This is a two stage process. The stages in this process are area chart, finance, marketing, management, investment.
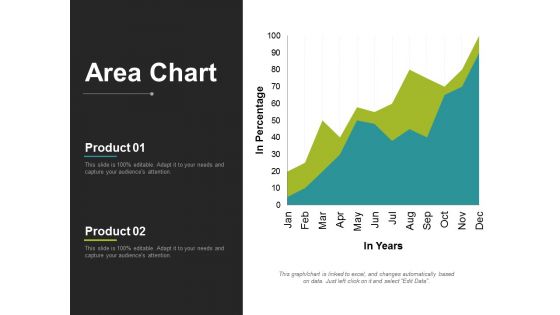
Area Chart Finance Ppt PowerPoint Presentation Gallery Background Designs
This is a area chart finance ppt powerpoint presentation gallery background designs. This is a two stage process. The stages in this process are area chart, finance, marketing, management, investment.
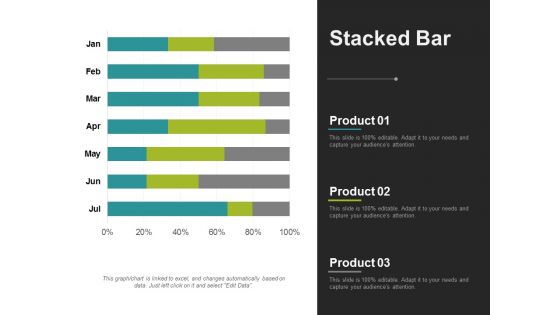
Stacked Bar Finance Ppt PowerPoint Presentation Summary Vector
This is a stacked bar finance ppt powerpoint presentation summary vector. This is a three stage process. The stages in this process are stacked bar, finance, marketing, management, investment.

Area Chart Finance Ppt PowerPoint Presentation Show Brochure
This is a area chart finance ppt powerpoint presentation show brochure. This is a two stage process. The stages in this process are area chart, finance, marketing, management, investment.
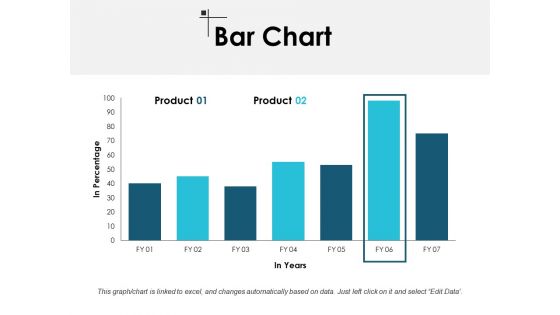
Bar Chart Finance Ppt PowerPoint Presentation Model Master Slide
This is a bar chart finance ppt powerpoint presentation model master slide. This is a two stage process. The stages in this process are finance, marketing, management, investment, analysis.
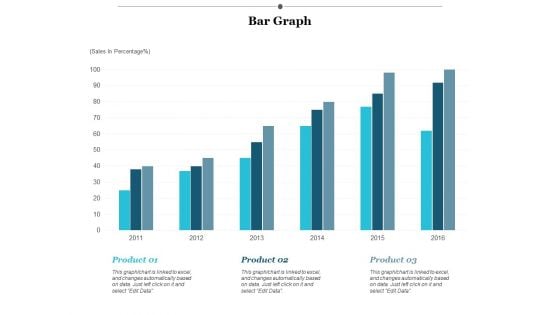
Bar Graph Finance Ppt PowerPoint Presentation Infographics Designs Download
This is a bar graph finance ppt powerpoint presentation infographics designs download. This is a three stage process. The stages in this process are finance, marketing, management, investment, analysis.
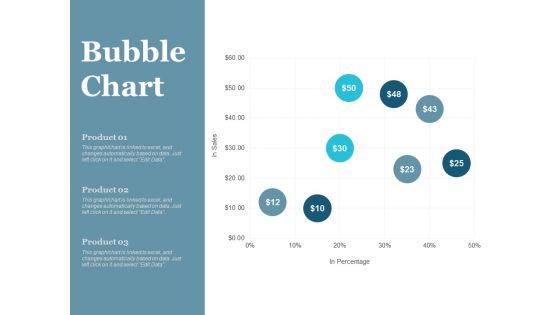
Bubble Chart Finance Ppt PowerPoint Presentation File Master Slide
This is a bubble chart finance ppt powerpoint presentation file master slide. This is a three stage process. The stages in this process are finance, marketing, management, investment, analysis.
Clustered Column Finance Ppt PowerPoint Presentation Icon Graphics Tutorials
This is a clustered column finance ppt powerpoint presentation icon graphics tutorial. This is a three stage process. The stages in this process are finance, marketing, management, investment, analysis.
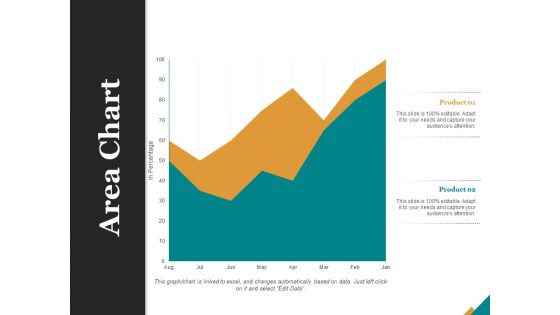
Area Chart Finance Ppt PowerPoint Presentation Summary Design Templates
This is a area chart finance ppt powerpoint presentation summary design templates. This is a two stage process. The stages in this process are finance, marketing, management, investment, analysis.
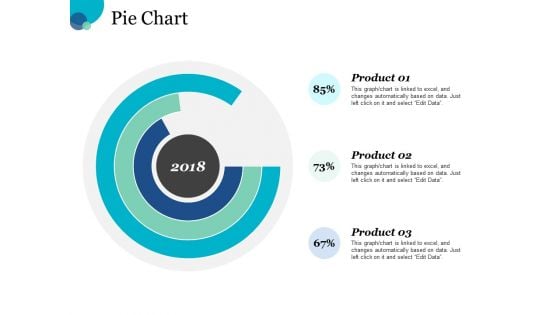
Pie Chart Finance Ppt PowerPoint Presentation Slides Graphic Images
This is a pie chart finance ppt powerpoint presentation slides graphic images. This is a three stage process. The stages in this process are finance, marketing, management, investment, analysis.
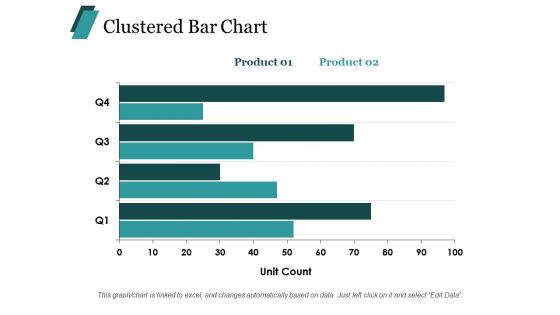
Clustered Bar Chart Finance Ppt PowerPoint Presentation Summary Layouts
This is a clustered bar chart finance ppt powerpoint presentation summary layouts. This is a two stage process. The stages in this process are finance, marketing, management, investment, analysis.
Column Chart Finance Ppt Powerpoint Presentation Infographic Template Icon
This is a column chart finance ppt powerpoint presentation infographic template icon. This is a three stage process. The stages in this process are finance, marketing, management, investment, analysis.
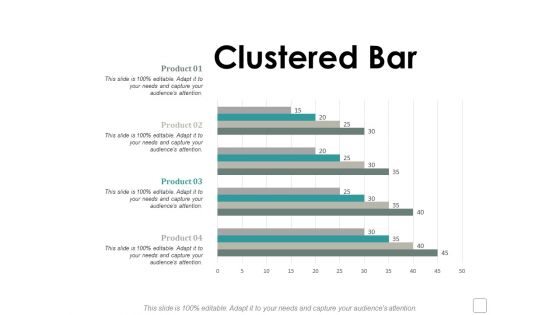
Clustered Bar Finance Ppt Powerpoint Presentation Visual Aids Example File
This is a clustered bar finance ppt powerpoint presentation visual aids example file. This is a four stage process. The stages in this process are finance, marketing, management, investment, analysis.
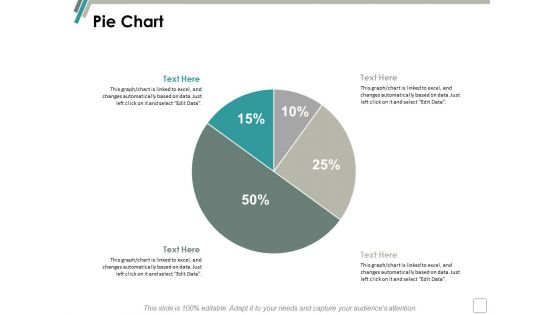
Pie Chart Finance Marketing Ppt Powerpoint Presentation Infographics Background
This is a pie chart finance marketing ppt powerpoint presentation infographics background. This is a two stage process. The stages in this process are finance, marketing, management, investment, analysis.

Stocks Finance Marketing Ppt Powerpoint Presentation Inspiration Graphics Design
This is a stocks finance marketing ppt powerpoint presentation inspiration graphics design. This is a four stage process. The stages in this process are finance, marketing, management, investment, analysis.

Pie Of Pie Finance Marketing Ppt Powerpoint Presentation Infographics Demonstration
This is a pie of pie finance marketing ppt powerpoint presentation infographics demonstration. This is a stage process. The stages in this process are finance, marketing, management, investment, analysis.
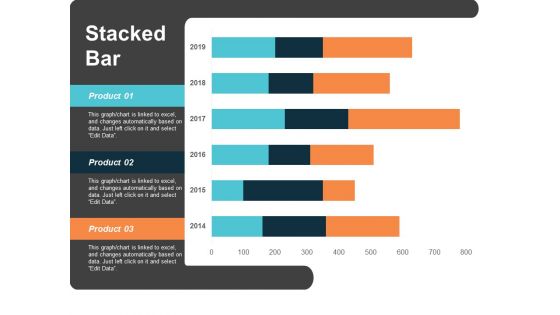
Stacked Bar Finance Marketing Ppt Powerpoint Presentation Summary Graphics
This is a stacked bar finance marketing ppt powerpoint presentation summary graphics. This is a three stage process. The stages in this process are finance, marketing, management, investment, analysis.
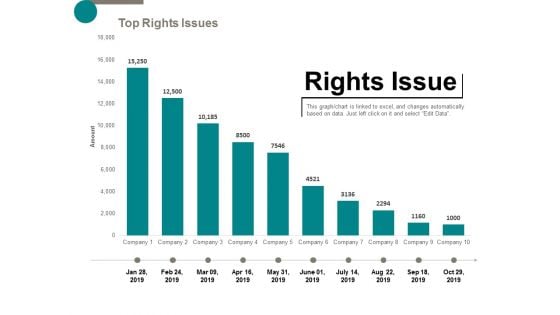
Rights Issue Finance Ppt Powerpoint Presentation Styles Clipart Images
This is a rights issue finance ppt powerpoint presentation styles clipart images. This is a ten stage process. The stages in this process are finance, marketing, management, investment, analysis.

Area Chart Finance Marketing Ppt Powerpoint Presentation Gallery Slides
This is a area chart finance marketing ppt powerpoint presentation gallery slides. This is a three stage process. The stages in this process are finance, marketing, management, investment, analysis.
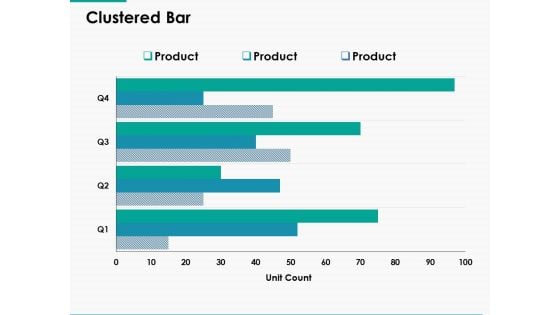
Clustered Bar Finance Marketing Ppt Powerpoint Presentation Summary Graphic Tips
This is a clustered bar finance marketing ppt powerpoint presentation summary graphic tips. This is a three stage process. The stages in this process are finance, marketing, management, investment, analysis.
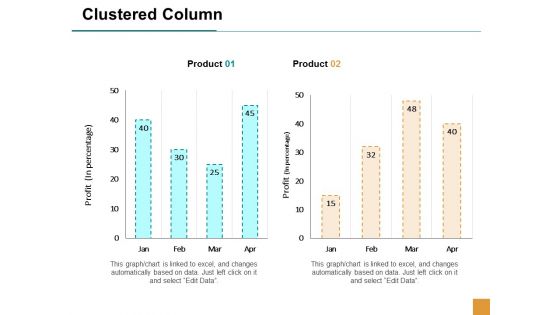
Clustered Column Finance Ppt Powerpoint Presentation Infographic Template Example 2015
This is a clustered column finance ppt powerpoint presentation infographic template example 2015. This is a two stage process. The stages in this process are finance, marketing, management, investment, analysis.
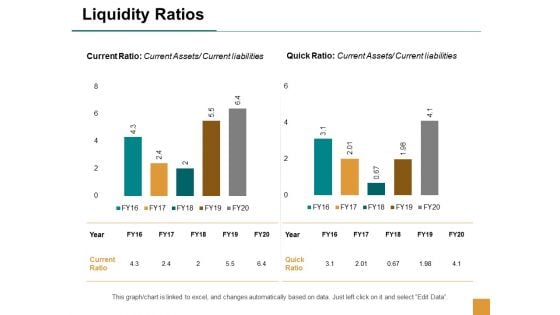
Liquidity Ratios Finance Marketing Ppt Powerpoint Presentation Professional Tips
This is a liquidity ratios finance marketing ppt powerpoint presentation professional tips. This is a two stage process. The stages in this process are finance, marketing, management, investment, analysis.
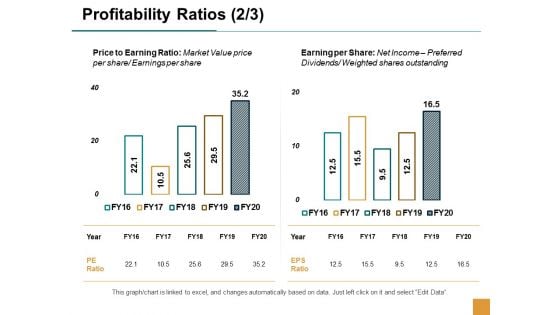
Profitability Ratios Finance Marketing Ppt Powerpoint Presentation Inspiration Design Ideas
This is a profitability ratios finance marketing ppt powerpoint presentation inspiration design ideas. This is a two stage process. The stages in this process are finance, marketing, management, investment, analysis.
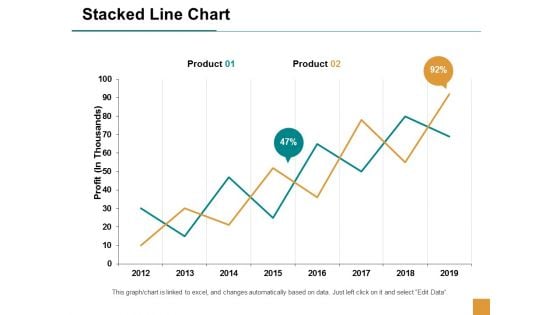
Stacked Line Chart Finance Ppt Powerpoint Presentation Outline Themes
This is a stacked line chart finance ppt powerpoint presentation outline themes. This is a two stage process. The stages in this process are finance, marketing, management, investment, analysis.
Stacked Line Finance Marketing Ppt Powerpoint Presentation Icon Guidelines
This is a stacked line finance marketing ppt powerpoint presentation icon guidelines. This is a three stage process. The stages in this process are finance, marketing, management, investment, analysis.
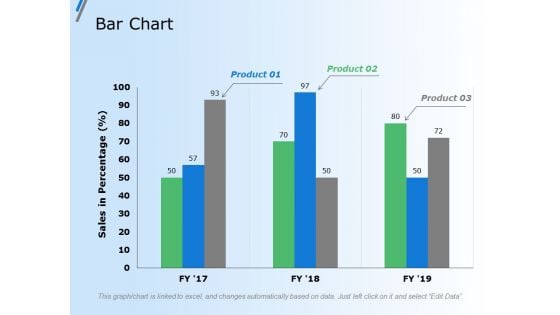
Bar Chart Finance Marketing Ppt Powerpoint Presentation Gallery Grid
This is a bar chart finance marketing ppt powerpoint presentation gallery grid. This is a three stage process. The stages in this process are finance, marketing, management, investment, analysis.
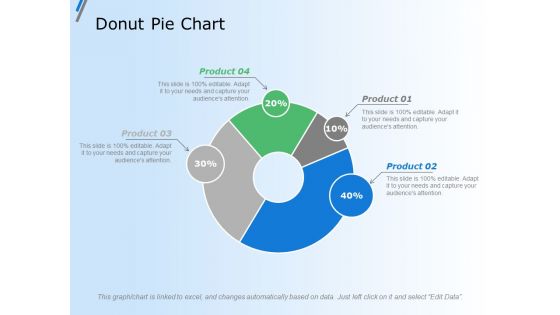
Donut Pie Chart Finance Ppt Powerpoint Presentation Outline Vector
This is a donut pie chart finance ppt powerpoint presentation outline vector. This is a four stage process. The stages in this process are finance, marketing, management, investment, analysis.
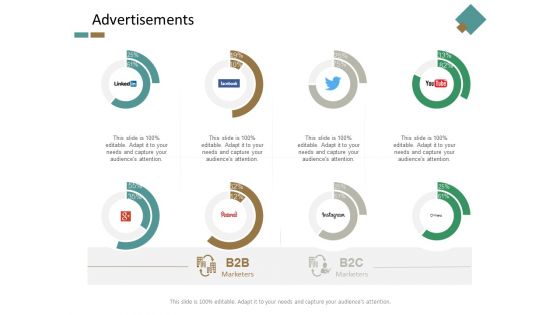
Advertisements Finance Marketing Ppt Powerpoint Presentation Layouts Graphic Tips
This is a advertisements finance marketing ppt powerpoint presentation layouts graphic tips. This is a eight stage process. The stages in this process are finance, marketing, management, investment, analysis.

Pie Chart Finance Ppt Powerpoint Presentation Layouts Design Ideas
This is a pie chart finance ppt powerpoint presentation layouts design ideas. This is a four stage process. The stages in this process are finance, marketing, management, investment, analysis.
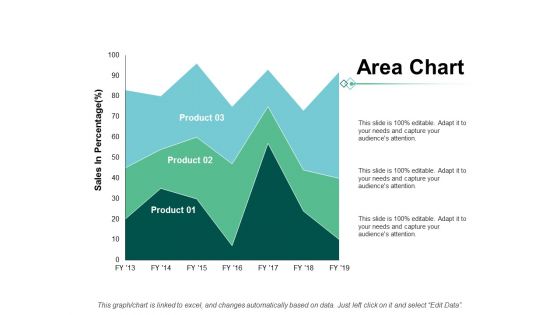
Area Chart Finance Marketing Ppt Powerpoint Presentation Show Grid
This is a area chart finance marketing ppt powerpoint presentation show grid. This is a three stage process. The stages in this process are finance, marketing, management, investment, analysis.
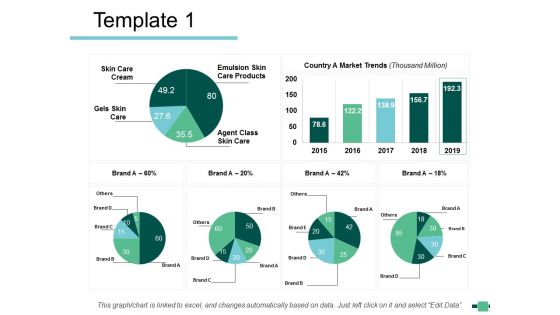
Template 1 Finance Marketing Ppt Powerpoint Presentation File Design Templates
This is a template 1 finance marketing ppt powerpoint presentation file design templates. This is a six stage process. The stages in this process are finance, marketing, management, investment, analysis.
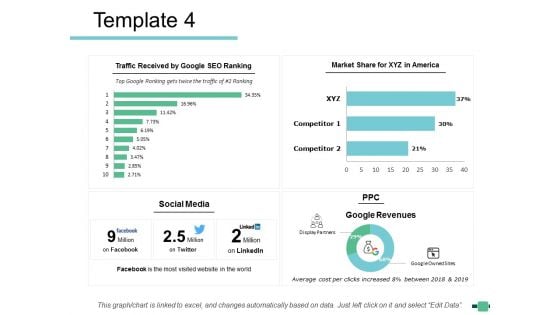
Template 4 Finance Ppt Powerpoint Presentation Styles Example Topics
This is a template 4 finance ppt powerpoint presentation styles example topics. This is a four stage process. The stages in this process are finance, marketing, management, investment, analysis.
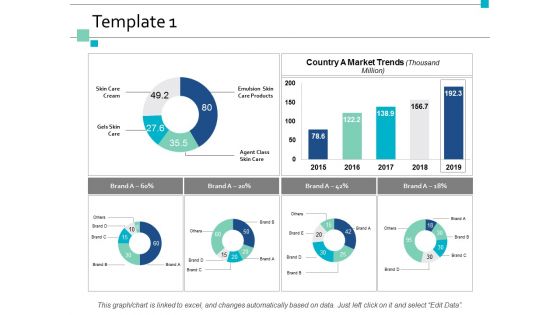
Template 1 Finance Marketing Ppt Powerpoint Presentation Layouts Demonstration
This is a template 1 finance marketing ppt powerpoint presentation layouts demonstration. This is a four stage process. The stages in this process are finance, marketing, management, investment, analysis.
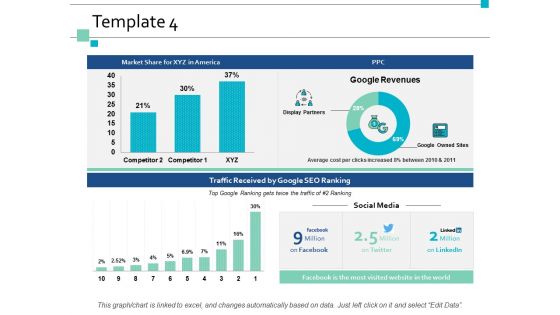
Template 4 Finance Marketing Ppt Powerpoint Presentation Pictures Backgrounds
This is a template 4 finance marketing ppt powerpoint presentation pictures backgrounds. This is a four stage process. The stages in this process are finance, marketing, management, investment, analysis.
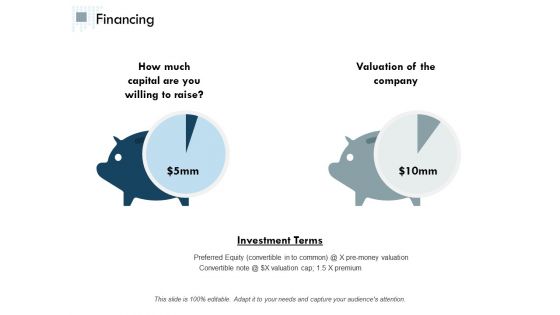
Financing Marketing Analysis Ppt Powerpoint Presentation Gallery Example File
This is a financing marketing analysis ppt powerpoint presentation gallery example file. This is a two stage process. The stages in this process are finance, marketing, management, investment, analysis.
Clustered Bar Chart Finance Ppt Powerpoint Presentation Icon Graphics Template
This is a clustered bar chart finance ppt powerpoint presentation icon graphics template. This is a four stage process. The stages in this process are finance, marketing, management, investment, analysis.
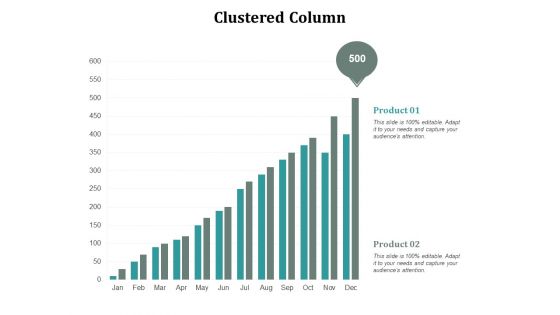
Clustered Column Finance Ppt Powerpoint Presentation Gallery Templates Cpb
This is a clustered column finance ppt powerpoint presentation gallery templates cpb. This is a two stage process. The stages in this process are finance, marketing, management, investment, analysis.
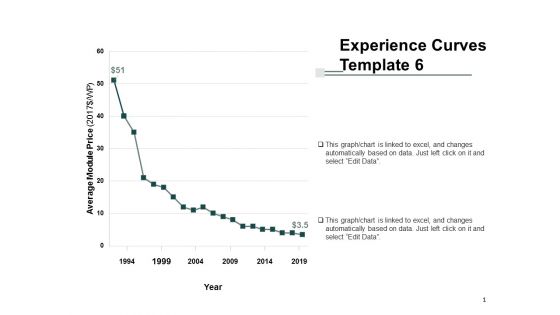
Experience Curves Template Finance Ppt Powerpoint Presentation Gallery Inspiration
This is a experience curves template finance ppt powerpoint presentation gallery inspiration. This is a two stage process. The stages in this process are finance, marketing, management, investment, analysis.

Bar Chart Finance Marketing Ppt PowerPoint Presentation File Good
This is a bar chart finance marketing ppt powerpoint presentation file good. This is a three stage process. The stages in this process are finance, marketing, management, investment, analysis.
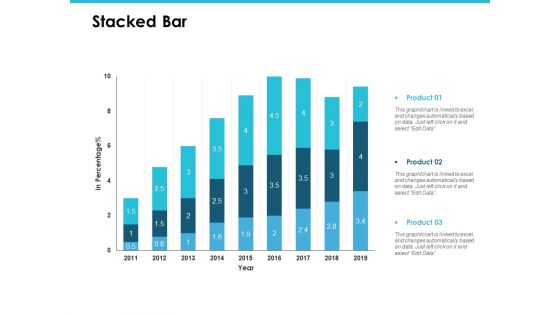
Stacked Bar Finance Marketing Ppt PowerPoint Presentation Portfolio Graphics Pictures
This is a stacked bar finance marketing ppt powerpoint presentation portfolio graphics pictures. This is a three stage process. The stages in this process are finance, marketing, management, investment, analysis.
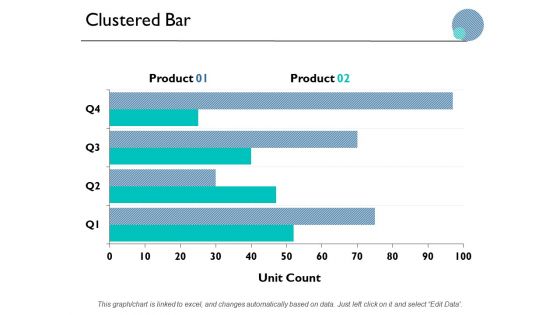
Clustered Bar Finance Marketing Ppt PowerPoint Presentation Inspiration Infographics
This is a clustered bar finance marketing ppt powerpoint presentation inspiration infographics. This is a two stage process. The stages in this process are finance, marketing, management, investment, analysis.
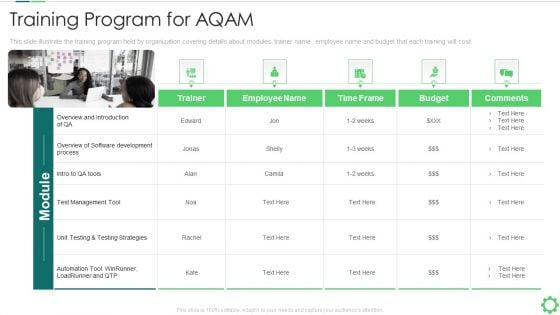
Agile Quality Control Framework IT Training Program For AQAM Guidelines PDF
This slide illustrate the training program held by organization covering details about modules, trainer name , employee name and budget that each training will cost. Presenting agile quality control framework it training program for aqam guidelines pdf to provide visual cues and insights. Share and navigate important information on five stages that need your due attention. This template can be used to pitch topics like software, process, development, management, strategies. In addtion, this PPT design contains high resolution images, graphics, etc, that are easily editable and available for immediate download.
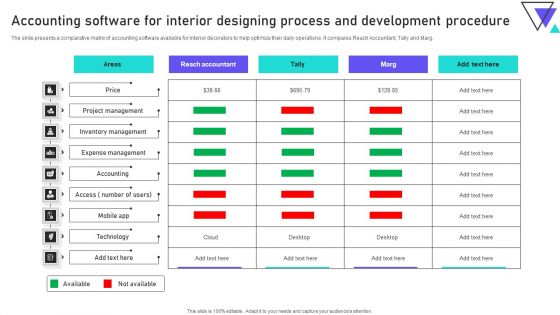
Accounting Software For Interior Designing Process And Development Procedure Introduction PDF
The slide presents a comparative matrix of accounting software available for interior decorators to help optimize their daily operations. It compares Reach Accountant, Tally and Marg. Showcasing this set of slides titled Accounting Software For Interior Designing Process And Development Procedure Introduction PDF. The topics addressed in these templates are Expense Management, Inventory Management, Project Management. All the content presented in this PPT design is completely editable. Download it and make adjustments in color, background, font etc. as per your unique business setting.
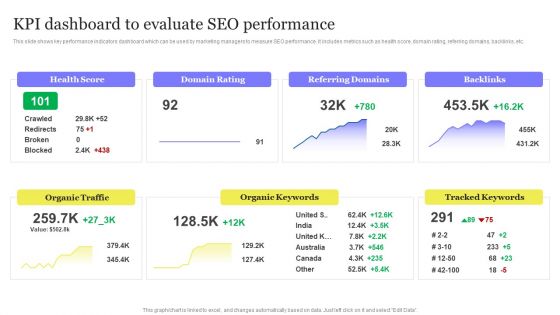
Enhancing Digital Visibility Using SEO Content Strategy KPI Dashboard To Evaluate SEO Performance Diagrams PDF
This slide shows key performance indicators dashboard which can be used by marketing managers to measure SEO performance. It includes metrics such as health score, domain rating, referring domains, backlinks, etc. This Enhancing Digital Visibility Using SEO Content Strategy KPI Dashboard To Evaluate SEO Performance Diagrams PDF is perfect for any presentation, be it in front of clients or colleagues. It is a versatile and stylish solution for organizing your meetings. The Enhancing Digital Visibility Using SEO Content Strategy KPI Dashboard To Evaluate SEO Performance Diagrams PDF features a modern design for your presentation meetings. The adjustable and customizable slides provide unlimited possibilities for acing up your presentation. Slidegeeks has done all the homework before launching the product for you. So, do not wait, grab the presentation templates today

Implementing Advanced Service Help Desk Administration Program Action Plan To Handle Numerous Types Of Service Desk Tickets Information PDF
This slide illustrates action plan to manage multiple types of service desk tickets. It provides information about service request, incident, problem and change request tickets along with software, hardware, service agent, etc. Boost your pitch with our creative Implementing Advanced Service Help Desk Administration Program Action Plan To Handle Numerous Types Of Service Desk Tickets Information PDF. Deliver an awe-inspiring pitch that will mesmerize everyone. Using these presentation templates you will surely catch everyones attention. You can browse the ppts collection on our website. We have researchers who are experts at creating the right content for the templates. So you dont have to invest time in any additional work. Just grab the template now and use them.
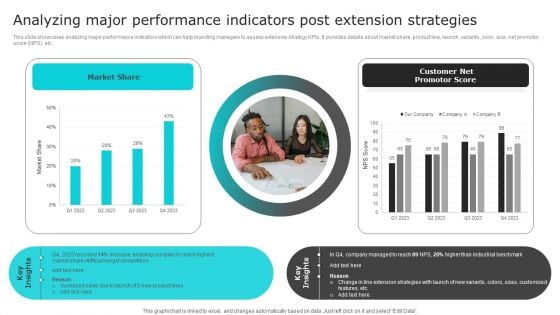
Nike Brand Expansion Analyzing Major Performance Indicators Post Extension Strategies Rules PDF
This slide showcases analyzing major performance indicators which can help branding managers to assess extension strategy KPIs. It provides details about market share, product line, launch, variants, color, size, net promotor score NPS, etc. Formulating a presentation can take up a lot of effort and time, so the content and message should always be the primary focus. The visuals of the PowerPoint can enhance the presenters message, so our Nike Brand Expansion Analyzing Major Performance Indicators Post Extension Strategies Rules PDF was created to help save time. Instead of worrying about the design, the presenter can concentrate on the message while our designers work on creating the ideal templates for whatever situation is needed. Slidegeeks has experts for everything from amazing designs to valuable content, we have put everything into Nike Brand Expansion Analyzing Major Performance Indicators Post Extension Strategies Rules PDF.
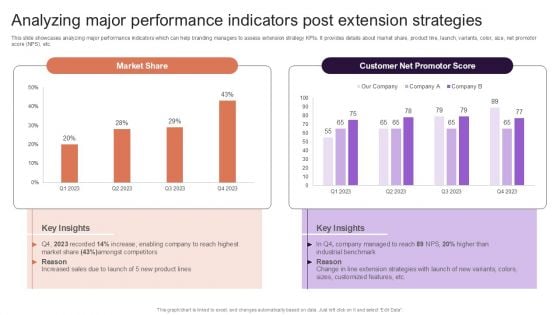
Implementing Brand Extension Initiatives For Apple Company Analyzing Major Performance Indicators Post Extension Topics PDF
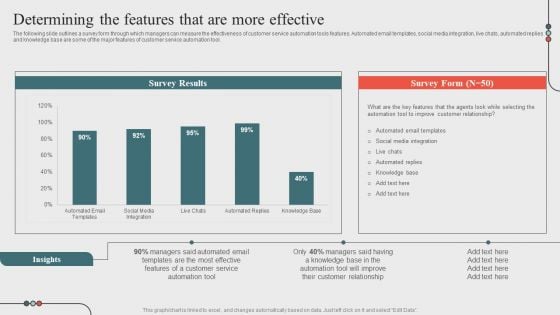
Determining The Features That Are More Effectiveoptimizing Business Processes Through Automation Template PDF
The following slide outlines a survey form through which managers can measure the effectiveness of customer service automation tools features. Automated email templates, social media integration, live chats, automated replies and knowledge base are some of the major features of customer service automation tool. Create an editable Determining The Features That Are More Effectiveoptimizing Business Processes Through Automation Template PDF that communicates your idea and engages your audience. Whether youre presenting a business or an educational presentation, pre designed presentation templates help save time. Determining The Features That Are More Effectiveoptimizing Business Processes Through Automation Template PDF is highly customizable and very easy to edit, covering many different styles from creative to business presentations. Slidegeeks has creative team members who have crafted amazing templates. So, go and get them without any delay.
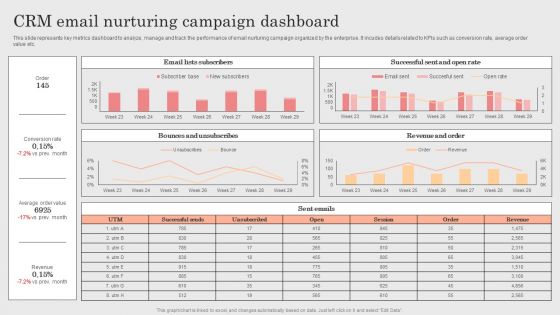
Integrating CRM Solution To Acquire Potential Customers CRM Email Nurturing Campaign Dashboard Template PDF
This slide represents key metrics dashboard to analyze, manage and track the performance of email nurturing campaign organized by the enterprise. It incudes details related to KPIs such as conversion rate, average order value etc. If you are looking for a format to display your unique thoughts, then the professionally designed Integrating CRM Solution To Acquire Potential Customers CRM Email Nurturing Campaign Dashboard Template PDF is the one for you. You can use it as a Google Slides template or a PowerPoint template. Incorporate impressive visuals, symbols, images, and other charts. Modify or reorganize the text boxes as you desire. Experiment with shade schemes and font pairings. Alter, share or cooperate with other people on your work. Download Integrating CRM Solution To Acquire Potential Customers CRM Email Nurturing Campaign Dashboard Template PDF and find out how to give a successful presentation. Present a perfect display to your team and make your presentation unforgettable.
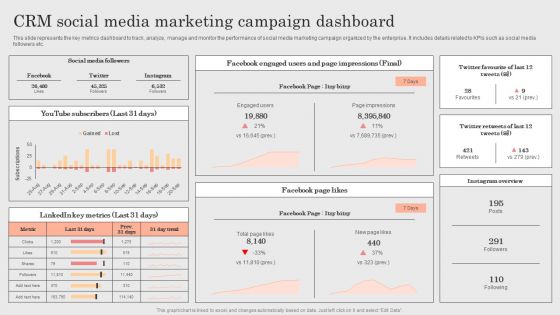
Integrating CRM Solution To Acquire Potential Customers CRM Social Media Marketing Campaign Dashboard Template PDF
This slide represents the key metrics dashboard to track, analyze, manage and monitor the performance of social media marketing campaign organized by the enterprise. It includes details related to KPIs such as social media followers etc. Formulating a presentation can take up a lot of effort and time, so the content and message should always be the primary focus. The visuals of the PowerPoint can enhance the presenters message, so our Integrating CRM Solution To Acquire Potential Customers CRM Social Media Marketing Campaign Dashboard Template PDF was created to help save time. Instead of worrying about the design, the presenter can concentrate on the message while our designers work on creating the ideal templates for whatever situation is needed. Slidegeeks has experts for everything from amazing designs to valuable content, we have put everything into Integrating CRM Solution To Acquire Potential Customers CRM Social Media Marketing Campaign Dashboard Template PDF
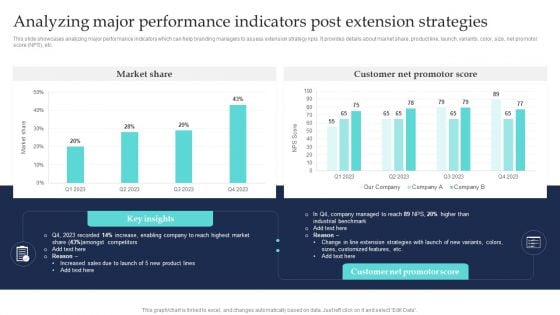
Commodity Line Extension Techniques Analyzing Major Performance Indicators Post Slides PDF
This slide showcases analyzing major performance indicators which can help branding managers to assess extension strategy kpis. It provides details about market share, product line, launch, variants, color, size, net promotor score NPS, etc. Slidegeeks is here to make your presentations a breeze with Commodity Line Extension Techniques Analyzing Major Performance Indicators Post Slides PDF With our easy-to-use and customizable templates, you can focus on delivering your ideas rather than worrying about formatting. With a variety of designs to choose from, youre sure to find one that suits your needs. And with animations and unique photos, illustrations, and fonts, you can make your presentation pop. So whether youre giving a sales pitch or presenting to the board, make sure to check out Slidegeeks first.
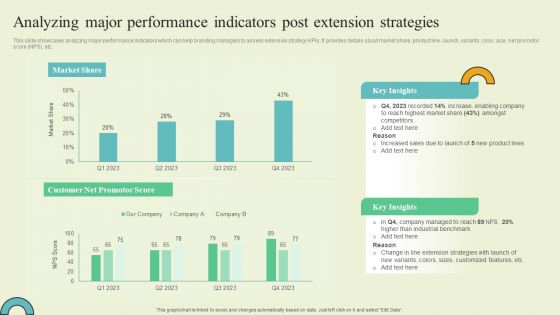
Extending Brand To Introduce New Commodities And Offerings Analyzing Major Performance Indicators Demonstration PDF
This slide showcases analyzing major performance indicators which can help branding managers to assess extension strategy KPIs. It provides details about market share, product line, launch, variants, color, size, net promotor score NPS, etc. Create an editable Extending Brand To Introduce New Commodities And Offerings Analyzing Major Performance Indicators Demonstration PDF that communicates your idea and engages your audience. Whether youre presenting a business or an educational presentation, pre designed presentation templates help save time. Extending Brand To Introduce New Commodities And Offerings Analyzing Major Performance Indicators Demonstration PDF is highly customizable and very easy to edit, covering many different styles from creative to business presentations. Slidegeeks has creative team members who have crafted amazing templates. So, go and get them without any delay.
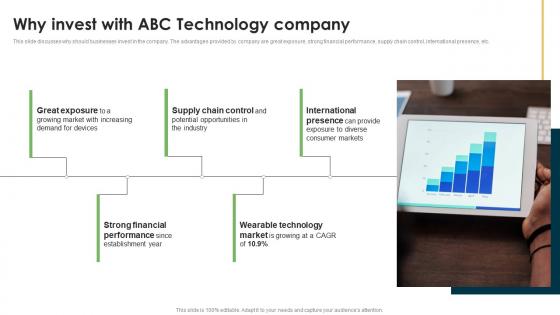
Why Invest With Abc Technology Company Wearable Technology Funding Diagrams PDF
This slide discusses why should businesses invest in the company. The advantages provided by company are great exposure, strong financial performance, supply chain control, international presence, etc. Coming up with a presentation necessitates that the majority of the effort goes into the content and the message you intend to convey. The visuals of a PowerPoint presentation can only be effective if it supplements and supports the story that is being told. Keeping this in mind our experts created Why Invest With Abc Technology Company Wearable Technology Funding Diagrams PDF to reduce the time that goes into designing the presentation. This way, you can concentrate on the message while our designers take care of providing you with the right template for the situation. This slide discusses why should businesses invest in the company. The advantages provided by company are great exposure, strong financial performance, supply chain control, international presence, etc.
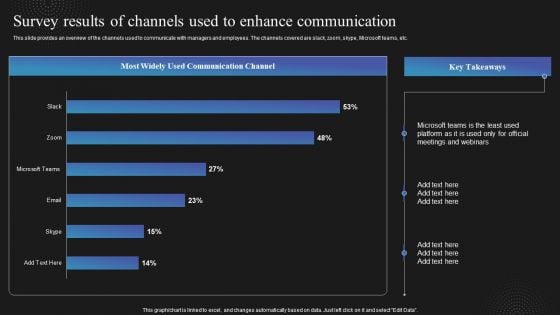
Techniques To Enhance Employee Survey Results Of Channels Used To Enhance Clipart PDF
This slide provides an overview of the channels used to communicate with managers and employees. The channels covered are slack, zoom, skype, Microsoft teams, etc. This Techniques To Enhance Employee Survey Results Of Channels Used To Enhance Clipart PDF is perfect for any presentation, be it in front of clients or colleagues. It is a versatile and stylish solution for organizing your meetings. The Techniques To Enhance Employee Survey Results Of Channels Used To Enhance Clipart PDF features a modern design for your presentation meetings. The adjustable and customizable slides provide unlimited possibilities for acing up your presentation. Slidegeeks has done all the homework before launching the product for you. So, dont wait, grab the presentation templates today.
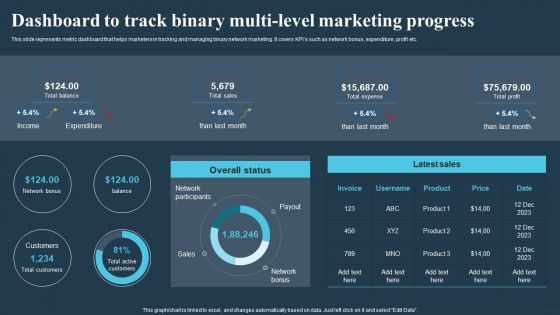
Comprehensive Guide For Multi Level Dashboard To Track Binary Multi Level Marketing Formats PDF
This slide represents metric dashboard that helps marketers in tracking and managing binary network marketing. It covers KPIs such as network bonus, expenditure, profit etc. This Comprehensive Guide For Multi Level Dashboard To Track Binary Multi Level Marketing Formats PDF is perfect for any presentation, be it in front of clients or colleagues. It is a versatile and stylish solution for organizing your meetings. The Comprehensive Guide For Multi Level Dashboard To Track Binary Multi Level Marketing Formats PDF features a modern design for your presentation meetings. The adjustable and customizable slides provide unlimited possibilities for acing up your presentation. Slidegeeks has done all the homework before launching the product for you. So, dont wait, grab the presentation templates today.
How Overall Brand Reputation Can Be Improved Comprehensive Guide For Brand Recognition Icons PDF
This slide provides information regarding overall brand reputation improvement by highlighting its rile in consumer loyalty, initiatives to manage brand reputation and statistics associated with it. This How Overall Brand Reputation Can Be Improved Comprehensive Guide For Brand Recognition Icons PDF is perfect for any presentation, be it in front of clients or colleagues. It is a versatile and stylish solution for organizing your meetings. The How Overall Brand Reputation Can Be Improved Comprehensive Guide For Brand Recognition Icons PDF features a modern design for your presentation meetings. The adjustable and customizable slides provide unlimited possibilities for acing up your presentation. Slidegeeks has done all the homework before launching the product for you. So, do not wait, grab the presentation templates today
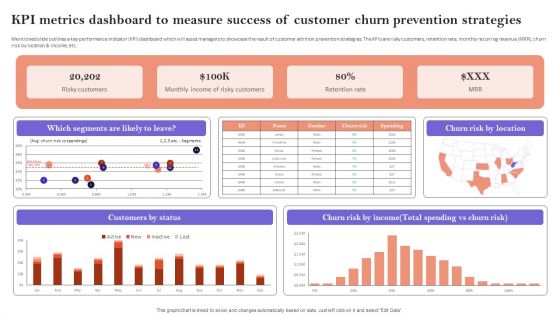
KPI Metrics Dashboard To Measure Success Of Customer Churn Prevention Strategies Diagrams PDF
Mentioned slide outlines a key performance indicator KPI dashboard which will assist managers to showcase the result of customer attrition prevention strategies. The KPIs are risky customers, retention rate, monthly recurring revenue MRR, churn risk by location and income, etc. This KPI Metrics Dashboard To Measure Success Of Customer Churn Prevention Strategies Diagrams PDF is perfect for any presentation, be it in front of clients or colleagues. It is a versatile and stylish solution for organizing your meetings. The KPI Metrics Dashboard To Measure Success Of Customer Churn Prevention Strategies Diagrams PDF features a modern design for your presentation meetings. The adjustable and customizable slides provide unlimited possibilities for acing up your presentation. Slidegeeks has done all the homework before launching the product for you. So, do not wait, grab the presentation templates today
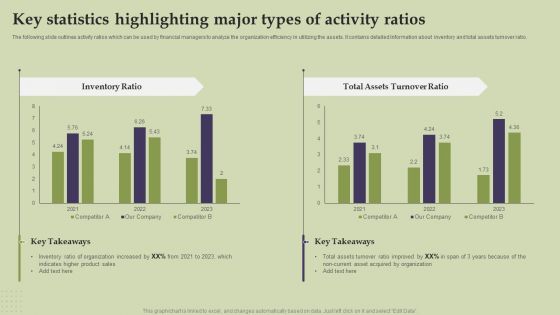
Methods And Approaches To Assess Key Statistics Highlighting Major Types Of Activity Ratios Download PDF
The following slide outlines activity ratios which can be used by financial managers to analyze the organization efficiency in utilizing the assets. It contains detailed Information about inventory and total assets turnover ratio. Retrieve professionally designed Methods And Approaches To Assess Key Statistics Highlighting Major Types Of Activity Ratios Download PDF to effectively convey your message and captivate your listeners. Save time by selecting pre-made slideshows that are appropriate for various topics, from business to educational purposes. These themes come in many different styles, from creative to corporate, and all of them are easily adjustable and can be edited quickly. Access them as PowerPoint templates or as Google Slides themes. You do not have to go on a hunt for the perfect presentation because Slidegeeks got you covered from everywhere.
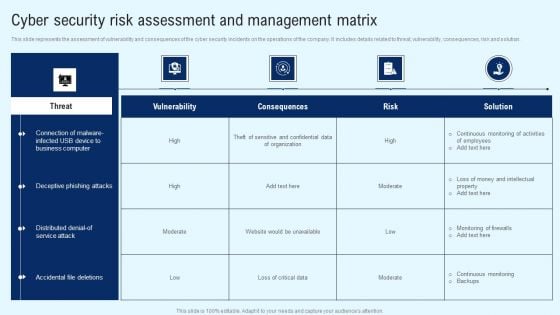
Implementing Cyber Security Incident Cyber Security Risk Assessment And Matrix Introduction PDF
This slide represents the dashboard to assess, analyze and manage the cyber security risks within an organization. It includes details related to directories with direct access, inactive accounts etc. Get a simple yet stunning designed Implementing Cyber Security Incident Cyber Security Risk Assessment And Matrix Introduction PDF. It is the best one to establish the tone in your meetings. It is an excellent way to make your presentations highly effective. So, download this PPT today from Slidegeeks and see the positive impacts. Our easy to edit Implementing Cyber Security Incident Cyber Security Risk Assessment And Matrix Introduction PDF can be your go to option for all upcoming conferences and meetings. So, what are you waiting for Grab this template today.


 Continue with Email

 Home
Home


