Cost Management
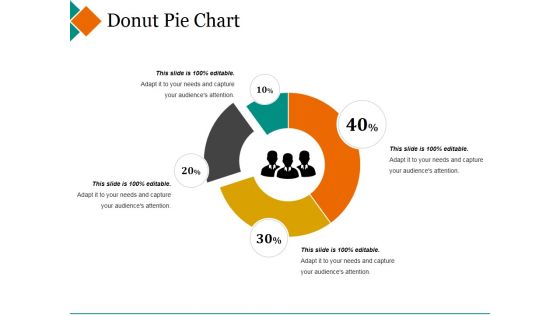
Donut Pie Chart Ppt PowerPoint Presentation Pictures Design Inspiration
This is a donut pie chart ppt powerpoint presentation pictures design inspiration. This is a four stage process. The stages in this process are maximum, donut, minimum, percentage, finance.
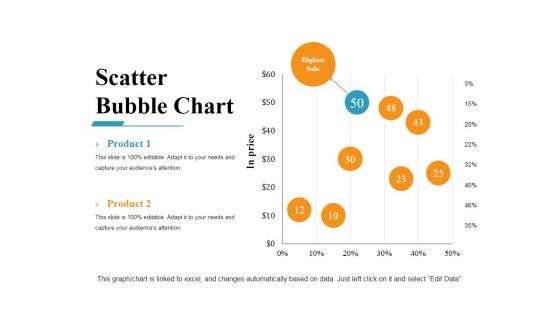
Scatter Bubble Chart Ppt PowerPoint Presentation Gallery Example Introduction
This is a scatter bubble chart ppt powerpoint presentation gallery example introduction. This is a eight stage process. The stages in this process are business, marketing, finance, bubble, scatter.
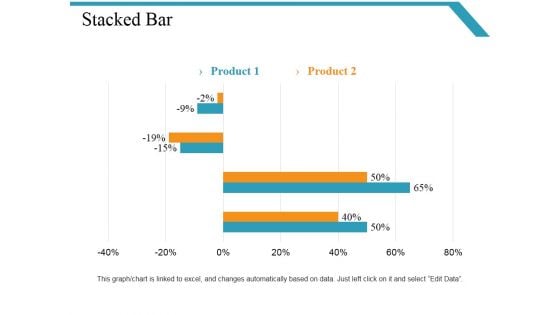
Stacked Bar Ppt PowerPoint Presentation Infographic Template Infographic Template
This is a stacked bar ppt powerpoint presentation infographic template infographic template. This is a four stage process. The stages in this process are business, marketing, finance, slide bar, graph.
Stacked Line With Markers Ppt PowerPoint Presentation Icon Format
This is a stacked line with markers ppt powerpoint presentation icon format. This is a three stage process. The stages in this process are business, marketing, finance, line, graph.
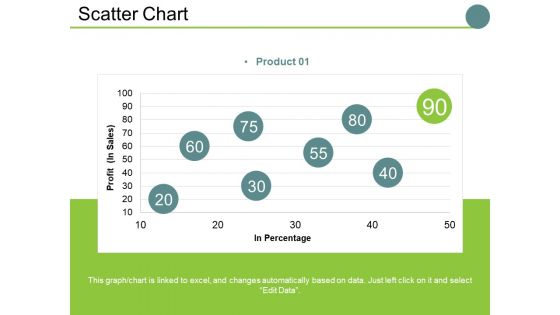
Scatter Chart Ppt PowerPoint Presentation Slides Examples
This is a scatter chart ppt powerpoint presentation slides examples. This is a one stage process. The stages in this process are profit , in percentage, business, marketing, finance, graph.
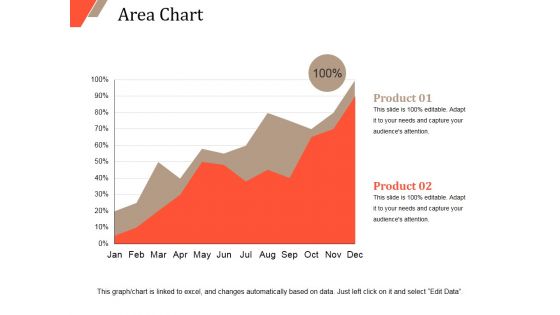
Area Chart Ppt PowerPoint Presentation Inspiration Clipart Images
This is a area chart ppt powerpoint presentation inspiration clipart images. This is a two stage process. The stages in this process are area chart, growth, finance, business, strategy.
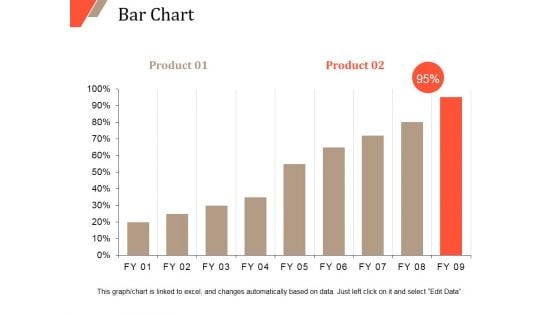
Bar Chart Ppt PowerPoint Presentation Outline Infographics
This is a bar chart ppt powerpoint presentation outline infographics. This is a two stage process. The stages in this process are bar chart, finance, marketing, strategy, analysis, business.
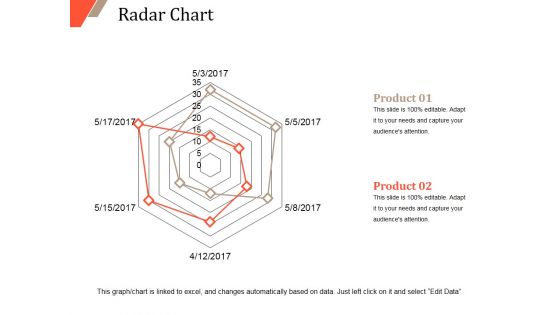
Radar Chart Ppt PowerPoint Presentation Portfolio Design Templates
This is a radar chart ppt powerpoint presentation portfolio design templates. This is a two stage process. The stages in this process are radar chart, product, finance, marketing, strategy, business.
Stacked Line Ppt PowerPoint Presentation Icon Format Ideas
This is a stacked line ppt powerpoint presentation icon format ideas. This is a three stage process. The stages in this process are product, in percentage, stacked line, finance.
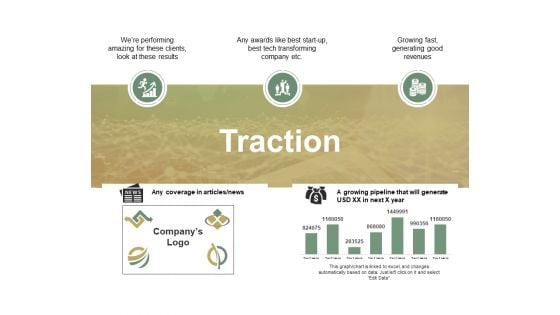
Traction Ppt PowerPoint Presentation Layouts Portrait
This is a traction ppt powerpoint presentation layouts portrait. This is a five stage process. The stages in this process are any coverage in articles news, growing pipeline that will generate usd xx in next x year, business, finance, marketing.
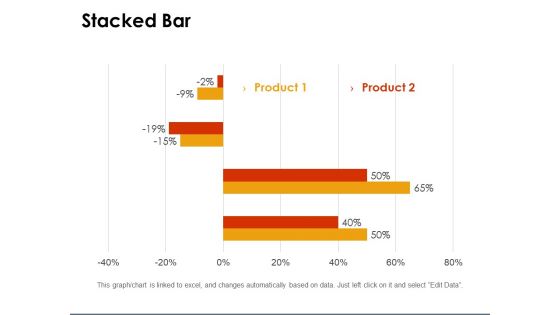
Stacked Bar Template 1 Ppt PowerPoint Presentation Gallery Clipart
This is a stacked bar template 1 ppt powerpoint presentation gallery clipart. This is a two stage process. The stages in this process are percentage, graph, business, marketing, finance.
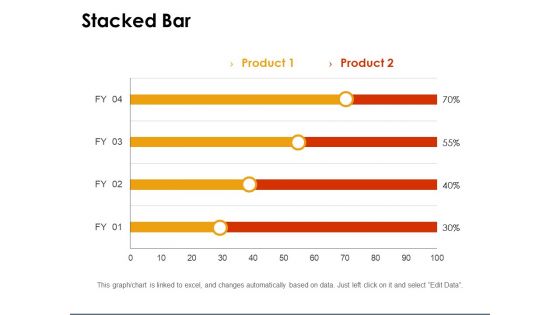
Stacked Bar Template 2 Ppt PowerPoint Presentation Infographics Graphics Design
This is a stacked bar template 2 ppt powerpoint presentation infographics graphics design. This is a two stage process. The stages in this process are percentage, business, marketing, finance.
Traction Ppt PowerPoint Presentation Icon Example Introduction
This is a traction ppt powerpoint presentation icon example introduction. This is a three stage process. The stages in this process are any coverage in articles news, company s logo, growing fast, generating good revenues, business, finance.
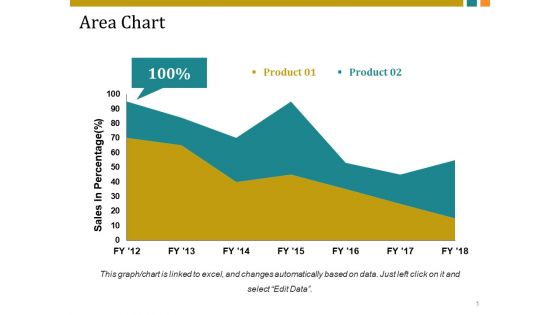
Area Chart Ppt PowerPoint Presentation Professional Brochure
This is a area chart ppt powerpoint presentation professional brochure. This is a two stage process. The stages in this process are sales in percentage, business, marketing, finance, graph.

Bar Chart Ppt PowerPoint Presentation Portfolio Diagrams
This is a bar chart ppt powerpoint presentation portfolio diagrams. This is a three stage process. The stages in this process are sales in percentage, business, marketing, graph, finance.
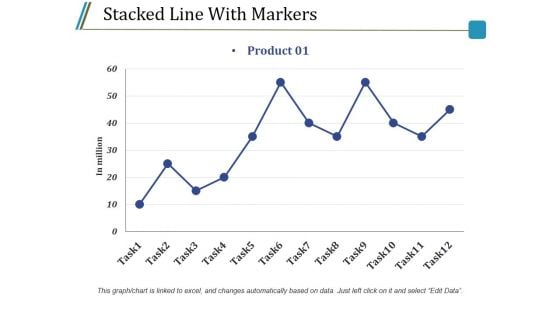
Stacked Line With Markers Ppt PowerPoint Presentation Infographic Template Graphics Example
This is a stacked line with markers ppt powerpoint presentation infographic template graphics example. This is a one stage process. The stages in this process are in million, task, product, finance, line graph.
Brand Tracking Info Graphics Ppt PowerPoint Presentation Infographic Template Graphics Download
This is a brand tracking info graphics ppt powerpoint presentation infographic template graphics download. This is a four stage process. The stages in this process are business, marketing, finance, strategy, icons.
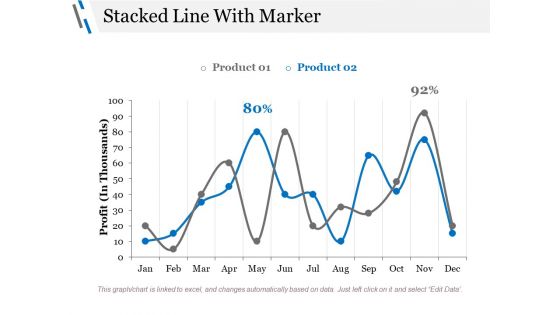
Stacked Line With Marker Ppt PowerPoint Presentation Styles Graphics Design
This is a stacked line with marker ppt powerpoint presentation styles graphics design. This is a three stage process. The stages in this process are profit, business, marketing, finance, percentage.
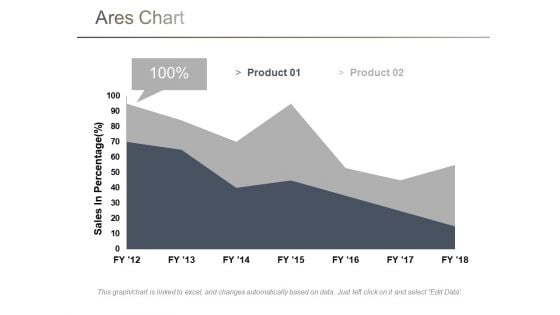
Area Chart Ppt PowerPoint Presentation Model Influencers
This is a area chart ppt powerpoint presentation model influencers. This is a two stage process. The stages in this process are sales in percentage, chart, business, marketing, finance.
Brand Tracking Info Graphics Ppt PowerPoint Presentation Slides Inspiration
This is a brand tracking info graphics ppt powerpoint presentation slides inspiration. This is a four stage process. The stages in this process are finance, marketing, percentage, business, strategy.
Brand Tracking Info Graphics Ppt PowerPoint Presentation Model Example
This is a brand tracking info graphics ppt powerpoint presentation model example. This is a four stage process. The stages in this process are finance, marketing, percentage, business, icons.
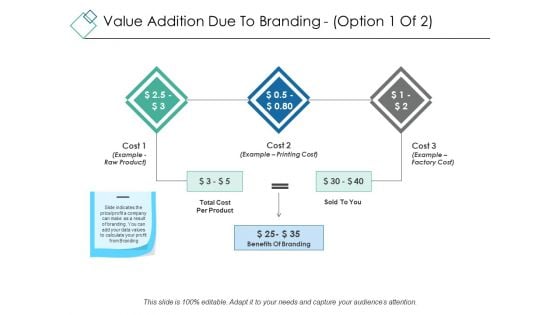
Value Addition Due To Branding Template 1 Ppt PowerPoint Presentation Portfolio Visual Aids
This is a value addition due to branding template 1 ppt powerpoint presentation portfolio visual aids. This is a three stage process. The stages in this process are business, marketing, finance, strategy benefits of branding.
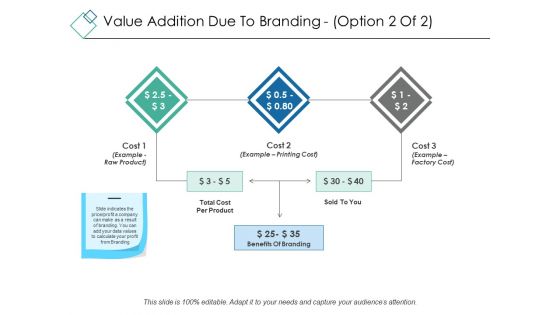
Value Addition Due To Branding Template 2 Ppt PowerPoint Presentation Ideas Sample
This is a value addition due to branding template 2 ppt powerpoint presentation ideas sample. This is a three stage process. The stages in this process are business, marketing, finance, strategy benefits of branding.
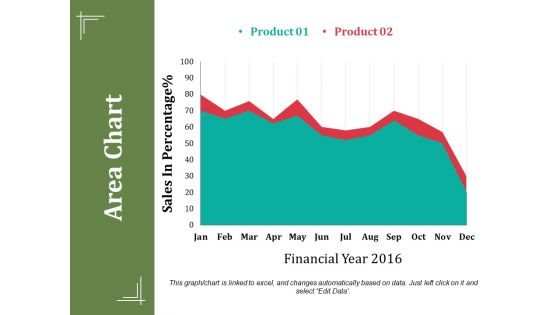
Area Chart Ppt PowerPoint Presentation Summary Show
This is a area chart ppt powerpoint presentation summary show. This is a two stage process. The stages in this process are sales in percentage, financial year, business, marketing, finance.
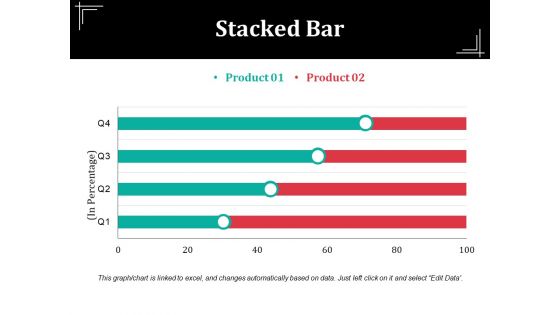
Stacked Bar Template Ppt PowerPoint Presentation Summary Visual Aids
This is a stacked bar template ppt powerpoint presentation summary visual aids. This is a three stage process. The stages in this process are unit count, business, marketing, finance, graph.
Brand Tracking Info Graphics Ppt PowerPoint Presentation Portfolio Sample
This is a brand tracking info graphics ppt powerpoint presentation portfolio sample. This is a four stage process. The stages in this process are business, marketing, finance, strategy, planning.
Scatter Chart Template 2 Ppt PowerPoint Presentation Slides Icons
This is a scatter chart template 2 ppt powerpoint presentation slides icons. This is a two stage process. The stages in this process are business, marketing, graph, in percentage, finance.
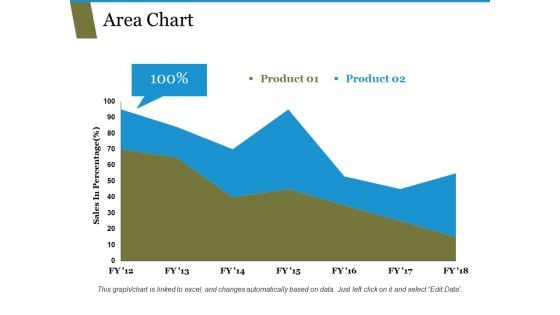
Area Chart Ppt PowerPoint Presentation Portfolio Templates
This is a area chart ppt powerpoint presentation portfolio templates. This is a two stage process. The stages in this process are sales in percentage, chart, business, marketing, finance.
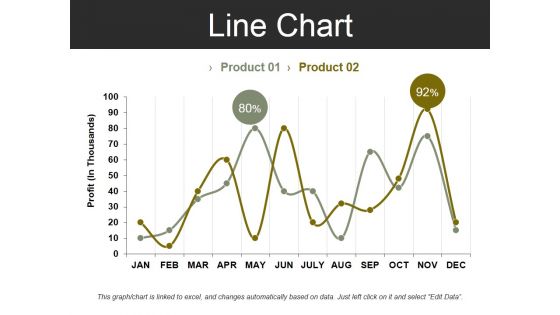
Line Chart Template 2 Ppt PowerPoint Presentation Summary Design Inspiration
This is a line chart template 2 ppt powerpoint presentation summary design inspiration. This is a two stage process. The stages in this process are profit, business, marketing, finance, chart.
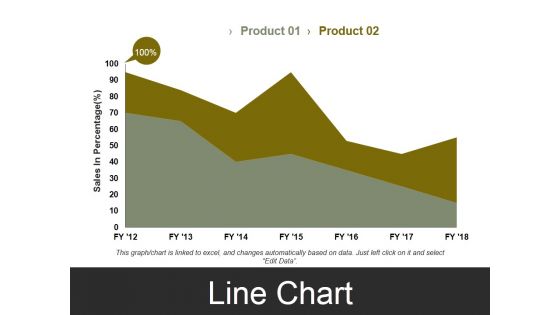
Line Chart Template 3 Ppt PowerPoint Presentation Styles Visual Aids
This is a line chart template 3 ppt powerpoint presentation styles visual aids. This is a two stage process. The stages in this process are sales in percentage, business, marketing, finance, graph.
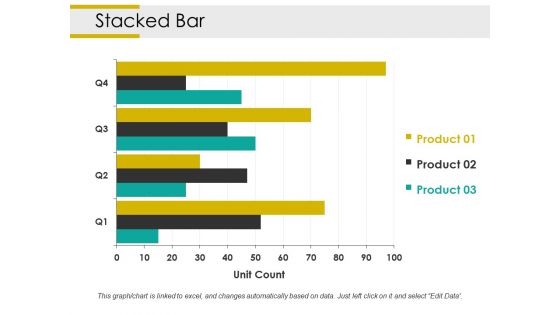
Stacked Bar Ppt PowerPoint Presentation Styles Slide Portrait
This is a stacked bar ppt powerpoint presentation styles slide portrait. This is a three stage process. The stages in this process are unit count, business, marketing, strategy, graph, finance.
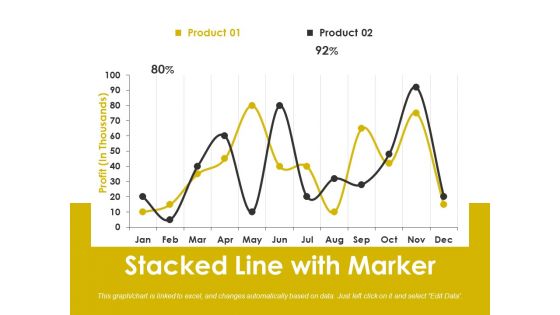
Stacked Line With Marker Ppt PowerPoint Presentation Slides File Formats
This is a stacked line with marker ppt powerpoint presentation slides file formats. This is a two stage process. The stages in this process are business, marketing, strategy, graph, finance, percentage.
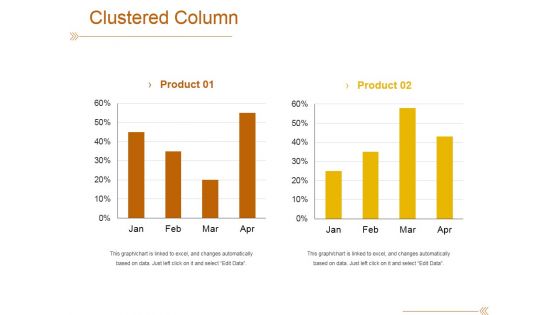
Clustered Column Template 1 Ppt PowerPoint Presentation Outline File Formats
This is a clustered column template 1 ppt powerpoint presentation outline file formats. This is a two stage process. The stages in this process are product, bar graph, success, growth, finance.
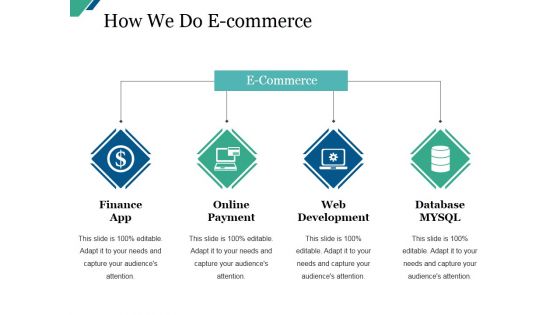
How We Do Ecommerce Ppt PowerPoint Presentation Slides Deck
This is a how we do ecommerce ppt powerpoint presentation slides deck. This is a four stage process. The stages in this process are finance app, online payment, web development, database mysql.
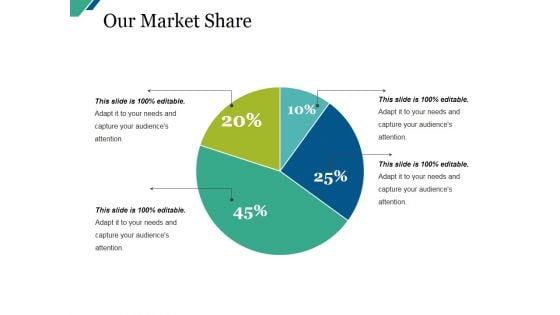
Our Market Share Ppt PowerPoint Presentation Portfolio Example Introduction
This is a our market share ppt powerpoint presentation portfolio example introduction. This is a four stage process. The stages in this process are business, marketing, pie, finance, percentage.
Bar Chart Ppt PowerPoint Presentation Icon Layout
This is a bar chart ppt powerpoint presentation icon layout. This is a one stage process. The stages in this process are sales in percentage, financial years, bar chart, finance, marketing.
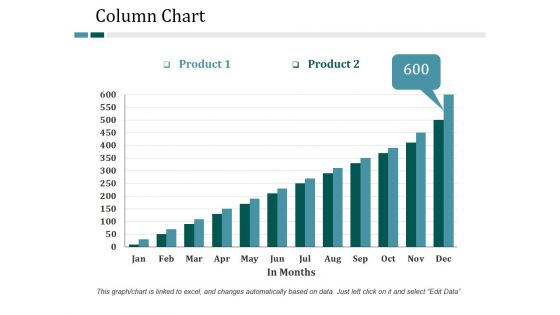
Column Chart Ppt PowerPoint Presentation File Show
This is a column chart ppt powerpoint presentation file show. This is a two stage process. The stages in this process are column chart, finance, marketing, growth, strategy, business.
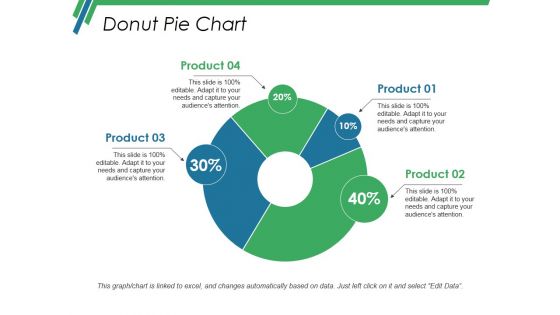
Donut Pie Chart Ppt PowerPoint Presentation Infographic Template Vector
This is a donut pie chart ppt powerpoint presentation infographic template vector. This is a four stage process. The stages in this process are donut pie chart, finance, analysis, business, strategy.
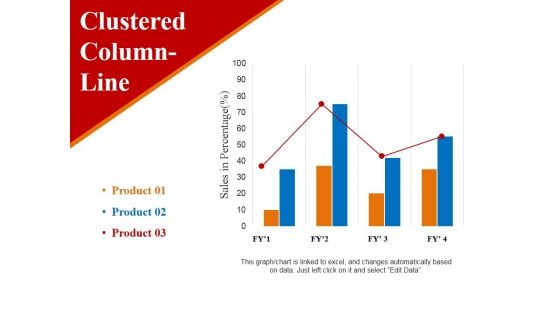
clustered column line ppt powerpoint presentation ideas example
This is a clustered column line ppt powerpoint presentation ideas example. This is a three stage process. The stages in this process are sales in percentage, business, marketing, finance, graph.
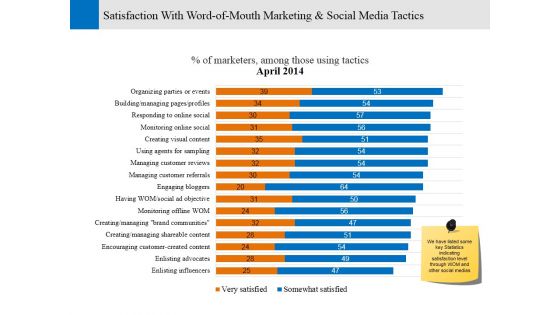
Satisfaction With Word Of Mouth Marketing And Social Media Tactics Ppt PowerPoint Presentation Styles Show
This is a satisfaction with word of mouth marketing and social media tactics ppt powerpoint presentation styles show. This is a two stage process. The stages in this process are business, marketing, finance, strategy, analysis.
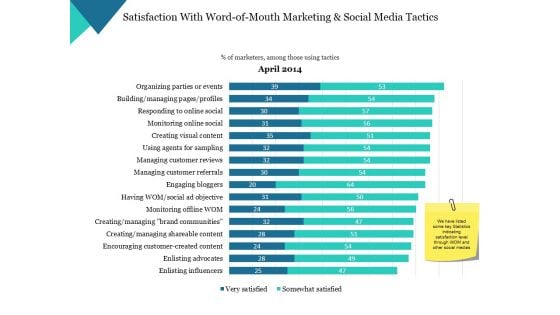
Satisfaction With Word Of Mouth Marketing And Social Media Tactics Ppt PowerPoint Presentation Styles Examples
This is a satisfaction with word of mouth marketing and social media tactics ppt powerpoint presentation styles examples. This is a one stage process. The stages in this process are business, marketing, finance, strategy, graph.
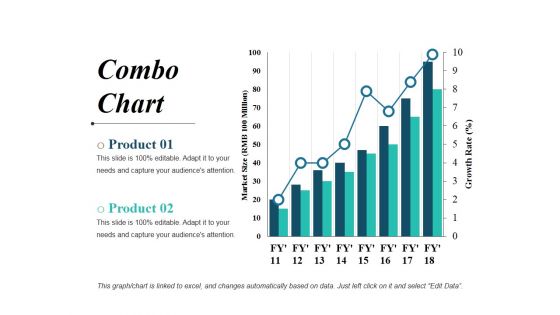
Combo Chart Ppt PowerPoint Presentation File Visual Aids
This is a combo chart ppt powerpoint presentation file visual aids. This is a two stage process. The stages in this process are bar graph, business, marketing, finance, planning.
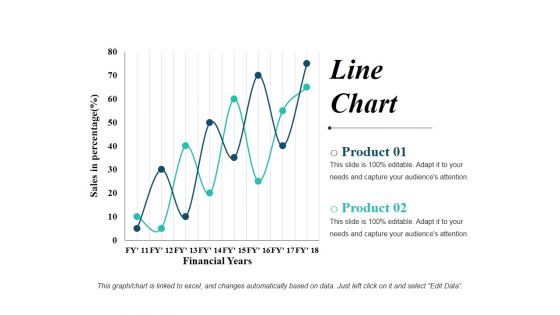
Line Chart Ppt PowerPoint Presentation Show Graphics Design
This is a line chart ppt powerpoint presentation show graphics design. This is a two stage process. The stages in this process are line graph, business, marketing, finance, planning.
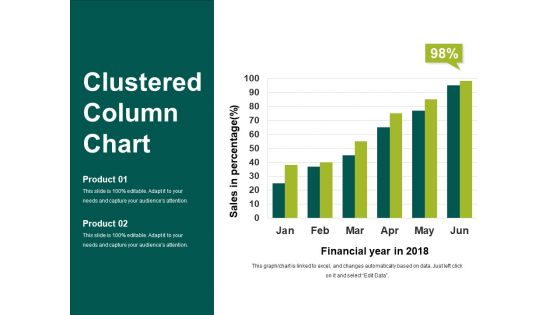
Clustered Column Chart Ppt PowerPoint Presentation Show Slideshow
This is a clustered column chart ppt powerpoint presentation show slideshow. This is a six stage process. The stages in this process are financial year in, sales in percentage, business, marketing, finance.
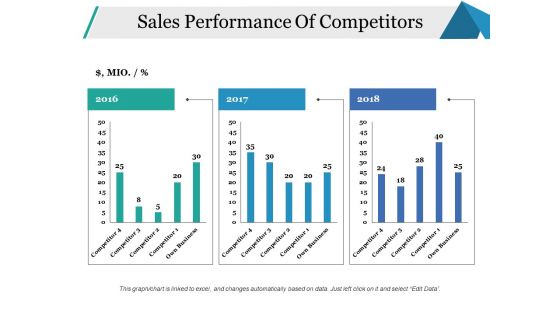
Sales Performance Of Competitors Ppt PowerPoint Presentation Portfolio Sample
This is a sales performance of competitors ppt powerpoint presentation portfolio sample. This is a three stage process. The stages in this process are business, marketing, finance, graph, years.
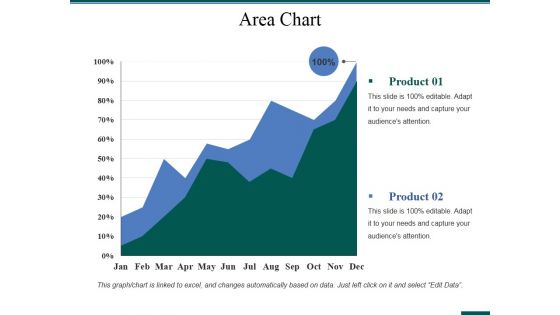
Area Chart Ppt PowerPoint Presentation Pictures Slideshow
This is a area chart ppt powerpoint presentation pictures slideshow. This is a two stage process. The stages in this process are area chart, finance, analysis, marketing, strategy, business.
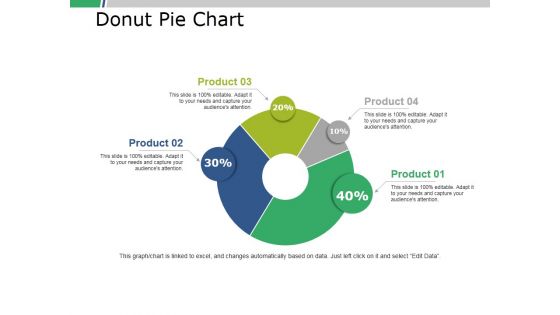
Donut Pie Chart Ppt PowerPoint Presentation Portfolio Slide Download
This is a donut pie chart ppt powerpoint presentation portfolio slide download. This is a four stage process. The stages in this process are business, marketing, finance, percent, donut.
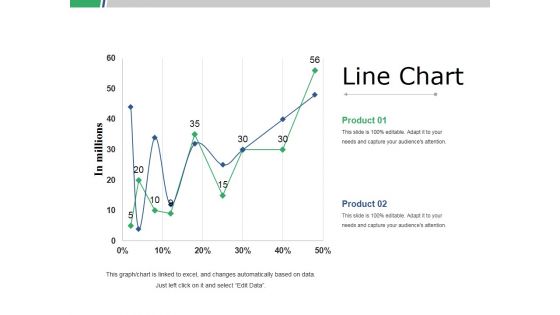
Line Chart Ppt PowerPoint Presentation Slides Graphics Template
This is a line chart ppt powerpoint presentation slides graphics template. This is a two stage process. The stages in this process are business, marketing, strategy, line graph, finance.
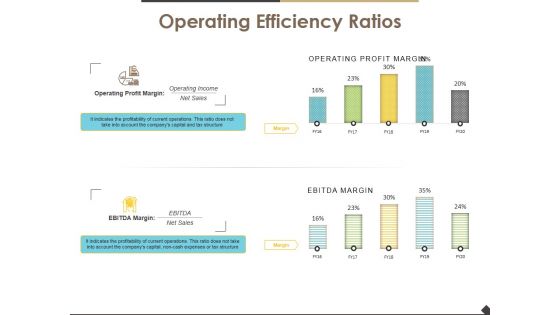
Operating Efficiency Ratios Template 1 Ppt PowerPoint Presentation Layouts Introduction
This is a operating efficiency ratios template 1 ppt powerpoint presentation layouts introduction. This is a two stage process. The stages in this process are operating efficiency ratios, finance, marketing, strategy, business.
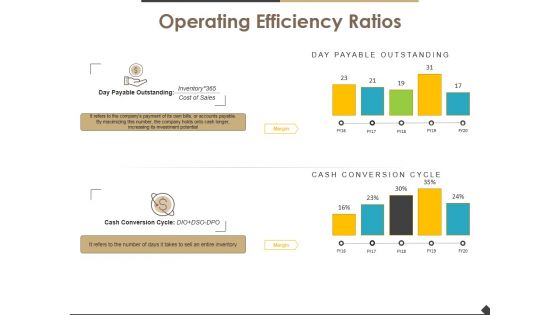
Operating Efficiency Ratios Template 2 Ppt PowerPoint Presentation Infographic Template Guide
This is a operating efficiency ratios template 2 ppt powerpoint presentation infographic template guide. This is a two stage process. The stages in this process are operating efficiency ratios, finance, marketing, strategy, business.

Area Chart Ppt PowerPoint Presentation Infographics Example Topics
This is a area chart ppt powerpoint presentation infographics example topics. This is a two stage process. The stages in this process are area chart, finance, marketing, strategy, business.
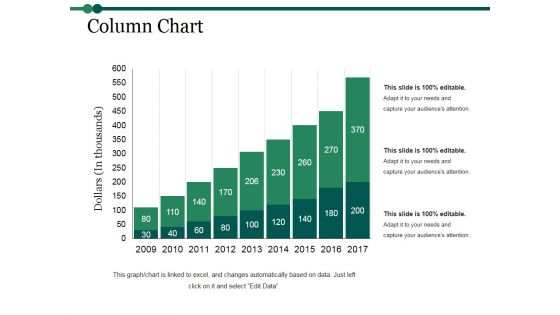
Column Chart Ppt PowerPoint Presentation Inspiration Graphics Example
This is a column chart ppt powerpoint presentation inspiration graphics example. This is a nine stage process. The stages in this process are column chart, finance, marketing, strategy, analysis, business.
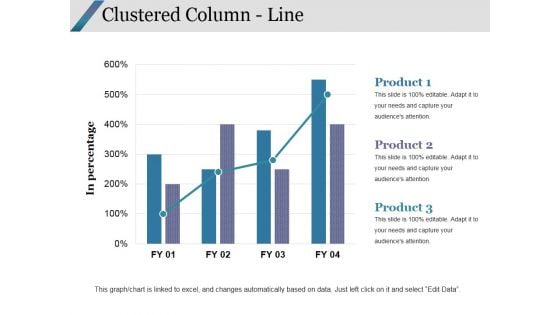
Clustered Column Line Ppt PowerPoint Presentation Portfolio Good
This is a clustered column line ppt powerpoint presentation portfolio good. This is a three stage process. The stages in this process are clustered column line, finance, marketing, strategy, analysis, business.
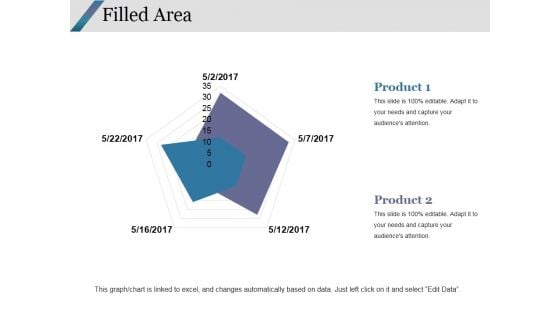
Filled Area Ppt PowerPoint Presentation Infographics Graphics Design
This is a filled area ppt powerpoint presentation infographics graphics design. This is a two stage process. The stages in this process are filled area, finance, marketing, strategy, analysis.
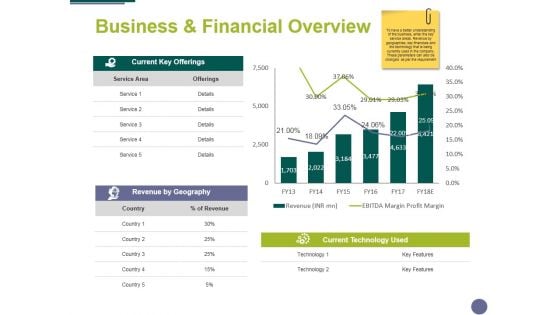
Business And Financial Overview Ppt PowerPoint Presentation Summary Format
This is a business and financial overview ppt powerpoint presentation summary format. This is a two stage process. The stages in this process are finance, analysis, marketing, business, compere.
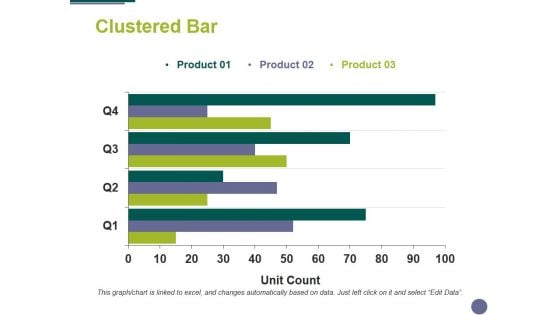
Clustered Bar Ppt PowerPoint Presentation Show Background Designs
This is a clustered bar ppt powerpoint presentation show background designs. This is a three stage process. The stages in this process are clustered bar, finance, analysis, business, marketing.
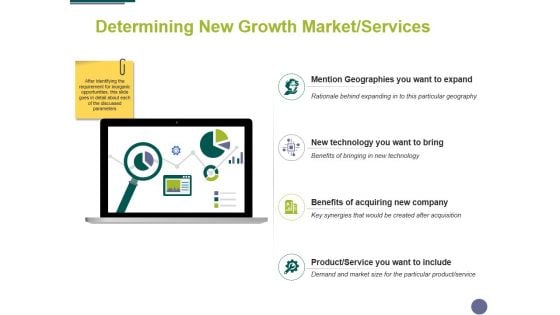
Determining New Growth Market Services Ppt PowerPoint Presentation Portfolio Topics
This is a determining new growth market services ppt powerpoint presentation portfolio topics. This is a four stage process. The stages in this process are server, analysis, finance, marketing, business.
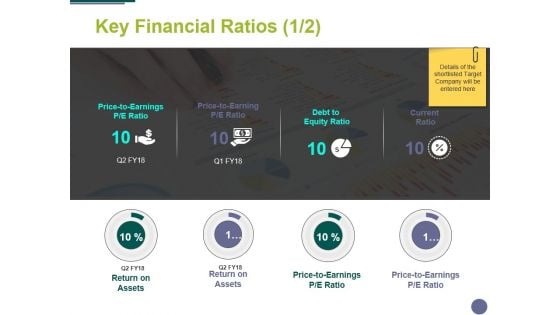
Key Financial Ratios Template 1 Ppt PowerPoint Presentation Infographics Shapes
This is a key financial ratios template 1 ppt powerpoint presentation infographics shapes. This is a four stage process. The stages in this process are business, marketing, analysis, finance, icon.
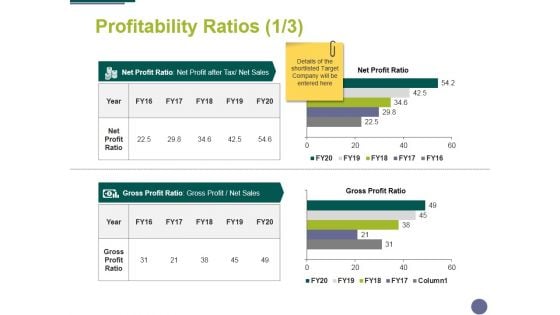
Profitability Ratios Template 1 Ppt PowerPoint Presentation Professional Skills
This is a profitability ratios template 1 ppt powerpoint presentation professional skills. This is a two stage process. The stages in this process are compere, finance, marketing, analysis, business.
Profitability Ratios Template 2 Ppt PowerPoint Presentation Icon Objects
This is a profitability ratios template 2 ppt powerpoint presentation icon objects. This is a two stage process. The stages in this process are compere, finance, marketing, analysis, business.


 Continue with Email

 Home
Home


