Cost Model
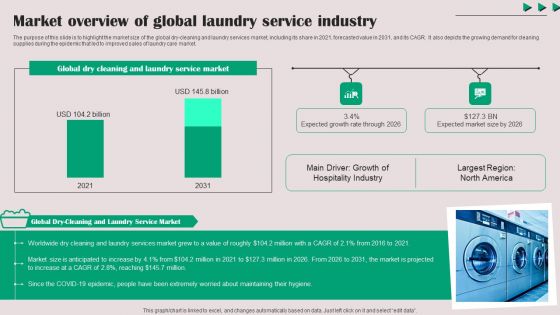
Market Overview Of Global Laundry Service Industry Introduction PDF
The purpose of this slide is to highlight the market size of the global dry-cleaning and laundry services market, including its share in 2021, forecasted value in 2031, and its CAGR. It also depicts the growing demand for cleaning supplies during the epidemic that led to improved sales of laundry care market. Find a pre-designed and impeccable Market Overview Of Global Laundry Service Industry Introduction PDF. The templates can ace your presentation without additional effort. You can download these easy-to-edit presentation templates to make your presentation stand out from others. So, what are you waiting for Download the template from Slidegeeks today and give a unique touch to your presentation.
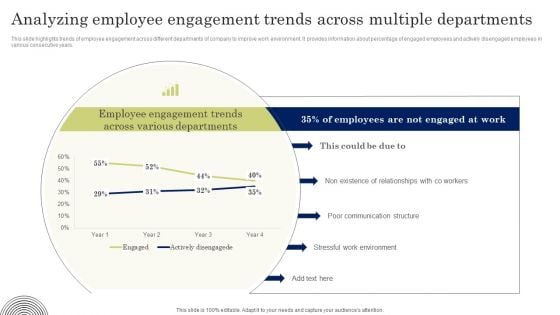
Analyzing Employee Engagement Trends Across Multiple Departments Sample PDF
This slide highlights trends of employee engagement across different departments of company to improve work environment. It provides information about percentage of engaged employees and actively disengaged employees in various consecutive years. Create an editable Analyzing Employee Engagement Trends Across Multiple Departments Sample PDF that communicates your idea and engages your audience. Whether youre presenting a business or an educational presentation, pre designed presentation templates help save time. Analyzing Employee Engagement Trends Across Multiple Departments Sample PDF is highly customizable and very easy to edit, covering many different styles from creative to business presentations. Slidegeeks has creative team members who have crafted amazing templates. So, go and get them without any delay.
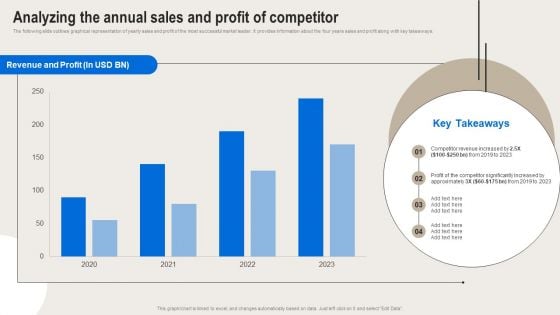
Formulating Branding Strategy To Enhance Revenue And Sales Analyzing The Annual Sales And Profit Of Competitor Mockup PDF
The following slide outlines graphical representation of yearly sales and profit of the most successful market leader. It provides information about the four years sales and profit along with key takeaways. Find a pre designed and impeccable Formulating Branding Strategy To Enhance Revenue And Sales Analyzing The Annual Sales And Profit Of Competitor Mockup PDF. The templates can ace your presentation without additional effort. You can download these easy to edit presentation templates to make your presentation stand out from others. So, what are you waiting for Download the template from Slidegeeks today and give a unique touch to your presentation.
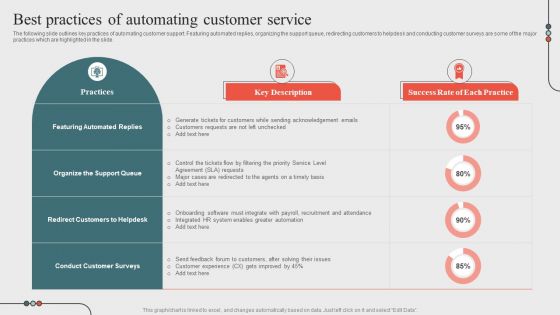
Best Practices Of Automating Customer Serviceoptimizing Business Processes Through Automation Slides PDF
The following slide outlines key practices of automating customer support. Featuring automated replies, organizing the support queue, redirecting customers to helpdesk and conducting customer surveys are some of the major practices which are highlighted in the slide. Find a pre designed and impeccable Best Practices Of Automating Customer Serviceoptimizing Business Processes Through Automation Slides PDF. The templates can ace your presentation without additional effort. You can download these easy to edit presentation templates to make your presentation stand out from others. So, what are you waiting for Download the template from Slidegeeks today and give a unique touch to your presentation.
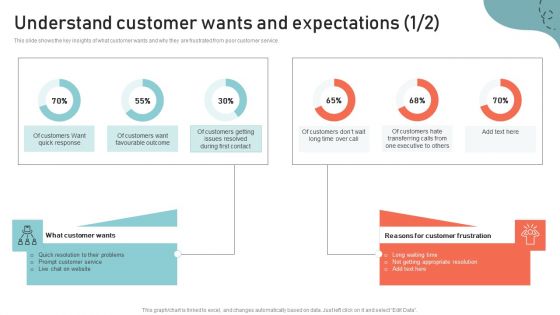
Optimizing Multichannel Strategy To Improve User Experience Understand Customer Sample PDF
This slide shows the key insights of what customer wants and why they are frustrated from poor customer service. This Optimizing Multichannel Strategy To Improve User Experience Understand Customer Sample PDF from Slidegeeks makes it easy to present information on your topic with precision. It provides customization options, so you can make changes to the colors, design, graphics, or any other component to create a unique layout. It is also available for immediate download, so you can begin using it right away. Slidegeeks has done good research to ensure that you have everything you need to make your presentation stand out. Make a name out there for a brilliant performance.
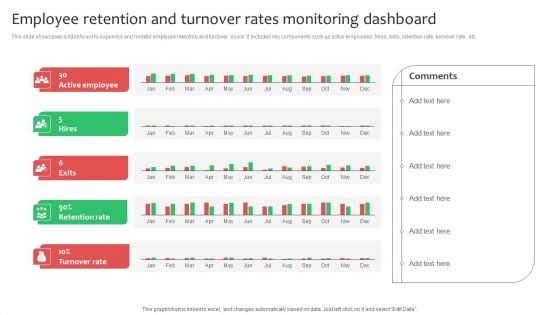
Employee Retention And Turnover Rates Monitoring Dashboard Mockup PDF
This slide showcases a dashboard to supervise and monitor employee retention and turnover score. It includes key components such as active employees, hires, exits, retention rate, turnover rate, etc. If your project calls for a presentation, then Slidegeeks is your go to partner because we have professionally designed, easy to edit templates that are perfect for any presentation. After downloading, you can easily edit Employee Retention And Turnover Rates Monitoring Dashboard Mockup PDF and make the changes accordingly. You can rearrange slides or fill them with different images. Check out all the handy templates
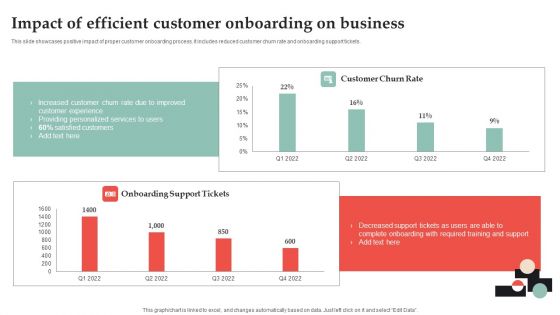
Customer Onboarding Journey Optimization Plan Impact Of Efficient Customer Graphics PDF
This slide showcases positive impact of proper customer onboarding process. It includes reduced customer churn rate and onboarding support tickets. This Customer Onboarding Journey Optimization Plan Impact Of Efficient Customer Graphics PDF from Slidegeeks makes it easy to present information on your topic with precision. It provides customization options, so you can make changes to the colors, design, graphics, or any other component to create a unique layout. It is also available for immediate download, so you can begin using it right away. Slidegeeks has done good research to ensure that you have everything you need to make your presentation stand out. Make a name out there for a brilliant performance.
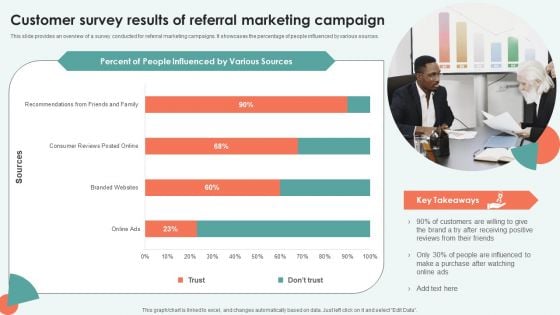
Customer Survey Results Of Referral Marketing Campaign Clipart PDF
This slide provides an overview of a survey conducted for referral marketing campaigns. It showcases the percentage of people influenced by various sources. Get a simple yet stunning designed Customer Survey Results Of Referral Marketing Campaign Clipart PDF. It is the best one to establish the tone in your meetings. It is an excellent way to make your presentations highly effective. So, download this PPT today from Slidegeeks and see the positive impacts. Our easy to edit Customer Survey Results Of Referral Marketing Campaign Clipart PDF can be your go to option for all upcoming conferences and meetings. So, what are you waiting for Grab this template today.
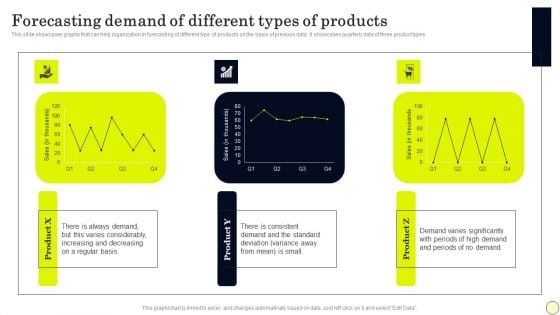
Forecasting Demand Of Different Types Of Products Demonstration PDF
This Forecasting Demand Of Different Types Of Products Demonstration PDF from Slidegeeks makes it easy to present information on your topic with precision. It provides customization options, so you can make changes to the colors, design, graphics, or any other component to create a unique layout. It is also available for immediate download, so you can begin using it right away. Slidegeeks has done good research to ensure that you have everything you need to make your presentation stand out. Make a name out there for a brilliant performance.
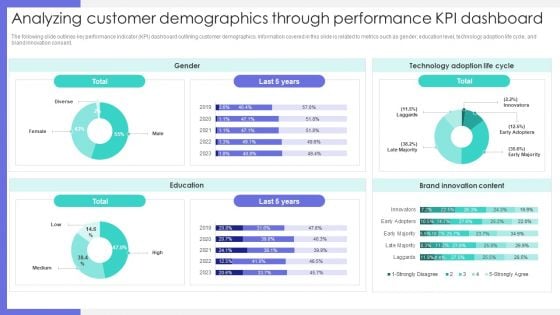
Analyzing Customer Demographics Through Performance KPI Dashboard Graphics PDF
The following slide outlines key performance indicator KPI dashboard outlining customer demographics. Information covered in this slide is related to metrics such as gender, education level, technology adoption life cycle, and brand innovation consent. Find a pre designed and impeccable Analyzing Customer Demographics Through Performance KPI Dashboard Graphics PDF. The templates can ace your presentation without additional effort. You can download these easy to edit presentation templates to make your presentation stand out from others. So, what are you waiting for Download the template from Slidegeeks today and give a unique touch to your presentation.
Annual Sales Of Most Successful Industry Leader Ppt Icon Display PDF
The following slide outlines graphical representation of yearly revenue of most successful business leader in the industry. Information covered in this slide is related to four year sales along with key takeaways. Find a pre designed and impeccable Annual Sales Of Most Successful Industry Leader Ppt Icon Display PDF. The templates can ace your presentation without additional effort. You can download these easy to edit presentation templates to make your presentation stand out from others. So, what are you waiting for Download the template from Slidegeeks today and give a unique touch to your presentation.

Data And Customer Analysis Company Outline Diversified And Growing Business Elements PDF
This slide highlights the Nielsen diversified and growing business which includes solutions revenue share, customer base and revenue by geography, contracted revenue and years of experience. Find a pre designed and impeccable Data And Customer Analysis Company Outline Diversified And Growing Business Elements PDF. The templates can ace your presentation without additional effort. You can download these easy to edit presentation templates to make your presentation stand out from others. So, what are you waiting for Download the template from Slidegeeks today and give a unique touch to your presentation.
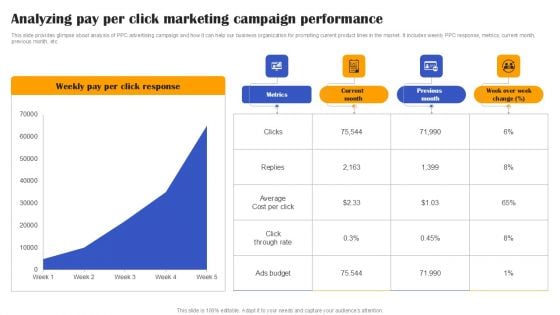
Execution Of Effective Paid Media Advertising Strategies Analyzing Pay Per Click Marketing Campaign Summary PDF
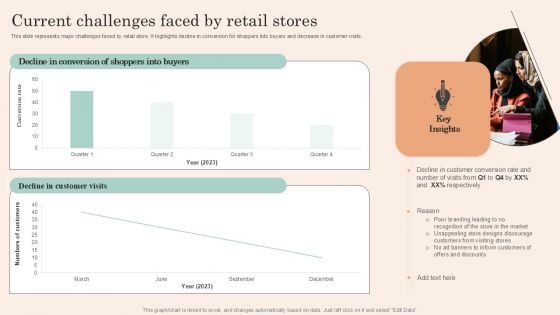
Retail Promotion Strategies To Elevate Shopper Current Challenges Faced By Retail Stores Formats PDF
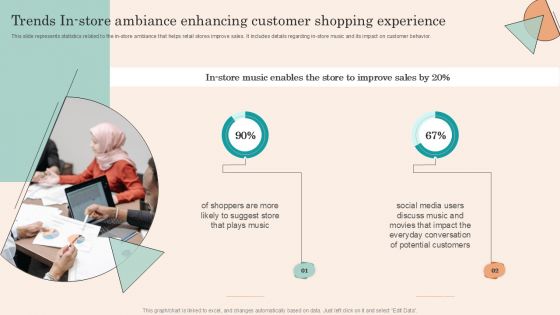
Retail Promotion Strategies To Elevate Shopper Trends In Store Ambiance Enhancing Customer Infographics PDF
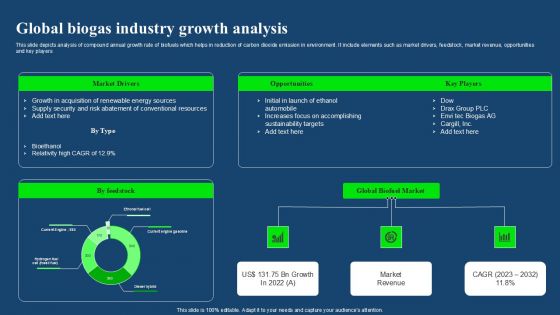
Global Biogas Industry Growth Analysis Download PDF
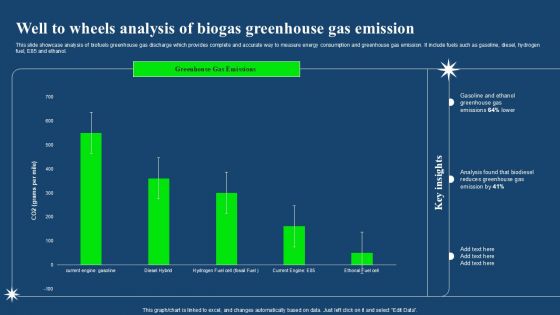
Well To Wheels Analysis Of Biogas Greenhouse Gas Emission Clipart PDF
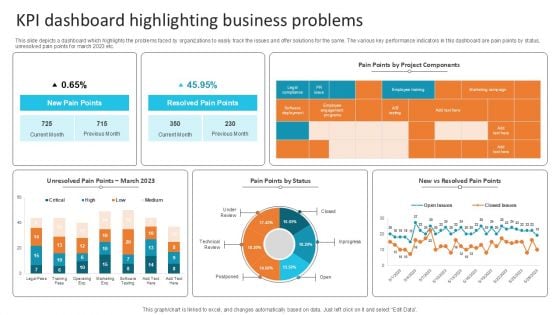
KPI Dashboard Highlighting Business Problems Microsoft PDF
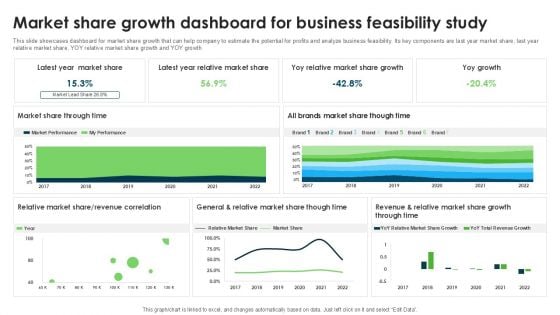
Market Share Growth Dashboard For Business Feasibility Study Demonstration PDF
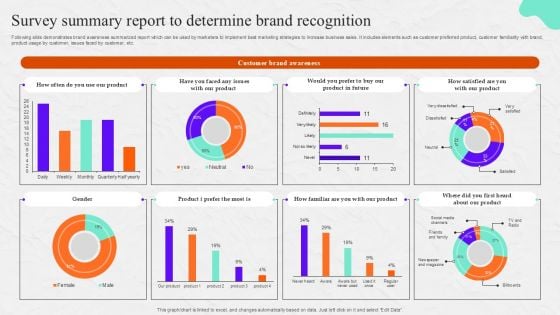
Survey Summary Report To Determine Brand Recognition Survey SS
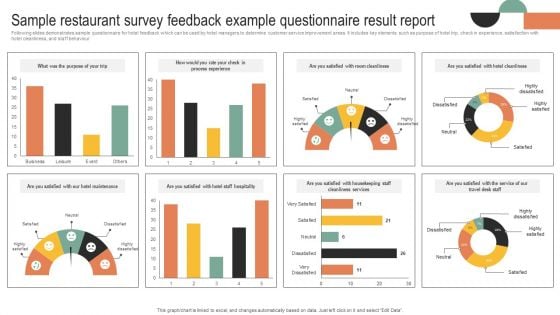
Sample Restaurant Survey Feedback Example Questionnaire Result Report Survey SS
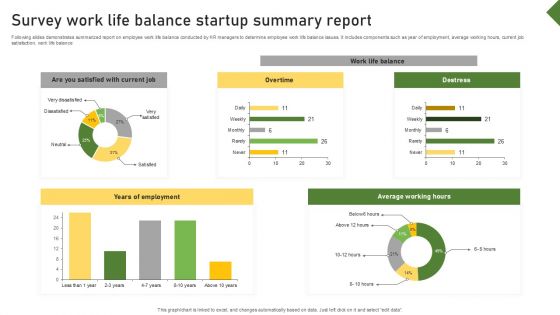
Survey Work Life Balance Startup Summary Report Survey SS
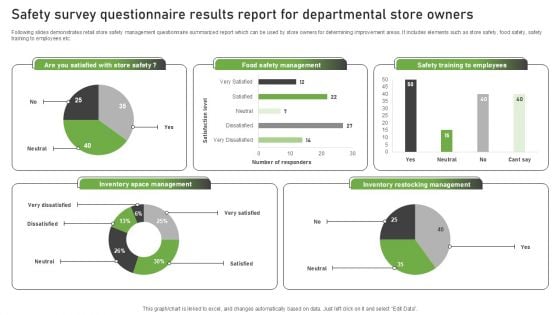
Safety Survey Questionnaire Results Report For Departmental Store Owners Survey SS
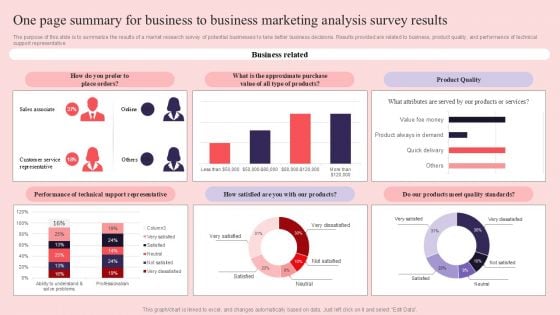
One Page Summary For Business To Business Marketing Analysis Survey Results Survey SS
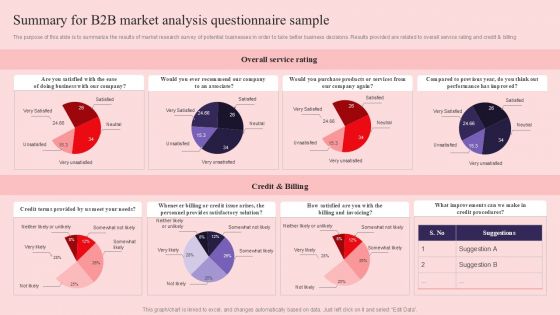
Summary For B2B Market Analysis Questionnaire Sample Survey SS
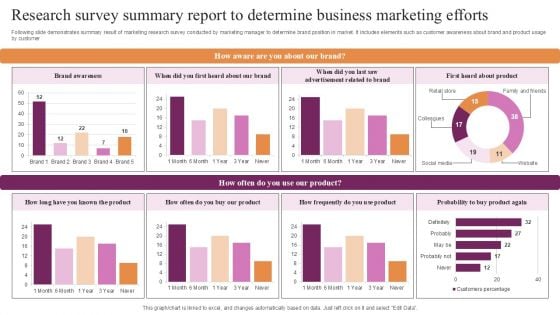
Research Survey Summary Report To Determine Business Marketing Efforts Survey SS
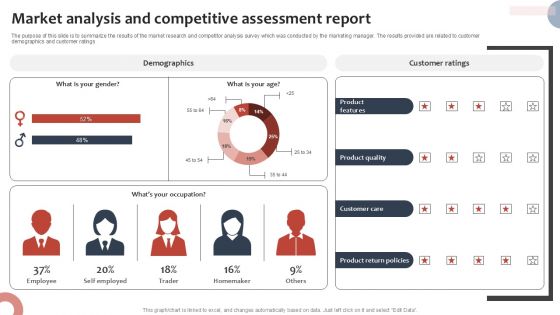
Market Analysis And Competitive Assessment Report Survey SS
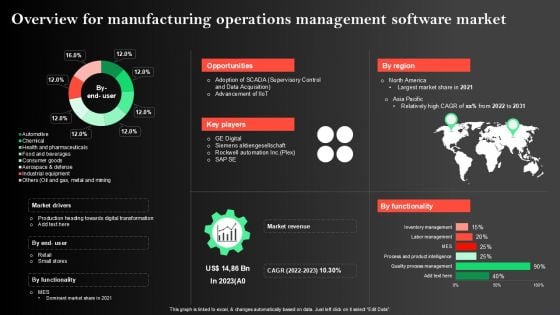
Manufacturing Operations Management Process Overview For Manufacturing Operations Microsoft PDF
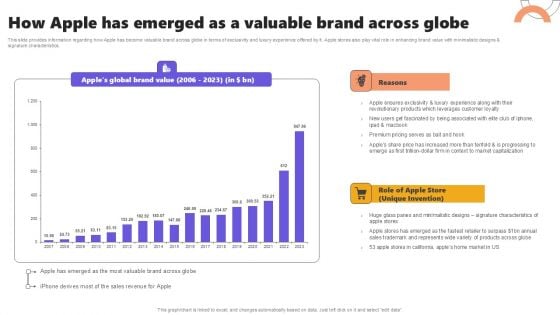
How Apple Has Emerged As A Valuable Brand Across Globe Microsoft PDF
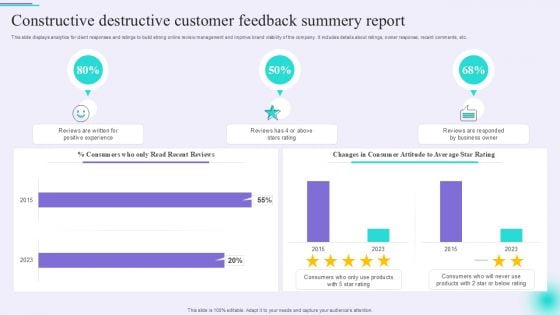
Constructive Destructive Customer Feedback Summery Report Inspiration PDF
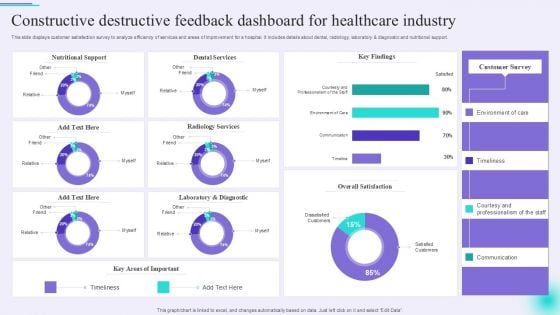
Constructive Destructive Feedback Dashboard For Healthcare Industry Guidelines PDF
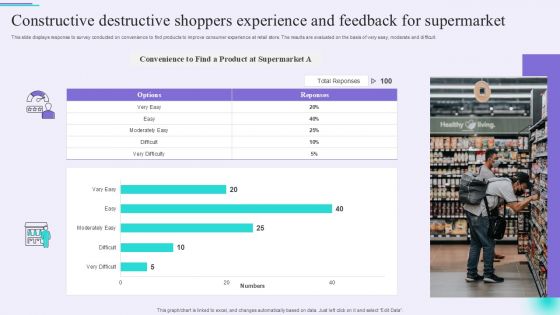
Constructive Destructive Shoppers Experience And Feedback For Supermarket Clipart PDF
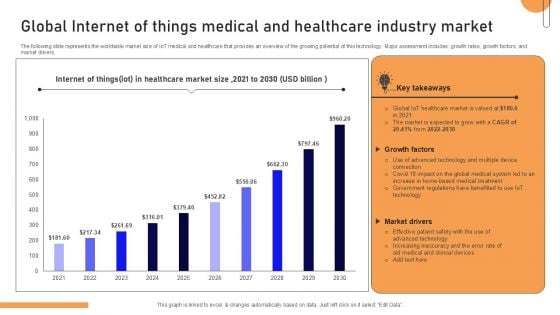
Global Internet Of Things Medical And Healthcare Industry Market Summary PDF
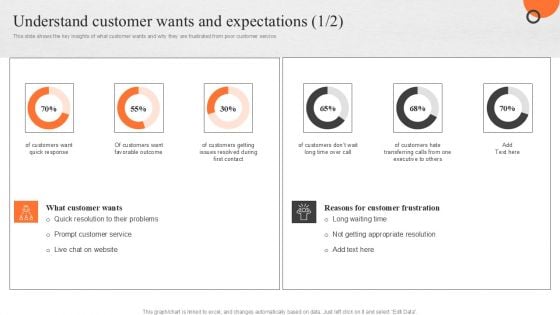
Enhancing Buyer Journey Understand Customer Wants And Expectations Themes PDF
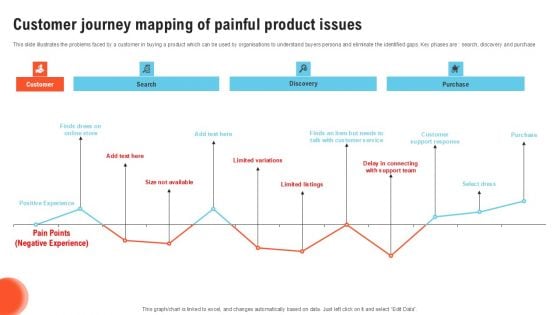
Customer Journey Mapping Of Painful Product Issues Portrait PDF
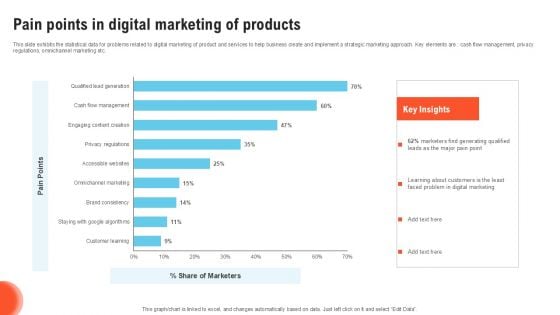
Pain Points In Digital Marketing Of Products Graphics PDF
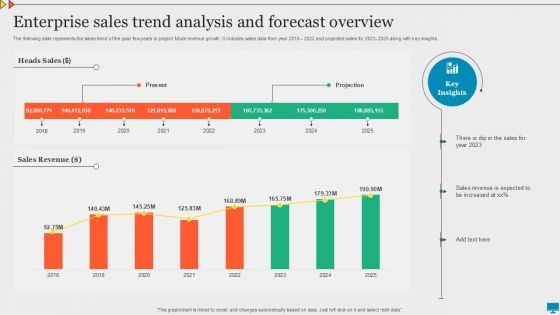
Enterprise Sales Trend Analysis And Forecast Overview Summary PDF
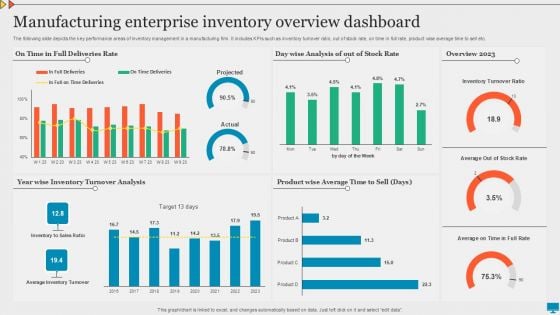
Manufacturing Enterprise Inventory Overview Dashboard Graphics PDF
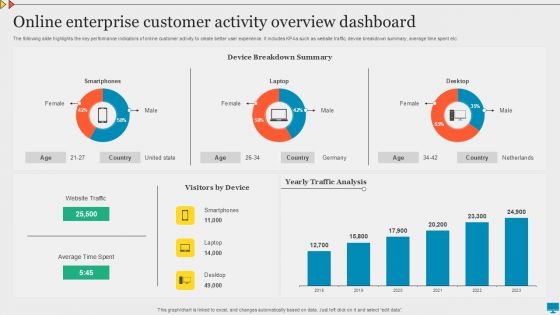
Online Enterprise Customer Activity Overview Dashboard Download PDF
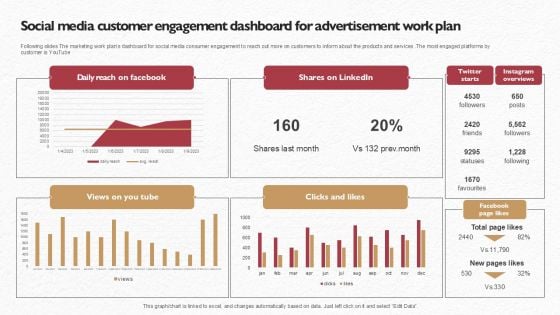
Social Media Customer Engagement Dashboard For Advertisement Work Plan Clipart PDF
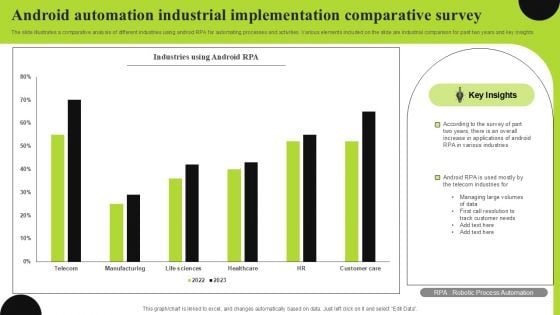
Android Automation Industrial Implementation Comparative Survey Formats PDF
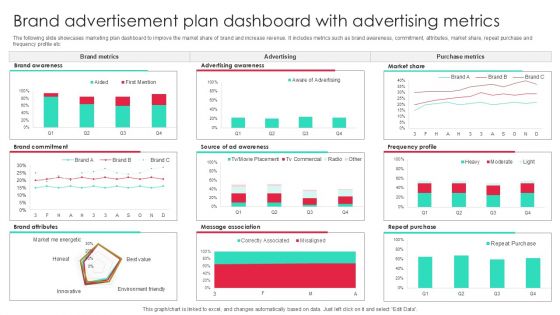
Brand Advertisement Plan Dashboard With Advertising Metrics Inspiration PDF
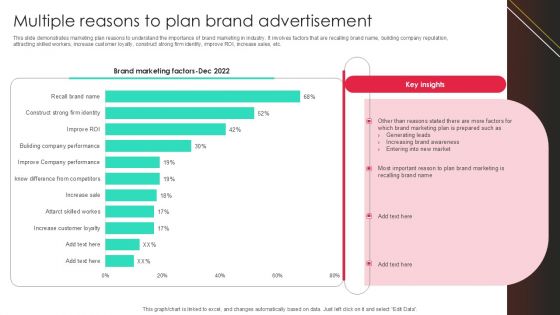
Multiple Reasons To Plan Brand Advertisement Clipart PDF
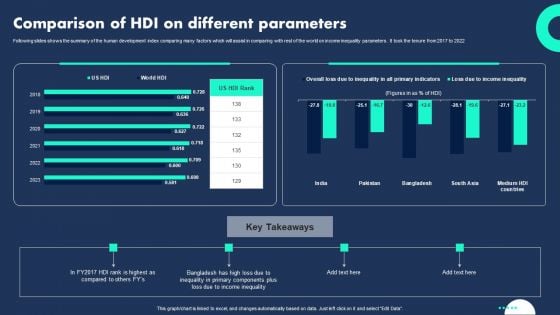
Comparison Of HDI On Different Parameters Diagrams PDF
Following slides shows the summary of the human development index comparing many factors which will assist in comparing with rest of the world on income inequality parameters . It took the tenure from 2017 to 2022. Showcasing this set of slides titled Comparison Of HDI On Different Parameters Diagrams PDF. The topics addressed in these templates are Inequality Primary Components, Plus Loss Income Inequality, Different Parameters . All the content presented in this PPT design is completely editable. Download it and make adjustments in color, background, font etc. as per your unique business setting.
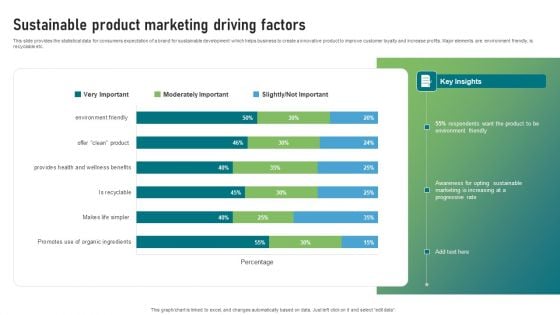
Sustainable Product Marketing Driving Factors Clipart PDF
This slide provides the statistical data for consumers expectation of a brand for sustainable development which helps business to create a innovative product to improve customer loyalty and increase profits. Major elements are environment friendly, is recyclable etc. Showcasing this set of slides titled Sustainable Product Marketing Driving Factors Clipart PDF. The topics addressed in these templates are Respondents, Environment Friendly, Awareness For Opting Sustainable. All the content presented in this PPT design is completely editable. Download it and make adjustments in color, background, font etc. as per your unique business setting.
Optimizing Consumer Lead Nurturing Procedure Lead Generation Dashboard For Tracking Introduction PDF
This slide covers the KPI dashboard for tracking lead conversion rates. It includes metrics such as visitors, average session rate, per visit, bounce rate, page views, etc. Create an editable Optimizing Consumer Lead Nurturing Procedure Lead Generation Dashboard For Tracking Introduction PDF that communicates your idea and engages your audience. Whether youre presenting a business or an educational presentation, pre designed presentation templates help save time. Optimizing Consumer Lead Nurturing Procedure Lead Generation Dashboard For Tracking Introduction PDF is highly customizable and very easy to edit, covering many different styles from creative to business presentations. Slidegeeks has creative team members who have crafted amazing templates. So, go and get them without any delay.
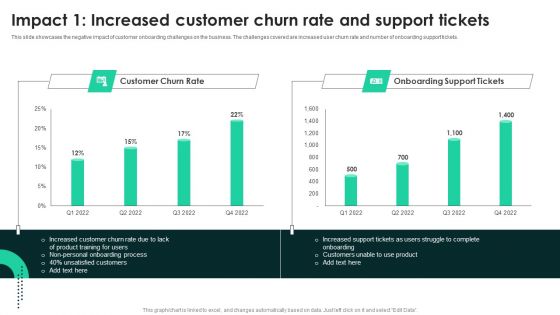
Impact 1 Increased Customer Churn Rate And Support Tickets Sample PDF
This slide showcases the negative impact of customer onboarding challenges on the business. The challenges covered are increased user churn rate and number of onboarding support tickets. Create an editable Impact 1 Increased Customer Churn Rate And Support Tickets Sample PDF that communicates your idea and engages your audience. Whether youre presenting a business or an educational presentation, pre designed presentation templates help save time. Impact 1 Increased Customer Churn Rate And Support Tickets Sample PDF is highly customizable and very easy to edit, covering many different styles from creative to business presentations. Slidegeeks has creative team members who have crafted amazing templates. So, go and get them without any delay.
Overall Brand Performance Tracking Dashboard Microsoft PDF
This slide provides information regarding brand performance tracking dashboard capturing KPIs such as brand metric, brand commitment, advertising metrics, and purchase metrics. Slidegeeks is here to make your presentations a breeze with Overall Brand Performance Tracking Dashboard Microsoft PDF With our easy to use and customizable templates, you can focus on delivering your ideas rather than worrying about formatting. With a variety of designs to choose from, you are sure to find one that suits your needs. And with animations and unique photos, illustrations, and fonts, you can make your presentation pop. So whether you are giving a sales pitch or presenting to the board, make sure to check out Slidegeeks first.
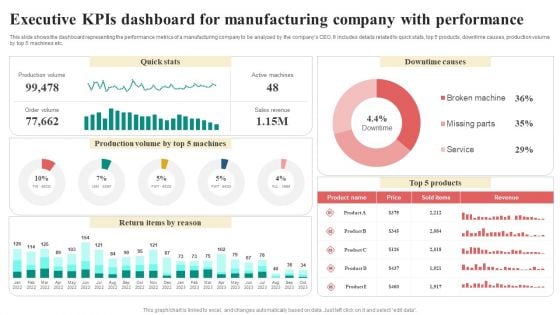
Executive Kpis Dashboard For Manufacturing Company With Performance Infographics PDF
This slide shows the dashboard representing the performance metrics of a manufacturing company to be analyzed by the companys CEO. It includes details related to quick stats, top 5 products, downtime causes, production volume by top 5 machines etc. Showcasing this set of slides titled Executive Kpis Dashboard For Manufacturing Company With Performance Infographics PDF. The topics addressed in these templates are Return Items By Reason, Quick Stats, Downtime Causes, Revenue. All the content presented in this PPT design is completely editable. Download it and make adjustments in color, background, font etc. as per your unique business setting.
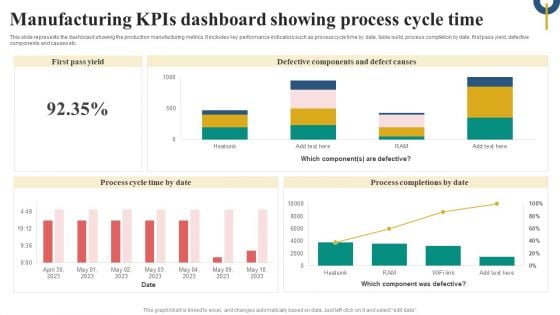
Manufacturing Kpis Dashboard Showing Process Cycle Time Microsoft PDF
This slide represents the dashboard showing the production manufacturing metrics. It includes key performance indicators such as process cycle time by date, table build, process completion by date, first pass yield, defective components and causes etc. Pitch your topic with ease and precision using this Manufacturing Kpis Dashboard Showing Process Cycle Time Microsoft PDF. This layout presents information on Defective Components Defect Causes, Process Cycle, Time By Date, Process Completions By Date. It is also available for immediate download and adjustment. So, changes can be made in the color, design, graphics or any other component to create a unique layout.
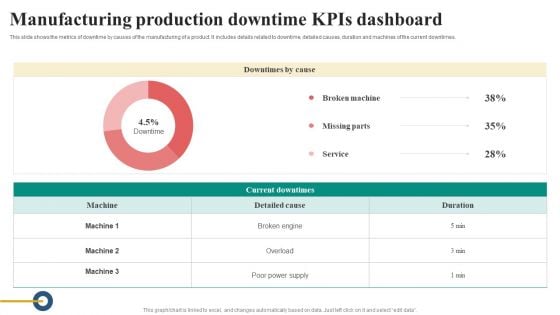
Manufacturing Production Downtime Kpis Dashboard Diagrams PDF
This slide shows the metrics of downtime by causes of the manufacturing of a product. It includes details related to downtime, detailed causes, duration and machines of the current downtimes. Pitch your topic with ease and precision using this Manufacturing Production Downtime Kpis Dashboard Diagrams PDF. This layout presents information on Details Related To Downtime, Detailed Causes, Duration And Machines, Current Downtimes. It is also available for immediate download and adjustment. So, changes can be made in the color, design, graphics or any other component to create a unique layout.
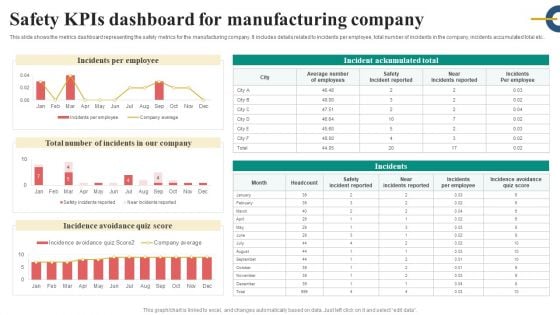
Safety Kpis Dashboard For Manufacturing Company Slides PDF
This slide shows the metrics dashboard representing the safety metrics for the manufacturing company. It includes details related to incidents per employee, total number of incidents in the company, incidents accumulated total etc.. Pitch your topic with ease and precision using this Safety Kpis Dashboard For Manufacturing Company Slides PDF. This layout presents information on Incidents Per Employee, Safety Incident Reported, Incidence Avoidance Quiz Score. It is also available for immediate download and adjustment. So, changes can be made in the color, design, graphics or any other component to create a unique layout.
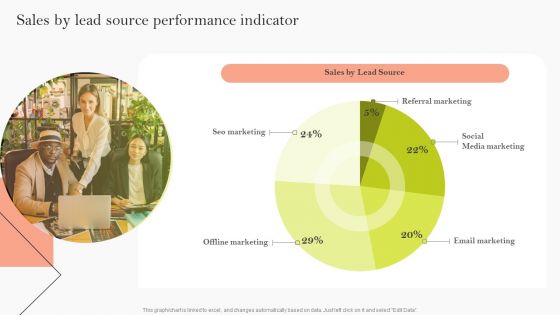
Sales By Lead Source Performance Indicator Ppt Pictures Graphics Template PDF
Explore a selection of the finest Sales By Lead Source Performance Indicator Ppt Pictures Graphics Template PDF here. With a plethora of professionally designed and pre made slide templates, you can quickly and easily find the right one for your upcoming presentation. You can use our Sales By Lead Source Performance Indicator Ppt Pictures Graphics Template PDF to effectively convey your message to a wider audience. Slidegeeks has done a lot of research before preparing these presentation templates. The content can be personalized and the slides are highly editable. Grab templates today from Slidegeeks.
Sales By Lead Source Performance Indicator Ppt Icon Images PDF
Explore a selection of the finest Sales By Lead Source Performance Indicator Ppt Icon Images PDF here. With a plethora of professionally designed and pre made slide templates, you can quickly and easily find the right one for your upcoming presentation. You can use our Sales By Lead Source Performance Indicator Ppt Icon Images PDF to effectively convey your message to a wider audience. Slidegeeks has done a lot of research before preparing these presentation templates. The content can be personalized and the slides are highly editable. Grab templates today from Slidegeeks.
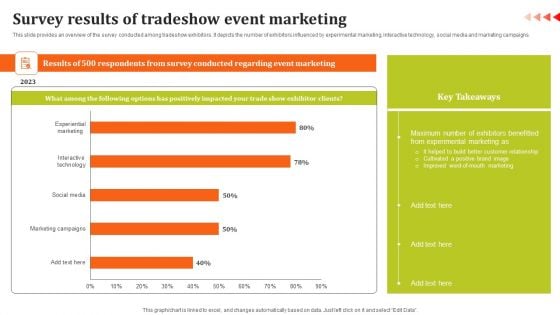
Survey Results Of Tradeshow Event Marketing Diagrams PDF
This slide provides an overview of the survey conducted among tradeshow exhibitors. It depicts the number of exhibitors influenced by experimental marketing, interactive technology, social media and marketing campaigns. Get a simple yet stunning designed Survey Results Of Tradeshow Event Marketing Diagrams PDF. It is the best one to establish the tone in your meetings. It is an excellent way to make your presentations highly effective. So, download this PPT today from Slidegeeks and see the positive impacts. Our easy to edit Survey Results Of Tradeshow Event Marketing Diagrams PDF can be your go to option for all upcoming conferences and meetings. So, what are you waiting for Grab this template today.
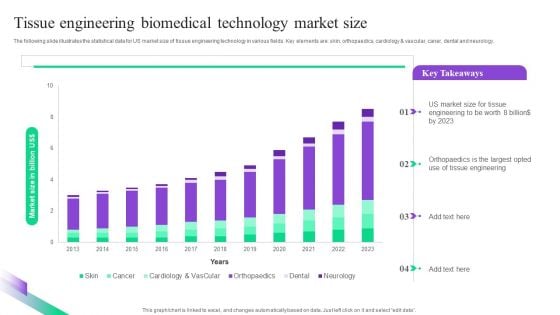
Tissue Engineering Biomedical Technology Market Size Summary PDF
The following slide illustrates the statistical data for US market size of tissue engineering technology in various fields. Key elements are skin, orthopaedics, cardiology and vascular, caner, dental and neurology. Pitch your topic with ease and precision using this Tissue Engineering Biomedical Technology Market Size Summary PDF. This layout presents information on Tissue, Engineering, Market Size. It is also available for immediate download and adjustment. So, changes can be made in the color, design, graphics or any other component to create a unique layout.

Call Center Kpis Agent Performance Dashboard Clipart PDF
This slide covers contact center agent performance metrics KPI dashboard. It involves metrics such as number of calls, average response time, average hold time, daily average transfer rate and agents with most hold time and transfer rate. Showcasing this set of slides titled Call Center Kpis Agent Performance Dashboard Clipart PDF. The topics addressed in these templates are Transfer Rate, Call Center, Hold Time. All the content presented in this PPT design is completely editable. Download it and make adjustments in color, background, font etc. as per your unique business setting.
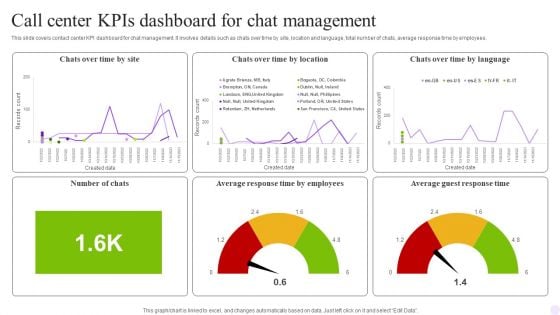
Call Center Kpis Dashboard For Chat Management Graphics PDF
This slide covers contact center KPI dashboard for chat management. It involves details such as chats over time by site, location and language, total number of chats, average response time by employees. Showcasing this set of slides titled Call Center Kpis Dashboard For Chat Management Graphics PDF. The topics addressed in these templates are Management, Employees, Chats. All the content presented in this PPT design is completely editable. Download it and make adjustments in color, background, font etc. as per your unique business setting.
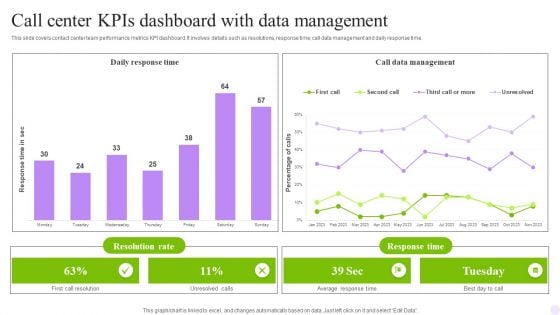
Call Center Kpis Dashboard With Data Management Infographics PDF
This slide covers contact center metrics KPI dashboard with call data details. It involves details such as total number of contacts handled, product sales, repeated calls and contact handles per day. Pitch your topic with ease and precision using this Call Center Kpis Dashboard With Data Management Infographics PDF. This layout presents information on Achieved, Contacts Handled, Repeated Calls. It is also available for immediate download and adjustment. So, changes can be made in the color, design, graphics or any other component to create a unique layout.
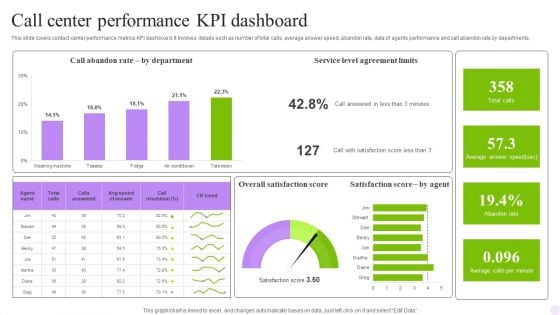
Call Center Performance KPI Dashboard Formats PDF
This slide covers contact center performance metrics KPI dashboard. It involves details such as number of total calls, average answer speed, abandon rate, data of agents performance and call abandon rate by departments. Showcasing this set of slides titled Call Center Performance KPI Dashboard Formats PDF. The topics addressed in these templates are Department, Dashboard, Agreement Limits. All the content presented in this PPT design is completely editable. Download it and make adjustments in color, background, font etc. as per your unique business setting.


 Continue with Email

 Home
Home


