Cost Saving
Facebook Marketing Techniques KPI Dashboard To Monitor Facebook Marketing Strategy SS V
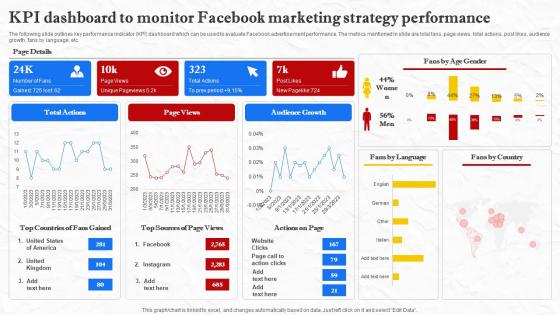
The following slide outlines key performance indicator KPI dashboard which can be used to evaluate Facebook advertisement performance. The metrics mentioned in slide are total fans, page views, total actions, post likes, audience growth, fans by language, etc. Do you know about Slidesgeeks Facebook Marketing Techniques KPI Dashboard To Monitor Facebook Marketing Strategy SS V These are perfect for delivering any kind od presentation. Using it, create PowerPoint presentations that communicate your ideas and engage audiences. Save time and effort by using our pre-designed presentation templates that are perfect for a wide range of topic. Our vast selection of designs covers a range of styles, from creative to business, and are all highly customizable and easy to edit. Download as a PowerPoint template or use them as Google Slides themes. The following slide outlines key performance indicator KPI dashboard which can be used to evaluate Facebook advertisement performance. The metrics mentioned in slide are total fans, page views, total actions, post likes, audience growth, fans by language, etc.
Business Segments Power Solution Wind Turbines Manufacturer Company Profile CP SS V
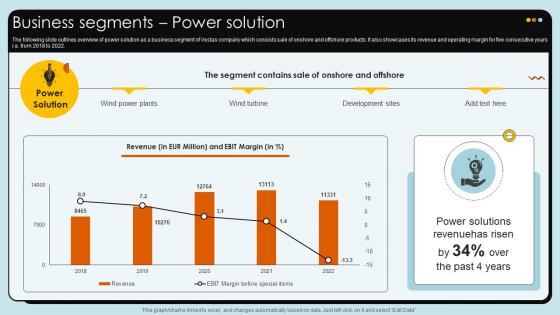
The following slide outlines overview of power solution as a business segment of Vestas company which consists sale of onshore and offshore products. It also showcases its revenue and operating margin for five consecutive years i.e. from 2018 to 2022.Create an editable Business Segments Power Solution Wind Turbines Manufacturer Company Profile CP SS V that communicates your idea and engages your audience. Whether you are presenting a business or an educational presentation, pre-designed presentation templates help save time. Business Segments Power Solution Wind Turbines Manufacturer Company Profile CP SS V is highly customizable and very easy to edit, covering many different styles from creative to business presentations. Slidegeeks has creative team members who have crafted amazing templates. So, go and get them without any delay. The following slide outlines overview of power solution as a business segment of Vestas company which consists sale of onshore and offshore products. It also showcases its revenue and operating margin for five consecutive years i.e. from 2018 to 2022.
Revenue By Region Wind Turbines Manufacturer Company Profile CP SS V
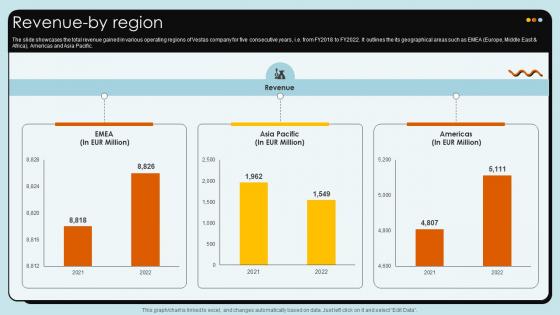
The slide showcases the total revenue gained in various operating regions of Vestas company for five consecutive years, i.e. from FY2018 to FY2022. It outlines the its geographical areas such as EMEA Europe, Middle East and Africa, Americas and Asia Pacific.Retrieve professionally designed Revenue By Region Wind Turbines Manufacturer Company Profile CP SS V to effectively convey your message and captivate your listeners. Save time by selecting pre-made slideshows that are appropriate for various topics, from business to educational purposes. These themes come in many different styles, from creative to corporate, and all of them are easily adjustable and can be edited quickly. Access them as PowerPoint templates or as Google Slides themes. You do not have to go on a hunt for the perfect presentation because Slidegeeks got you covered from everywhere. The slide showcases the total revenue gained in various operating regions of Vestas company for five consecutive years, i.e. from FY2018 to FY2022. It outlines the its geographical areas such as EMEA Europe, Middle East and Africa, Americas and Asia Pacific.
Cyber Phishing Attacks Tracking Dashboard Man In The Middle Phishing IT
This slide represents the dashboard to track cyber phishing attacks. The purpose of this slide is to provide a graphical representation of cyber attacks occurred in a specific time span. It also depicts the organizations health risk. Formulating a presentation can take up a lot of effort and time, so the content and message should always be the primary focus. The visuals of the PowerPoint can enhance the presenters message, so our Cyber Phishing Attacks Tracking Dashboard Man In The Middle Phishing IT was created to help save time. Instead of worrying about the design, the presenter can concentrate on the message while our designers work on creating the ideal templates for whatever situation is needed. Slidegeeks has experts for everything from amazing designs to valuable content, we have put everything into Cyber Phishing Attacks Tracking Dashboard Man In The Middle Phishing IT This slide represents the dashboard to track cyber phishing attacks. The purpose of this slide is to provide a graphical representation of cyber attacks occurred in a specific time span. It also depicts the organizations health risk.
Wine Lounge Business Plan Global Wine Bar Industry At A Glance BP SS V
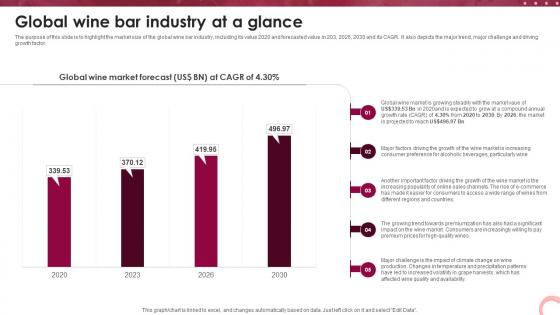
The purpose of this slide is to highlight the market size of the global wine bar industry, including its value 2020 and forecasted value in 203, 2026, 2030 and its CAGR. It also depicts the major trend, major challenge and driving growth factor. Formulating a presentation can take up a lot of effort and time, so the content and message should always be the primary focus. The visuals of the PowerPoint can enhance the presenters message, so our Wine Lounge Business Plan Global Wine Bar Industry At A Glance BP SS V was created to help save time. Instead of worrying about the design, the presenter can concentrate on the message while our designers work on creating the ideal templates for whatever situation is needed. Slidegeeks has experts for everything from amazing designs to valuable content, we have put everything into Wine Lounge Business Plan Global Wine Bar Industry At A Glance BP SS V. The purpose of this slide is to highlight the market size of the global wine bar industry, including its value 2020 and forecasted value in 203, 2026, 2030 and its CAGR. It also depicts the major trend, major challenge and driving growth factor.
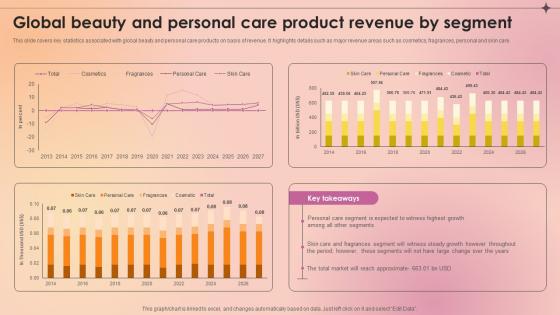
Global Beauty And Personal Care Product Revenue By Segment Makeup And Skincare Market IR SS V
This slide covers key statistics associated with global beauty and personal care products on basis of revenue. It highlights details such as major revenue areas such as cosmetics, fragrances, personal and skin care. Find highly impressive Global Beauty And Personal Care Product Revenue By Segment Makeup And Skincare Market IR SS V on Slidegeeks to deliver a meaningful presentation. You can save an ample amount of time using these presentation templates. No need to worry to prepare everything from scratch because Slidegeeks experts have already done a huge research and work for you. You need to download Global Beauty And Personal Care Product Revenue By Segment Makeup And Skincare Market IR SS V for your upcoming presentation. All the presentation templates are 100 percent editable and you can change the color and personalize the content accordingly. Download now This slide covers key statistics associated with global beauty and personal care products on basis of revenue. It highlights details such as major revenue areas such as cosmetics, fragrances, personal and skin care.
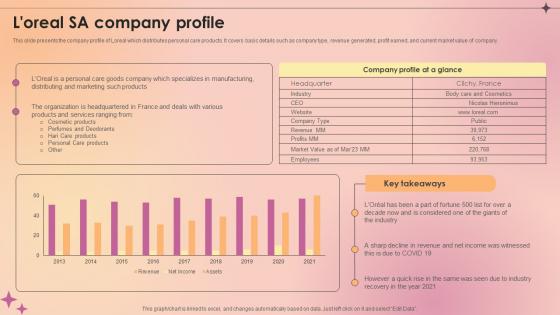
Loreal SA Company Profile Makeup And Skincare Market IR SS V
This slide presents the company profile of Loreal which distributes personal care products. It covers basic details such as company type, revenue generated, profit earned, and current market value of company. Formulating a presentation can take up a lot of effort and time, so the content and message should always be the primary focus. The visuals of the PowerPoint can enhance the presenters message, so our Loreal SA Company Profile Makeup And Skincare Market IR SS V was created to help save time. Instead of worrying about the design, the presenter can concentrate on the message while our designers work on creating the ideal templates for whatever situation is needed. Slidegeeks has experts for everything from amazing designs to valuable content, we have put everything into Loreal SA Company Profile Makeup And Skincare Market IR SS V. This slide presents the company profile of Loreal which distributes personal care products. It covers basic details such as company type, revenue generated, profit earned, and current market value of company.
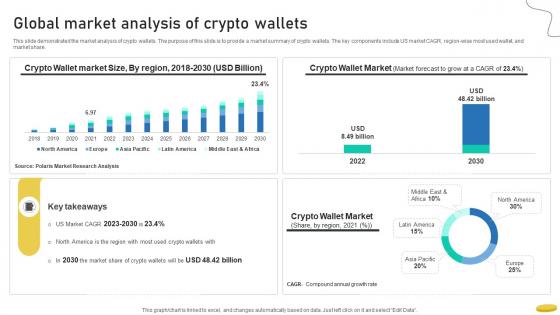
Global Market Analysis Of Crypto Wallets Cryptocurrency Management With Blockchain
This slide demonstrated the market analysis of crypto wallets. The purpose of this slide is to provide a market summary of crypto wallets. The key components include US market CAGR, region-wise most used wallet, and market share.Retrieve professionally designed Global Market Analysis Of Crypto Wallets Cryptocurrency Management With Blockchain to effectively convey your message and captivate your listeners. Save time by selecting pre-made slideshows that are appropriate for various topics, from business to educational purposes. These themes come in many different styles, from creative to corporate, and all of them are easily adjustable and can be edited quickly. Access them as PowerPoint templates or as Google Slides themes. You do not have to go on a hunt for the perfect presentation because Slidegeeks got you covered from everywhere. This slide demonstrated the market analysis of crypto wallets. The purpose of this slide is to provide a market summary of crypto wallets. The key components include US market CAGR, region-wise most used wallet, and market share.

Data Integration Market Evolution Strategy Data Integration Strategies For Business
This slide highlights the introduction of the data integration market. The purpose of this slide is to provide an overview of the market elements including key market players, market opportunities, market drivers, and market segmentation. Are you in need of a template that can accommodate all of your creative concepts This one is crafted professionally and can be altered to fit any style. Use it with Google Slides or PowerPoint. Include striking photographs, symbols, depictions, and other visuals. Fill, move around, or remove text boxes as desired. Test out color palettes and font mixtures. Edit and save your work, or work with colleagues. Download Data Integration Market Evolution Strategy Data Integration Strategies For Business and observe how to make your presentation outstanding. Give an impeccable presentation to your group and make your presentation unforgettable. This slide highlights the introduction of the data integration market. The purpose of this slide is to provide an overview of the market elements including key market players, market opportunities, market drivers, and market segmentation.
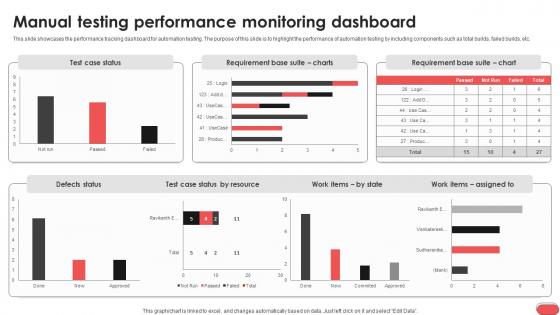
Manual Testing Performance Monitoring Dashboard Gray Box Testing Best Practices
This slide showcases the performance tracking dashboard for automation testing. The purpose of this slide is to highlight the performance of automation testing by including components such as total builds, failed builds, etc. Formulating a presentation can take up a lot of effort and time, so the content and message should always be the primary focus. The visuals of the PowerPoint can enhance the presenters message, so our Manual Testing Performance Monitoring Dashboard Gray Box Testing Best Practices was created to help save time. Instead of worrying about the design, the presenter can concentrate on the message while our designers work on creating the ideal templates for whatever situation is needed. Slidegeeks has experts for everything from amazing designs to valuable content, we have put everything into Manual Testing Performance Monitoring Dashboard Gray Box Testing Best Practices This slide showcases the performance tracking dashboard for automation testing. The purpose of this slide is to highlight the performance of automation testing by including components such as total builds, failed builds, etc.
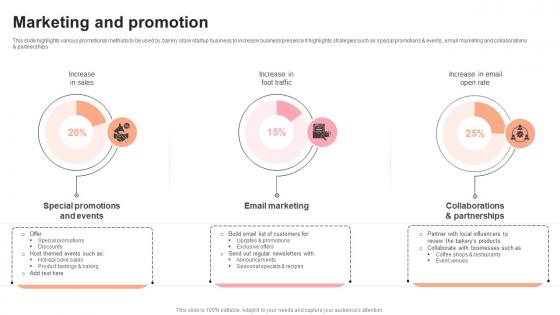
Marketing And Promotion Pastry Shop Market Entry Plan GTM SS V
This slide highlights various promotional methods to be used by bakery store startup business to increase business presence It highlights strategies such as special promotions and events, email marketing and collaborations and partnerships. Are you in need of a template that can accommodate all of your creative concepts This one is crafted professionally and can be altered to fit any style. Use it with Google Slides or PowerPoint. Include striking photographs, symbols, depictions, and other visuals. Fill, move around, or remove text boxes as desired. Test out color palettes and font mixtures. Edit and save your work, or work with colleagues. Download Marketing And Promotion Pastry Shop Market Entry Plan GTM SS V and observe how to make your presentation outstanding. Give an impeccable presentation to your group and make your presentation unforgettable. This slide highlights various promotional methods to be used by bakery store startup business to increase business presence It highlights strategies such as special promotions and events, email marketing and collaborations and partnerships.
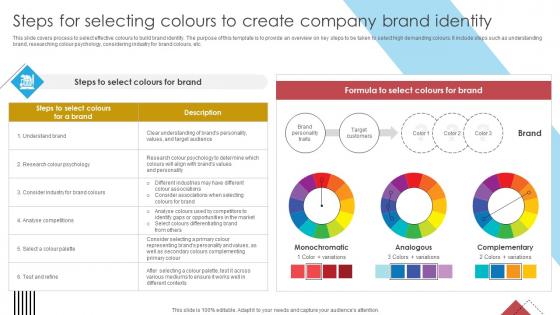
Blueprint For Effective Real Steps For Selecting Colours To Create Company Brand Strategy SS V
This slide covers process to select effective colours to build brand identity. The purpose of this template is to provide an overview on key steps to be taken to select high demanding colours. It include steps such as understanding brand, researching colour psychology, considering industry for brand colours, etc. Are you in need of a template that can accommodate all of your creative concepts This one is crafted professionally and can be altered to fit any style. Use it with Google Slides or PowerPoint. Include striking photographs, symbols, depictions, and other visuals. Fill, move around, or remove text boxes as desired. Test out color palettes and font mixtures. Edit and save your work, or work with colleagues. Download Blueprint For Effective Real Steps For Selecting Colours To Create Company Brand Strategy SS V and observe how to make your presentation outstanding. Give an impeccable presentation to your group and make your presentation unforgettable. This slide covers process to select effective colours to build brand identity. The purpose of this template is to provide an overview on key steps to be taken to select high demanding colours. It include steps such as understanding brand, researching colour psychology, considering industry for brand colours, etc.
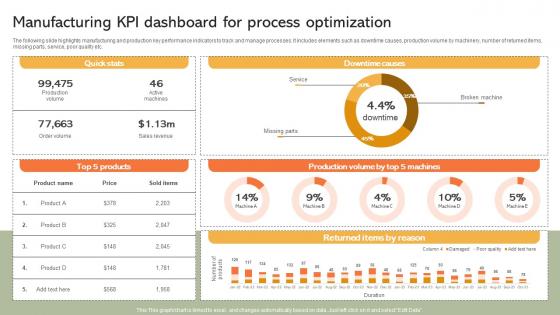
Manufacturing KPI Dashboard For Process Implementing Manufacturing Strategy SS V
The following slide highlights manufacturing and production key performance indicators to track and manage processes. It includes elements such as downtime causes, production volume by machinery, number of returned items, missing parts, service, poor quality etc. Formulating a presentation can take up a lot of effort and time, so the content and message should always be the primary focus. The visuals of the PowerPoint can enhance the presenters message, so our Manufacturing KPI Dashboard For Process Implementing Manufacturing Strategy SS V was created to help save time. Instead of worrying about the design, the presenter can concentrate on the message while our designers work on creating the ideal templates for whatever situation is needed. Slidegeeks has experts for everything from amazing designs to valuable content, we have put everything into Manufacturing KPI Dashboard For Process Implementing Manufacturing Strategy SS V The following slide highlights manufacturing and production key performance indicators to track and manage processes. It includes elements such as downtime causes, production volume by machinery, number of returned items, missing parts, service, poor quality etc.
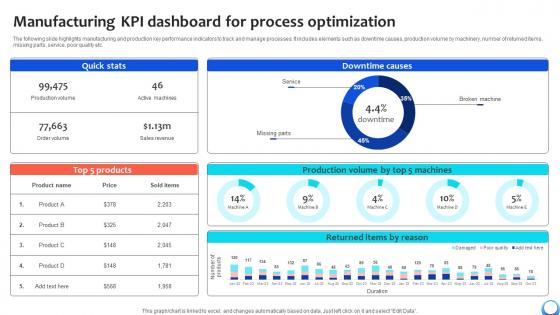
Manufacturing KPI Dashboard For Process Optimization Automating Production Process Strategy SS V
The following slide highlights manufacturing and production key performance indicators to track and manage processes. It includes elements such as downtime causes, production volume by machinery, number of returned items, missing parts, service, poor quality etc. Formulating a presentation can take up a lot of effort and time, so the content and message should always be the primary focus. The visuals of the PowerPoint can enhance the presenters message, so our Manufacturing KPI Dashboard For Process Optimization Automating Production Process Strategy SS V was created to help save time. Instead of worrying about the design, the presenter can concentrate on the message while our designers work on creating the ideal templates for whatever situation is needed. Slidegeeks has experts for everything from amazing designs to valuable content, we have put everything into Manufacturing KPI Dashboard For Process Optimization Automating Production Process Strategy SS V The following slide highlights manufacturing and production key performance indicators to track and manage processes. It includes elements such as downtime causes, production volume by machinery, number of returned items, missing parts, service, poor quality etc.
Evaluating Revenue And Customer Churn Boosting Customer Retention Rate With Live Chat
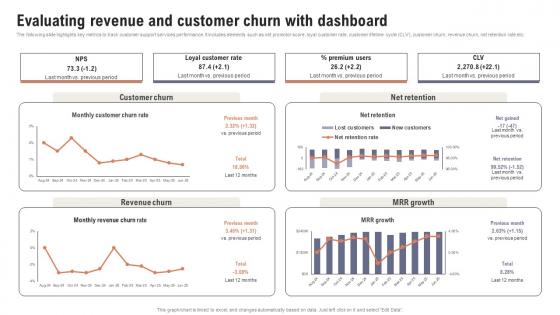
The following slide highlights key metrics to track customer support services performance. It includes elements such as net promotor score, loyal customer rate, customer lifetime cycle CLV, customer churn, revenue churn, net retention rate etc. Find highly impressive Evaluating Revenue And Customer Churn Boosting Customer Retention Rate With Live Chat on Slidegeeks to deliver a meaningful presentation. You can save an ample amount of time using these presentation templates. No need to worry to prepare everything from scratch because Slidegeeks experts have already done a huge research and work for you. You need to download Evaluating Revenue And Customer Churn Boosting Customer Retention Rate With Live Chat for your upcoming presentation. All the presentation templates are 100 percent editable and you can change the color and personalize the content accordingly. Download now The following slide highlights key metrics to track customer support services performance. It includes elements such as net promotor score, loyal customer rate, customer lifetime cycle CLV, customer churn, revenue churn, net retention rate etc.
Key Stats Representing Need For Improved Boosting Customer Retention Rate With Live Chat
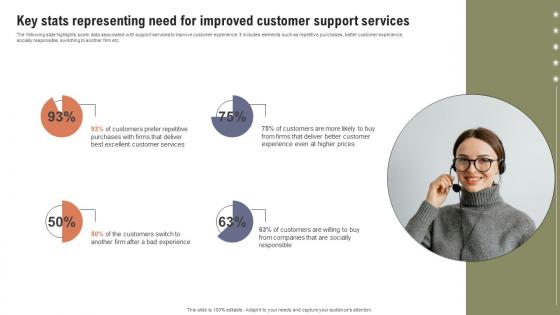
The following slide highlights some data associated with support services to improve customer experience. It includes elements such as repetitive purchases, better customer experience, socially responsible, switching to another firm etc. Formulating a presentation can take up a lot of effort and time, so the content and message should always be the primary focus. The visuals of the PowerPoint can enhance the presenters message, so our Key Stats Representing Need For Improved Boosting Customer Retention Rate With Live Chat was created to help save time. Instead of worrying about the design, the presenter can concentrate on the message while our designers work on creating the ideal templates for whatever situation is needed. Slidegeeks has experts for everything from amazing designs to valuable content, we have put everything into Key Stats Representing Need For Improved Boosting Customer Retention Rate With Live Chat The following slide highlights some data associated with support services to improve customer experience. It includes elements such as repetitive purchases, better customer experience, socially responsible, switching to another firm etc.
IoT Device Management Fundamentals Dashboard Showcasing Unique Errors Per Software IoT Ss V
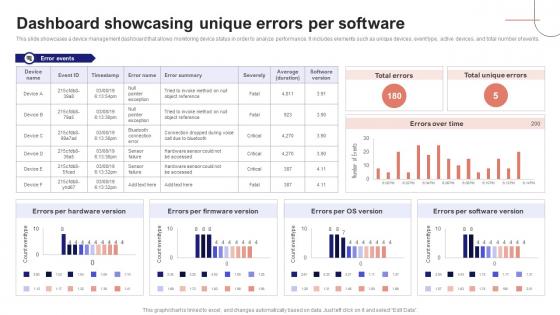
This slide showcases a device management dashboard that allows monitoring device status in order to analyze performance. It includes elements such as unique devices, event type, active devices, and total number of events. Are you in need of a template that can accommodate all of your creative concepts This one is crafted professionally and can be altered to fit any style. Use it with Google Slides or PowerPoint. Include striking photographs, symbols, depictions, and other visuals. Fill, move around, or remove text boxes as desired. Test out color palettes and font mixtures. Edit and save your work, or work with colleagues. Download IoT Device Management Fundamentals Dashboard Showcasing Unique Errors Per Software IoT SS V and observe how to make your presentation outstanding. Give an impeccable presentation to your group and make your presentation unforgettable. This slide showcases a device management dashboard that allows monitoring device status in order to analyze performance. It includes elements such as unique devices, event type, active devices, and total number of events.
Empowering The Future Introduction To Solar Farm Production Monitoring IoT SS V
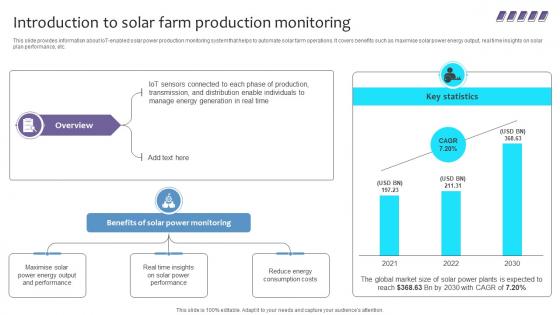
This slide provides information about IoT-enabled solar power production monitoring system that helps to automate solar farm operations. It covers benefits such as maximise solar power energy output, real time insights on solar plan performance, etc. Retrieve professionally designed Empowering The Future Introduction To Solar Farm Production Monitoring IoT SS V to effectively convey your message and captivate your listeners. Save time by selecting pre-made slideshows that are appropriate for various topics, from business to educational purposes. These themes come in many different styles, from creative to corporate, and all of them are easily adjustable and can be edited quickly. Access them as PowerPoint templates or as Google Slides themes. You do not have to go on a hunt for the perfect presentation because Slidegeeks got you covered from everywhere. This slide provides information about IoT-enabled solar power production monitoring system that helps to automate solar farm operations. It covers benefits such as maximise solar power energy output, real time insights on solar plan performance, etc.
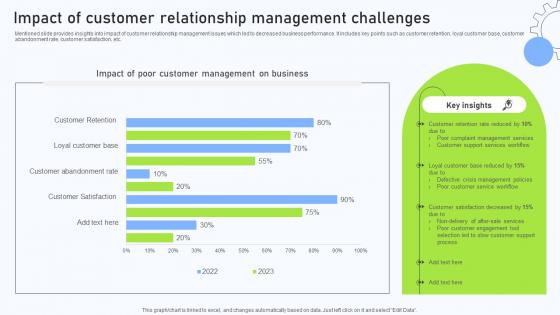
Relationship Management Automation Impact Of Customer Relationship Management
Mentioned slide provides insights into impact of customer relationship management issues which led to decreased business performance. It includes key points such as customer retention, loyal customer base, customer abandonment rate, customer satisfaction, etc. Are you in need of a template that can accommodate all of your creative concepts This one is crafted professionally and can be altered to fit any style. Use it with Google Slides or PowerPoint. Include striking photographs, symbols, depictions, and other visuals. Fill, move around, or remove text boxes as desired. Test out color palettes and font mixtures. Edit and save your work, or work with colleagues. Download Relationship Management Automation Impact Of Customer Relationship Management and observe how to make your presentation outstanding. Give an impeccable presentation to your group and make your presentation unforgettable. Mentioned slide provides insights into impact of customer relationship management issues which led to decreased business performance. It includes key points such as customer retention, loyal customer base, customer abandonment rate, customer satisfaction, etc.
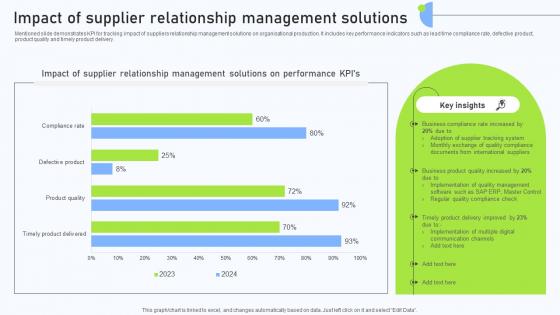
Relationship Management Automation Impact Of Supplier Relationship Management
Mentioned slide demonstrates KPI for tracking impact of suppliers relationship management solutions on organisational production. It includes key performance indicators such as lead time compliance rate, defective product, product quality and timely product delivery. Formulating a presentation can take up a lot of effort and time, so the content and message should always be the primary focus. The visuals of the PowerPoint can enhance the presenters message, so our Relationship Management Automation Impact Of Supplier Relationship Management was created to help save time. Instead of worrying about the design, the presenter can concentrate on the message while our designers work on creating the ideal templates for whatever situation is needed. Slidegeeks has experts for everything from amazing designs to valuable content, we have put everything into Relationship Management Automation Impact Of Supplier Relationship Management Mentioned slide demonstrates KPI for tracking impact of suppliers relationship management solutions on organisational production. It includes key performance indicators such as lead time compliance rate, defective product, product quality and timely product delivery.

Overview Need For Implementing Data Security Across Optimizing Retail Operations With Digital DT SS V
This slide analyses the need of implementing data security initiatives to address key customer data challenges in retail industry. It also mentions types of customer data collected such as account, location, browsing, and profile.Formulating a presentation can take up a lot of effort and time, so the content and message should always be the primary focus. The visuals of the PowerPoint can enhance the presenters message, so our Overview Need For Implementing Data Security Across Optimizing Retail Operations With Digital DT SS V was created to help save time. Instead of worrying about the design, the presenter can concentrate on the message while our designers work on creating the ideal templates for whatever situation is needed. Slidegeeks has experts for everything from amazing designs to valuable content, we have put everything into Overview Need For Implementing Data Security Across Optimizing Retail Operations With Digital DT SS V. This slide analyses the need of implementing data security initiatives to address key customer data challenges in retail industry. It also mentions types of customer data collected such as account, location, browsing, and profile.

Natural Language Generation Market Overview Natural Language Automation
This slide represents the global market overview of the Natural Language Generation market. The purpose of this slide is to showcase the various aspects of the NLG market, including CAGR rate and market segmentation analysis. It also includes the growth drivers for the NLG market. Do you know about Slidesgeeks Natural Language Generation Market Overview Natural Language Automation These are perfect for delivering any kind od presentation. Using it, create PowerPoint presentations that communicate your ideas and engage audiences. Save time and effort by using our pre-designed presentation templates that are perfect for a wide range of topic. Our vast selection of designs covers a range of styles, from creative to business, and are all highly customizable and easy to edit. Download as a PowerPoint template or use them as Google Slides themes. This slide represents the global market overview of the Natural Language Generation market. The purpose of this slide is to showcase the various aspects of the NLG market, including CAGR rate and market segmentation analysis. It also includes the growth drivers for the NLG market.
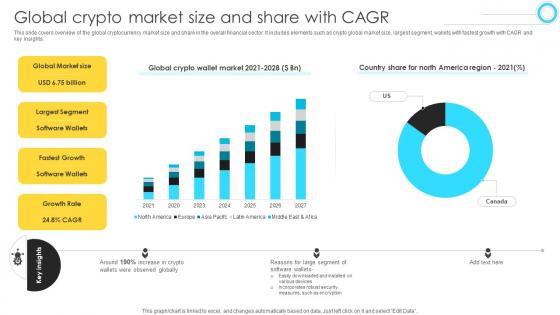
Mastering Blockchain Wallets Global Crypto Market Size And Share With CAGR BCT SS V
This slide covers overview of the global cryptocurrency market size and share in the overall financial sector. It includes elements such as crypto global market size, largest segment, wallets with fastest growth with CAGR and key insights. Retrieve professionally designed Mastering Blockchain Wallets Global Crypto Market Size And Share With CAGR BCT SS V to effectively convey your message and captivate your listeners. Save time by selecting pre-made slideshows that are appropriate for various topics, from business to educational purposes. These themes come in many different styles, from creative to corporate, and all of them are easily adjustable and can be edited quickly. Access them as PowerPoint templates or as Google Slides themes. You do not have to go on a hunt for the perfect presentation because Slidegeeks got you covered from everywhere. This slide covers overview of the global cryptocurrency market size and share in the overall financial sector. It includes elements such as crypto global market size, largest segment, wallets with fastest growth with CAGR and key insights.

Unlocking Potential IoTs Application Dashboard For Managing IoT Device In Smart City Operations IoT SS V
This slide highlights the dashboard for controlling IoT devices in smart city management operations. It provides combined information related to street lighting, waste management, smart parking, smart bin trackers, energy management, environment data, etc. Are you in need of a template that can accommodate all of your creative concepts This one is crafted professionally and can be altered to fit any style. Use it with Google Slides or PowerPoint. Include striking photographs, symbols, depictions, and other visuals. Fill, move around, or remove text boxes as desired. Test out color palettes and font mixtures. Edit and save your work, or work with colleagues. Download Unlocking Potential IoTs Application Dashboard For Managing IoT Device In Smart City Operations IoT SS V and observe how to make your presentation outstanding. Give an impeccable presentation to your group and make your presentation unforgettable. This slide highlights the dashboard for controlling IoT devices in smart city management operations. It provides combined information related to street lighting, waste management, smart parking, smart bin trackers, energy management, environment data, etc.
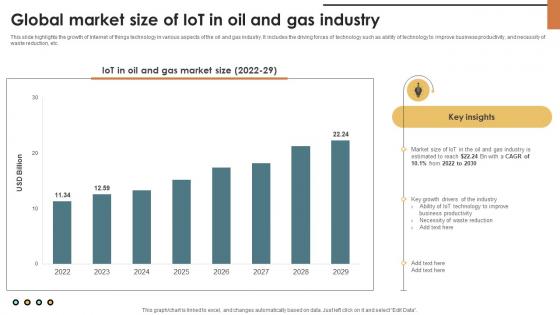
IoT Solutions For Oil Global Market Size Of IoT In Oil And Gas Industry IoT SS V
This slide highlights the growth of Internet of things technology in various aspects of the oil and gas industry. It includes the driving forces of technology such as ability of technology to improve business productivity, and necessity of waste reduction, etc. Find highly impressive IoT Solutions For Oil Global Market Size Of IoT In Oil And Gas Industry IoT SS V on Slidegeeks to deliver a meaningful presentation. You can save an ample amount of time using these presentation templates. No need to worry to prepare everything from scratch because Slidegeeks experts have already done a huge research and work for you. You need to download IoT Solutions For Oil Global Market Size Of IoT In Oil And Gas Industry IoT SS V for your upcoming presentation. All the presentation templates are 100 percent editable and you can change the color and personalize the content accordingly. Download now This slide highlights the growth of Internet of things technology in various aspects of the oil and gas industry. It includes the driving forces of technology such as ability of technology to improve business productivity, and necessity of waste reduction, etc.
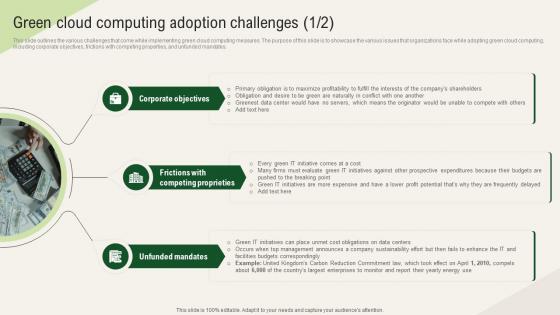
Solar Computing IT Green Cloud Computing Adoption Challenges
This slide outlines the various challenges that come while implementing green cloud computing measures. The purpose of this slide is to showcase the various issues that organizations face while adopting green cloud computing, including corporate objectives, frictions with competing properties, and unfunded mandates. Find highly impressive Solar Computing IT Green Cloud Computing Adoption Challenges on Slidegeeks to deliver a meaningful presentation. You can save an ample amount of time using these presentation templates. No need to worry to prepare everything from scratch because Slidegeeks experts have already done a huge research and work for you. You need to download Solar Computing IT Green Cloud Computing Adoption Challenges for your upcoming presentation. All the presentation templates are 100 percent editable and you can change the color and personalize the content accordingly. Download now This slide outlines the various challenges that come while implementing green cloud computing measures. The purpose of this slide is to showcase the various issues that organizations face while adopting green cloud computing, including corporate objectives, frictions with competing properties, and unfunded mandates.
Solar Computing IT Green Cloud Computing Performance Tracking Dashboard
This slide depicts the performance tracking dashboard for green cloud computing. This slide aims to showcase the performance tracking report of green cloud computing by covering parameters such as Power Use Effectiveness PUE, high-density zone, history, consumption, and Average Propensity to Consume APC consumption. Are you in need of a template that can accommodate all of your creative concepts This one is crafted professionally and can be altered to fit any style. Use it with Google Slides or PowerPoint. Include striking photographs, symbols, depictions, and other visuals. Fill, move around, or remove text boxes as desired. Test out color palettes and font mixtures. Edit and save your work, or work with colleagues. Download Solar Computing IT Green Cloud Computing Performance Tracking Dashboard and observe how to make your presentation outstanding. Give an impeccable presentation to your group and make your presentation unforgettable. This slide depicts the performance tracking dashboard for green cloud computing. This slide aims to showcase the performance tracking report of green cloud computing by covering parameters such as Power Use Effectiveness PUE, high-density zone, history, consumption, and Average Propensity to Consume APC consumption.
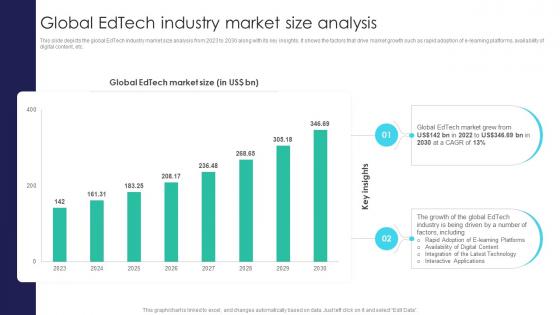
Global Digital Education Global Edtech Industry Market Size Analysis IR SS V
This slide depicts the global EdTech industry market size analysis from 2023 to 2030 along with its key insights. It shows the factors that drive market growth such as rapid adoption of e-learning platforms, availability of digital content, etc. Are you in need of a template that can accommodate all of your creative concepts This one is crafted professionally and can be altered to fit any style. Use it with Google Slides or PowerPoint. Include striking photographs, symbols, depictions, and other visuals. Fill, move around, or remove text boxes as desired. Test out color palettes and font mixtures. Edit and save your work, or work with colleagues. Download Global Digital Education Global Edtech Industry Market Size Analysis IR SS V and observe how to make your presentation outstanding. Give an impeccable presentation to your group and make your presentation unforgettable. This slide depicts the global EdTech industry market size analysis from 2023 to 2030 along with its key insights. It shows the factors that drive market growth such as rapid adoption of e-learning platforms, availability of digital content, etc.
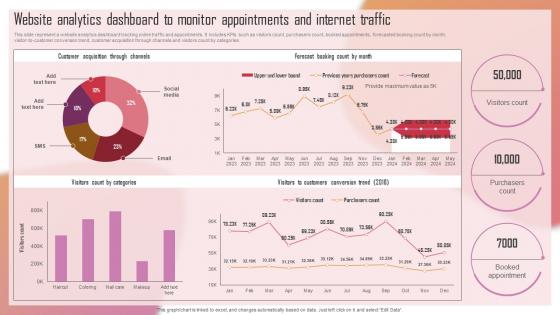
Customizing The Salon Experience Website Analytics Dashboard To Monitor Appointments Strategy SS V
This slide represent a website analytics dashboard tracking online traffic and appointments. It includes KPIs such as visitors count, purchasers count, booked appointments, forecasted booking count by month, visitor-to-customer conversion trend, customer acquisition through channels and visitors count by categories. Retrieve professionally designed Customizing The Salon Experience Website Analytics Dashboard To Monitor Appointments Strategy SS V to effectively convey your message and captivate your listeners. Save time by selecting pre-made slideshows that are appropriate for various topics, from business to educational purposes. These themes come in many different styles, from creative to corporate, and all of them are easily adjustable and can be edited quickly. Access them as PowerPoint templates or as Google Slides themes. You do not have to go on a hunt for the perfect presentation because Slidegeeks got you covered from everywhere. This slide represent a website analytics dashboard tracking online traffic and appointments. It includes KPIs such as visitors count, purchasers count, booked appointments, forecasted booking count by month, visitor-to-customer conversion trend, customer acquisition through channels and visitors count by categories.
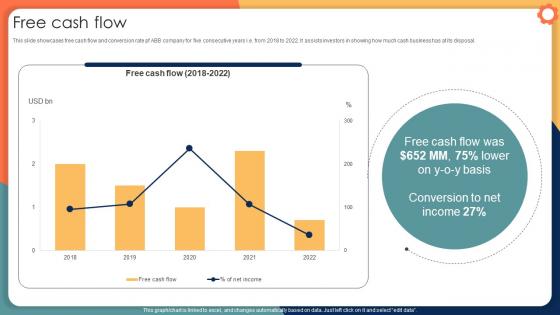
Free Cash Flow Engineering Solution Provider Company Profile CP SS V
This slide showcases free cash flow and conversion rate pf ABB company for five consecutive years i.e. from 2018 to 2022. It assists investors in showing how much cash business has at its disposal. Are you in need of a template that can accommodate all of your creative concepts This one is crafted professionally and can be altered to fit any style. Use it with Google Slides or PowerPoint. Include striking photographs, symbols, depictions, and other visuals. Fill, move around, or remove text boxes as desired. Test out color palettes and font mixtures. Edit and save your work, or work with colleagues. Download Free Cash Flow Engineering Solution Provider Company Profile CP SS V and observe how to make your presentation outstanding. Give an impeccable presentation to your group and make your presentation unforgettable. This slide showcases free cash flow and conversion rate pf ABB company for five consecutive years i.e. from 2018 to 2022. It assists investors in showing how much cash business has at its disposal.
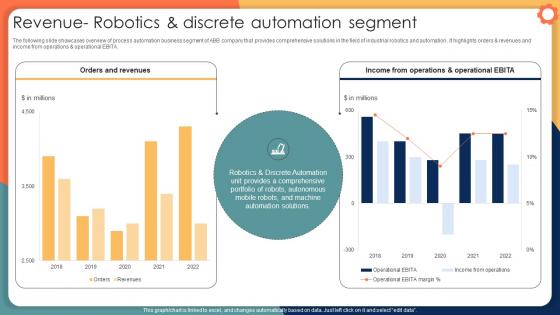
Revenue Robotics And Discrete Automation Segment Engineering Solution Provider Company Profile CP SS V
The following slide showcases overview of process automation business segment of ABB company that provides comprehensive solutions in the field of industrial robotics and automation . It highlights orders and revenues and income from operations and operational EBITA. Do you know about Slidesgeeks Revenue Robotics And Discrete Automation Segment Engineering Solution Provider Company Profile CP SS V These are perfect for delivering any kind od presentation. Using it, create PowerPoint presentations that communicate your ideas and engage audiences. Save time and effort by using our pre-designed presentation templates that are perfect for a wide range of topic. Our vast selection of designs covers a range of styles, from creative to business, and are all highly customizable and easy to edit. Download as a PowerPoint template or use them as Google Slides themes. The following slide showcases overview of process automation business segment of ABB company that provides comprehensive solutions in the field of industrial robotics and automation . It highlights orders and revenues and income from operations and operational EBITA.
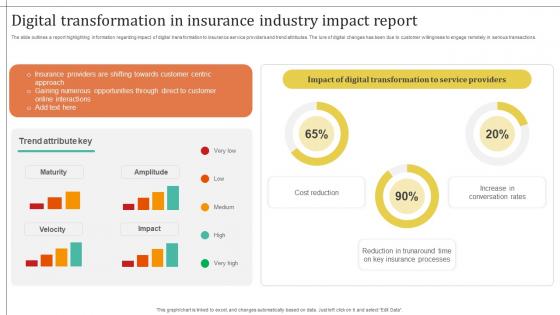
Improving Customer Satisfaction Digital Transformation In Insurance Industry Impact
The slide outlines a report highlighting information regarding impact of digital transformation to insurance service providers and trend attributes. The lure of digital changes has been due to customer willingness to engage remotely in serious transactions. Formulating a presentation can take up a lot of effort and time, so the content and message should always be the primary focus. The visuals of the PowerPoint can enhance the presenters message, so our Improving Customer Satisfaction Digital Transformation In Insurance Industry Impact was created to help save time. Instead of worrying about the design, the presenter can concentrate on the message while our designers work on creating the ideal templates for whatever situation is needed. Slidegeeks has experts for everything from amazing designs to valuable content, we have put everything into Improving Customer Satisfaction Digital Transformation In Insurance Industry Impact. The slide outlines a report highlighting information regarding impact of digital transformation to insurance service providers and trend attributes. The lure of digital changes has been due to customer willingness to engage remotely in serious transactions.
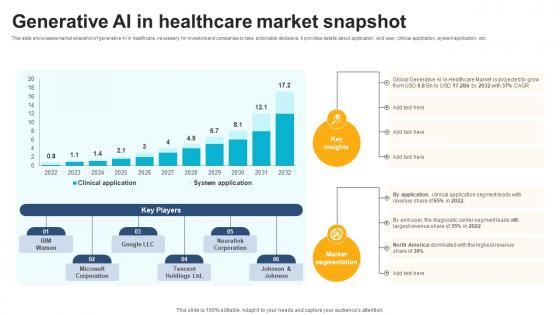
Generative AI In Healthcare Market Snapshot ChatGPT And Healthcare Innovation Enhancing AI SS V
This slide showcases market snapshot of generative AI in healthcare, necessary for investors and companies to take actionable decisions. It provides details about application, end user, clinical application, system application, etc. Are you in need of a template that can accommodate all of your creative concepts This one is crafted professionally and can be altered to fit any style. Use it with Google Slides or PowerPoint. Include striking photographs, symbols, depictions, and other visuals. Fill, move around, or remove text boxes as desired. Test out color palettes and font mixtures. Edit and save your work, or work with colleagues. Download Generative AI In Healthcare Market Snapshot ChatGPT And Healthcare Innovation Enhancing AI SS V and observe how to make your presentation outstanding. Give an impeccable presentation to your group and make your presentation unforgettable. This slide showcases market snapshot of generative AI in healthcare, necessary for investors and companies to take actionable decisions. It provides details about application, end user, clinical application, system application, etc.
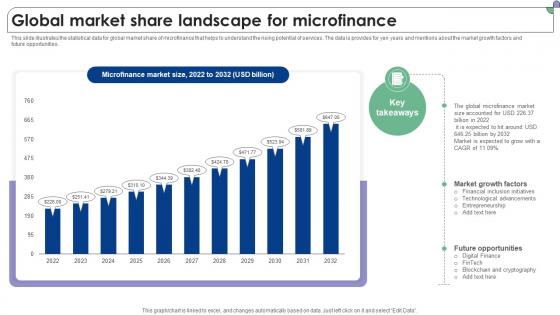
Global Market Share Landscape For Microfinance Complete Guide To Microfinance Fin SS V
This slide illustrates the statistical data for global market share of microfinance that helps to understand the rising potential of services. The data is provides for yen years and mentions about the market growth factors and future opportunities. Are you in need of a template that can accommodate all of your creative concepts This one is crafted professionally and can be altered to fit any style. Use it with Google Slides or PowerPoint. Include striking photographs, symbols, depictions, and other visuals. Fill, move around, or remove text boxes as desired. Test out color palettes and font mixtures. Edit and save your work, or work with colleagues. Download Global Market Share Landscape For Microfinance Complete Guide To Microfinance Fin SS V and observe how to make your presentation outstanding. Give an impeccable presentation to your group and make your presentation unforgettable. This slide illustrates the statistical data for global market share of microfinance that helps to understand the rising potential of services. The data is provides for yen years and mentions about the market growth factors and future opportunities.

Overview Cybersecurity And Data Protection In Digital Transformation DT SS V
This slide presents an overview into the landscape of cybersecurity and data protection with its advantages. It also presents a survey analysis on share of SMEs that have implemented essential and basic IT security initiatives.Find highly impressive Overview Cybersecurity And Data Protection In Digital Transformation DT SS V on Slidegeeks to deliver a meaningful presentation. You can save an ample amount of time using these presentation templates. No need to worry to prepare everything from scratch because Slidegeeks experts have already done a huge research and work for you. You need to download Overview Cybersecurity And Data Protection In Digital Transformation DT SS V for your upcoming presentation. All the presentation templates are 100 percent editable and you can change the color and personalize the content accordingly. Download now This slide presents an overview into the landscape of cybersecurity and data protection with its advantages. It also presents a survey analysis on share of SMEs that have implemented essential and basic IT security initiatives.
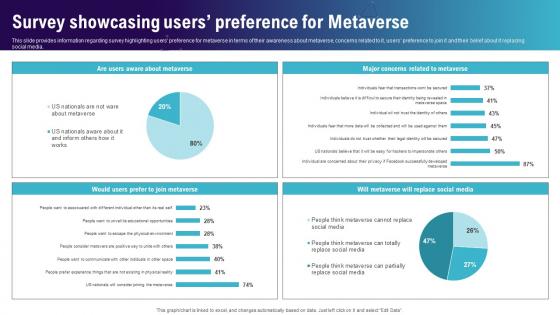
Survey Showcasing Users Preference For Metaverse Continuum Of Technology Revamping Business AI SS V
This slide provides information regarding survey highlighting users preference for metaverse in terms of their awareness about metaverse, concerns related to it, users preference to join it and their belief about it replacing social media. Are you in need of a template that can accommodate all of your creative concepts This one is crafted professionally and can be altered to fit any style. Use it with Google Slides or PowerPoint. Include striking photographs, symbols, depictions, and other visuals. Fill, move around, or remove text boxes as desired. Test out color palettes and font mixtures. Edit and save your work, or work with colleagues. Download Survey Showcasing Users Preference For Metaverse Continuum Of Technology Revamping Business AI SS V and observe how to make your presentation outstanding. Give an impeccable presentation to your group and make your presentation unforgettable. This slide provides information regarding survey highlighting users preference for metaverse in terms of their awareness about metaverse, concerns related to it, users preference to join it and their belief about it replacing social media.
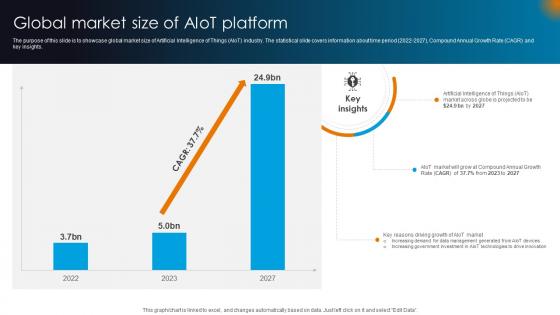
Integrating AI With IoT Global Market Size Of AIoT Platform IoT SS V
The purpose of this slide is to showcase global market size of Artificial Intelligence of Things AIoT industry. The statistical slide covers information about time period 2022-2027, Compound Annual Growth Rate CAGR and key insights. Formulating a presentation can take up a lot of effort and time, so the content and message should always be the primary focus. The visuals of the PowerPoint can enhance the presenters message, so our Integrating AI With IoT Global Market Size Of AIoT Platform IoT SS V was created to help save time. Instead of worrying about the design, the presenter can concentrate on the message while our designers work on creating the ideal templates for whatever situation is needed. Slidegeeks has experts for everything from amazing designs to valuable content, we have put everything into Integrating AI With IoT Global Market Size Of AIoT Platform IoT SS V. The purpose of this slide is to showcase global market size of Artificial Intelligence of Things AIoT industry. The statistical slide covers information about time period 2022-2027, Compound Annual Growth Rate CAGR and key insights.
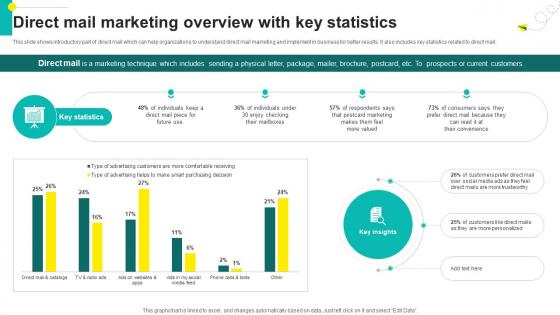
One On One Advertising Direct Mail Marketing Overview With Key Statistics Strategy SS V
This slide shows introductory part of direct mail which can help organizations to understand direct mail marketing and implement in business for better results. It also includes key statistics related to direct mail. Find highly impressive One On One Advertising Direct Mail Marketing Overview With Key Statistics Strategy SS V on Slidegeeks to deliver a meaningful presentation. You can save an ample amount of time using these presentation templates. No need to worry to prepare everything from scratch because Slidegeeks experts have already done a huge research and work for you. You need to download One On One Advertising Direct Mail Marketing Overview With Key Statistics Strategy SS V for your upcoming presentation. All the presentation templates are 100 percent editable and you can change the color and personalize the content accordingly. Download now This slide shows introductory part of direct mail which can help organizations to understand direct mail marketing and implement in business for better results. It also includes key statistics related to direct mail.
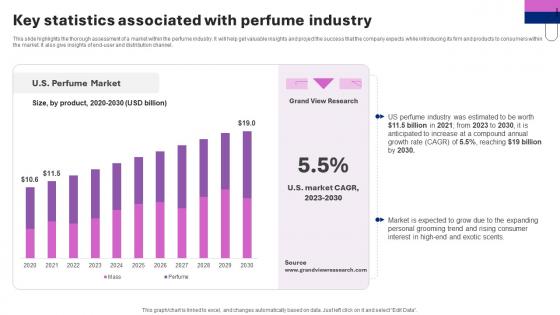
Perfume Manufacturing Business Plan Key Statistics Associated With Perfume Industry BP SS V
This slide highlights the thorough assessment of a market within the perfume industry. It will help get valuable insights and project the success that the company expects while introducing its firm and products to consumers within the market. It also give insights of end-user and distribution channel. Formulating a presentation can take up a lot of effort and time, so the content and message should always be the primary focus. The visuals of the PowerPoint can enhance the presenters message, so our Perfume Manufacturing Business Plan Key Statistics Associated With Perfume Industry BP SS V was created to help save time. Instead of worrying about the design, the presenter can concentrate on the message while our designers work on creating the ideal templates for whatever situation is needed. Slidegeeks has experts for everything from amazing designs to valuable content, we have put everything into Perfume Manufacturing Business Plan Key Statistics Associated With Perfume Industry BP SS V. This slide highlights the thorough assessment of a market within the perfume industry. It will help get valuable insights and project the success that the company expects while introducing its firm and products to consumers within the market. It also give insights of end-user and distribution channel.
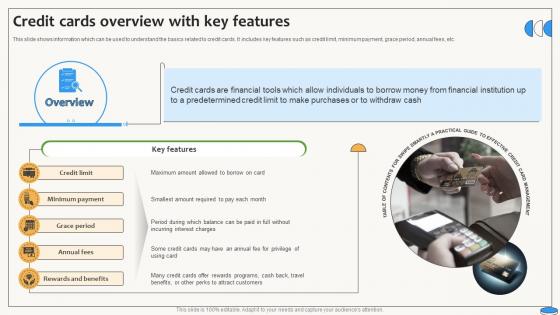
Credit Cards Overview With Key Features Swipe Smartly A Practical Guide Fin SS V
This slide shows information which can be used to understand the basics related to credit cards. It includes key features such as credit limit, minimum payment, grace period, annual fees, etc. Formulating a presentation can take up a lot of effort and time, so the content and message should always be the primary focus. The visuals of the PowerPoint can enhance the presenters message, so our Credit Cards Overview With Key Features Swipe Smartly A Practical Guide Fin SS V was created to help save time. Instead of worrying about the design, the presenter can concentrate on the message while our designers work on creating the ideal templates for whatever situation is needed. Slidegeeks has experts for everything from amazing designs to valuable content, we have put everything into Credit Cards Overview With Key Features Swipe Smartly A Practical Guide Fin SS V This slide shows information which can be used to understand the basics related to credit cards. It includes key features such as credit limit, minimum payment, grace period, annual fees, etc.
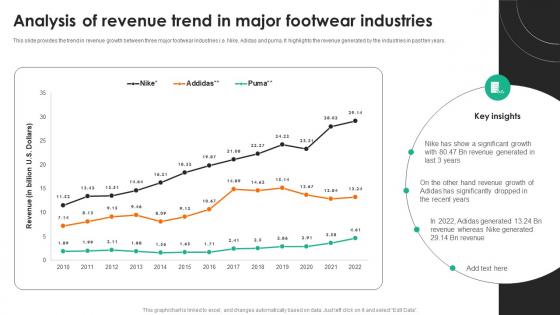
Evaluating Adidas Branding Analysis Of Revenue Trend In Major Footwear Industries Strategy SS V
This slide provides the trend in revenue growth between three major footwear industries i.e. Nike, Adidas and puma. It highlights the revenue generated by the industries in past ten years. Formulating a presentation can take up a lot of effort and time, so the content and message should always be the primary focus. The visuals of the PowerPoint can enhance the presenters message, so our Evaluating Adidas Branding Analysis Of Revenue Trend In Major Footwear Industries Strategy SS V was created to help save time. Instead of worrying about the design, the presenter can concentrate on the message while our designers work on creating the ideal templates for whatever situation is needed. Slidegeeks has experts for everything from amazing designs to valuable content, we have put everything into Evaluating Adidas Branding Analysis Of Revenue Trend In Major Footwear Industries Strategy SS V. This slide provides the trend in revenue growth between three major footwear industries i.e. Nike, Adidas and puma. It highlights the revenue generated by the industries in past ten years.

Digital Content Performance Assessment Top Of The Funnel Digital Content Strategy SS V
The following slide depicts key performance indicators of digital content marketing to monitor results. It includes elements such as page views, social shares, click through rate, blog subscribers, conversions, opportunities influenced, average time on page etc. Find highly impressive Digital Content Performance Assessment Top Of The Funnel Digital Content Strategy SS V on Slidegeeks to deliver a meaningful presentation. You can save an ample amount of time using these presentation templates. No need to worry to prepare everything from scratch because Slidegeeks experts have already done a huge research and work for you. You need to download Digital Content Performance Assessment Top Of The Funnel Digital Content Strategy SS V for your upcoming presentation. All the presentation templates are 100 percent editable and you can change the color and personalize the content accordingly. Download now The following slide depicts key performance indicators of digital content marketing to monitor results. It includes elements such as page views, social shares, click through rate, blog subscribers, conversions, opportunities influenced, average time on page etc.
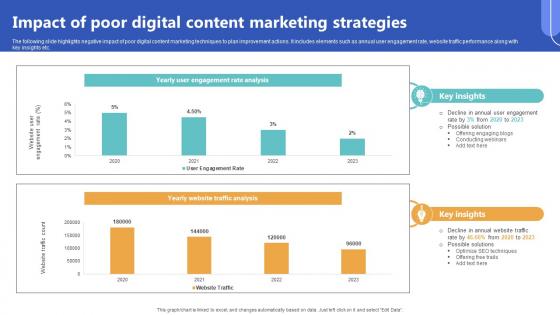
Impact Of Poor Digital Content Marketing Strategies Top Of The Funnel Digital Content Strategy SS V
The following slide highlights negative impact of poor digital content marketing techniques to plan improvement actions. It includes elements such as annual user engagement rate, website traffic performance along with key insights etc. Formulating a presentation can take up a lot of effort and time, so the content and message should always be the primary focus. The visuals of the PowerPoint can enhance the presenters message, so our Impact Of Poor Digital Content Marketing Strategies Top Of The Funnel Digital Content Strategy SS V was created to help save time. Instead of worrying about the design, the presenter can concentrate on the message while our designers work on creating the ideal templates for whatever situation is needed. Slidegeeks has experts for everything from amazing designs to valuable content, we have put everything into Impact Of Poor Digital Content Marketing Strategies Top Of The Funnel Digital Content Strategy SS V The following slide highlights negative impact of poor digital content marketing techniques to plan improvement actions. It includes elements such as annual user engagement rate, website traffic performance along with key insights etc.

Immersive Training For Practical Post Training Impact Of Simulation Training On Decision DTE SS V
This slide includes key performance indicators that the company has a positive impact on due to effective training programs such as team collaboration rate, error rate, etc. Formulating a presentation can take up a lot of effort and time, so the content and message should always be the primary focus. The visuals of the PowerPoint can enhance the presenters message, so our Immersive Training For Practical Post Training Impact Of Simulation Training On Decision DTE SS V was created to help save time. Instead of worrying about the design, the presenter can concentrate on the message while our designers work on creating the ideal templates for whatever situation is needed. Slidegeeks has experts for everything from amazing designs to valuable content, we have put everything into Immersive Training For Practical Post Training Impact Of Simulation Training On Decision DTE SS V. This slide includes key performance indicators that the company has a positive impact on due to effective training programs such as team collaboration rate, error rate, etc.
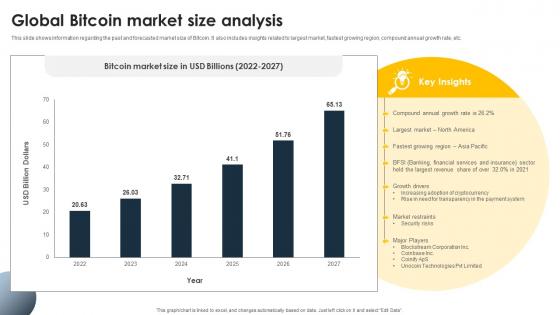
Complete Beginners Guide Global Bitcoin Market Size Analysis Fin SS V
This slide shows information regarding the past and forecasted market size of Bitcoin. It also includes insights related to largest market, fastest growing region, compound annual growth rate, etc. Formulating a presentation can take up a lot of effort and time, so the content and message should always be the primary focus. The visuals of the PowerPoint can enhance the presenters message, so our Complete Beginners Guide Global Bitcoin Market Size Analysis Fin SS V was created to help save time. Instead of worrying about the design, the presenter can concentrate on the message while our designers work on creating the ideal templates for whatever situation is needed. Slidegeeks has experts for everything from amazing designs to valuable content, we have put everything into Complete Beginners Guide Global Bitcoin Market Size Analysis Fin SS V. This slide shows information regarding the past and forecasted market size of Bitcoin. It also includes insights related to largest market, fastest growing region, compound annual growth rate, etc.
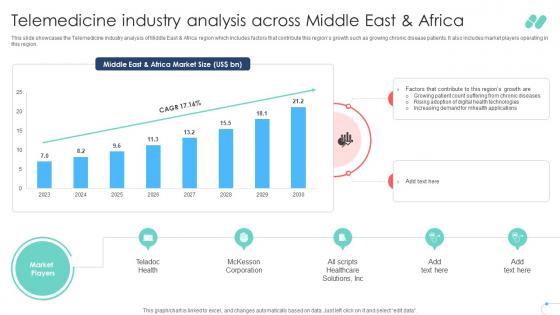
Telemedicine Industry Analysis Across Middle East And Africa Remote Healthcare Services IR SS V
This slide showcases the Telemedicine industry analysis of Middle East and Africa region which includes factors that contribute this regions growth such as growing chronic disease patients. It also includes market players operating in this region. Do you know about Slidesgeeks Telemedicine Industry Analysis Across Middle East And Africa Remote Healthcare Services IR SS V These are perfect for delivering any kind od presentation. Using it, create PowerPoint presentations that communicate your ideas and engage audiences. Save time and effort by using our pre-designed presentation templates that are perfect for a wide range of topic. Our vast selection of designs covers a range of styles, from creative to business, and are all highly customizable and easy to edit. Download as a PowerPoint template or use them as Google Slides themes. This slide showcases the Telemedicine industry analysis of Middle East and Africa region which includes factors that contribute this regions growth such as growing chronic disease patients. It also includes market players operating in this region.
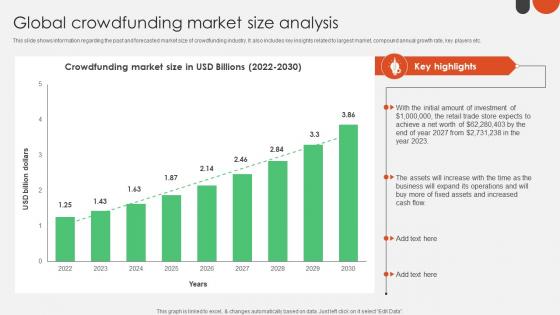
Global Crowdfunding Market Size Analysis Crowdfunding For Nonprofits To Support Fin SS V
This slide shows information regarding the past and forecasted market size of crowdfunding industry. It also includes key insights related to largest market, compound annual growth rate, key players etc. Formulating a presentation can take up a lot of effort and time, so the content and message should always be the primary focus. The visuals of the PowerPoint can enhance the presenters message, so our Global Crowdfunding Market Size Analysis Crowdfunding For Nonprofits To Support Fin SS V was created to help save time. Instead of worrying about the design, the presenter can concentrate on the message while our designers work on creating the ideal templates for whatever situation is needed. Slidegeeks has experts for everything from amazing designs to valuable content, we have put everything into Global Crowdfunding Market Size Analysis Crowdfunding For Nonprofits To Support Fin SS V This slide shows information regarding the past and forecasted market size of crowdfunding industry. It also includes key insights related to largest market, compound annual growth rate, key players etc.
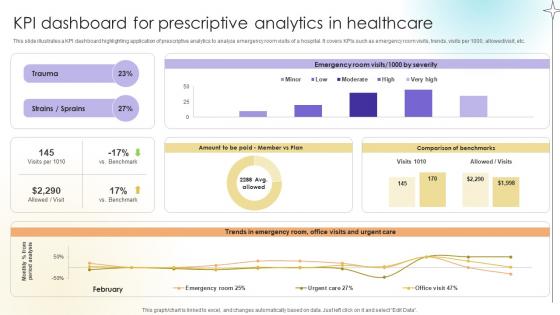
KPI Dashboard For Prescriptive Analytics In Healthcare Data Analytics SS V
This slide illustrates a KPI dashboard highlighting application of prescriptive analytics to analyze emergency room visits of a hospital. It covers KPIs such as emergency room visits, trends, visits per 1000, allowed or visit, etc. Find highly impressive KPI Dashboard For Prescriptive Analytics In Healthcare Data Analytics SS V on Slidegeeks to deliver a meaningful presentation. You can save an ample amount of time using these presentation templates. No need to worry to prepare everything from scratch because Slidegeeks experts have already done a huge research and work for you. You need to download KPI Dashboard For Prescriptive Analytics In Healthcare Data Analytics SS V for your upcoming presentation. All the presentation templates are 100 percent editable and you can change the color and personalize the content accordingly. Download now This slide illustrates a KPI dashboard highlighting application of prescriptive analytics to analyze emergency room visits of a hospital. It covers KPIs such as emergency room visits, trends, visits per 1000, allowed or visit, etc.
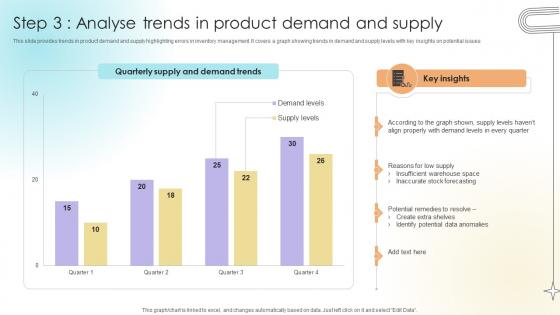
Step 3 Analyse Trends In Product Demand And Supply Data Analytics SS V
This slide provides trends in product demand and supply highlighting errors in inventory management. It covers a graph showing trends in demand and supply levels with key insights on potential issues.Formulating a presentation can take up a lot of effort and time, so the content and message should always be the primary focus. The visuals of the PowerPoint can enhance the presenters message, so our Step 3 Analyse Trends In Product Demand And Supply Data Analytics SS V was created to help save time. Instead of worrying about the design, the presenter can concentrate on the message while our designers work on creating the ideal templates for whatever situation is needed. Slidegeeks has experts for everything from amazing designs to valuable content, we have put everything into Step 3 Analyse Trends In Product Demand And Supply Data Analytics SS V. This slide provides trends in product demand and supply highlighting errors in inventory management. It covers a graph showing trends in demand and supply levels with key insights on potential issues.
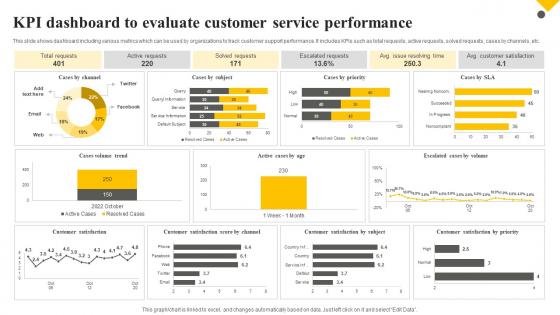
Client Support Plan To Increase Customer Kpi Dashboard To Evaluate Customer Service Performance Strategy SS V
This slide shows dashboard including various metrics which can be used by organizations to track customer support performance. It includes KPIs such as total requests, active requests, solved requests, cases by channels, etc. Find highly impressive Client Support Plan To Increase Customer Kpi Dashboard To Evaluate Customer Service Performance Strategy SS V on Slidegeeks to deliver a meaningful presentation. You can save an ample amount of time using these presentation templates. No need to worry to prepare everything from scratch because Slidegeeks experts have already done a huge research and work for you. You need to download Client Support Plan To Increase Customer Kpi Dashboard To Evaluate Customer Service Performance Strategy SS V for your upcoming presentation. All the presentation templates are 100 percent editable and you can change the color and personalize the content accordingly. Download now This slide shows dashboard including various metrics which can be used by organizations to track customer support performance. It includes KPIs such as total requests, active requests, solved requests, cases by channels, etc.
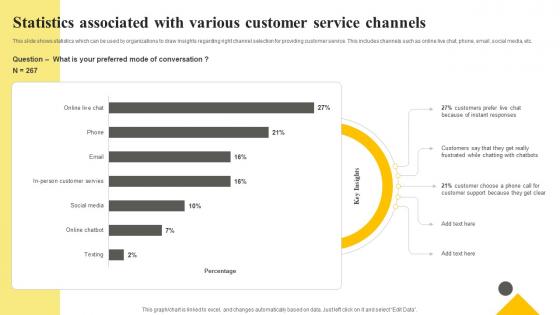
Client Support Plan To Increase Customer Statistics Associated With Various Customer Service Strategy SS V
This slide shows statistics which can be used by organizations to draw insights regarding right channel selection for providing customer service. This includes channels such as online live chat, phone, email, social media, etc. Retrieve professionally designed Client Support Plan To Increase Customer Statistics Associated With Various Customer Service Strategy SS V to effectively convey your message and captivate your listeners. Save time by selecting pre-made slideshows that are appropriate for various topics, from business to educational purposes. These themes come in many different styles, from creative to corporate, and all of them are easily adjustable and can be edited quickly. Access them as PowerPoint templates or as Google Slides themes. You do not have to go on a hunt for the perfect presentation because Slidegeeks got you covered from everywhere. This slide shows statistics which can be used by organizations to draw insights regarding right channel selection for providing customer service. This includes channels such as online live chat, phone, email, social media, etc.
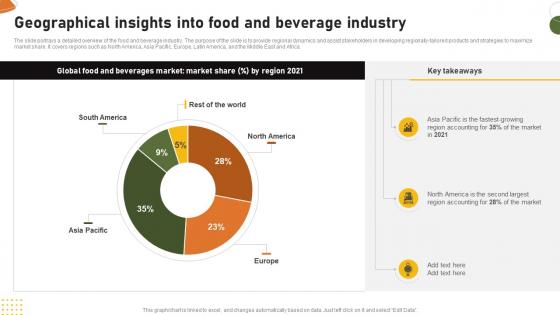
Food And Drink Industry Report Geographical Insights Into Food And Beverage Industry IR SS V
The slide portrays a detailed overview of the food and beverage industry. The purpose of the slide is to provide regional dynamics and assist stakeholders in developing regionally-tailored products and strategies to maximize market share. It covers regions such as North America, Asia Pacific, Europe, Latin America, and the Middle East and Africa. Find highly impressive Food And Drink Industry Report Geographical Insights Into Food And Beverage Industry IR SS V on Slidegeeks to deliver a meaningful presentation. You can save an ample amount of time using these presentation templates. No need to worry to prepare everything from scratch because Slidegeeks experts have already done a huge research and work for you. You need to download Food And Drink Industry Report Geographical Insights Into Food And Beverage Industry IR SS V for your upcoming presentation. All the presentation templates are 100 percent editable and you can change the color and personalize the content accordingly. Download now The slide portrays a detailed overview of the food and beverage industry. The purpose of the slide is to provide regional dynamics and assist stakeholders in developing regionally-tailored products and strategies to maximize market share. It covers regions such as North America, Asia Pacific, Europe, Latin America, and the Middle East and Africa.
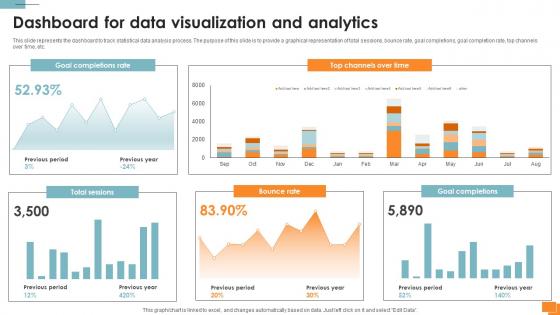
Statistical Tools For Evidence Dashboard For Data Visualization And Analytics
This slide represents the dashboard to track statistical data analysis process. The purpose of this slide is to provide a graphical representation of total sessions, bounce rate, goal completions, goal completion rate, top channels over time, etc. Are you in need of a template that can accommodate all of your creative concepts This one is crafted professionally and can be altered to fit any style. Use it with Google Slides or PowerPoint. Include striking photographs, symbols, depictions, and other visuals. Fill, move around, or remove text boxes as desired. Test out color palettes and font mixtures. Edit and save your work, or work with colleagues. Download Statistical Tools For Evidence Dashboard For Data Visualization And Analytics and observe how to make your presentation outstanding. Give an impeccable presentation to your group and make your presentation unforgettable. This slide represents the dashboard to track statistical data analysis process. The purpose of this slide is to provide a graphical representation of total sessions, bounce rate, goal completions, goal completion rate, top channels over time, etc.
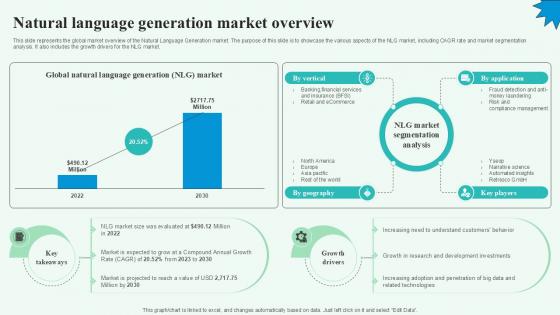
Natural Language Generation Market Overview PPT Presentation
This slide represents the global market overview of the Natural Language Generation market. The purpose of this slide is to showcase the various aspects of the NLG market, including CAGR rate and market segmentation analysis. It also includes the growth drivers for the NLG market. Do you know about Slidesgeeks Natural Language Generation Market Overview PPT Presentation These are perfect for delivering any kind od presentation. Using it, create PowerPoint presentations that communicate your ideas and engage audiences. Save time and effort by using our pre-designed presentation templates that are perfect for a wide range of topic. Our vast selection of designs covers a range of styles, from creative to business, and are all highly customizable and easy to edit. Download as a PowerPoint template or use them as Google Slides themes. This slide represents the global market overview of the Natural Language Generation market. The purpose of this slide is to showcase the various aspects of the NLG market, including CAGR rate and market segmentation analysis. It also includes the growth drivers for the NLG market.
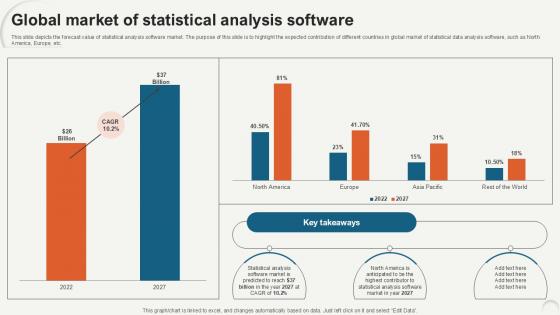
Global Market Of Statistical Data Analytics For Informed Decision Ppt PowerPoint
This slide depicts the forecast value of statistical analysis software market. The purpose of this slide is to highlight the expected contribution of different countries in global market of statistical data analysis software, such as North America, Europe, etc. Are you in need of a template that can accommodate all of your creative concepts This one is crafted professionally and can be altered to fit any style. Use it with Google Slides or PowerPoint. Include striking photographs, symbols, depictions, and other visuals. Fill, move around, or remove text boxes as desired. Test out color palettes and font mixtures. Edit and save your work, or work with colleagues. Download Global Market Of Statistical Data Analytics For Informed Decision Ppt PowerPoint and observe how to make your presentation outstanding. Give an impeccable presentation to your group and make your presentation unforgettable. This slide depicts the forecast value of statistical analysis software market. The purpose of this slide is to highlight the expected contribution of different countries in global market of statistical data analysis software, such as North America, Europe, etc.

Financial Metrics Of Electric Vehicles Luxury Automobile Vehicles PPT Sample CP SS V
This slide showcases the financial metrics of passenger vehicles. It includes metrics such as sales volume in units, EV penetration percent, market share and public charging and Y-O-Y growth. Formulating a presentation can take up a lot of effort and time, so the content and message should always be the primary focus. The visuals of the PowerPoint can enhance the presenters message, so our Financial Metrics Of Electric Vehicles Luxury Automobile Vehicles PPT Sample CP SS V was created to help save time. Instead of worrying about the design, the presenter can concentrate on the message while our designers work on creating the ideal templates for whatever situation is needed. Slidegeeks has experts for everything from amazing designs to valuable content, we have put everything into Financial Metrics Of Electric Vehicles Luxury Automobile Vehicles PPT Sample CP SS V This slide showcases the financial metrics of passenger vehicles. It includes metrics such as sales volume in units, EV penetration percent, market share and public charging and Y-O-Y growth.

ASIA Pacific Medical Device Market Outlook Surgical Devices Ppt Example IR SS V
The slide represents overview of Asia Pacific medical device industry. The purpose of the slide is to provide comprehensive analysis and forecast, offering insights into market trends, growth opportunities, and key factors influencing the sectors trajectory. It cover countries such as India and China. Create an editable ASIA Pacific Medical Device Market Outlook Surgical Devices Ppt Example IR SS V that communicates your idea and engages your audience. Whether you are presenting a business or an educational presentation, pre-designed presentation templates help save time. ASIA Pacific Medical Device Market Outlook Surgical Devices Ppt Example IR SS V is highly customizable and very easy to edit, covering many different styles from creative to business presentations. Slidegeeks has creative team members who have crafted amazing templates. So, go and get them without any delay. The slide represents overview of Asia Pacific medical device industry. The purpose of the slide is to provide comprehensive analysis and forecast, offering insights into market trends, growth opportunities, and key factors influencing the sectors trajectory. It cover countries such as India and China.
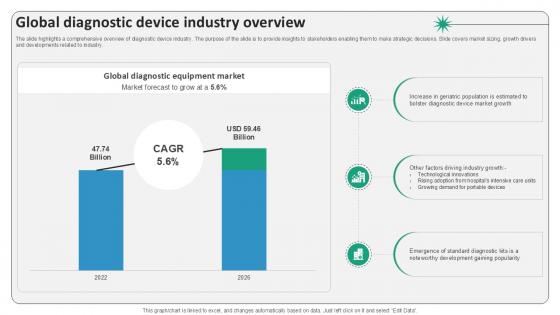
Global Diagnostic Device Industry Overview Surgical Devices Ppt Example IR SS V
The slide highlights a comprehensive overview of diagnostic device industry. The purpose of the slide is to provide insights to stakeholders enabling them to make strategic decisions. Slide covers market sizing, growth drivers and developments related to industry. Are you in need of a template that can accommodate all of your creative concepts This one is crafted professionally and can be altered to fit any style. Use it with Google Slides or PowerPoint. Include striking photographs, symbols, depictions, and other visuals. Fill, move around, or remove text boxes as desired. Test out color palettes and font mixtures. Edit and save your work, or work with colleagues. Download Global Diagnostic Device Industry Overview Surgical Devices Ppt Example IR SS V and observe how to make your presentation outstanding. Give an impeccable presentation to your group and make your presentation unforgettable. The slide highlights a comprehensive overview of diagnostic device industry. The purpose of the slide is to provide insights to stakeholders enabling them to make strategic decisions. Slide covers market sizing, growth drivers and developments related to industry.
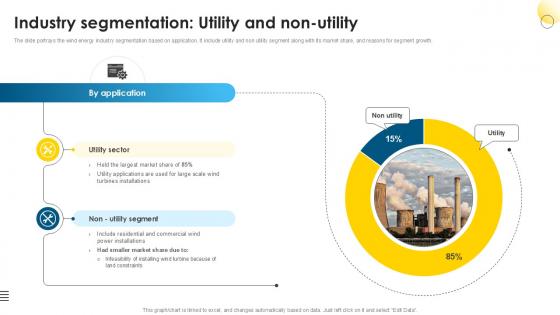
Industry Segmentation Utility Global Wind Power Market PPT Sample IR SS V
The slide portrays the wind energy industry segmentation based on application. It include utility and non utility segment along with its market share, and reasons for segment growth. Formulating a presentation can take up a lot of effort and time, so the content and message should always be the primary focus. The visuals of the PowerPoint can enhance the presenters message, so our Industry Segmentation Utility Global Wind Power Market PPT Sample IR SS V was created to help save time. Instead of worrying about the design, the presenter can concentrate on the message while our designers work on creating the ideal templates for whatever situation is needed. Slidegeeks has experts for everything from amazing designs to valuable content, we have put everything into Industry Segmentation Utility Global Wind Power Market PPT Sample IR SS V The slide portrays the wind energy industry segmentation based on application. It include utility and non utility segment along with its market share, and reasons for segment growth.
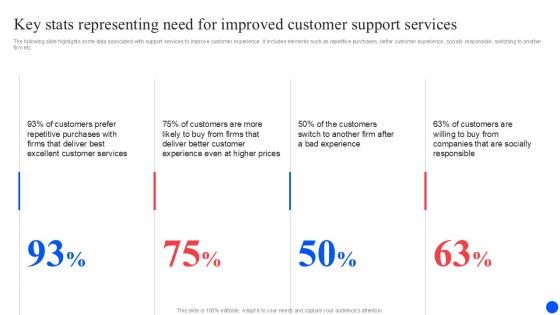
Key Stats Representing Need For Improving Customer Retention PPT Presentation
The following slide highlights some data associated with support services to improve customer experience. It includes elements such as repetitive purchases, better customer experience, socially responsible, switching to another firm etc. Formulating a presentation can take up a lot of effort and time, so the content and message should always be the primary focus. The visuals of the PowerPoint can enhance the presenters message, so our Key Stats Representing Need For Improving Customer Retention PPT Presentation was created to help save time. Instead of worrying about the design, the presenter can concentrate on the message while our designers work on creating the ideal templates for whatever situation is needed. Slidegeeks has experts for everything from amazing designs to valuable content, we have put everything into Key Stats Representing Need For Improving Customer Retention PPT Presentation The following slide highlights some data associated with support services to improve customer experience. It includes elements such as repetitive purchases, better customer experience, socially responsible, switching to another firm etc.


 Continue with Email

 Home
Home


