Cost Summary
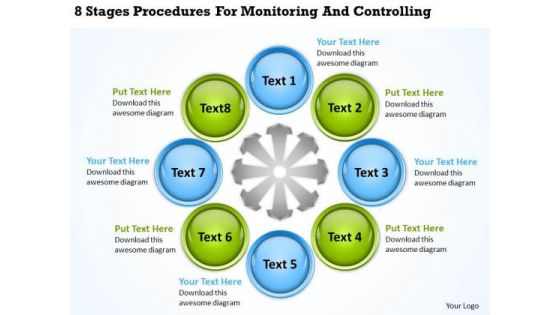
Business Charts 8 Stages Procedures For Monitoring And Controlling PowerPoint Slides
We present our business charts 8 stages procedures for monitoring and controlling PowerPoint Slides.Present our Circle Charts PowerPoint Templates because Our PowerPoint Templates and Slides will let your words and thoughts hit bullseye everytime. Present our Ring Charts PowerPoint Templates because Our PowerPoint Templates and Slides are created with admirable insight. Use them and give your group a sense of your logical mind. Use our Circle Charts PowerPoint Templates because It will get your audience in sync. Use our Process and Flows PowerPoint Templates because Our PowerPoint Templates and Slides will give you great value for your money. Be assured of finding the best projection to highlight your words. Download our Ring Charts PowerPoint Templates because Our PowerPoint Templates and Slides will let Your superior ideas hit the target always and everytime.Use these PowerPoint slides for presentations relating to Action, analysis, attitude, brainstorming, business, chart, classroom, concept,conceptual, conference, connection, corporate, design, diagram, direction,eight, employee, enhance, financial, formula, future, goal, graphic, guidelines,idea, link, management, market, marketing, mind, mindmap, organization,organize, plan, process, product, relation, render, solutions, strategy, success, successful, tactic, target, training, unity, vision. The prominent colors used in the PowerPoint template are Green lime, Blue, Gray. Our Business Charts 8 Stages Procedures For Monitoring And Controlling PowerPoint Slides capture the attention of your audience. With our money back guarantee you have nothing to lose.
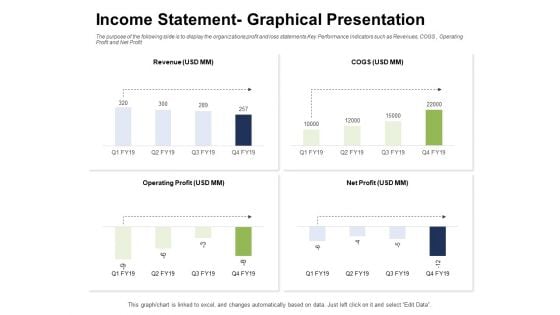
Ways To Bounce Back From Insolvency Income Statement Graphical Presentation Slides PDF
Presenting this set of slides with name ways to bounce back from insolvency income statement graphical presentation slides pdf. The topics discussed in these slides are revenue, operating profit, net profit. This is a completely editable PowerPoint presentation and is available for immediate download. Download now and impress your audience.
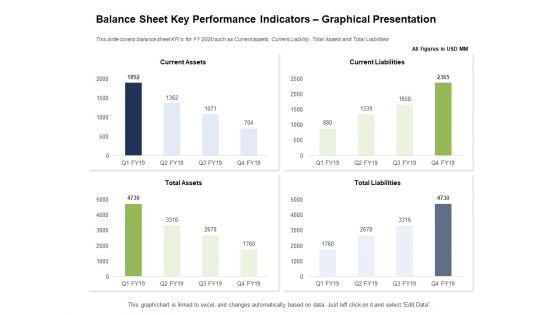
Ways To Bounce Back From Insolvency Balance Sheet Key Performance Indicators Graphical Presentation Brochure PDF
Presenting this set of slides with name ways to bounce back from insolvency balance sheet key performance indicators graphical presentation brochure pdf. The topics discussed in these slides are current assets, current liabilities, total assets, total liabilities. This is a completely editable PowerPoint presentation and is available for immediate download. Download now and impress your audience.
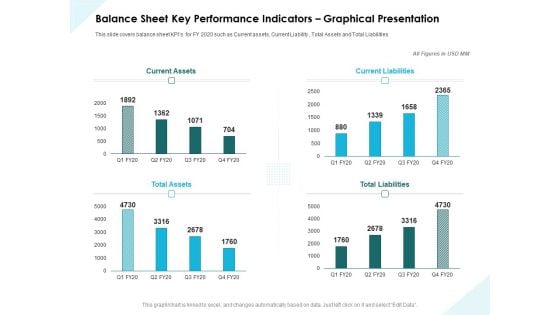
Issues Which Leads To Insolvency Balance Sheet Key Performance Indicators Graphical Presentation Information PDF
Presenting this set of slides with name issues which leads to insolvency balance sheet key performance indicators graphical presentation information pdf. The topics discussed in these slides are current assets, current liabilities, total assets, total liabilities. This is a completely editable PowerPoint presentation and is available for immediate download. Download now and impress your audience.
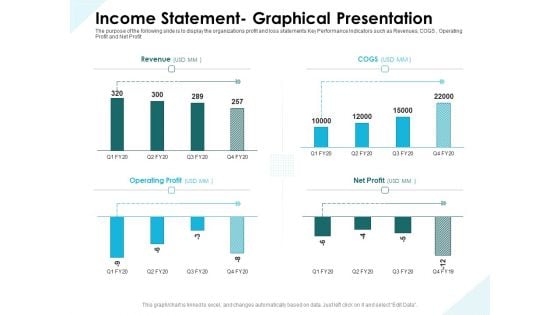
Issues Which Leads To Insolvency Income Statement Graphical Presentation Download PDF
Presenting this set of slides with name issues which leads to insolvency income statement graphical presentation download pdf. The topics discussed in these slides are revenue, operating profit, net profit. This is a completely editable PowerPoint presentation and is available for immediate download. Download now and impress your audience.
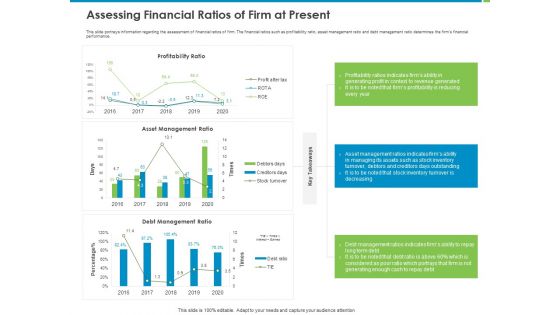
Corporate Turnaround Strategies Assessing Financial Ratios Of Firm At Present Topics PDF
Presenting this set of slides with name corporate turnaround strategies assessing financial ratios of firm at present topics pdf. The topics discussed in these slides are profitability ratio, asset management ratio, debt management ratio . This is a completely editable PowerPoint presentation and is available for immediate download. Download now and impress your audience.
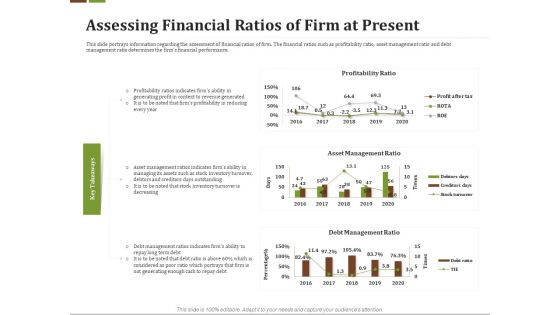
Effective Corporate Turnaround Management Assessing Financial Ratios Of Firm At Present Designs PDF
Presenting this set of slides with name effective corporate turnaround management assessing financial ratios of firm at present designs pdf. The topics discussed in these slides are profitability ratio, asset management ratio, debt management ratio . This is a completely editable PowerPoint presentation and is available for immediate download. Download now and impress your audience.
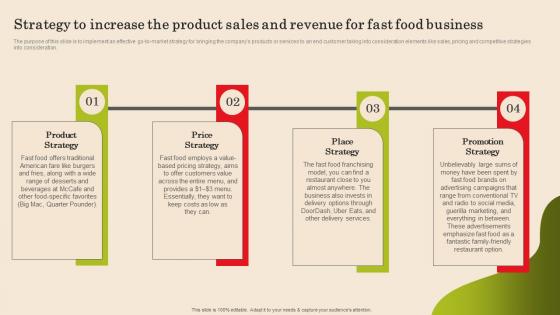
Strategy To Increase The Product Sales And Revenue For Fast Food Business Plan Template Pdf
The purpose of this slide is to implement an effective go-to-market strategy for bringing the companys products or services to an end customer taking into consideration elements like sales, pricing and competitive strategies.into consideration. Create an editable Strategy To Increase The Product Sales And Revenue For Fast Food Business Plan Template Pdf that communicates your idea and engages your audience. Whether you are presenting a business or an educational presentation, pre-designed presentation templates help save time. Strategy To Increase The Product Sales And Revenue For Fast Food Business Plan Template Pdf is highly customizable and very easy to edit, covering many different styles from creative to business presentations. Slidegeeks has creative team members who have crafted amazing templates. So, go and get them without any delay. The purpose of this slide is to implement an effective go-to-market strategy for bringing the companys products or services to an end customer taking into consideration elements like sales, pricing and competitive strategies.into consideration.

Role Of Off Amazon Advertising For Traffic Generation Through Online External Store Template PDF
This slide provides information regarding generating traffic by advertising across online external stores. This kind of advertising is beneficial as it is lesser expensive and enables more control over Amazon marketing efforts. Find highly impressive Role Of Off Amazon Advertising For Traffic Generation Through Online External Store Template PDF on Slidegeeks to deliver a meaningful presentation. You can save an ample amount of time using these presentation templates. No need to worry to prepare everything from scratch because Slidegeeks experts have already done a huge research and work for you. You need to download Role Of Off Amazon Advertising For Traffic Generation Through Online External Store Template PDF for your upcoming presentation. All the presentation templates are 100 percent editable and you can change the color and personalize the content accordingly. Download now.
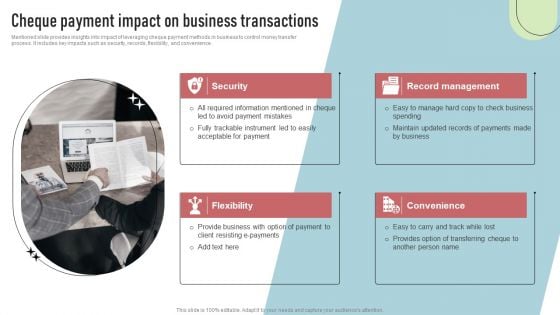
Cashless Payment Strategies To Enhance Business Performance Cheque Payment Impact Business Transactions Formats PDF
Mentioned slide provides insights into impact of leveraging cheque payment methods in business to control money transfer process. It includes key impacts such as security, records, flexibility, and convenience. Do you have to make sure that everyone on your team knows about any specific topic I yes, then you should give Cashless Payment Strategies To Enhance Business Performance Cheque Payment Impact Business Transactions Formats PDF a try. Our experts have put a lot of knowledge and effort into creating this impeccable . You can use this template for your upcoming presentations, as the slides are perfect to represent even the tiniest detail. You can download these templates from the Slidegeeks website and these are easy to edit. So grab these today
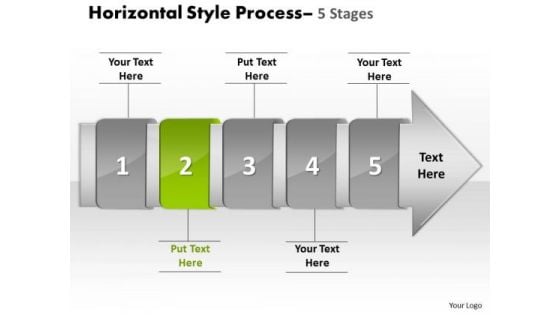
PowerPoint Template Horizontal Flow Course Charts Theme Of 5 Stage Diagram Image
We present our PowerPoint template horizontal flow course charts theme of 5 stage diagram Image. Use our Arrows PowerPoint Templates because, getting it done in time is the key to success. Use our Leadership PowerPoint Templates because; Employ the right colors for your brilliant ideas. Use our Process and flows PowerPoint Templates because, Targets: - You have a handle on all the targets, a master of the game, the experienced and consummate juggler. Use our Symbol PowerPoint Templates because, Brainstorming Light Bulbs: - The atmosphere in the workplace is electric. Use our Business PowerPoint Templates because, Marketing Strategy Business Template: - Maximizing sales of your product is the intended destination. Use these PowerPoint slides for presentations relating to Abstract, Arrow, Blank, Business, Chart, Circular, Circulation, Concept, Conceptual, Design, Diagram, Executive, Icon, Idea, Illustration, Linear, Management, Model, Numbers, Organization, Procedure, Process, Progression, Resource, Sequence, Sequential, Stages, Steps, Strategy. The prominent colors used in the PowerPoint template are Green, Gray, and White Your ideas will never go out of fashion. Our PowerPoint Template Horizontal Flow Course Charts Theme Of 5 Stage Diagram Image will keep them contemporary.
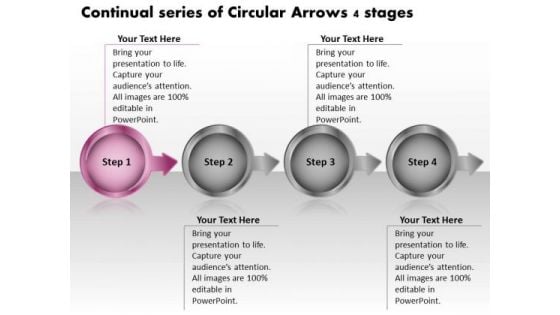
Continual Series Of Circular Arrows 4 Stages Flow Chart Maker Free PowerPoint Templates
We present our continual series of circular arrows 4 stages flow chart maker free PowerPoint templates.Use our Spheres PowerPoint Templates because,there is a crucial aspect that requires extra attention. Use our Arrows PowerPoint Templates because,Clarity of thought has been the key to your growth. Use our Circle Charts PowerPoint Templates because,They enhance the essence of your viable ideas. Use our Business PowerPoint Templates because, You can see clearly through to the bigger bowl ahead. Time your jump to perfection and hit the nail on the head Use our Metaphor PowerPoint Templates because,You have developed a vision of where you want to be a few years from now.Use these PowerPoint slides for presentations relating to Abstract, Arrows, Blank, Business, Central, Chart, Circle, Circular, Concept, Conceptual, Design, Diagram, Icon, Idea, Illustration, Management, Numbers, Organization, Process, Relationship, Resource, Sequence, Strategy, Template. The prominent colors used in the PowerPoint template are Pink, Gray, Black Trim the fat with our Continual Series Of Circular Arrows 4 Stages Flow Chart Maker Free PowerPoint Templates. Get right down to the meat of the matter.
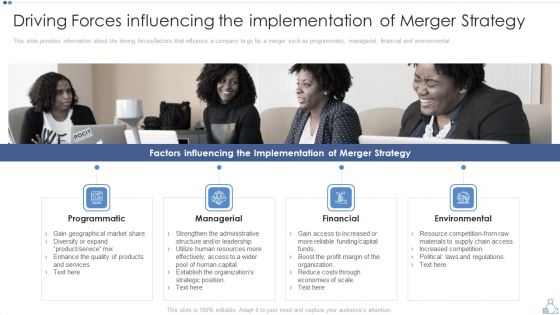
Partnership Tactical Plan To Promote Expansion And Value Formation Driving Forces Influencing The Implementation Of Merger Strategy Pictures PDF
This slide provides information about the driving forces or factors that influence a company to go for a merger such as programmatic, managerial, financial and environmental. Presenting partnership tactical plan to promote expansion and value formation driving forces influencing the implementation of merger strategy pictures pdf to provide visual cues and insights. Share and navigate important information on four stages that need your due attention. This template can be used to pitch topics like programmatic, managerial, financial, environmental. In addtion, this PPT design contains high resolution images, graphics, etc, that are easily editable and available for immediate download.
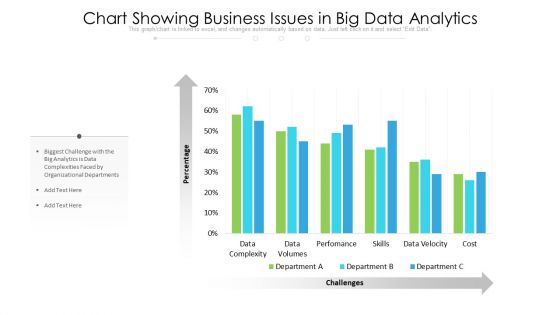
Chart Showing Business Issues In Big Data Analytics Diagrams PDF
Pitch your topic with ease and precision using this chart showing business issues in big data analytics diagrams pdf. This layout presents information on data complexity, data volumes, performance, skills. It is also available for immediate download and adjustment. So, changes can be made in the color, design, graphics or any other component to create a unique layout.
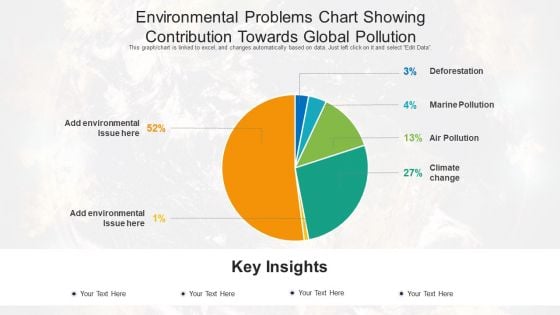
Environmental Problems Chart Showing Contribution Towards Global Pollution Elements PDF
Pitch your topic with ease and precision using this environmental problems chart showing contribution towards global pollution elements pdf. This layout presents information on environmental problems chart showing contribution towards global pollution. It is also available for immediate download and adjustment. So, changes can be made in the color, design, graphics or any other component to create a unique layout.
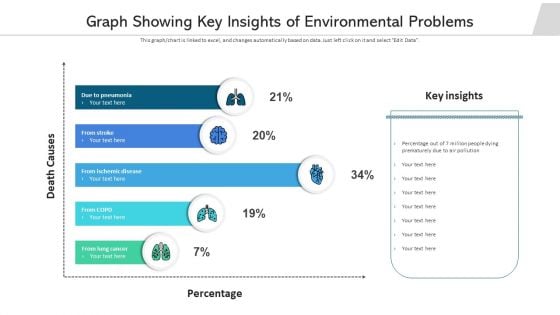
Graph Showing Key Insights Of Environmental Problems Structure PDF
Pitch your topic with ease and precision using this graph showing key insights of environmental problems structure pdf. This layout presents information on graph showing key insights of environmental problems. It is also available for immediate download and adjustment. So, changes can be made in the color, design, graphics or any other component to create a unique layout.
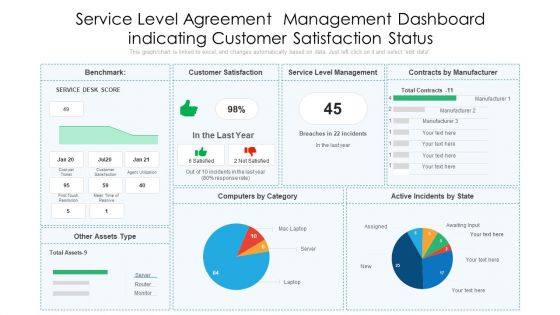
Service Level Agreement Management Dashboard Indicating Customer Satisfaction Status Designs PDF
Pitch your topic with ease and precision using this service level agreement management dashboard indicating customer satisfaction status designs pdf. This layout presents information on customer satisfaction, service level management, contracts by manufacturer. It is also available for immediate download and adjustment. So, changes can be made in the color, design, graphics or any other component to create a unique layout.
Problem Tracker Dashboard For Marketing Project Topics PDF
Pitch your topic with ease and precision using this problem tracker dashboard for marketing project topics pdf. This layout presents information on problem tracker dashboard for marketing project. It is also available for immediate download and adjustment. So, changes can be made in the color, design, graphics or any other component to create a unique layout.
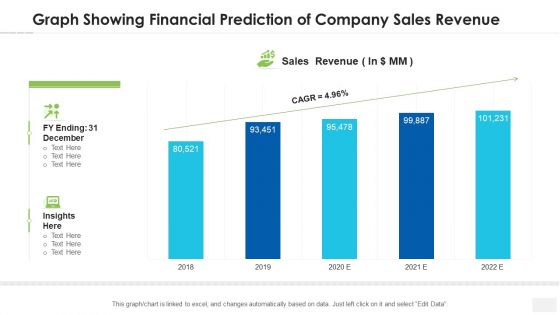
Graph Showing Financial Prediction Of Company Sales Revenue Topics PDF
Pitch your topic with ease and precision using this graph showing financial prediction of company sales revenue topics pdf. This layout presents information on graph showing financial prediction of company sales revenue. It is also available for immediate download and adjustment. So, changes can be made in the color, design, graphics or any other component to create a unique layout.
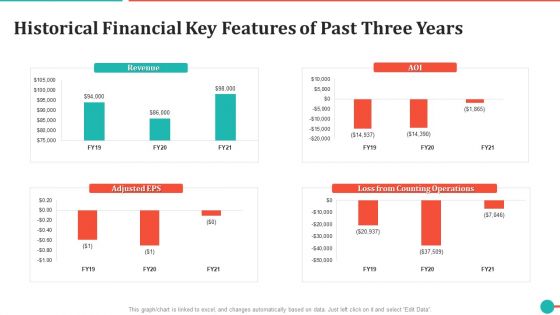
Historical Financial Key Features Of Past Three Years Formats PDF
Pitch your topic with ease and precision using this historical financial key features of past three years formats pdf. This layout presents information on historical financial key features of past three years. It is also available for immediate download and adjustment. So, changes can be made in the color, design, graphics or any other component to create a unique layout.
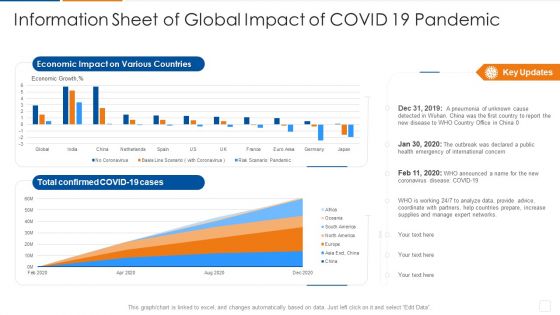
Information Sheet Of Global Impact Of Covid 19 Pandemic Designs PDF
Pitch your topic with ease and precision using this information sheet of global impact of covid 19 pandemic designs pdf. This layout presents information on information sheet of global impact of covid 19 pandemic. It is also available for immediate download and adjustment. So, changes can be made in the color, design, graphics or any other component to create a unique layout.
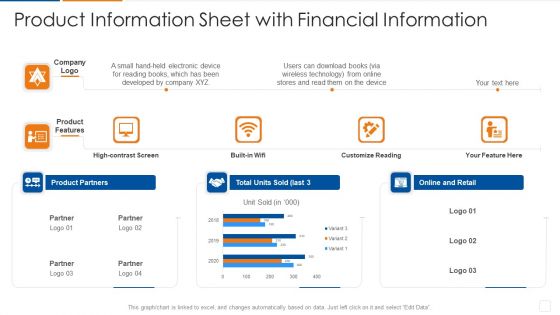
Product Information Sheet With Financial Information Infographics PDF
Pitch your topic with ease and precision using this product information sheet with financial information infographics pdf. This layout presents information on company logo, product features. It is also available for immediate download and adjustment. So, changes can be made in the color, design, graphics or any other component to create a unique layout.

Pie Graph Layer Of Marketing Expenditure Themes PDF
Pitch your topic with ease and precision using this pie graph layer of marketing expenditure themes pdf. This layout presents information on online advertising, trade shows, sales training, catalogs and brochures. It is also available for immediate download and adjustment. So, changes can be made in the color, design, graphics or any other component to create a unique layout.
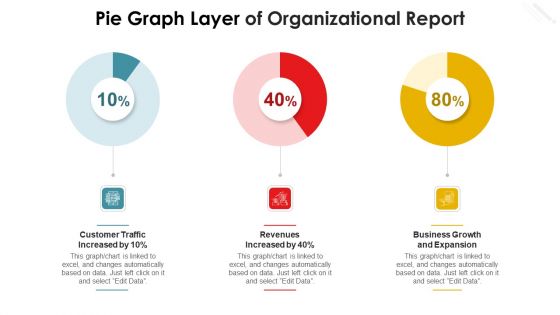
Pie Graph Layer Of Organizational Report Themes PDF
Pitch your topic with ease and precision using this pie graph layer of organizational report themes pdf. This layout presents information on revenues increased by, business growth and expansion, customer traffic increased by. It is also available for immediate download and adjustment. So, changes can be made in the color, design, graphics or any other component to create a unique layout.
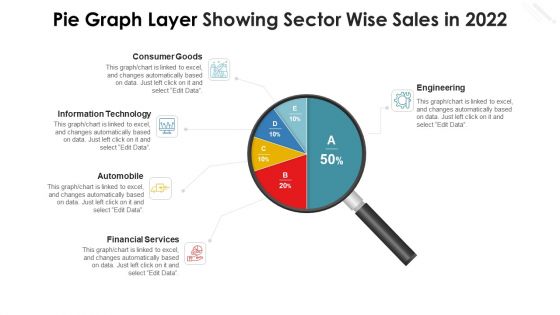
Pie Graph Layer Showing Sector Wise Sales In 2022 Microsoft PDF
Pitch your topic with ease and precision using this pie graph layer showing sector wise sales in 2022 microsoft pdf. This layout presents information on consumer goods, information technology, automobile, financial services, engineering. It is also available for immediate download and adjustment. So, changes can be made in the color, design, graphics or any other component to create a unique layout.
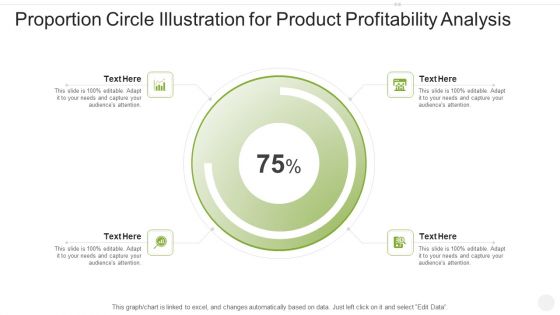
Proportion Circle Illustration For Product Profitability Analysis Designs PDF
Pitch your topic with ease and precision using this proportion circle illustration for product profitability analysis designs pdf. This layout presents information on proportion circle illustration for product profitability analysis. It is also available for immediate download and adjustment. So, changes can be made in the color, design, graphics or any other component to create a unique layout.
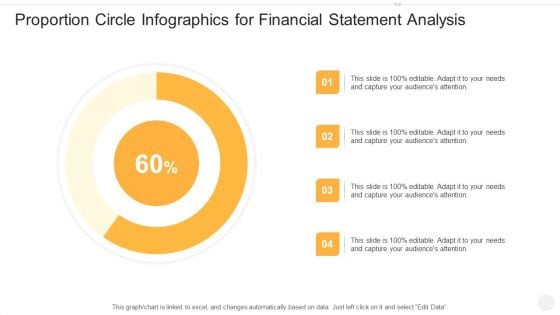
Proportion Circle Infographics For Financial Statement Analysis Mockup PDF
Pitch your topic with ease and precision using this proportion circle infographics for financial statement analysis mockup pdf. This layout presents information on proportion circle infographics for financial statement analysis. It is also available for immediate download and adjustment. So, changes can be made in the color, design, graphics or any other component to create a unique layout.
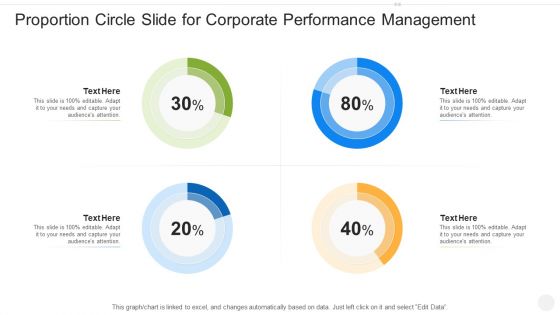
Proportion Circle Slide For Corporate Performance Management Rules PDF
Pitch your topic with ease and precision using this proportion circle slide for corporate performance management rules pdf. This layout presents information on proportion circle slide for corporate performance management. It is also available for immediate download and adjustment. So, changes can be made in the color, design, graphics or any other component to create a unique layout.
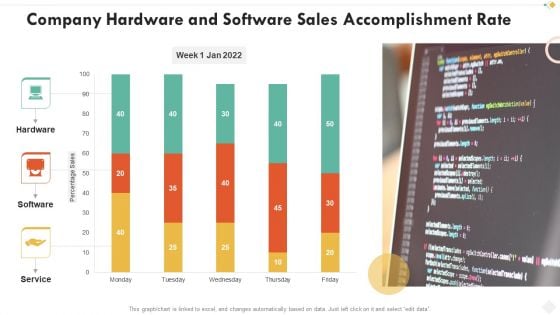
Company Hardware And Software Sales Accomplishment Rate Rules PDF
Pitch your topic with ease and precision using this company hardware and software sales accomplishment rate rules pdf. This layout presents information on company hardware and software sales accomplishment rate. It is also available for immediate download and adjustment. So, changes can be made in the color, design, graphics or any other component to create a unique layout.
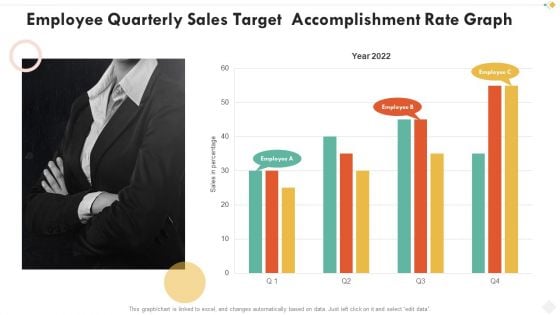
Employee Quarterly Sales Target Accomplishment Rate Graph Demonstration PDF
Pitch your topic with ease and precision using this employee quarterly sales target accomplishment rate graph demonstration pdf. This layout presents information on employee quarterly sales target accomplishment rate graph. It is also available for immediate download and adjustment. So, changes can be made in the color, design, graphics or any other component to create a unique layout.
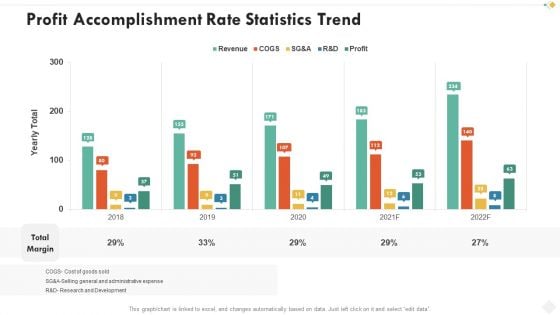
Profit Accomplishment Rate Statistics Trend Background PDF
Pitch your topic with ease and precision using this profit accomplishment rate statistics trend background pdf. This layout presents information on profit accomplishment rate statistics trend. It is also available for immediate download and adjustment. So, changes can be made in the color, design, graphics or any other component to create a unique layout.
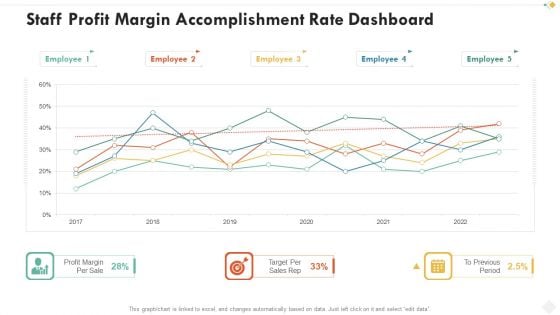
Staff Profit Margin Accomplishment Rate Dashboard Themes PDF
Pitch your topic with ease and precision using this staff profit margin accomplishment rate dashboard themes pdf. This layout presents information on staff profit margin accomplishment rate dashboard. It is also available for immediate download and adjustment. So, changes can be made in the color, design, graphics or any other component to create a unique layout.
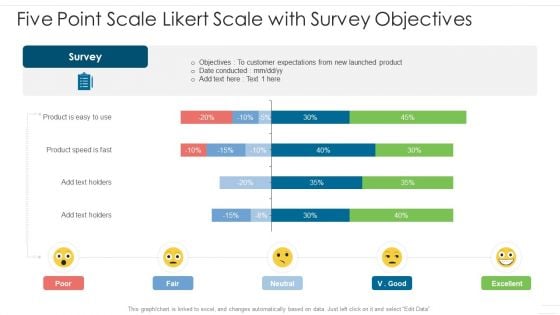
Five Point Scale Likert Scale With Survey Objectives Inspiration PDF
Pitch your topic with ease and precision using this five point scale likert scale with survey objectives inspiration pdf. This layout presents information on survey, customer. It is also available for immediate download and adjustment. So, changes can be made in the color, design, graphics or any other component to create a unique layout.
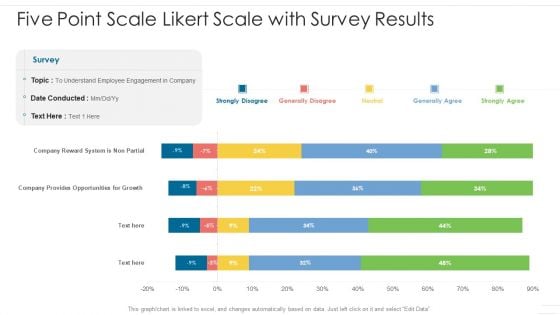
Five Point Scale Likert Scale With Survey Results Diagrams PDF
Pitch your topic with ease and precision using this five point scale likert scale with survey results diagrams pdf. This layout presents information on service, customer, survey. It is also available for immediate download and adjustment. So, changes can be made in the color, design, graphics or any other component to create a unique layout.
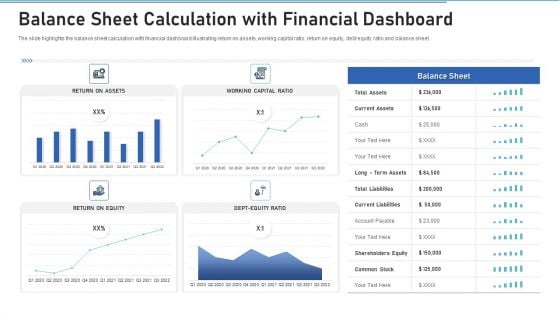
Balance Sheet Calculation With Financial Dashboard Background PDF
Pitch your topic with ease and precision using this balance sheet calculation with financial dashboard background pdf. This layout presents information on balance sheet calculation with financial dashboard. It is also available for immediate download and adjustment. So, changes can be made in the color, design, graphics or any other component to create a unique layout.
Reporting Sheet For Effective Tracking And Application Programming Interface Administration Introduction PDF
Pitch your topic with ease and precision using this reporting sheet for effective tracking and application programming interface administration introduction pdf. This layout presents information on reporting sheet for effective tracking and application programming interface administration. It is also available for immediate download and adjustment. So, changes can be made in the color, design, graphics or any other component to create a unique layout.
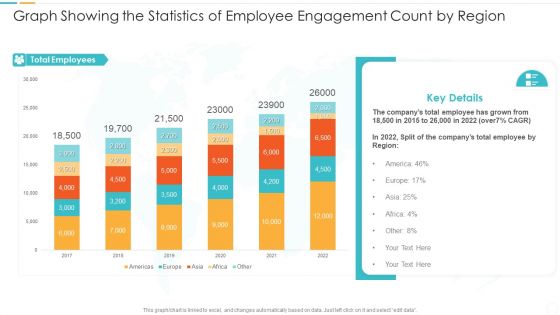
Graph Showing The Statistics Of Employee Engagement Count By Region Formats PDF
Pitch your topic with ease and precision using this graph showing the statistics of employee engagement count by region formats pdf. This layout presents information on graph showing the statistics of employee engagement count by region. It is also available for immediate download and adjustment. So, changes can be made in the color, design, graphics or any other component to create a unique layout.
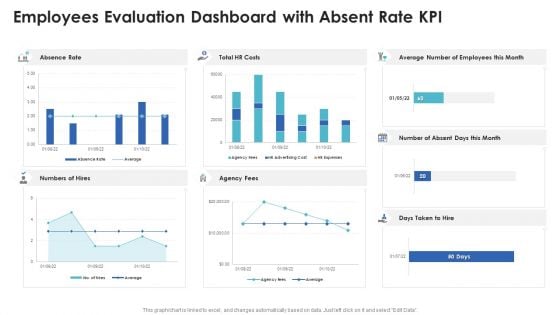
Employees Evaluation Dashboard With Absent Rate Kpi Microsoft PDF
Pitch your topic with ease and precision using this employees evaluation dashboard with absent rate kpi microsoft pdf. This layout presents information on employees evaluation dashboard with absent rate kpi. It is also available for immediate download and adjustment. So, changes can be made in the color, design, graphics or any other component to create a unique layout.
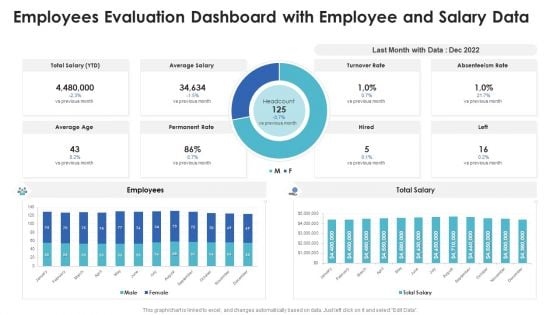
Employees Evaluation Dashboard With Employee And Salary Data Infographics PDF
Pitch your topic with ease and precision using this employees evaluation dashboard with employee and salary data infographics pdf. This layout presents information on employees evaluation dashboard with employee and salary data. It is also available for immediate download and adjustment. So, changes can be made in the color, design, graphics or any other component to create a unique layout.
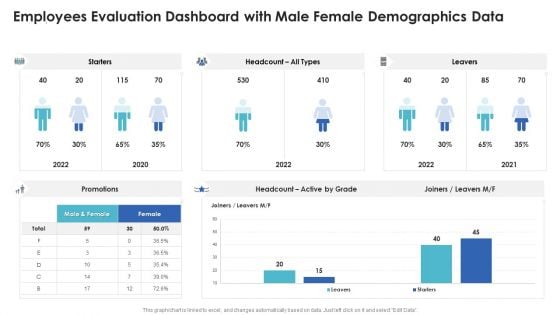
Employees Evaluation Dashboard With Male Female Demographics Data Ideas PDF
Pitch your topic with ease and precision using this employees evaluation dashboard with male female demographics data ideas pdf. This layout presents information on employees evaluation dashboard with male female demographics data. It is also available for immediate download and adjustment. So, changes can be made in the color, design, graphics or any other component to create a unique layout.
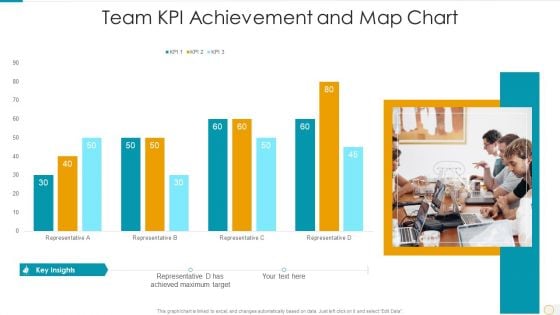
Team Kpi Achievement And Map Chart Portrait PDF
Pitch your topic with ease and precision using this team kpi achievement and map chart portrait pdf. This layout presents information on team kpi achievement and map chart. It is also available for immediate download and adjustment. So, changes can be made in the color, design, graphics or any other component to create a unique layout.
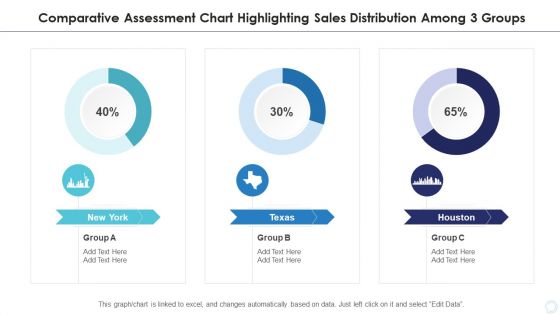
Comparative Assessment Chart Highlighting Sales Distribution Among 3 Groups Designs PDF
Pitch your topic with ease and precision using this comparative assessment chart highlighting sales distribution among 3 groups designs pdf. This layout presents information on comparative assessment chart highlighting sales distribution among 3 groups. It is also available for immediate download and adjustment. So, changes can be made in the color, design, graphics or any other component to create a unique layout.
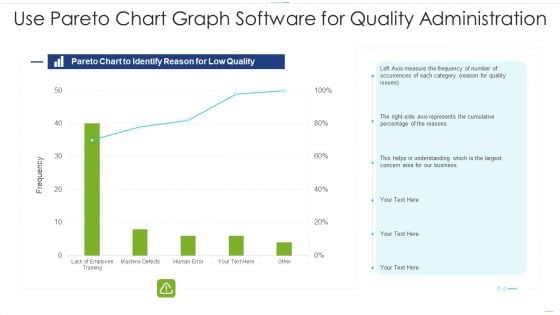
Use Pareto Chart Graph Software For Quality Administration Structure PDF
Pitch your topic with ease and precision using this use pareto chart graph software for quality administration structure pdf. This layout presents information on use pareto chart graph software for quality administration. It is also available for immediate download and adjustment. So, changes can be made in the color, design, graphics or any other component to create a unique layout.
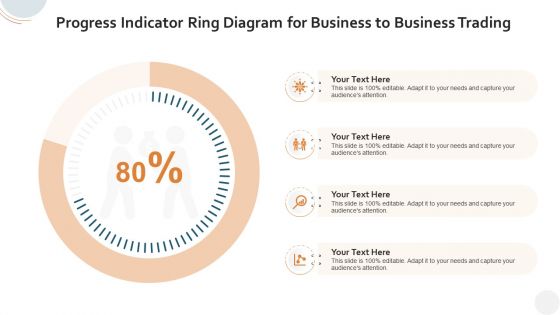
Progress Indicator Ring Diagram For Business To Business Trading Graphics PDF
Pitch your topic with ease and precision using this progress indicator ring diagram for business to business trading graphics pdf. This layout presents information on progress indicator ring diagram for business to business trading. It is also available for immediate download and adjustment. So, changes can be made in the color, design, graphics or any other component to create a unique layout.
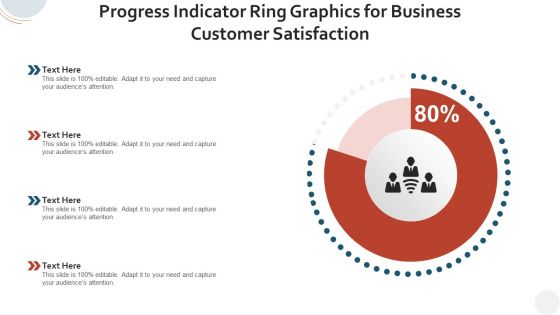
Progress Indicator Ring Graphics For Business Customer Satisfaction Background PDF
Pitch your topic with ease and precision using this progress indicator ring graphics for business customer satisfaction background pdf. This layout presents information on progress indicator ring graphics for business customer satisfaction. It is also available for immediate download and adjustment. So, changes can be made in the color, design, graphics or any other component to create a unique layout.

Progress Indicator Ring Slide For Small Business Marketing Ideas Guidelines PDF
Pitch your topic with ease and precision using this progress indicator ring slide for small business marketing ideas guidelines pdf. This layout presents information on progress indicator ring slide for small business marketing ideas. It is also available for immediate download and adjustment. So, changes can be made in the color, design, graphics or any other component to create a unique layout.
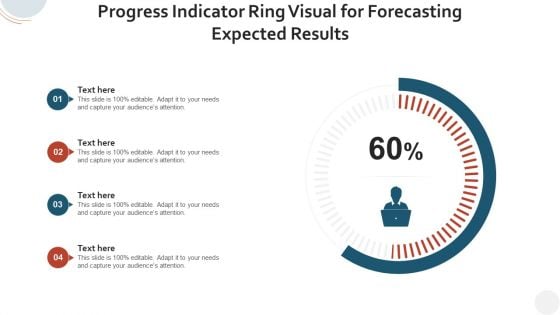
Progress Indicator Ring Visual For Forecasting Expected Results Diagrams PDF
Pitch your topic with ease and precision using this progress indicator ring visual for forecasting expected results diagrams pdf. This layout presents information on progress indicator ring visual for forecasting expected results. It is also available for immediate download and adjustment. So, changes can be made in the color, design, graphics or any other component to create a unique layout.
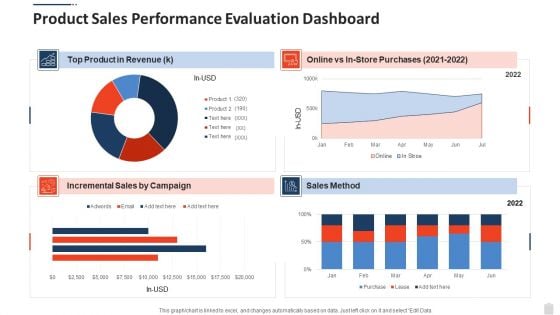
Product Sales Performance Evaluation Dashboard Graphics PDF
Pitch your topic with ease and precision using this product sales performance evaluation dashboard graphics pdf. This layout presents information on product sales performance evaluation dashboard. It is also available for immediate download and adjustment. So, changes can be made in the color, design, graphics or any other component to create a unique layout.
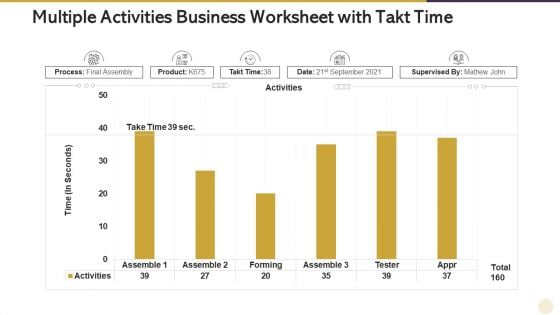
Multiple Activities Business Worksheet With Takt Time Rules PDF
Pitch your topic with ease and precision using this multiple activities business worksheet with takt time rules pdf. This layout presents information on multiple activities business worksheet with takt time. It is also available for immediate download and adjustment. So, changes can be made in the color, design, graphics or any other component to create a unique layout.
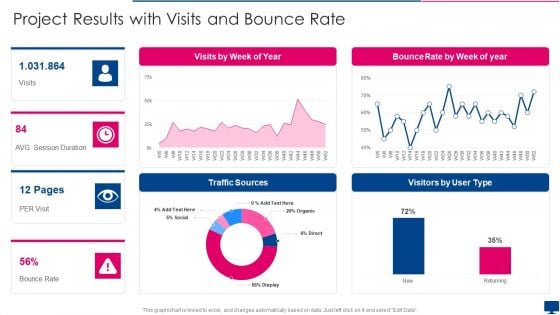
Project Results With Visits And Bounce Rate Download PDF
Pitch your topic with ease and precision using this project results with visits and bounce rate download pdf. This layout presents information on project results with visits and bounce rate. It is also available for immediate download and adjustment. So, changes can be made in the color, design, graphics or any other component to create a unique layout.
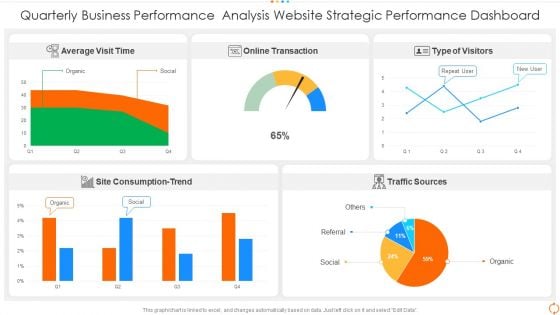
Quarterly Business Performance Analysis Website Strategic Performance Dashboard Portrait PDF
Pitch your topic with ease and precision using this quarterly business performance analysis website strategic performance dashboard portrait pdf. This layout presents information on quarterly business performance analysis website strategic performance dashboard. It is also available for immediate download and adjustment. So, changes can be made in the color, design, graphics or any other component to create a unique layout.
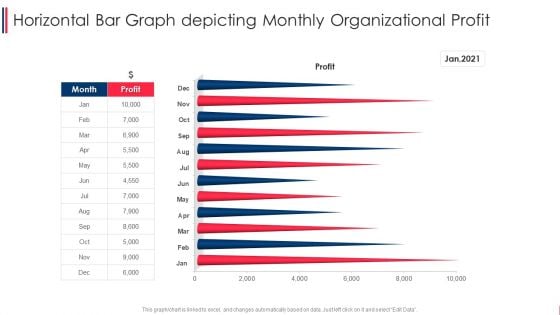
Horizontal Bar Graph Depicting Monthly Organizational Profit Graphics PDF
Pitch your topic with ease and precision using this horizontal bar graph depicting monthly organizational profit graphics pdf. This layout presents information on horizontal bar graph depicting monthly organizational profit. It is also available for immediate download and adjustment. So, changes can be made in the color, design, graphics or any other component to create a unique layout.
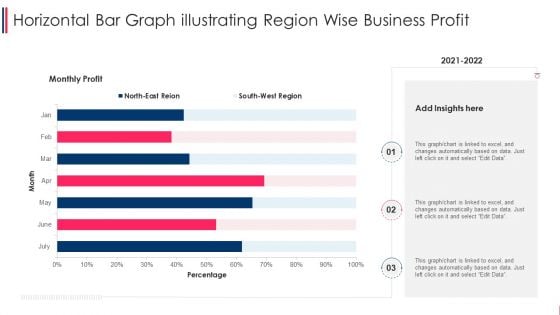
Horizontal Bar Graph Illustrating Region Wise Business Profit Microsoft PDF
Pitch your topic with ease and precision using this horizontal bar graph illustrating region wise business profit microsoft pdf. This layout presents information on horizontal bar graph illustrating region wise business profit. It is also available for immediate download and adjustment. So, changes can be made in the color, design, graphics or any other component to create a unique layout.
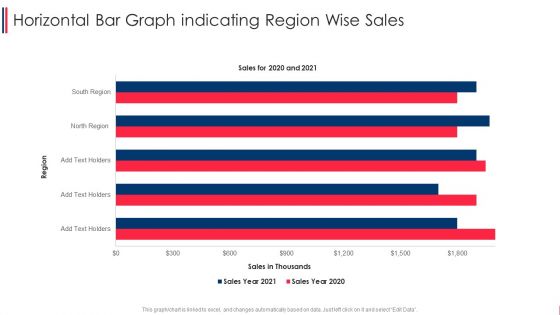
Horizontal Bar Graph Indicating Region Wise Sales Formats PDF
Pitch your topic with ease and precision using this horizontal bar graph indicating region wise sales formats pdf. This layout presents information on horizontal bar graph indicating region wise sales. It is also available for immediate download and adjustment. So, changes can be made in the color, design, graphics or any other component to create a unique layout.
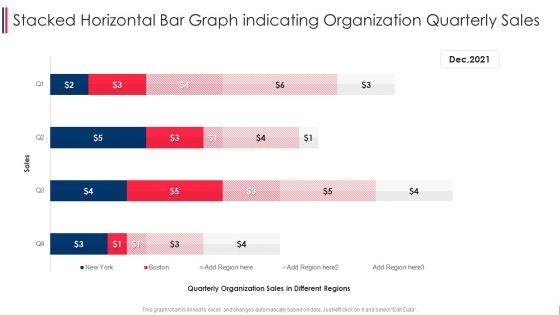
Stacked Horizontal Bar Graph Indicating Organization Quarterly Sales Graphics PDF
Pitch your topic with ease and precision using this stacked horizontal bar graph indicating organization quarterly sales graphics pdf. This layout presents information on stacked horizontal bar graph indicating organization quarterly sales. It is also available for immediate download and adjustment. So, changes can be made in the color, design, graphics or any other component to create a unique layout.
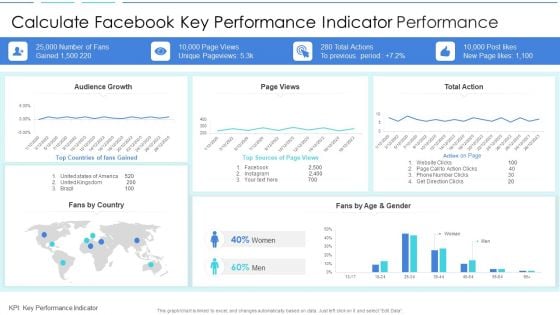
Calculate Facebook Key Performance Indicator Performance Sample PDF
Pitch your topic with ease and precision using this calculate facebook key performance indicator performance sample pdf. This layout presents information on calculate facebook key performance indicator performance. It is also available for immediate download and adjustment. So, changes can be made in the color, design, graphics or any other component to create a unique layout.
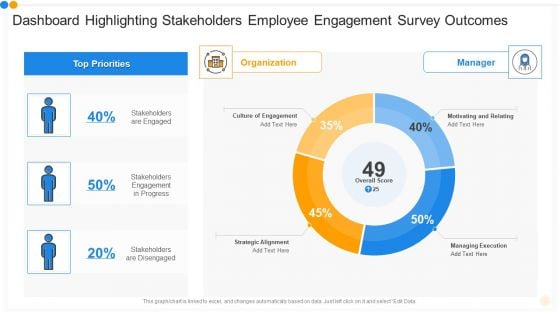
Dashboard Highlighting Stakeholders Employee Engagement Survey Outcomes Pictures PDF
Pitch your topic with ease and precision using this dashboard highlighting stakeholders employee engagement survey outcomes pictures pdf. This layout presents information on dashboard highlighting stakeholders employee engagement survey outcomes. It is also available for immediate download and adjustment. So, changes can be made in the color, design, graphics or any other component to create a unique layout.

Engagement Survey Results Depicting Employee Outcomes Satisfaction Level Slides PDF
Pitch your topic with ease and precision using this engagement survey results depicting employee outcomes satisfaction level slides pdf. This layout presents information on engagement survey results depicting employee outcomes satisfaction level. It is also available for immediate download and adjustment. So, changes can be made in the color, design, graphics or any other component to create a unique layout.
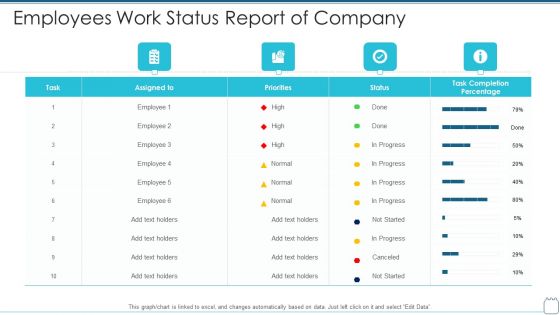
Employees Work Status Report Of Company Portrait PDF
Pitch your topic with ease and precision using this employees work status report of company portrait pdf . This layout presents information on employees work status report of company . It is also available for immediate download and adjustment. So, changes can be made in the color, design, graphics or any other component to create a unique layout.
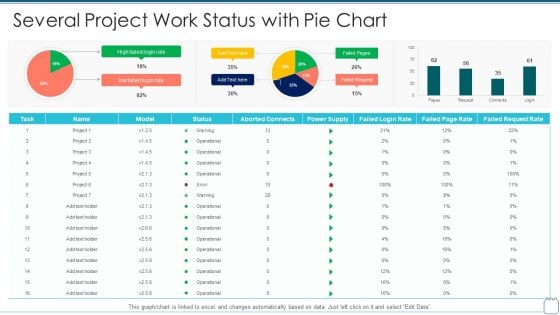
Several Project Work Status With Pie Chart Microsoft PDF
Pitch your topic with ease and precision using this several project work status with pie chart microsoft pdf . This layout presents information on several project work status with pie chart . It is also available for immediate download and adjustment. So, changes can be made in the color, design, graphics or any other component to create a unique layout.


 Continue with Email

 Home
Home


