Cost Summary
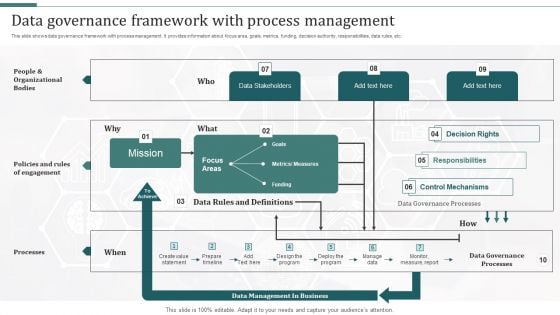
Data Governance Framework With Process Management Formats PDF
This slide shows data governance framework with process management. It provides information about focus area, goals, metrics, funding, decision authority, responsibilities, data rules, etc. Pitch your topic with ease and precision using this Data Governance Framework With Process Management Formats PDF. This layout presents information on Organizational Bodies, Measures, Metrics. It is also available for immediate download and adjustment. So, changes can be made in the color, design, graphics or any other component to create a unique layout.
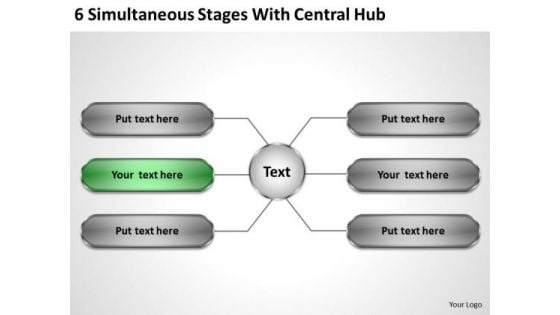
Business Plan Strategy 6 Simultaneous Stages With Central Hub Formulation
We present our business plan strategy 6 simultaneous stages with central hub formulation.Present our Process and Flows PowerPoint Templates because You can Hit a home run with our PowerPoint Templates and Slides. See your ideas sail into the minds of your audience. Present our Business PowerPoint Templates because Our PowerPoint Templates and Slides will fulfill your every need. Use them and effectively satisfy the desires of your audience. Present our Flow Charts PowerPoint Templates because Our PowerPoint Templates and Slides will provide the perfect balance. Your weighty ideas will get the ideal impetus. Present our Marketing PowerPoint Templates because You can Stir your ideas in the cauldron of our PowerPoint Templates and Slides. Cast a magic spell on your audience. Download our Shapes PowerPoint Templates because It can Bubble and burst with your ideas.Use these PowerPoint slides for presentations relating to Arrangement, arrow, box, business, chart, circle, company,connection, copyspace, corporation, diagram, diamond,enterprise, flow, flowchart, job, level, link, linked,management, manager, network, office, organization, organizational, organize,position, post, pyramid, rectangle, relation, relationship, reporting, resources,shape, sign, square, structure, symbolic, teamwork, workflow. The prominent colors used in the PowerPoint template are Green, Gray, White. Acquire success with our Business Plan Strategy 6 Simultaneous Stages With Central Hub Formulation. Download without worries with our money back guaranteee.
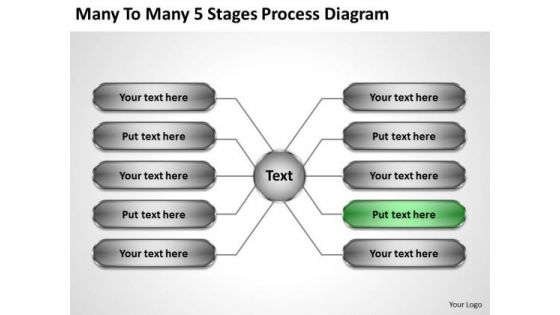
Business Marketing Strategy Many To 5 Stages Process Diagram Plan
We present our business marketing strategy many to 5 stages process diagram plan.Download our Flow Charts PowerPoint Templates because Our PowerPoint Templates and Slides will let your ideas bloom. Create a bed of roses for your audience. Download and present our Process and Flows PowerPoint Templates because Our PowerPoint Templates and Slides will Activate the energies of your audience. Get their creative juices flowing with your words. Download our Business PowerPoint Templates because These PowerPoint Templates and Slides will give the updraft to your ideas. See them soar to great heights with ease. Download and present our Success PowerPoint Templates because Our PowerPoint Templates and Slides will let you meet your Deadlines. Use our Marketing PowerPoint Templates because You can Raise a toast with our PowerPoint Templates and Slides. Spread good cheer amongst your audience.Use these PowerPoint slides for presentations relating to Arrangement, arrow, box, business, ceo, chart, circle, company,concept, connect, connection, copyspace, corporation, design, diagram, diamond,enterprise, flow, flowchart, hierarchy, illustration, job, level, link, linked,management, manager, network, office, organization, organizational, organize,position, post, pyramid, rectangle, relation, relationship, reporting, resources,shape, sign, square, structure, symbolic, teamwork, workflow. The prominent colors used in the PowerPoint template are Green, White, Gray. Simplify presentations with our Business Marketing Strategy Many To 5 Stages Process Diagram Plan. Download without worries with our money back guaranteee.
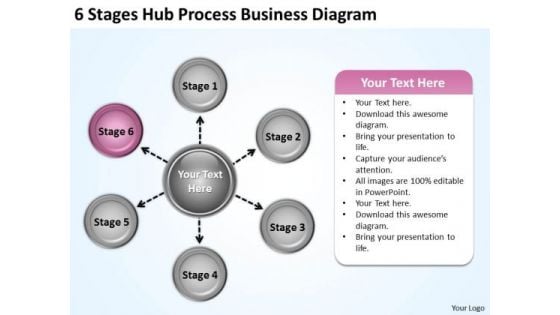
Business Planning Strategy Stages Hub Process Diagram Integration
We present our business planning strategy stages hub process diagram integration.Download and present our Circle Charts PowerPoint Templates because Our PowerPoint Templates and Slides will provide you the cutting edge. Slice through the doubts in the minds of your listeners. Use our Ring Charts PowerPoint Templates because Our PowerPoint Templates and Slides will let Your superior ideas hit the target always and everytime. Present our Flow Charts PowerPoint Templates because It can Leverage your style with our PowerPoint Templates and Slides. Charm your audience with your ability. Download our Marketing PowerPoint Templates because Our PowerPoint Templates and Slides will give you great value for your money. Be assured of finding the best projection to highlight your words. Download and present our Business PowerPoint Templates because You should Ascend the ladder of success with ease. Our PowerPoint Templates and Slides will provide strong and sturdy steps.Use these PowerPoint slides for presentations relating to Abstract, arrows, business, central, centralized, chart, circle, circular,circulation, concept, conceptual, converging, design, diagram, eight, executive,icon, idea, illustration, management, map, mapping, mba, model, numbers,organization, outwards, pointing, procedure, process, radial, radiating,relationship, resource, sequence, sequential, square, strategy. The prominent colors used in the PowerPoint template are Pink, White, Gray. Our Business Planning Strategy Stages Hub Process Diagram Integration will fetch it for you. They will bring audience adulation to your doorstep.
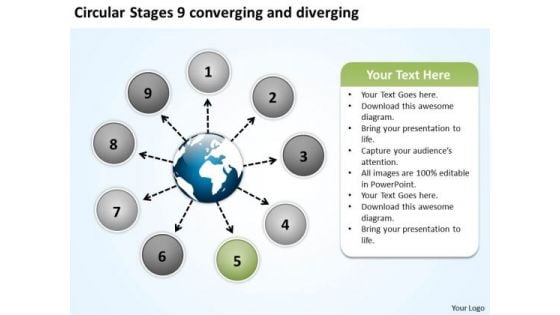
Circular Stages 9 Converging And Diverging Venn Network PowerPoint Slides
We present our circular stages 9 converging and diverging Venn Network PowerPoint Slides.Download our Process and flows PowerPoint Templates because you can Show them how you can save the day. Present our Business PowerPoint Templates because it illustrates the city with a lasting tryst with resilience. You epitomise the qualities that give your city its fame. Present our Marketing PowerPoint Templates because there is a crucial aspect that requires extra attention. Download and present our Flow charts PowerPoint Templates because it shows the pyramid which is a symbol of the desire to reach the top in a steady manner. Present our Shapes PowerPoint Templates because it is the time to bond with family, friends, colleagues and any other group of your choice.Use these PowerPoint slides for presentations relating to Arrows, business, central, centralized, chart, circle, circular, circulation, concept, conceptual, converging, design, diagram, executive, icon, idea, illustration, management, mapping, model, numbers, organization, radial, radiating, relationship, resource, sequence, sequential, seven, square, strategy. The prominent colors used in the PowerPoint template are Black, White, Gray. People tell us our circular stages 9 converging and diverging Venn Network PowerPoint Slides are Romantic. We assure you our circle PowerPoint templates and PPT Slides are Functional. PowerPoint presentation experts tell us our circular stages 9 converging and diverging Venn Network PowerPoint Slides are Bold. You can be sure our circular PowerPoint templates and PPT Slides are visually appealing. Professionals tell us our circular stages 9 converging and diverging Venn Network PowerPoint Slides are Beautiful. Use our circle PowerPoint templates and PPT Slides are Reminiscent. Our Circular Stages 9 Converging And Diverging Venn Network PowerPoint Slides are exceptionally adaptive. They will blend in with any scenario.
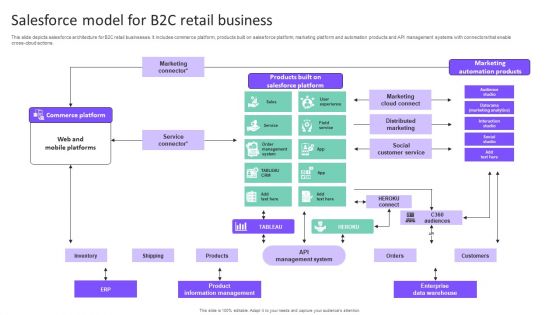
Salesforce Model For B2C Retail Business Portrait PDF
This slide depicts salesforce architecture for B2C retail businesses. It includes commerce platform, products built on salesforce platform, marketing platform and automation products and API management systems with connectors that enable cross-cloud actions. Present the topic in a bit more detail with this Salesforce Model For B2C Retail Business Portrait PDF. Use it as a tool for discussion and navigation on Inventory, Shipping, Products. This template is free to edit as deemed fit for your organization. Therefore download it now.
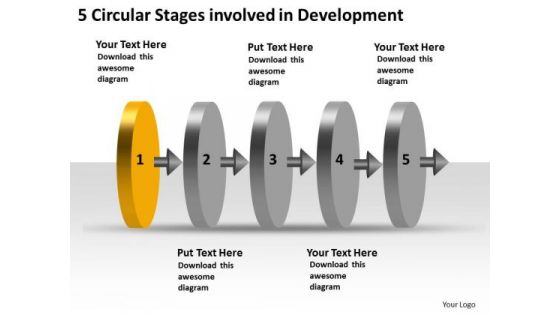
5 Circular Stages Involved Development Sample Flow Charts Vision PowerPoint Slides
We present our 5 circular stages involved development sample flow charts vision PowerPoint Slides.Use our Arrows PowerPoint Templates because you should explain the process by which you intend to right it. Present our Process and Flows PowerPoint Templates because it demonstrates the seeds of many of our successes. Download our Shapes PowerPoint Templates because they will Amplify your thoughts via our appropriate templates. Use our Business PowerPoint Templates because this template can project the path to sucess that you have charted. Download and present our Signs PowerPoint Templates because our PowerPoint templates designed for your ideas to sell.Use these PowerPoint slides for presentations relating to Arrows, Arrows circles, chart, circle, circular, circular Arrowss, circular flow, circulation, color, cycle, cyclic, direction, element, five, flow, four, glossy, icon, isolated, loop, motion, movement, rotation, section, set, shape, sign, symbol, vector, vibrant. The prominent colors used in the PowerPoint template are Orange, Gray, Black. The feedback we get is that our 5 circular stages involved development sample flow charts vision PowerPoint Slides help you meet deadlines which are an element of today's workplace. Just browse and pick the slides that appeal to your intuitive senses. People tell us our circles PowerPoint templates and PPT Slides will make the presenter look like a pro even if they are not computer savvy. We assure you our 5 circular stages involved development sample flow charts vision PowerPoint Slides are Detailed. Presenters tell us our chart PowerPoint templates and PPT Slides will make the presenter successul in his career/life. We assure you our 5 circular stages involved development sample flow charts vision PowerPoint Slides are Colorful. Use our circle PowerPoint templates and PPT Slides are Whimsical. Introduce changes with our 5 Circular Stages Involved Development Sample Flow Charts Vision PowerPoint Slides. Download without worries with our money back guaranteee.
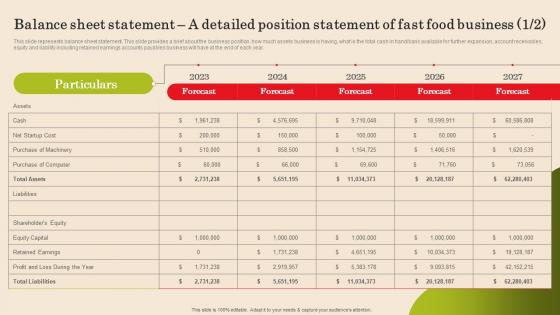
Balance Sheet Statement A Detailed Position Statement Of Fast Food Business Plan Demonstration Pdf
This slide represents balance sheet statement. This slide provides a brief about the business position, how much assets business is having, what is the total cash in hand bank available for further expansion, account receivables, equity and liability including retained earnings accounts payables business will have at the end of each year. Slidegeeks is one of the best resources for PowerPoint templates. You can download easily and regulate Balance Sheet Statement A Detailed Position Statement Of Fast Food Business Plan Demonstration Pdf for your personal presentations from our wonderful collection. A few clicks is all it takes to discover and get the most relevant and appropriate templates. Use our Templates to add a unique zing and appeal to your presentation and meetings. All the slides are easy to edit and you can use them even for advertisement purposes. This slide represents balance sheet statement. This slide provides a brief about the business position, how much assets business is having, what is the total cash in hand bank available for further expansion, account receivables, equity and liability including retained earnings accounts payables business will have at the end of each year.
Escape Plan Venture Capitalist Management Buyout Process Timeline Ppt Visual Aids Icon PDF
Presenting this set of slides with name escape plan venture capitalist management buyout process timeline ppt visual aids icon pdf. This is a nine stage process. The stages in this process are negotiate terms of the sale, raise finance, complete due diligence, close deal, business plan, establish credibility with owners, opportunity to purchase the business you work for. This is a completely editable PowerPoint presentation and is available for immediate download. Download now and impress your audience.
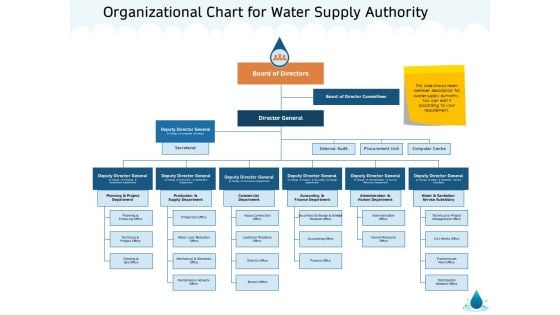
Water NRM Organizational Chart For Water Supply Authority Ppt Styles Influencers PDF
Presenting this set of slides with name water nrm organizational chart for water supply authority ppt styles influencers pdf. This is a eleven stage process. The stages in this process are planning and project department, production and supply department, commercial department, accounting and finance department, administration and human department, water and sanitation service subsidiary. This is a completely editable PowerPoint presentation and is available for immediate download. Download now and impress your audience.
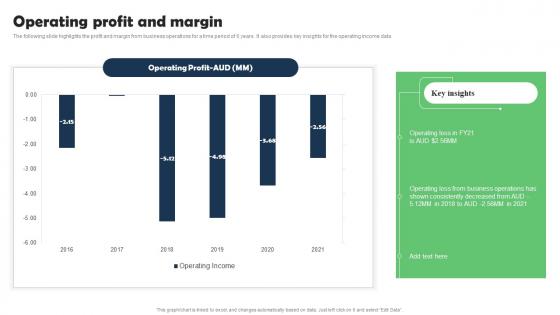
Operating Profit And Margin Marketing Research Services Management Business Pictures Pdf
The following slide highlights the profit and margin from business operations for a time period of 6 years. It also provides key insights for the operating income data. The Operating Profit And Margin Marketing Research Services Management Business Pictures Pdf is a compilation of the most recent design trends as a series of slides. It is suitable for any subject or industry presentation, containing attractive visuals and photo spots for businesses to clearly express their messages. This template contains a variety of slides for the user to input data, such as structures to contrast two elements, bullet points, and slides for written information. Slidegeeks is prepared to create an impression. The following slide highlights the profit and margin from business operations for a time period of 6 years. It also provides key insights for the operating income data.
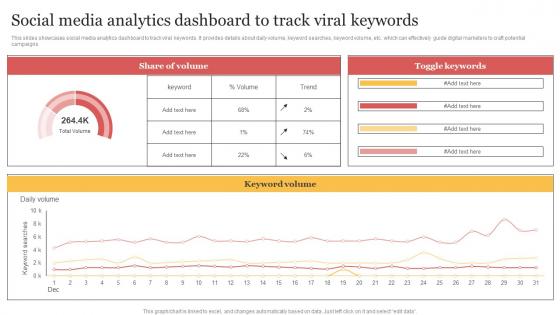
Social Media Analytics Dashboard To Track Viral Keywords Organizing Buzzworthy Social Themes Pdf
This slides showcases social media analytics dashboard to track viral keywords. It provides details about daily volume, keyword searches, keyword volume, etc. which can effectively guide digital marketers to craft potential campaigns. The Social Media Analytics Dashboard To Track Viral Keywords Organizing Buzzworthy Social Themes Pdf is a compilation of the most recent design trends as a series of slides. It is suitable for any subject or industry presentation, containing attractive visuals and photo spots for businesses to clearly express their messages. This template contains a variety of slides for the user to input data, such as structures to contrast two elements, bullet points, and slides for written information. Slidegeeks is prepared to create an impression. This slides showcases social media analytics dashboard to track viral keywords. It provides details about daily volume, keyword searches, keyword volume, etc. which can effectively guide digital marketers to craft potential campaigns.
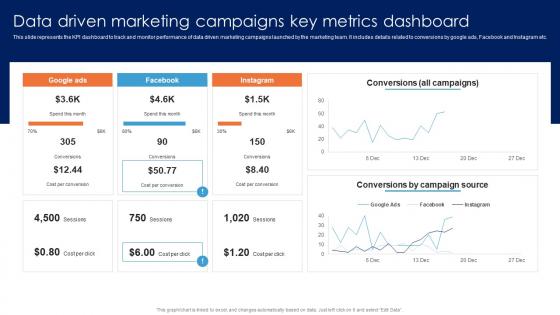
Data Driven Marketing Campaigns Key Metrics Guide For Data Driven Advertising Guidelines Pdf
This slide represents the KPI dashboard to track and monitor performance of data driven marketing campaigns launched by the marketing team. It includes details related to conversions by google ads, Facebook and Instagram etc.The Data Driven Marketing Campaigns Key Metrics Guide For Data Driven Advertising Guidelines Pdf is a compilation of the most recent design trends as a series of slides. It is suitable for any subject or industry presentation, containing attractive visuals and photo spots for businesses to clearly express their messages. This template contains a variety of slides for the user to input data, such as structures to contrast two elements, bullet points, and slides for written information. Slidegeeks is prepared to create an impression. This slide represents the KPI dashboard to track and monitor performance of data driven marketing campaigns launched by the marketing team. It includes details related to conversions by google ads, Facebook and Instagram etc.
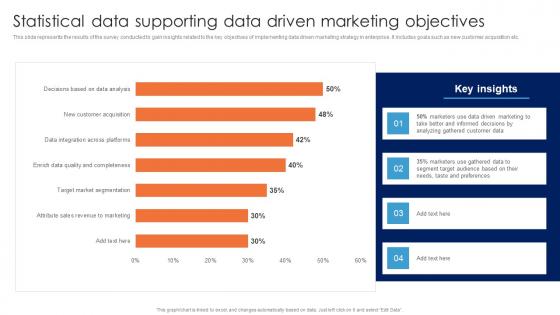
Statistical Data Supporting Data Driven Marketing Objectives Guide For Data Driven Advertising Elements Pdf
This slide represents the results of the survey conducted to gain insights related to the key objectives of implementing data driven marketing strategy in enterprise. It includes goals such as new customer acquisition etc.The Statistical Data Supporting Data Driven Marketing Objectives Guide For Data Driven Advertising Elements Pdf is a compilation of the most recent design trends as a series of slides. It is suitable for any subject or industry presentation, containing attractive visuals and photo spots for businesses to clearly express their messages. This template contains a variety of slides for the user to input data, such as structures to contrast two elements, bullet points, and slides for written information. Slidegeeks is prepared to create an impression. This slide represents the results of the survey conducted to gain insights related to the key objectives of implementing data driven marketing strategy in enterprise. It includes goals such as new customer acquisition etc.
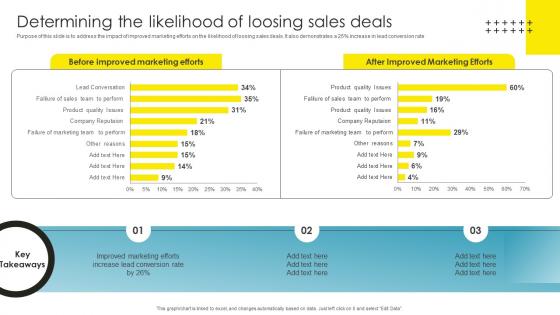
Strategic Brand Management Determining The Likelihood Topics Pdf
Purpose of this slide is to address the impact of improved marketing efforts on the likelihood of loosing sales deals. It also demonstrates a 26 percentage increase in lead conversion rate The Strategic Brand Management Determining The Likelihood Topics Pdf is a compilation of the most recent design trends as a series of slides. It is suitable for any subject or industry presentation, containing attractive visuals and photo spots for businesses to clearly express their messages. This template contains a variety of slides for the user to input data, such as structures to contrast two elements, bullet points, and slides for written information. Slidegeeks is prepared to create an impression. Purpose of this slide is to address the impact of improved marketing efforts on the likelihood of loosing sales deals. It also demonstrates a 26 percentage increase in lead conversion rate
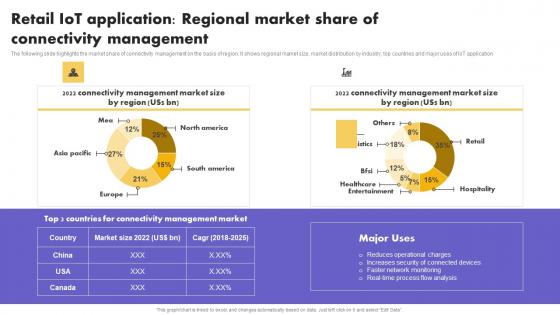
IoT Application In Global Retail IoT Application Regional Market Share Diagrams Pdf
The following slide highlights the market share of connectivity management on the basis of region. It shows regional market size, market distribution by industry, top countries and major uses of IoT application.The IoT Application In Global Retail IoT Application Regional Market Share Diagrams Pdf is a compilation of the most recent design trends as a series of slides. It is suitable for any subject or industry presentation, containing attractive visuals and photo spots for businesses to clearly express their messages. This template contains a variety of slides for the user to input data, such as structures to contrast two elements, bullet points, and slides for written information. Slidegeeks is prepared to create an impression. The following slide highlights the market share of connectivity management on the basis of region. It shows regional market size, market distribution by industry, top countries and major uses of IoT application
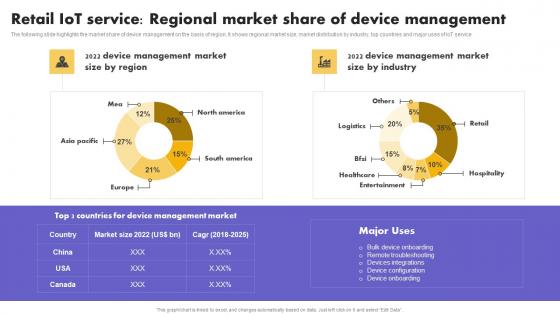
IoT Service Regional Market Share Of Device IoT Application In Global Retail Guidelines PDF
The following slide highlights the market share of device management on the basis of region. It shows regional market size, market distribution by industry, top countries and major uses of IoT service. The IoT Service Regional Market Share Of Device IoT Application In Global Retail Guidelines PDF is a compilation of the most recent design trends as a series of slides. It is suitable for any subject or industry presentation, containing attractive visuals and photo spots for businesses to clearly express their messages. This template contains a variety of slides for the user to input data, such as structures to contrast two elements, bullet points, and slides for written information. Slidegeeks is prepared to create an impression. The following slide highlights the market share of device management on the basis of region. It shows regional market size, market distribution by industry, top countries and major uses of IoT service
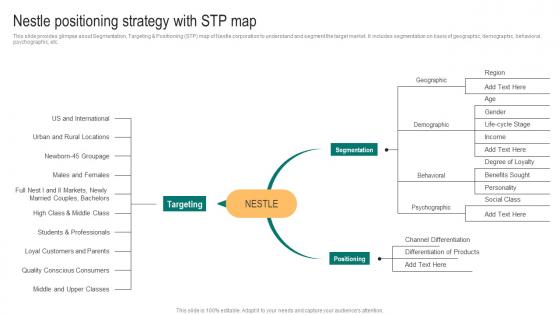
Packaged Food Business Nestle Positioning Strategy With Stp Map Mockup Pdf
This slide provides glimpse about shareholder analysis of Nestle corporation to understand ownership structure and composition of shareholding base. It includes ownership breakdown pie-chart, shareholding structure, top shareholders, etc. The Packaged Food Business Nestle Positioning Strategy With Stp Map Mockup Pdf is a compilation of the most recent design trends as a series of slides. It is suitable for any subject or industry presentation, containing attractive visuals and photo spots for businesses to clearly express their messages. This template contains a variety of slides for the user to input data, such as structures to contrast two elements, bullet points, and slides for written information. Slidegeeks is prepared to create an impression. This slide provides glimpse about shareholder analysis of Nestle corporation to understand ownership structure and composition of shareholding base. It includes ownership breakdown pie-chart, shareholding structure, top shareholders, etc.
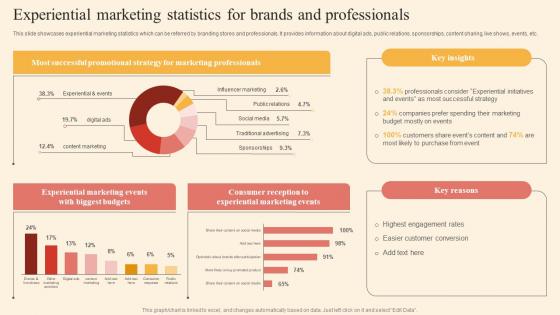
Experiential Marketing Statistics Driving Business Success By Hosting Experiential Pictures Pdf
This slide showcases experiential marketing statistics which can be referred by branding stores and professionals. It provides information about digital ads, public relations, sponsorships, content sharing, live shows, events, etc. The Experiential Marketing Statistics Driving Business Success By Hosting Experiential Pictures Pdf is a compilation of the most recent design trends as a series of slides. It is suitable for any subject or industry presentation, containing attractive visuals and photo spots for businesses to clearly express their messages. This template contains a variety of slides for the user to input data, such as structures to contrast two elements, bullet points, and slides for written information. Slidegeeks is prepared to create an impression. This slide showcases experiential marketing statistics which can be referred by branding stores and professionals. It provides information about digital ads, public relations, sponsorships, content sharing, live shows, events, etc.
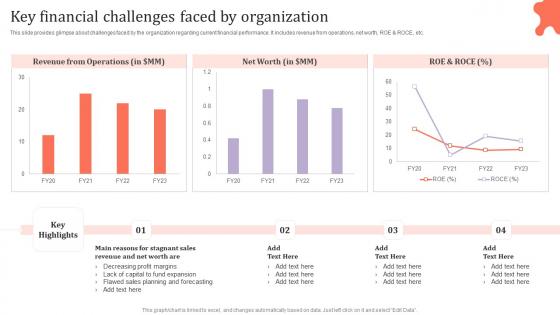
Key Financial Challenges Faced Organization Assessing Corporate Financial Techniques Infographics Pdf
This slide provides glimpse about challenges faced by the organization regarding current financial performance. It includes revenue from operations, net worth, ROE and ROCE, etc. The Key Financial Challenges Faced Organization Assessing Corporate Financial Techniques Infographics Pdf is a compilation of the most recent design trends as a series of slides. It is suitable for any subject or industry presentation, containing attractive visuals and photo spots for businesses to clearly express their messages. This template contains a variety of slides for the user to input data, such as structures to contrast two elements, bullet points, and slides for written information. Slidegeeks is prepared to create an impression. This slide provides glimpse about challenges faced by the organization regarding current financial performance. It includes revenue from operations, net worth, ROE and ROCE, etc.
Food Processing Business Profile Company Product Analysis With Revenue Growth Icons Pdf
This slide highlights the Company Products Analysis with different segments which includes grooming, beauty care, home care and health care which showcases product revenue growth and return on assets. The Food Processing Business Profile Company Product Analysis With Revenue Growth Icons Pdf is a compilation of the most recent design trends as a series of slides. It is suitable for any subject or industry presentation, containing attractive visuals and photo spots for businesses to clearly express their messages. This template contains a variety of slides for the user to input data, such as structures to contrast two elements, bullet points, and slides for written information. Slidegeeks is prepared to create an impression. This slide highlights the Company Products Analysis with different segments which includes grooming, beauty care, home care and health care which showcases product revenue growth and return on assets.

Email Newsletter Dashboard Digital Marketing Strategies Improve Enterprise Sales Infographics Pdf
The following slide showcases a key performance indicator KPI dashboard through which managers can measure the impact of email marketing strategy on business performance. The metrics covered in the slide are total conversions, new subscribers, etc. The Email Newsletter Dashboard Digital Marketing Strategies Improve Enterprise Sales Infographics Pdf is a compilation of the most recent design trends as a series of slides. It is suitable for any subject or industry presentation, containing attractive visuals and photo spots for businesses to clearly express their messages. This template contains a variety of slides for the user to input data, such as structures to contrast two elements, bullet points, and slides for written information. Slidegeeks is prepared to create an impression. The following slide showcases a key performance indicator KPI dashboard through which managers can measure the impact of email marketing strategy on business performance. The metrics covered in the slide are total conversions, new subscribers, etc.
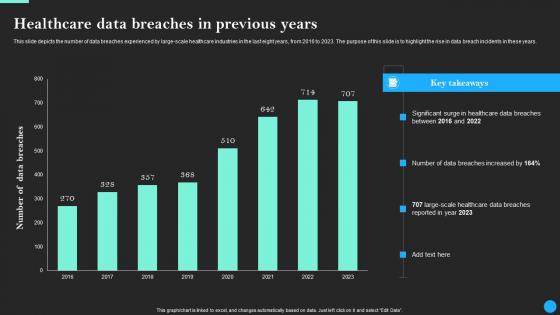
Healthcare Data Breaches In Previous Years Data Breach Prevention Guidelines Pdf
This slide depicts the number of data breaches experienced by large-scale healthcare industries in the last eight years, from 2016 to 2023. The purpose of this slide is to highlight the rise in data breach incidents in these years. The Healthcare Data Breaches In Previous Years Data Breach Prevention Guidelines Pdf is a compilation of the most recent design trends as a series of slides. It is suitable for any subject or industry presentation, containing attractive visuals and photo spots for businesses to clearly express their messages. This template contains a variety of slides for the user to input data, such as structures to contrast two elements, bullet points, and slides for written information. Slidegeeks is prepared to create an impression. This slide depicts the number of data breaches experienced by large-scale healthcare industries in the last eight years, from 2016 to 2023. The purpose of this slide is to highlight the rise in data breach incidents in these years.
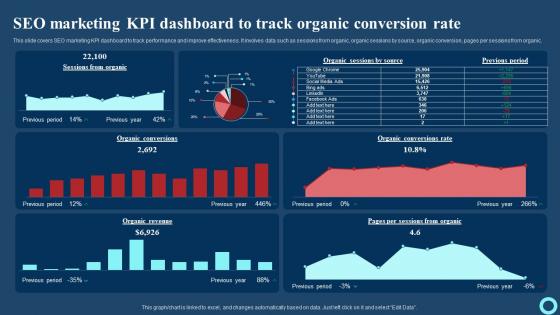
Seo Marketing KPI Dashboard To Track Organic Conversion Rate Effective Strategies To Enhance Download Pdf
This slide covers SEO marketing KPI dashboard to track performance and improve effectiveness. It involves data such as sessions from organic, organic sessions by source, organic conversion, pages per sessions from organic. The Seo Marketing KPI Dashboard To Track Organic Conversion Rate Effective Strategies To Enhance Download Pdf is a compilation of the most recent design trends as a series of slides. It is suitable for any subject or industry presentation, containing attractive visuals and photo spots for businesses to clearly express their messages. This template contains a variety of slides for the user to input data, such as structures to contrast two elements, bullet points, and slides for written information. Slidegeeks is prepared to create an impression. This slide covers SEO marketing KPI dashboard to track performance and improve effectiveness. It involves data such as sessions from organic, organic sessions by source, organic conversion, pages per sessions from organic.
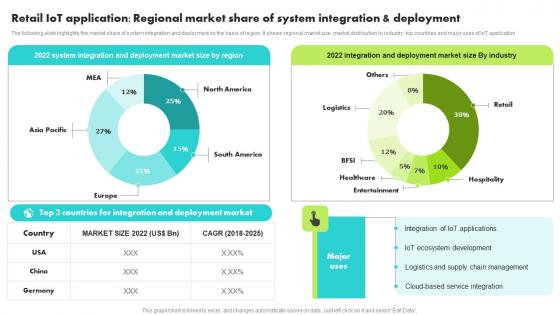
Retail IoT Application Regional Market Share System Guide For Retail IoT Solutions Analysis Pictures Pdf
The following slide highlights the market share of system integration and deployment on the basis of region. It shows regional market size, market distribution by industry, top countries and major uses of IoT application The Retail IoT Application Regional Market Share System Guide For Retail IoT Solutions Analysis Pictures Pdf is a compilation of the most recent design trends as a series of slides. It is suitable for any subject or industry presentation, containing attractive visuals and photo spots for businesses to clearly express their messages. This template contains a variety of slides for the user to input data, such as structures to contrast two elements, bullet points, and slides for written information. Slidegeeks is prepared to create an impression. The following slide highlights the market share of system integration and deployment on the basis of region. It shows regional market size, market distribution by industry, top countries and major uses of IoT application
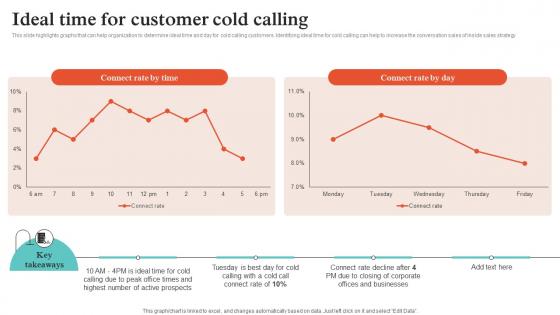
Virtual Sales Strategies Ideal Time For Customer Cold Calling Strategy SS V
This slide highlights graphs that can help organization to determine ideal time and day for cold calling customers. Identifying ideal time for cold calling can help to increase the conversation sales of inside sales strategy. The Virtual Sales Strategies Ideal Time For Customer Cold Calling Strategy SS V is a compilation of the most recent design trends as a series of slides. It is suitable for any subject or industry presentation, containing attractive visuals and photo spots for businesses to clearly express their messages. This template contains a variety of slides for the user to input data, such as structures to contrast two elements, bullet points, and slides for written information. Slidegeeks is prepared to create an impression. This slide highlights graphs that can help organization to determine ideal time and day for cold calling customers. Identifying ideal time for cold calling can help to increase the conversation sales of inside sales strategy.
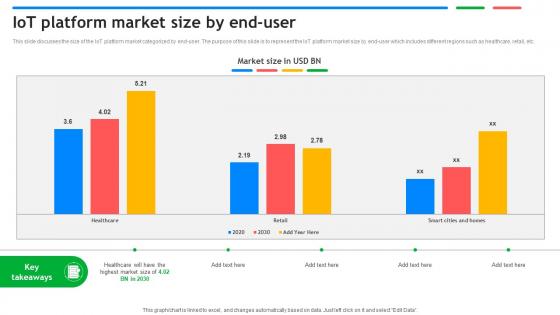
IoT Platform Market Size By End User Exploring Google Cloud IoT Platform
This slide discusses the size of the IoT platform market categorized by end user. The purpose of this slide is to represent the IoT platform market size by end user which includes different regions such as healthcare, retail, etc. The IoT Platform Market Size By End User Exploring Google Cloud IoT Platform is a compilation of the most recent design trends as a series of slides. It is suitable for any subject or industry presentation, containing attractive visuals and photo spots for businesses to clearly express their messages. This template contains a variety of slides for the user to input data, such as structures to contrast two elements, bullet points, and slides for written information. Slidegeeks is prepared to create an impression. This slide discusses the size of the IoT platform market categorized by end user. The purpose of this slide is to represent the IoT platform market size by end user which includes different regions such as healthcare, retail, etc.
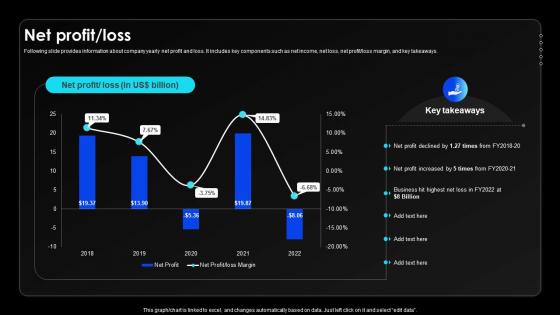
Net Profit Loss Wireless Communication Services Provider Company Profile CP SS V
Following slide provides information about company yearly net profit and loss. It includes key components such as net income, net loss, net profit or loss margin, and key takeaways.The Net Profit Loss Wireless Communication Services Provider Company Profile CP SS V is a compilation of the most recent design trends as a series of slides. It is suitable for any subject or industry presentation, containing attractive visuals and photo spots for businesses to clearly express their messages. This template contains a variety of slides for the user to input data, such as structures to contrast two elements, bullet points, and slides for written information. Slidegeeks is prepared to create an impression. Following slide provides information about company yearly net profit and loss. It includes key components such as net income, net loss, net profit or loss margin, and key takeaways.
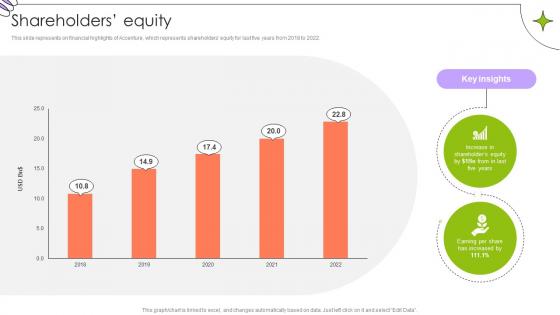
Shareholders Equity Global Innovation And Business Solutions Company Profile CP SS V
This slide represents on financial highlights of Accenture, which represents shareholders equity for last five years from 2018 to 2022.The Shareholders Equity Global Innovation And Business Solutions Company Profile CP SS V is a compilation of the most recent design trends as a series of slides. It is suitable for any subject or industry presentation, containing attractive visuals and photo spots for businesses to clearly express their messages. This template contains a variety of slides for the user to input data, such as structures to contrast two elements, bullet points, and slides for written information. Slidegeeks is prepared to create an impression. This slide represents on financial highlights of Accenture, which represents shareholders equity for last five years from 2018 to 2022.
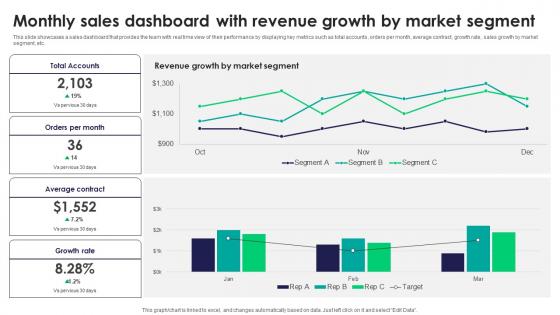
Monthly Sales Dashboard With Revenue Growth By Tactics For Improving Field Sales Team SA SS V
This slide showcases a sales dashboard that provides the team with real time view of their performance by displaying key metrics such as total accounts, orders per month, average contract, growth rate, sales growth by market segment, etc. The Monthly Sales Dashboard With Revenue Growth By Tactics For Improving Field Sales Team SA SS V is a compilation of the most recent design trends as a series of slides. It is suitable for any subject or industry presentation, containing attractive visuals and photo spots for businesses to clearly express their messages. This template contains a variety of slides for the user to input data, such as structures to contrast two elements, bullet points, and slides for written information. Slidegeeks is prepared to create an impression. This slide showcases a sales dashboard that provides the team with real time view of their performance by displaying key metrics such as total accounts, orders per month, average contract, growth rate, sales growth by market segment, etc.
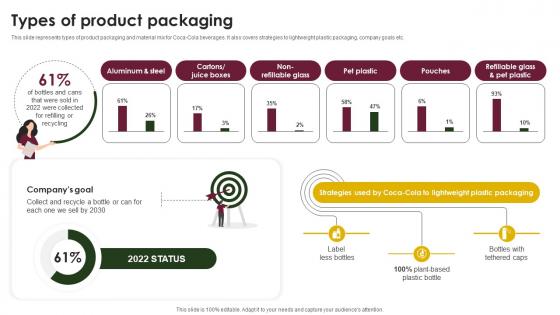
Types Of Product Packaging Beverage Company Profile CP SS V
This slide represents types of product packaging and material mix for Coca-Cola beverages. It also covers strategies to lightweight plastic packaging, company goals etc.The Types Of Product Packaging Beverage Company Profile CP SS V is a compilation of the most recent design trends as a series of slides. It is suitable for any subject or industry presentation, containing attractive visuals and photo spots for businesses to clearly express their messages. This template contains a variety of slides for the user to input data, such as structures to contrast two elements, bullet points, and slides for written information. Slidegeeks is prepared to create an impression. This slide represents types of product packaging and material mix for Coca-Cola beverages. It also covers strategies to lightweight plastic packaging, company goals etc.
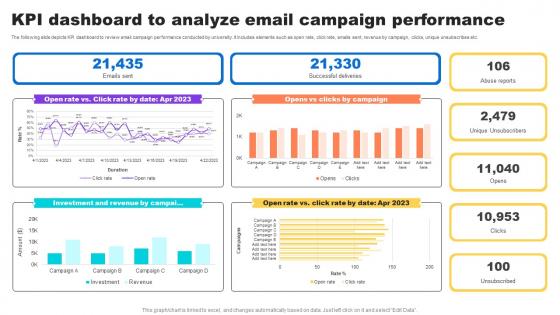
Kpi Dashboard To Analyze Email Campaign Key Step To Implementation University Strategy SS V
The following slide depicts KPI dashboard to review email campaign performance conducted by university. It includes elements such as open rate, click rate, emails sent, revenue by campaign, clicks, unique unsubscribes etc.The Kpi Dashboard To Analyze Email Campaign Key Step To Implementation University Strategy SS V is a compilation of the most recent design trends as a series of slides. It is suitable for any subject or industry presentation, containing attractive visuals and photo spots for businesses to clearly express their messages. This template contains a variety of slides for the user to input data, such as structures to contrast two elements, bullet points, and slides for written information. Slidegeeks is prepared to create an impression. The following slide depicts KPI dashboard to review email campaign performance conducted by university. It includes elements such as open rate, click rate, emails sent, revenue by campaign, clicks, unique unsubscribes etc.
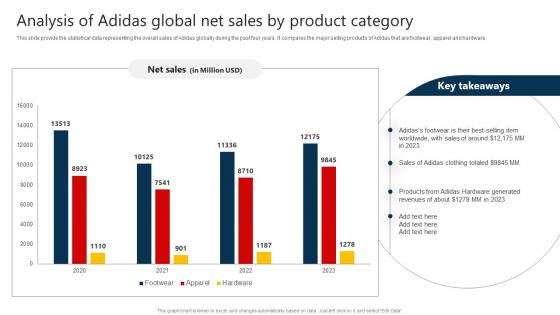
The Marketing Mix Of Analysis Of Adidas Global Net Sales By Product Category Strategy SS V
This slide provide the statistical data representing the overall sales of Adidas globally during the past four years. It compares the major selling products of Adidas that are footwear, apparel and hardware. The The Marketing Mix Of Analysis Of Adidas Global Net Sales By Product Category Strategy SS V is a compilation of the most recent design trends as a series of slides. It is suitable for any subject or industry presentation, containing attractive visuals and photo spots for businesses to clearly express their messages. This template contains a variety of slides for the user to input data, such as structures to contrast two elements, bullet points, and slides for written information. Slidegeeks is prepared to create an impression. This slide provide the statistical data representing the overall sales of Adidas globally during the past four years. It compares the major selling products of Adidas that are footwear, apparel and hardware.
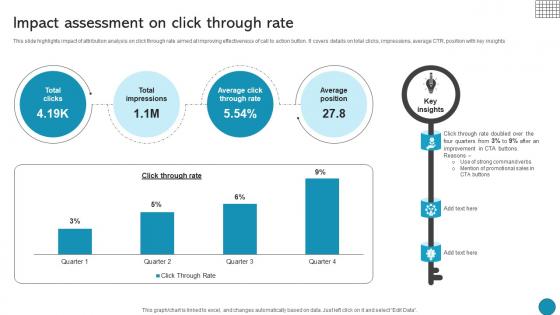
Impact Assessment On Click Through Rate Driving Business Success Integrating Product
This slide highlights impact of attribution analysis on click through rate aimed at improving effectiveness of call to action button. It covers details on total clicks, impressions, average CTR, position with key insights The Impact Assessment On Click Through Rate Driving Business Success Integrating Product is a compilation of the most recent design trends as a series of slides. It is suitable for any subject or industry presentation, containing attractive visuals and photo spots for businesses to clearly express their messages. This template contains a variety of slides for the user to input data, such as structures to contrast two elements, bullet points, and slides for written information. Slidegeeks is prepared to create an impression. This slide highlights impact of attribution analysis on click through rate aimed at improving effectiveness of call to action button. It covers details on total clicks, impressions, average CTR, position with key insights
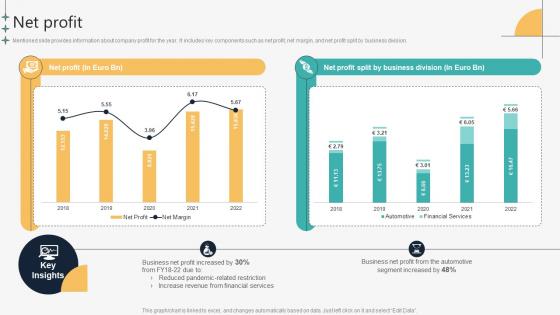
Net Profit Automotive Manufacturing Company Profile CP SS V
Mentioned slide provides information about company profit for the year. It includes key components such as net profit, net margin, and net profit split by business division.The Net Profit Automotive Manufacturing Company Profile CP SS V is a compilation of the most recent design trends as a series of slides. It is suitable for any subject or industry presentation, containing attractive visuals and photo spots for businesses to clearly express their messages. This template contains a variety of slides for the user to input data, such as structures to contrast two elements, bullet points, and slides for written information. Slidegeeks is prepared to create an impression. Mentioned slide provides information about company profit for the year. It includes key components such as net profit, net margin, and net profit split by business division.
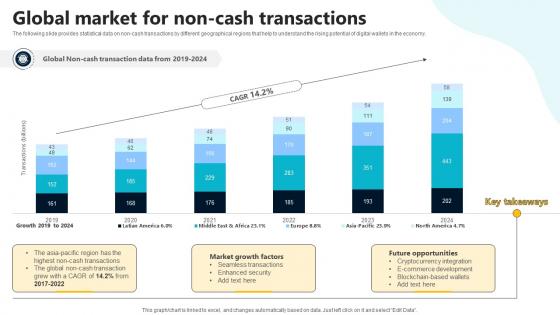
Global Market For Non Cash Transactions In Depth Guide To Digital Wallets Fin SS V
The following slide provides statistical data on non-cash transactions by different geographical regions that help to understand the rising potential of digital wallets in the economy. The Global Market For Non Cash Transactions In Depth Guide To Digital Wallets Fin SS V is a compilation of the most recent design trends as a series of slides. It is suitable for any subject or industry presentation, containing attractive visuals and photo spots for businesses to clearly express their messages. This template contains a variety of slides for the user to input data, such as structures to contrast two elements, bullet points, and slides for written information. Slidegeeks is prepared to create an impression. The following slide provides statistical data on non-cash transactions by different geographical regions that help to understand the rising potential of digital wallets in the economy.

Monthly Sales Dashboard With Revenue Efficient Sales Territory Management To Build SA SS V
This slide showcases a sales dashboard that provides the team with real time view of their performance by displaying key metrics such as total accounts, orders per month, average contract, growth rate, sales growth by market segment, etc. The Monthly Sales Dashboard With Revenue Efficient Sales Territory Management To Build SA SS V is a compilation of the most recent design trends as a series of slides. It is suitable for any subject or industry presentation, containing attractive visuals and photo spots for businesses to clearly express their messages. This template contains a variety of slides for the user to input data, such as structures to contrast two elements, bullet points, and slides for written information. Slidegeeks is prepared to create an impression. This slide showcases a sales dashboard that provides the team with real time view of their performance by displaying key metrics such as total accounts, orders per month, average contract, growth rate, sales growth by market segment, etc.

Empowering The Future Statistical Graph Showcasing Smart Meter Market Growth IoT SS V
This slide showcases information about the global market size of smart meters. It includes key reasons such as government initiatives to promote energy conversation, smart city initiatives, accurate billing process, etc. The Empowering The Future Statistical Graph Showcasing Smart Meter Market Growth IoT SS V is a compilation of the most recent design trends as a series of slides. It is suitable for any subject or industry presentation, containing attractive visuals and photo spots for businesses to clearly express their messages. This template contains a variety of slides for the user to input data, such as structures to contrast two elements, bullet points, and slides for written information. Slidegeeks is prepared to create an impression. This slide showcases information about the global market size of smart meters. It includes key reasons such as government initiatives to promote energy conversation, smart city initiatives, accurate billing process, etc.
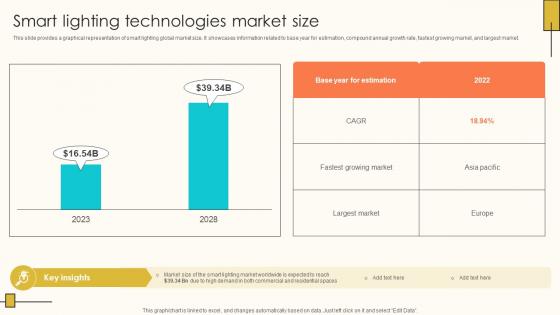
Smart Lighting Technologies Market Size Internet Of Things Solutions To Enhance Energy IoT SS V
This slide provides a graphical representation of smart lighting global market size. It showcases information related to base year for estimation, compound annual growth rate, fastest growing market, and largest market. The Smart Lighting Technologies Market Size Internet Of Things Solutions To Enhance Energy IoT SS V is a compilation of the most recent design trends as a series of slides. It is suitable for any subject or industry presentation, containing attractive visuals and photo spots for businesses to clearly express their messages. This template contains a variety of slides for the user to input data, such as structures to contrast two elements, bullet points, and slides for written information. Slidegeeks is prepared to create an impression. This slide provides a graphical representation of smart lighting global market size. It showcases information related to base year for estimation, compound annual growth rate, fastest growing market, and largest market.
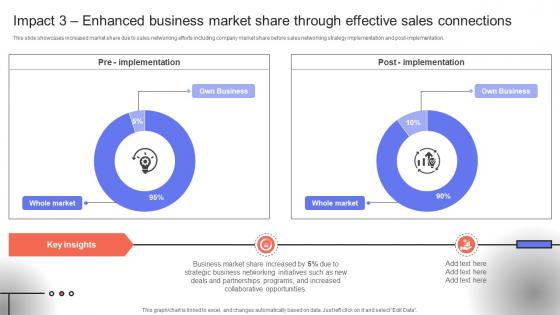
Trade Event Tactics To Boost Impact 3 Enhanced Business Market Share Through SA SS V
This slide showcases increased market share due to sales networking efforts including company market share before sales networking strategy implementation and post-implementation. The Trade Event Tactics To Boost Impact 3 Enhanced Business Market Share Through SA SS V is a compilation of the most recent design trends as a series of slides. It is suitable for any subject or industry presentation, containing attractive visuals and photo spots for businesses to clearly express their messages. This template contains a variety of slides for the user to input data, such as structures to contrast two elements, bullet points, and slides for written information. Slidegeeks is prepared to create an impression. This slide showcases increased market share due to sales networking efforts including company market share before sales networking strategy implementation and post-implementation.
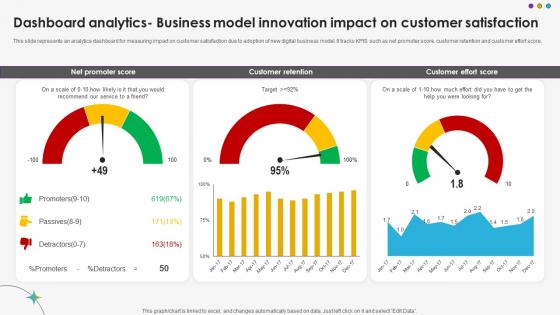
Dashboard Analytics Business Model Innovation Impact On Customer Satisfaction DT SS V
This slide represents an analytics dashboard for measuring impact on customer satisfaction due to adoption of new digital business model. It tracks KPIS such as net promoter score, customer retention and customer effort score.The Dashboard Analytics Business Model Innovation Impact On Customer Satisfaction DT SS V is a compilation of the most recent design trends as a series of slides. It is suitable for any subject or industry presentation, containing attractive visuals and photo spots for businesses to clearly express their messages. This template contains a variety of slides for the user to input data, such as structures to contrast two elements, bullet points, and slides for written information. Slidegeeks is prepared to create an impression. This slide represents an analytics dashboard for measuring impact on customer satisfaction due to adoption of new digital business model. It tracks KPIS such as net promoter score, customer retention and customer effort score.
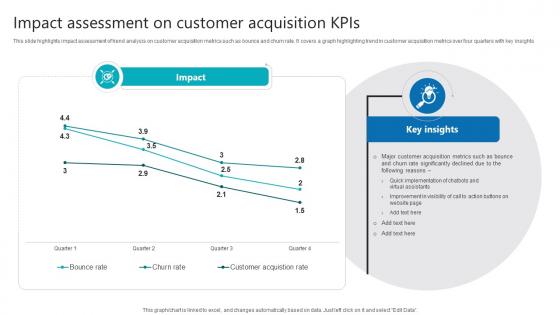
Impact Assessment On Customer Acquisition Kpis Product Analytics Implementation Data Analytics V
This slide highlights impact assessment of trend analysis on customer acquisition metrics such as bounce and churn rate. It covers a graph highlighting trend in customer acquisition metrics over four quarters with key insights The Impact Assessment On Customer Acquisition Kpis Product Analytics Implementation Data Analytics V is a compilation of the most recent design trends as a series of slides. It is suitable for any subject or industry presentation, containing attractive visuals and photo spots for businesses to clearly express their messages. This template contains a variety of slides for the user to input data, such as structures to contrast two elements, bullet points, and slides for written information. Slidegeeks is prepared to create an impression. This slide highlights impact assessment of trend analysis on customer acquisition metrics such as bounce and churn rate. It covers a graph highlighting trend in customer acquisition metrics over four quarters with key insights

Operating Profit C2C Ecommerce Platform Company Profile CP SS V
The slide showcases operating profit or loss of eBay company for five consecutive years from 2018 to 2022 which is recognized as income derived from business core operational activities. The Operating Profit C2C Ecommerce Platform Company Profile CP SS V is a compilation of the most recent design trends as a series of slides. It is suitable for any subject or industry presentation, containing attractive visuals and photo spots for businesses to clearly express their messages. This template contains a variety of slides for the user to input data, such as structures to contrast two elements, bullet points, and slides for written information. Slidegeeks is prepared to create an impression. The slide showcases operating profit or loss of eBay company for five consecutive years from 2018 to 2022 which is recognized as income derived from business core operational activities.
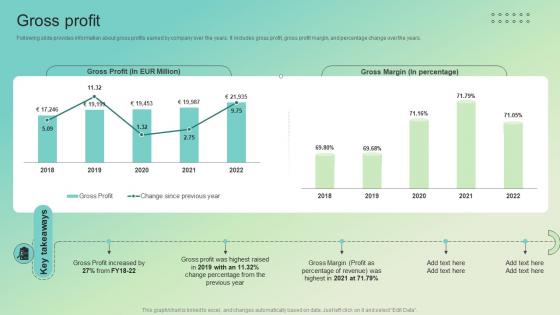
Gross Profit Enterprise Software Solution Providing Company Profile CP SS V
Following slide provides information about gross profits earned by company over the years. It includes gross profit, gross profit margin, and percentage change over the years.The Gross Profit Enterprise Software Solution Providing Company Profile CP SS V is a compilation of the most recent design trends as a series of slides. It is suitable for any subject or industry presentation, containing attractive visuals and photo spots for businesses to clearly express their messages. This template contains a variety of slides for the user to input data, such as structures to contrast two elements, bullet points, and slides for written information. Slidegeeks is prepared to create an impression. Following slide provides information about gross profits earned by company over the years. It includes gross profit, gross profit margin, and percentage change over the years.
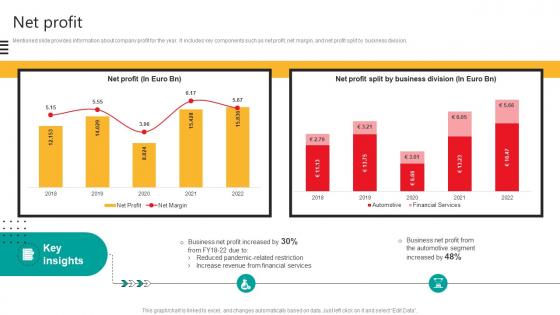
Net Profit Automobile Development Company Profile CP SS V
Mentioned slide provides information about company profit for the year. It includes key components such as net profit, net margin, and net profit split by business division.The Net Profit Automobile Development Company Profile CP SS V is a compilation of the most recent design trends as a series of slides. It is suitable for any subject or industry presentation, containing attractive visuals and photo spots for businesses to clearly express their messages. This template contains a variety of slides for the user to input data, such as structures to contrast two elements, bullet points, and slides for written information. Slidegeeks is prepared to create an impression. Mentioned slide provides information about company profit for the year. It includes key components such as net profit, net margin, and net profit split by business division.
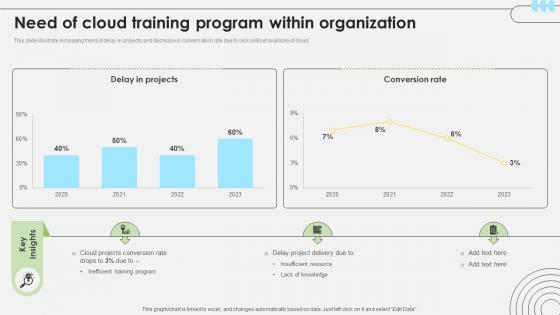
Workforce Competency Enhancement Need Of Cloud Training Program Within Organization DTE SS V
This slide illustrate increasing trend of delay in projects and decrease in conversation rate due to lack skillset available of cloud. The Workforce Competency Enhancement Need Of Cloud Training Program Within Organization DTE SS V is a compilation of the most recent design trends as a series of slides. It is suitable for any subject or industry presentation, containing attractive visuals and photo spots for businesses to clearly express their messages. This template contains a variety of slides for the user to input data, such as structures to contrast two elements, bullet points, and slides for written information. Slidegeeks is prepared to create an impression. This slide illustrate increasing trend of delay in projects and decrease in conversation rate due to lack skillset available of cloud.

Shareholders Equity Global Consulting And Technology Services Company Profile CP SS V
This slide represents on financial highlights of Accenture, which represents shareholders equity for last five years from 2018 to 2022.The Shareholders Equity Global Consulting And Technology Services Company Profile CP SS V is a compilation of the most recent design trends as a series of slides. It is suitable for any subject or industry presentation, containing attractive visuals and photo spots for businesses to clearly express their messages. This template contains a variety of slides for the user to input data, such as structures to contrast two elements, bullet points, and slides for written information. Slidegeeks is prepared to create an impression. This slide represents on financial highlights of Accenture, which represents shareholders equity for last five years from 2018 to 2022.
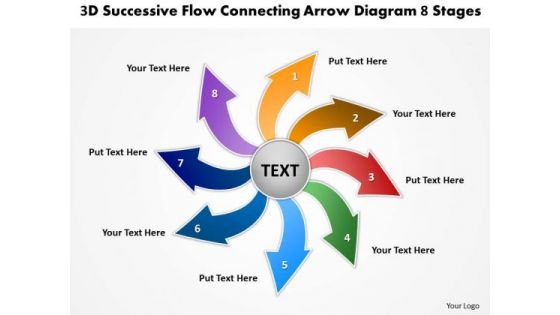
3d Successive Flow Connecting Arrow Diagram 8 Stages Circular Process PowerPoint Slides
We present our 3d successive flow connecting arrow diagram 8 stages Circular Process PowerPoint Slides.Download our Arrows PowerPoint Templates because this PPt Enlighten others on your team with your views. Use our Circle Charts PowerPoint Templates because you can Employ the right colours for your brilliant ideas. Download and present our Shapes PowerPoint Templates because you are aware of some pitfalls ahead where you need to be cautious not to overrun and avoid a stall. Download and present our Business PowerPoint Templates because Building castles in the sand is a danger and you are aware of. You have taken the precaution of building strong fundamentals. Present our Flow Charts PowerPoint Templates because Our PowerPoint Templates and Slides will Embellish your thoughts. They will help you illustrate the brilliance of your ideas.Use these PowerPoint slides for presentations relating to 3d, abstract, aim, arrow, background, business, career, chart, circle, color, concept, creative, curve, design, development, direction, financial, flowing, gain, graph, green, group, growth, higher, illustration, increase, isolated, motion, moving, moving up, path, prediction, progress, red, series, shape, sign, success, symbol, target, turn, twisted, up, upload, upward, way, white, win. The prominent colors used in the PowerPoint template are Red, Green, Blue. Presenters tell us our 3d successive flow connecting arrow diagram 8 stages Circular Process PowerPoint Slides are Spiffy. You can be sure our circle PowerPoint templates and PPT Slides are Whimsical. Professionals tell us our 3d successive flow connecting arrow diagram 8 stages Circular Process PowerPoint Slides are designed by professionals People tell us our arrow PowerPoint templates and PPT Slides are Gorgeous. People tell us our 3d successive flow connecting arrow diagram 8 stages Circular Process PowerPoint Slides are readymade to fit into any presentation structure. Professionals tell us our aim PowerPoint templates and PPT Slides will help them to explain complicated concepts. Respond to feedback with our 3d Successive Flow Connecting Arrow Diagram 8 Stages Circular Process PowerPoint Slides. Download without worries with our money back guaranteee.
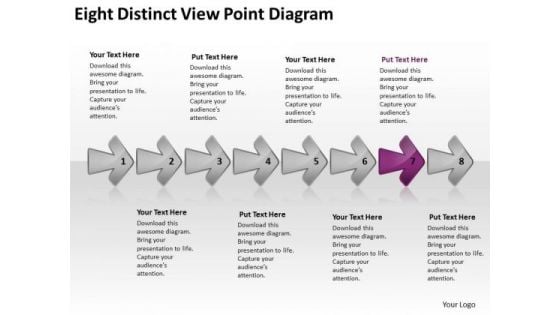
Eight Distinct View Point Diagram Chart Flow Chart PowerPoint Free Slides
We present our eight distinct view point diagram chart flow chart PowerPoint free Slides.Use our Business PowerPoint Templates because you can Flutter your wings and enchant the world. Impress them with the innate attractiveness of your thoughts and words. Use our Shapes PowerPoint Templates because this one depicts the popular chart. Present our Process and Flows PowerPoint Templates because you have what it takes to grow. Download and present our Flow charts PowerPoint Templates because this slide depicts the occasion for gifting and giving. Use our Arrows PowerPoint Templates because it illustrates the symbols of human growth.Use these PowerPoint slides for presentations relating to 3d, Abstract, Around, Arrows, Business, Center, Circle, Circular, Concept, Connections, Curve, Cycle, Directions, Distribution, Illustration, Management, Middle, Objects, Plan, Process, Recycle, Rounded, Shadows, Space, System. The prominent colors used in the PowerPoint template are Magenta, Gray, White. Use our eight distinct view point diagram chart flow chart PowerPoint free Slides are readymade to fit into any presentation structure. Presenters tell us our Around PowerPoint templates and PPT Slides are Precious. Presenters tell us our eight distinct view point diagram chart flow chart PowerPoint free Slides are Handsome. You can be sure our Center PowerPoint templates and PPT Slides are Awesome. PowerPoint presentation experts tell us our eight distinct view point diagram chart flow chart PowerPoint free Slides are Playful. Professionals tell us our Circular PowerPoint templates and PPT Slides will impress their bosses and teams. Facilitate growth with our Eight Distinct View Point Diagram Chart Flow Chart PowerPoint Free Slides. Download without worries with our money back guaranteee.
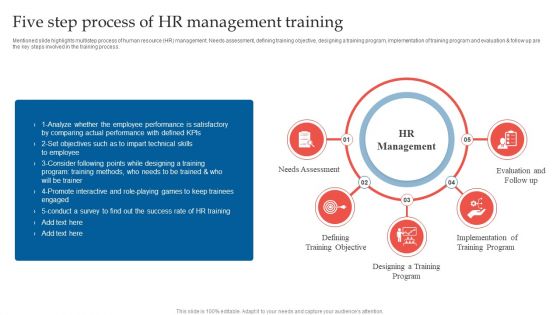
Five Step Process Of HR Management Training Ppt Model Ideas PDF
Mentioned slide highlights multistep process of human resource HR management. Needs assessment, defining training objective, designing a training program, implementation of training program and evaluation and follow up are the key steps involved in the training process. Presenting Five Step Process Of HR Management Training Ppt Model Ideas PDF to dispense important information. This template comprises five stages. It also presents valuable insights into the topics including Needs Assessment, Defining Training Objective, Implementation Training Program. This is a completely customizable PowerPoint theme that can be put to use immediately. So, download it and address the topic impactfully.
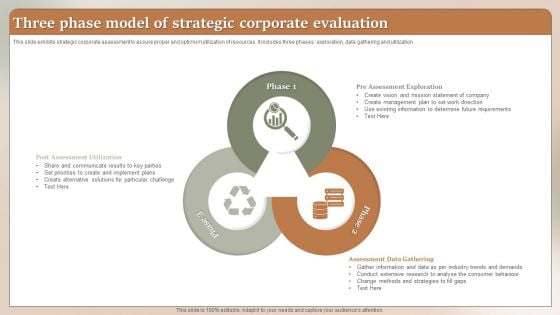
Three Phase Model Of Strategic Corporate Evaluation Ppt Ideas Designs Download PDF
This slide exhibits strategic corporate assessment to assure proper and optimum utilization of resources. It includes three phases exploration, data gathering and utilization. Presenting Three Phase Model Of Strategic Corporate Evaluation Ppt Ideas Designs Download PDF to dispense important information. This template comprises three stages. It also presents valuable insights into the topics including Post Assessment Utilization, Pre Assessment Exploration, Assessment Data Gathering. This is a completely customizable PowerPoint theme that can be put to use immediately. So, download it and address the topic impactfully.
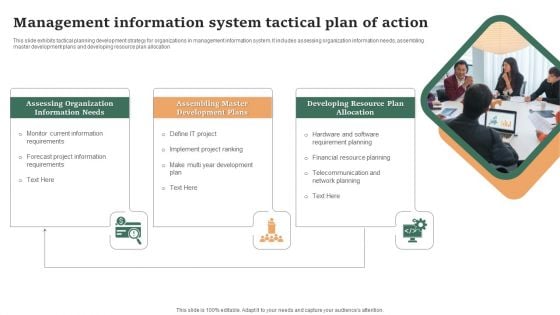
Management Information System Tactical Plan Of Action Ppt Show Graphics Design PDF
This slide exhibits tactical planning development strategy for organizations in management information system. It includes assessing organization information needs, assembling master development plans and developing resource plan allocation. Presenting Management Information System Tactical Plan Of Action Ppt Show Graphics Design PDF to dispense important information. This template comprises three stages. It also presents valuable insights into the topics including Assessing Organization, Information Needs, Assembling Master. This is a completely customizable PowerPoint theme that can be put to use immediately. So, download it and address the topic impactfully.
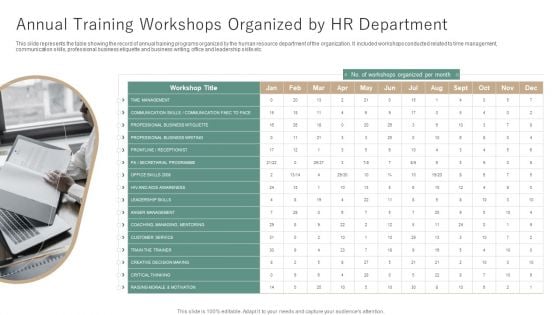
Annual Training Workshops Organized By HR Department Ppt Inspiration File Formats PDF
This slide represents the table showing the record of annual training programs organized by the human resource department of the organization. It included workshops conducted related to time management, communication skills, professional business etiquette and business writing, office and leadership skills etc. Presenting Annual Training Workshops Organized By HR Department Ppt Inspiration File Formats PDF to dispense important information. This template comprises one stages. It also presents valuable insights into the topics including Workshop Title, Workshops Organized, Frontline Receptionist. This is a completely customizable PowerPoint theme that can be put to use immediately. So, download it and address the topic impactfully.
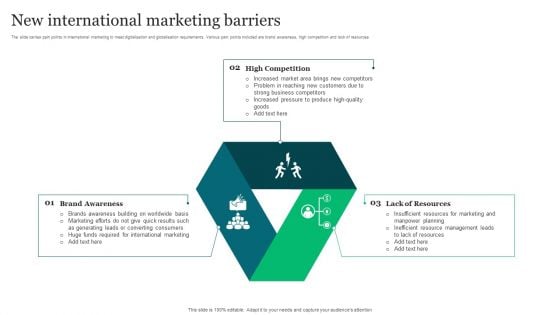
New International Marketing Barriers Ppt Deck PDF
The slide carries pain points in international marketing to meet digitalisation and globalisation requirements. Various pain points included are brand awareness, high competition and lack of resources. Persuade your audience using this New International Marketing Barriers Ppt Deck PDF. This PPT design covers three stages, thus making it a great tool to use. It also caters to a variety of topics including High Competition, Lack Resources, Brand Awareness. Download this PPT design now to present a convincing pitch that not only emphasizes the topic but also showcases your presentation skills.
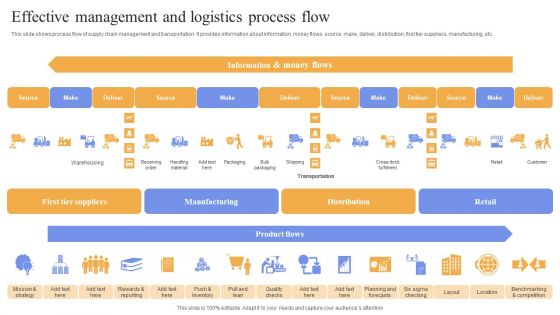
Effective Management And Logistics Process Flow Microsoft PDF
This slide shows process flow of supply chain management and transportation. It provides information about information, money flows, source, make, deliver, distribution, first tier suppliers, manufacturing, etc. Showcasing this set of slides titled Effective Management And Logistics Process Flow Microsoft PDF. The topics addressed in these templates are Information, Product Flows, Money Flows. All the content presented in this PPT design is completely editable. Download it and make adjustments in color, background, font etc. as per your unique business setting.
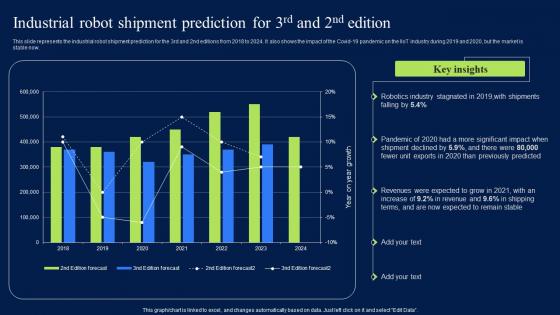
Industrial Robot Shipment Prediction For 3Rd And 2Nd Edition Formats PDF
This slide represents the industrial robot shipment prediction for the 3rd and 2nd editions from 2018 to 2024. It also shows the impact of the Covid-19 pandemic on the IoT industry during 2019 and 2020, but the market is stable now. Do you have to make sure that everyone on your team knows about any specific topic I yes, then you should give Industrial Robot Shipment Prediction For 3Rd And 2Nd Edition Formats PDF a try. Our experts have put a lot of knowledge and effort into creating this impeccable Industrial Robot Shipment Prediction For 3Rd And 2Nd Edition Formats PDF. You can use this template for your upcoming presentations, as the slides are perfect to represent even the tiniest detail. You can download these templates from the Slidegeeks website and these are easy to edit. So grab these today This slide represents the industrial robot shipment prediction for the 3rd and 2nd editions from 2018 to 2024. It also shows the impact of the Covid-19 pandemic on the IIoT industry during 2019 and 2020, but the market is stable now.
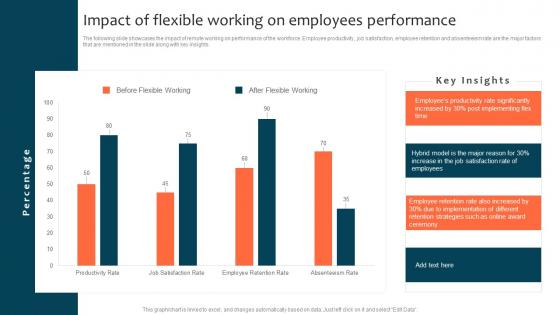
Impact Of Flexible Working On Employees Performance Optimizing Staff Retention Rate Brochure Pdf
The following slide showcases the impact of remote working on performance of the workforce. Employee productivity, job satisfaction, employee retention and absenteeism rate are the major factors that are mentioned in the slide along with key insights. Do you have to make sure that everyone on your team knows about any specific topic I yes, then you should give Impact Of Flexible Working On Employees Performance Optimizing Staff Retention Rate Brochure Pdf a try. Our experts have put a lot of knowledge and effort into creating this impeccable Impact Of Flexible Working On Employees Performance Optimizing Staff Retention Rate Brochure Pdf You can use this template for your upcoming presentations, as the slides are perfect to represent even the tiniest detail. You can download these templates from the Slidegeeks website and these are easy to edit. So grab these today. The following slide showcases the impact of remote working on performance of the workforce. Employee productivity, job satisfaction, employee retention and absenteeism rate are the major factors that are mentioned in the slide along with key insights.
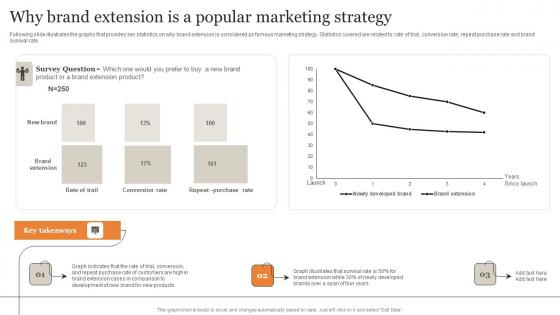
Why Brand Extension Is A Popular Marketing Strategy Ultimate Guide Implementing Inspiration Pdf
Following slide illustrates the graphs that provides key statistics on why brand extension is considered as famous marketing strategy. Statistics covered are related to rate of trial, conversion rate, repeat purchase rate and brand survival rate. Do you have to make sure that everyone on your team knows about any specific topic I yes, then you should give Why Brand Extension Is A Popular Marketing Strategy Ultimate Guide Implementing Inspiration Pdf a try. Our experts have put a lot of knowledge and effort into creating this impeccable Why Brand Extension Is A Popular Marketing Strategy Ultimate Guide Implementing Inspiration Pdf You can use this template for your upcoming presentations, as the slides are perfect to represent even the tiniest detail. You can download these templates from the Slidegeeks website and these are easy to edit. So grab these today. Following slide illustrates the graphs that provides key statistics on why brand extension is considered as famous marketing strategy. Statistics covered are related to rate of trial, conversion rate, repeat purchase rate and brand survival rate.
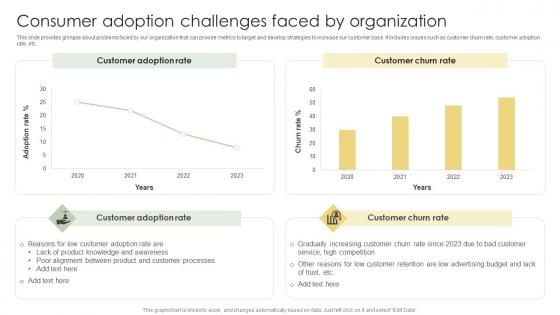
Consumer Adoption Challenges Faced By Organization Analyzing Customer Adoption Journey Designs Pdf
This slide provides glimpse about problems faced by our organization that can provide metrics to target and develop strategies to increase our customer base. It includes issues such as customer churn rate, customer adoption rate, etc.Do you have to make sure that everyone on your team knows about any specific topic I yes, then you should give Consumer Adoption Challenges Faced By Organization Analyzing Customer Adoption Journey Designs Pdf a try. Our experts have put a lot of knowledge and effort into creating this impeccable Consumer Adoption Challenges Faced By Organization Analyzing Customer Adoption Journey Designs Pdf. You can use this template for your upcoming presentations, as the slides are perfect to represent even the tiniest detail. You can download these templates from the Slidegeeks website and these are easy to edit. So grab these today. This slide provides glimpse about problems faced by our organization that can provide metrics to target and develop strategies to increase our customer base. It includes issues such as customer churn rate, customer adoption rate, etc.
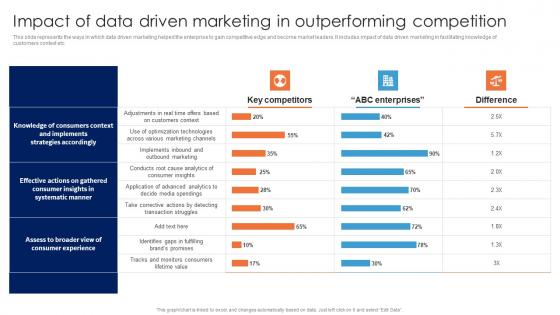
Impact Of Data Driven Marketing In Outperforming Guide For Data Driven Advertising Designs Pdf
This slide represents the ways in which data driven marketing helped the enterprise to gain competitive edge and become market leaders. It includes impact of data driven marketing in facilitating knowledge of customers context etc.Do you have to make sure that everyone on your team knows about any specific topic I yes, then you should give Impact Of Data Driven Marketing In Outperforming Guide For Data Driven Advertising Designs Pdf a try. Our experts have put a lot of knowledge and effort into creating this impeccable Impact Of Data Driven Marketing In Outperforming Guide For Data Driven Advertising Designs Pdf. You can use this template for your upcoming presentations, as the slides are perfect to represent even the tiniest detail. You can download these templates from the Slidegeeks website and these are easy to edit. So grab these today. This slide represents the ways in which data driven marketing helped the enterprise to gain competitive edge and become market leaders. It includes impact of data driven marketing in facilitating knowledge of customers context etc.


 Continue with Email

 Home
Home


