Cyber Attack
Financial Procedure Dashboard Indicating Yearly Revenue Analysis Icons PDF
This slide illustrates finance process dashboard indicating yearly revenue analysis which contains gross profit margin, operating profit ratio, net profit, revenue and cost of goods sold cogs operating expenses, etc. It can be referred by company owners who can compare it with previous years performance and make related decisions for future. Showcasing this set of slides titled Financial Procedure Dashboard Indicating Yearly Revenue Analysis Icons PDF. The topics addressed in these templates are Operating Profit Percentage, Net Profit Percentage, Operating Profit Ratio. All the content presented in this PPT design is completely editable. Download it and make adjustments in color, background, font etc. as per your unique business setting.
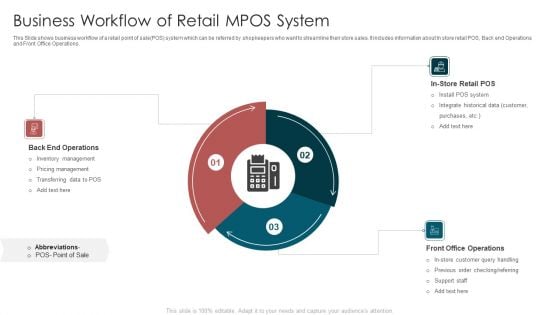
Business Workflow Of Retail MPOS System Clipart PDF
This Slide shows business workflow of a retail point of sale POS system which can be referred by shopkeepers who want to streamline their store sales. It includes information about In store retail POS, Back end Operations and Front Office Operations. Presenting Business Workflow Of Retail MPOS System Clipart PDF to dispense important information. This template comprises three stages. It also presents valuable insights into the topics including Back End Operations, Front Office Operations, Customer Query Handling. This is a completely customizable PowerPoint theme that can be put to use immediately. So, download it and address the topic impactfully.
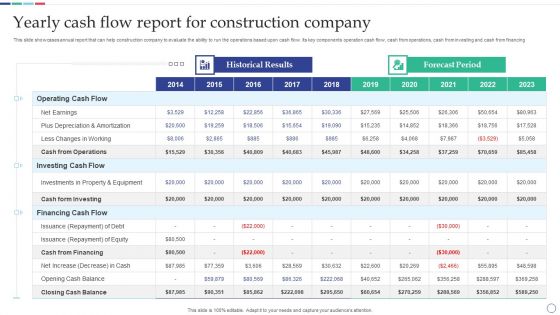
Yearly Cash Flow Report For Construction Company Structure PDF
This slide showcases annual report that can help construction company to evaluate the ability to run the operations based upon cash flow. Its key components operation cash flow, cash from operations, cash from investing and cash from financing. Pitch your topic with ease and precision using this Yearly Cash Flow Report For Construction Company Structure PDF. This layout presents information on Financing Cash Flow, Investing Cash Flow, Operating Cash Flow. It is also available for immediate download and adjustment. So, changes can be made in the color, design, graphics or any other component to create a unique layout.

Consulting Business ORMF Ppt PowerPoint Presentation Summary Example Topics PDF
This slide covers framework designed to address risk management challenges and bring business value. It includes critical elements such as risk strategy and appetite, risk governance, risk culture, operational risk assessment and measurement, operational risk management and monitoring, etc.Persuade your audience using this Consulting Business ORMF Ppt PowerPoint Presentation Summary Example Topics PDF. This PPT design covers seven stages, thus making it a great tool to use. It also caters to a variety of topics including Management Strategy, Operative Technology, Reporting Operational. Download this PPT design now to present a convincing pitch that not only emphasizes the topic but also showcases your presentation skills.
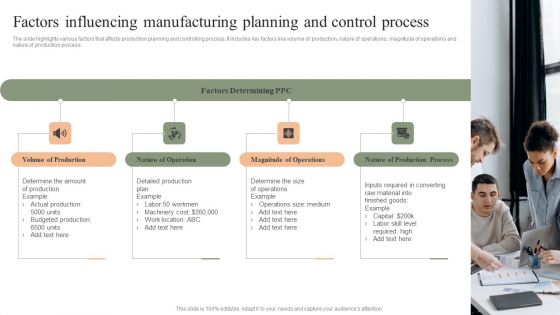
Factors Influencing Manufacturing Planning And Control Process Structure PDF
The slide highlights various factors that affects production planning and controlling process. It includes key factors like volume of production, nature of operations, magnitude of operations and nature of production process. Presenting Factors Influencing Manufacturing Planning And Control Process Structure PDF to dispense important information. This template comprises Four stages. It also presents valuable insights into the topics including Volume Of Production, Nature Of Operation, Magnitude Of Operations, Nature Of Production Process. This is a completely customizable PowerPoint theme that can be put to use immediately. So, download it and address the topic impactfully.
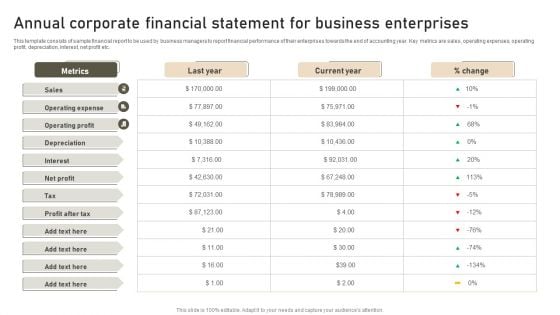
Annual Corporate Financial Statement For Business Enterprises Designs PDF
This template consists of sample financial report to be used by business managers to report financial performance of their enterprises towards the end of accounting year. Key metrics are sales, operating expenses, operating profit, depreciation, interest, net profit etc. Showcasing this set of slides titled Annual Corporate Financial Statement For Business Enterprises Designs PDF. The topics addressed in these templates are Operating Expense, Operating Profit, Depreciation. All the content presented in this PPT design is completely editable. Download it and make adjustments in color, background, font etc. as per your unique business setting.
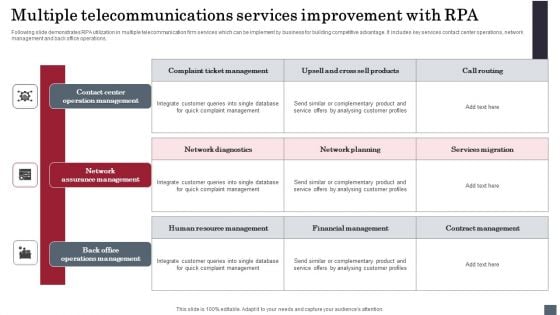
Multiple Telecommunications Services Improvement With RPA Elements PDF
Following slide demonstrates RPA utilization in multiple telecommunication firm services which can be implement by business for building competitive advantage. It includes key services contact center operations, network management and back office operations. Presenting Multiple Telecommunications Services Improvement With RPA Elements PDF to dispense important information. This template comprises three stages. It also presents valuable insights into the topics including Contact Center Operation, Network Assurance Management, Back Office Operations. This is a completely customizable PowerPoint theme that can be put to use immediately. So, download it and address the topic impactfully.
Monthly Financial Performance Outcome Reporting Icons PDF
This slide showcases a report showing monthly results financial performance to ensure constant revenue growth. It includes key components such as gross profit margin, operating expenses ratio, operating profit margin, net profit margin, earning before interest and taxes, etc. Showcasing this set of slides titled Monthly Financial Performance Outcome Reporting Icons PDF. The topics addressed in these templates are Operating Expenses, Income Statement, Operating Expenses Ratio. All the content presented in this PPT design is completely editable. Download it and make adjustments in color, background, font etc. as per your unique business setting.
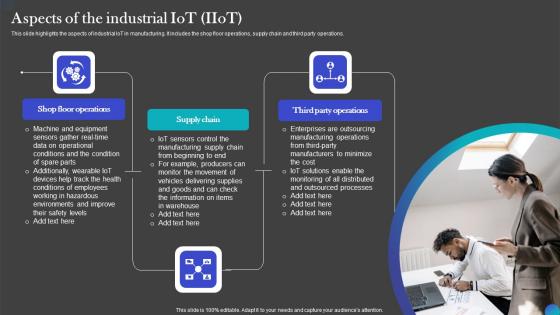
Aspects Of The Industrial IOT Adoption Manufacturing Summary PDF
This slide highlights the aspects of industrial IoT in manufacturing. It includes the shop floor operations, supply chain and third party operations. Find a pre-designed and impeccable Aspects Of The Industrial IOT Adoption Manufacturing Summary PDF. The templates can ace your presentation without additional effort. You can download these easy-to-edit presentation templates to make your presentation stand out from others. So, what are you waiting for Download the template from Slidegeeks today and give a unique touch to your presentation. This slide highlights the aspects of industrial IoT in manufacturing. It includes the shop floor operations, supply chain and third party operations.
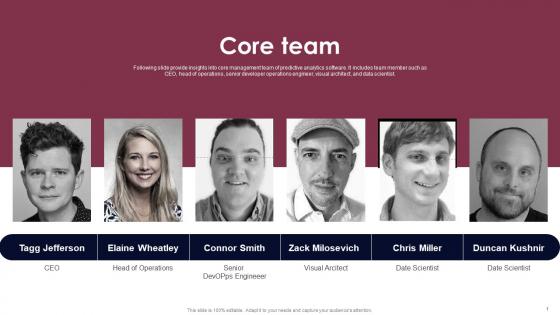
Core Team Smart Grid Analytics Investor Fund Raising Microsoft PDF
Following slide provide insights into core management team of predictive analytics software. It includes team member such as CEO, head of operations, senior developer operations engineer, visual architect, and data scientist. There are so many reasons you need a Core Team Smart Grid Analytics Investor Fund Raising Microsoft PDF. The first reason is you can not spend time making everything from scratch, Thus, Slidegeeks has made presentation templates for you too. You can easily download these templates from our website easily. Following slide provide insights into core management team of predictive analytics software. It includes team member such as CEO, head of operations, senior developer operations engineer, visual architect, and data scientist.
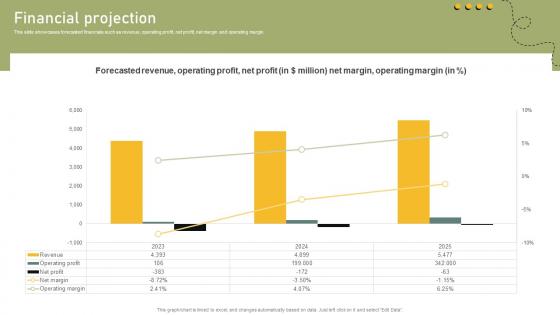
Financial Projection Shared Transportation Platform Business Model BMC SS V
This slide showcases forecasted financials such as revenue, operating profit, net profit, net margin and operating margin. There are so many reasons you need a Financial Projection Shared Transportation Platform Business Model BMC SS V. The first reason is you can not spend time making everything from scratch, Thus, Slidegeeks has made presentation templates for you too. You can easily download these templates from our website easily. This slide showcases forecasted financials such as revenue, operating profit, net profit, net margin and operating margin.

Business Unit 3 Home Care Home Care Solutions Company Profile CP SS V
This slide represents financial overview of Unilever business unit home care. It covers turnover, operating margin, turnover growth, underlying sales growth, and underlying operating margin.There are so many reasons you need a Business Unit 3 Home Care Home Care Solutions Company Profile CP SS V. The first reason is you can not spend time making everything from scratch, Thus, Slidegeeks has made presentation templates for you too. You can easily download these templates from our website easily. This slide represents financial overview of Unilever business unit home care. It covers turnover, operating margin, turnover growth, underlying sales growth, and underlying operating margin.
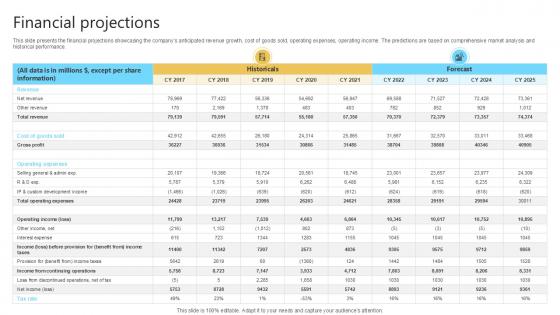
Financial Projections Cloud Computing Services Business Model PPT Template BMC SS V
This slide presents the financial projections showcasing the companys anticipated revenue growth, cost of goods sold, operating expenses, operating income. The predictions are based on comprehensive market analysis and historical performance. There are so many reasons you need a Financial Projections Cloud Computing Services Business Model PPT Template. The first reason is you can not spend time making everything from scratch, Thus, Slidegeeks has made presentation templates for you too. You can easily download these templates from our website easily. This slide presents the financial projections showcasing the companys anticipated revenue growth, cost of goods sold, operating expenses, operating income. The predictions are based on comprehensive market analysis and historical performance.
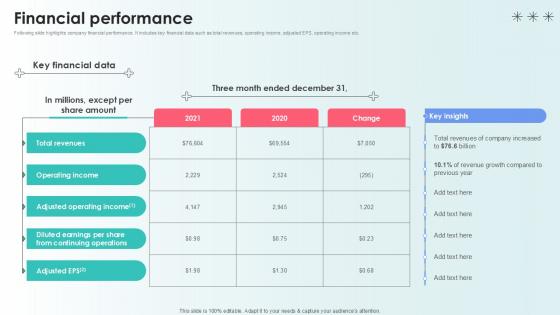
Financial Performance Capital Raising Pitch Deck For Health Care Services Ppt Slide
Following slide highlights company financial performance. It includes key financial data such as total revenues, operating income, adjusted EPS, operating income etc. From laying roadmaps to briefing everything in detail, our templates are perfect for you. You can set the stage with your presentation slides. All you have to do is download these easy-to-edit and customizable templates. Financial Performance Capital Raising Pitch Deck For Health Care Services Ppt Slide will help you deliver an outstanding performance that everyone would remember and praise you for. Do download this presentation today. Following slide highlights company financial performance. It includes key financial data such as total revenues, operating income, adjusted EPS, operating income etc.
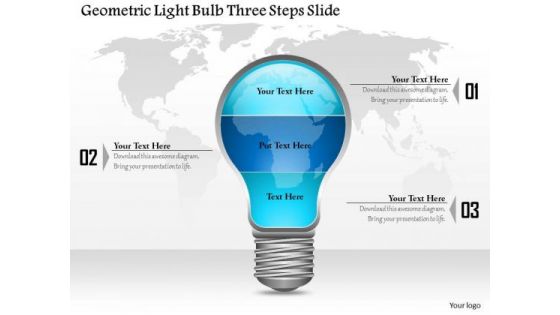
Business Diagram Geometric Light Bulb Three Steps Slide Presentation Template
This business plan PPT slide has been crafted with graphic of geometric light bulbs. These bulbs are making six stages for displaying linear process flow for any management operation. Use this PPT for business strategy and management operation in any presentations.
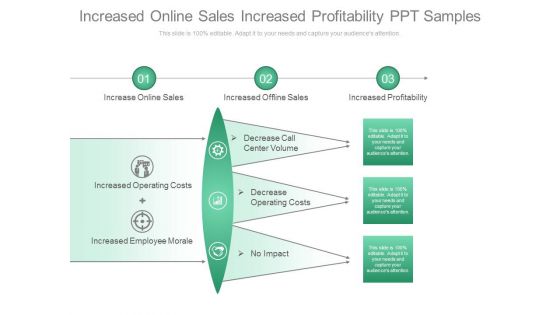
Increased Online Sales Increased Profitability Ppt Samples
This is a increased online sales increased profitability ppt samples. This is a three stage process. The stages in this process are increased online sales, increased profitability, increase offline sales, increased operating costs, increased employee morale, decrease call center volume, decrease operating costs, no impact.
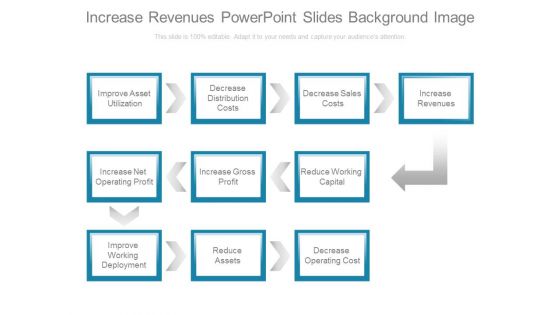
Increase Revenues Powerpoint Slides Background Image
This is an increase revenues powerpoint slides background image. This is a one stage process. The stages in this process are improve asset utilization, decrease distribution costs, decrease sales costs, increase revenues, increase net operating profit, increase gross profit, reduce working capital, improve working deployment, reduce assets, decrease operating cost.

Decrease Sales Costs Powerpoint Slides Designs
This is a decrease sales costs powerpoint slides designs. This is a nine stage process. The stages in this process are decrease sales costs, decrease distribution costs, improve asset utilization, reduce working capital, increase gross profit, increase net operating profit, decrease operating cost, reduce assets, improve working deployment.
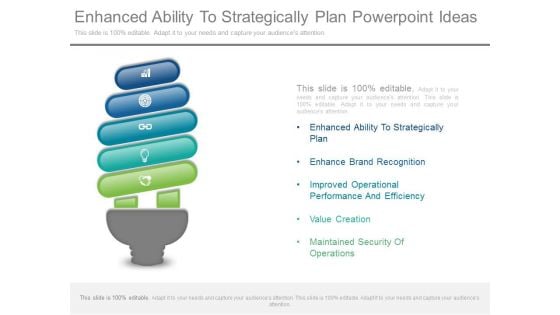
Enhanced Ability To Strategically Plan Powerpoint Ideas
This is a enhanced ability to strategically plan powerpoint ideas. This is a five stage process. The stages in this process are enhanced ability to strategically plan, enhance brand recognition, improved operational performance and efficiency, value creation, maintained security of operations.
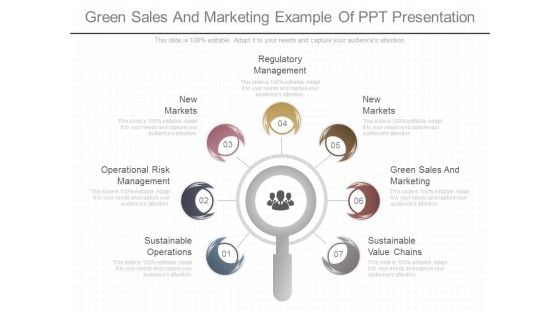
Green Sales And Marketing Example Of Ppt Presentation
This is a green sales and marketing example of ppt presentation. This is a seven stage process. The stages in this process are sustainable operations, operational risk management, markets new, regulatory management, markets markets new, green sales and marketing, sustainable value chains.
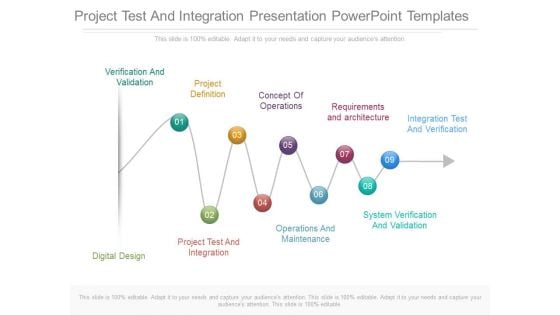
Project Test And Integration Presentation Powerpoint Templates
This is a project test and integration presentation powerpoint templates. This is a nine stage process. The stages in this process are verification and validation, digital design, project test and integration, project definition, concept of operations, requirements and architecture, operations and maintenance, system verification and validation, integration test and verification.
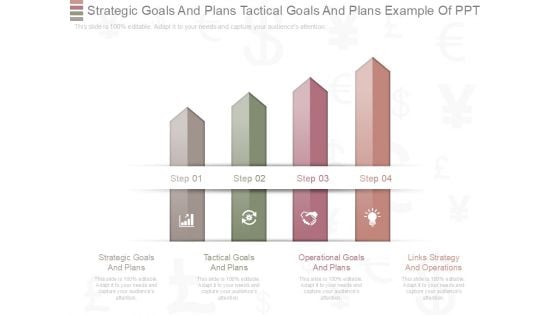
Strategic Goals And Plans Tactical Goals And Plans Example Of Ppt
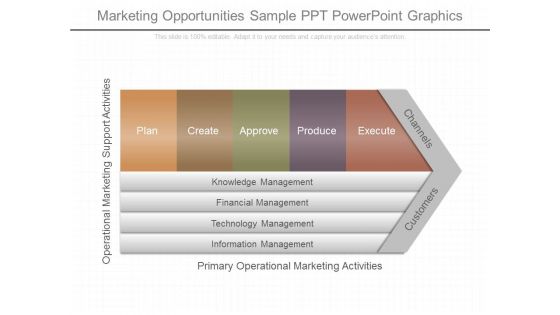
Marketing Opportunities Sample Ppt Powerpoint Graphics
This is a marketing opportunities sample ppt powerpoint graphics. This is a five stage process. The stages in this process are operational marketing support activities, plan, create, approve, produce, execute, knowledge management, financial management, technology management, information management, primary operational marketing activities, channels, customers.
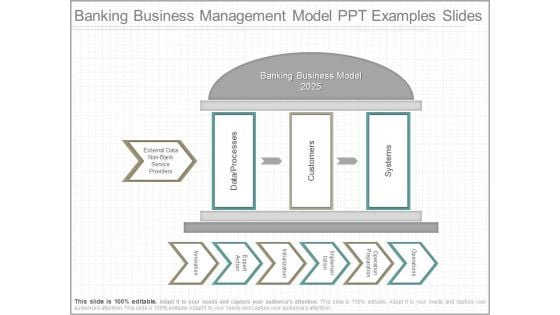
Banking Business Management Model Ppt Examples Slides
This is a banking business management model ppt examples slides. This is a ten stage process. The stages in this process are banking business model 2025, external data non bank service providers, data processes, customers, systems, innovation, expert action, initialization, implementation, operation preparation, operations.
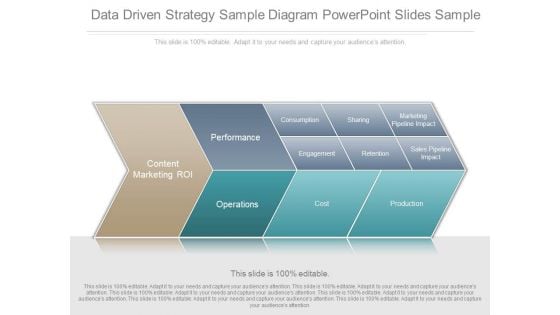
Data Driven Strategy Sample Diagram Powerpoint Slides Sample
This is a data driven strategy sample diagram powerpoint slides sample. This is a five stage process. The stages in this process are content marketing roi, performance, operations, consumption, sharing, marketing pipeline impact, engagement, retention, sales pipeline impact, operations, cost, production.
Marketing And Offer Management Sample Presentations
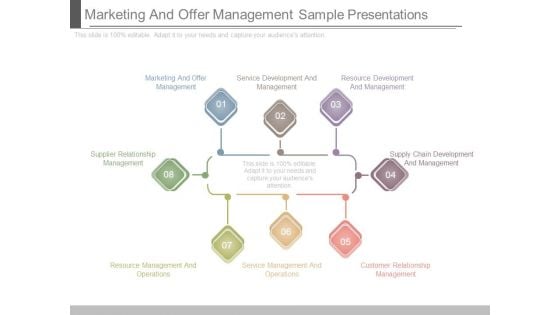
This is a marketing and offer management sample presentations. This is a eight stage process. The stages in this process are marketing and offer management, service development and management, resource development and management, supply chain development and management, customer relationship management, service management and operations, resource management and operations, supplier relationship management.

Marketing And Offer Management Ppt Sample File
This is a marketing and offer management ppt sample file. This is a six stage process. The stages in this process are marketing and offer management, supply chain development management, resource management and operations, resource development and management, service development and management, service management and operations.
Asset Management Process Example Ppt Example Presentations
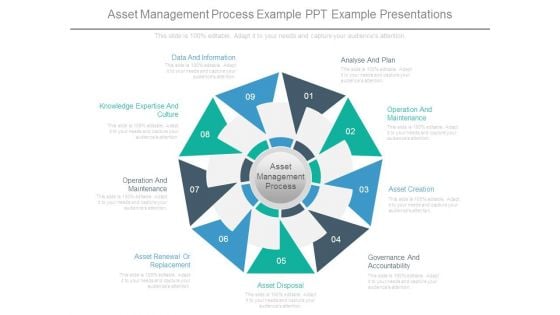
This is a asset management process example ppt example presentations. This is a nine stage process. The stages in this process are data and information, analyse and plan, operation and maintenance, asset creation, governance and accountability, asset disposal, asset renewal or replacement, operation and maintenance, knowledge expertise and culture, asset management process.
Project Management Vs Product Management Diagram Powerpoint Layout
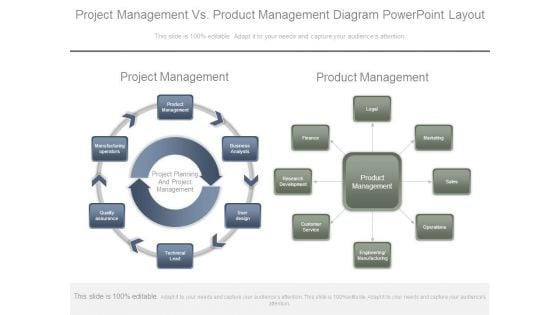
This is a project management vs product management diagram powerpoint layout. This is a two stage process. The stages in this process are project management, product management, manufacturing operators, project planning and project management, quality assurance, technical lead, user design, business analysts, legal, finance, marketing, research development, customer service, engineering manufacturing, operations, sales.

Best Practices Of Value Stream Mapping Diagram Ppt Sample
This is a best practices of value stream mapping diagram ppt sample. This is a six stage process. The stages in this process are color code the operation, red yellow green, add cycle time wait time travel time quantities yield inventory machine operators required, always collect current state, map future state, involve management team.

Financials Stretch Plan Kpi Analysis Powerpoint Slide Show
This is a financials stretch plan kpi analysis powerpoint slide show. This is a five stage process. The stages in this process are kpi1, kpi1, kpi3, revenue, cost of sales, gross profit, customer acquisition cost, other operating cost expense, operating profit, change in cash, ending cash, employees ftes.
Financials Summary With Kpi Base Plan Vs Stretch Plan Powerpoint Slides
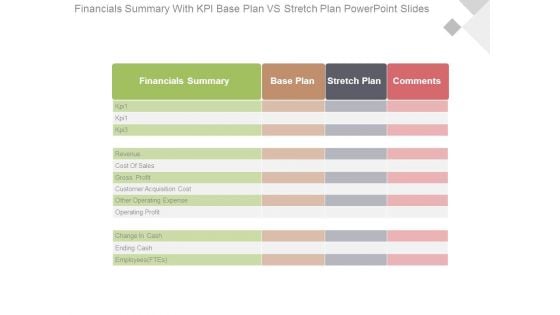
This is a financials summary with kpi base plan vs stretch plan powerpoint slides. This is a four stage process. The stages in this process are financials summary, base plan, stretch plan, comments, kpi 1, kpi 3, revenue, cost of sales, gross profit, customer acquisition cost, other operating expense, operating profit, change in cash, ending cash, employees ftes.
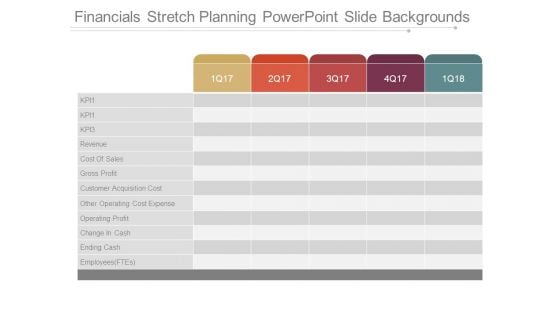
Financials Stretch Planning Powerpoint Slide Backgrounds
This is a financials stretch planning powerpoint slide backgrounds. This is a five stage process. The stages in this process are kp, revenue, cost of sales, gross profit, customer acquisition cost, other operating cost expense, operating profit, change in cash, ending cash, employees ftes.
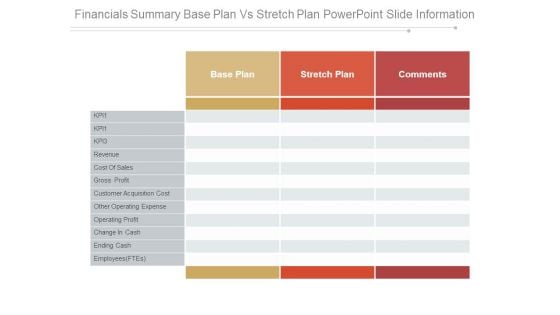
Financials Summary Base Plan Vs Stretch Plan Powerpoint Slide Information
This is a financials summary base plan vs stretch plan powerpoint slide information. This is a three stage process. The stages in this process are base plan, stretch plan, comments, kp, revenue, cost of sales, gross profit, customer acquisition cost, other operating expense, operating profit, change in cash, ending cash, employees ftes.
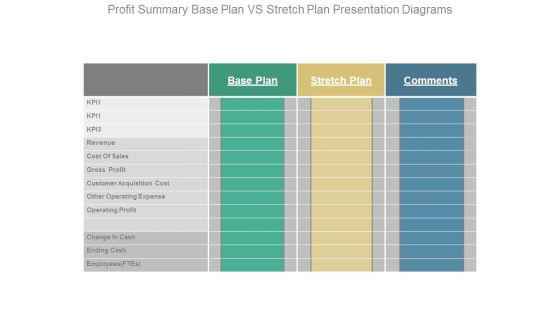
Profit Summary Base Plan Vs Stretch Plan Presentation Diagrams
This is a profit summary base plan vs stretch plan presentation diagrams. This is a three stage process. The stages in this process are base plan, stretch plan, comments, kpi, cost of sales, revenue, gross profit, customer acquisition cost, other operating expense, operating profit, change in cash, ending cash, employees ftes.

Financials Base Plan Table Chart Ppt Slide Templates
This is a financials base plan table chart ppt slide templates. This is a five stage process. The stages in this process are kpi, revenue, cost of sales, gross profit, customer acquisition cost, other operating cost expense, operating profit, change in cash, ending cash, employees ftes.
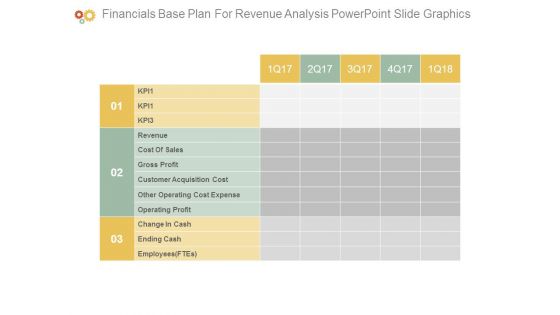
Financials Base Plan For Revenue Analysis Powerpoint Slide Graphics
This is a financials base plan for revenue analysis powerpoint slide graphics. This is a three stage process. The stages in this process are kp, revenue, cost of sales, gross profit, customer acquisition cost, other operating cost expense, operating profit, change in cash, ending cash, employees ftes.
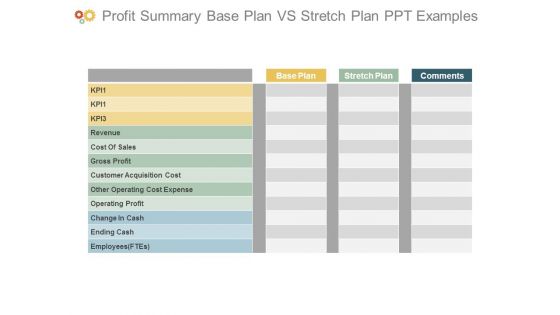
Profit Summary Base Plan Vs Stretch Plan Ppt Examples
This is a profit summary base plan vs stretch plan ppt examples. This is a three stage process. The stages in this process are base plan, kp, revenue, stretch plan, comments, cost of sales, gross profit, customer acquisition cost, other operating cost expense, operating profit, change in cash, ending cash, employees ftes.
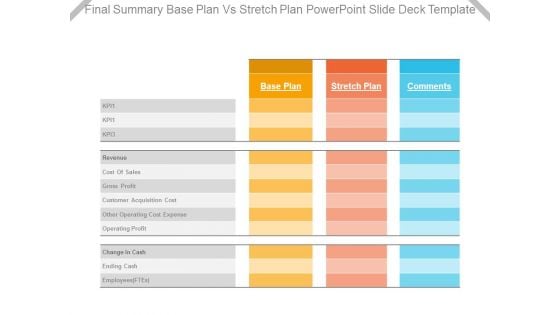
Final Summary Base Plan Vs Stretch Plan Powerpoint Slide Deck Template
This is a final summary base plan vs stretch plan powerpoint slide deck template. This is a three stage process. The stages in this process are kpi, revenue, cost of sales, gross profit, customer acquisition cost, other operating cost expense, operating profit, change in cash, ending cash, employees ftes.
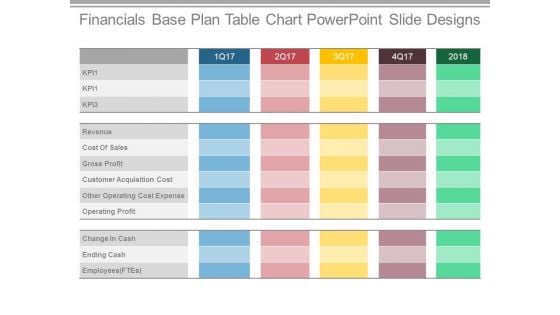
Financials Base Plan Table Chart Powerpoint Slide Designs
This is a financials base plan table chart powerpoint slide designs. This is a five stage process. The stages in this process are revenue, cost of sales, gross profit, customer acquisition cost, other operating cost expense, operating profit, change in cash, ending cash.
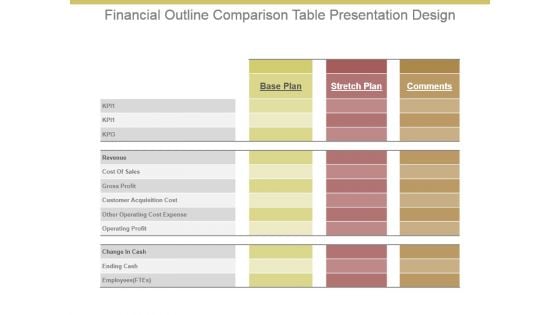
Financial Outline Comparison Table Presentation Design
This is a financial outline comparison table presentation design. This is a three stage process. The stages in this process are base plan, stretch plan, comments, kp, revenue, cost of sales, gross profit, customer acquisition cost, other operating cost expense, operating profit, change in cash, ending cash, employees ftes.
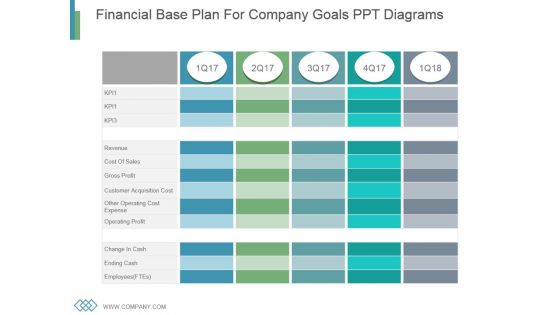
Financial Base Plan For Company Goals Ppt Diagrams
This is a financial base plan for company goals ppt diagrams. This is a five stage process. The stages in this process are revenue, cost of sales, gross profit, customer acquisition cost, other operating cost expense, operating profit, change in cash, ending cash, employees.
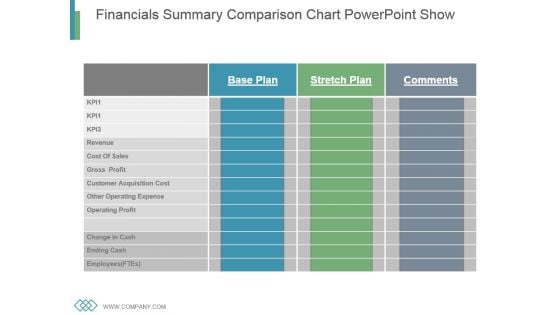
Financials Summary Comparison Chart Powerpoint Show
This is a financials summary comparison chart powerpoint show. This is a three stage process. The stages in this process are revenue, cost of sales, gross profit, customer acquisition cost, other operating cost expense, operating profit, change in cash, ending cash, employees.
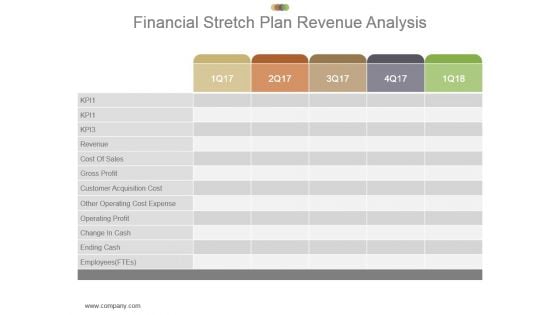
Financial Stretch Plan Revenue Analysis Powerpoint Guide
This is a financial stretch plan revenue analysis powerpoint guide. This is a five stage process. The stages in this process are employees, ending cash, change in cash, operating profit, other operating cost expense, customer acquisition cost, gross profit, cost of sales, revenue.

Financial Summary Analysis Table Powerpoint Slide Designs
This is a financial summary analysis table powerpoint slide designs. This is a three stage process. The stages in this process are employees, ending cash, change in cash, operating profit, other operating cost expense, customer acquisition cost, gross profit, cost of sales, revenue, base plan, stretch plan, comments.
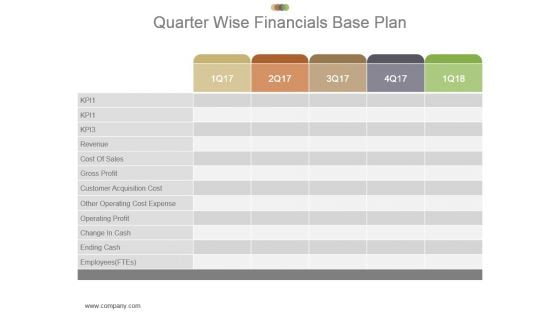
Quarter Wise Financials Base Plan Powerpoint Slide Show
This is a quarter wise financials base plan powerpoint slide show. This is a five stage process. The stages in this process are employees, ending cash, change in cash, operating profit, other operating cost expense, customer acquisition cost, gross profit, cost of sales, revenue.

Financial Statement Competitive Analysis Ppt Slides
This is a financial statement competitive analysis ppt slides. This is a three stage process. The stages in this process are employees, ending cash, change in cash, operating profit, other operating cost expense, customer acquisition cost, gross profit, cost of sales, revenue.

Financials Base Plan Table Powerpoint Slide Backgrounds
This is a financials base plan table powerpoint slide backgrounds. This is a three stage process. The stages in this process are employees, ending cash, change in cash, operating profit, other operating cost expense, customer acquisition cost, gross profit, cost of sales, revenue.
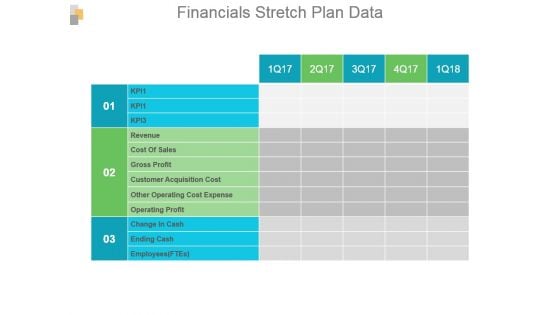
Financials Stretch Plan Data Powerpoint Slide Backgrounds
This is a financials stretch plan data powerpoint slide backgrounds. This is a three stage process. The stages in this process are employees, ending cash, change in cash, operating profit, other operating cost expense, customer acquisition cost, gross profit, cost of sales, revenue.
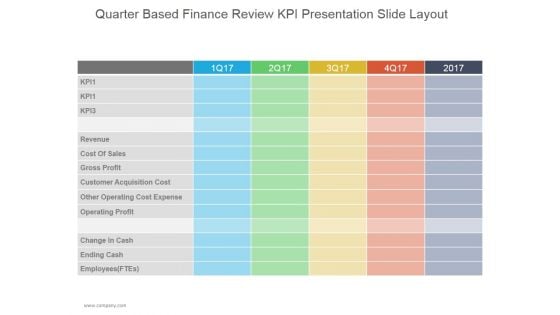
Quarter Based Finance Review Kpi Ppt PowerPoint Presentation Background Designs
This is a quarter based finance review kpi ppt powerpoint presentation background designs. This is a five stage process. The stages in this process are cost of sales, gross profit, customer acquisition cost, other operating cost expense, operating profit, change in cash, ending cash.
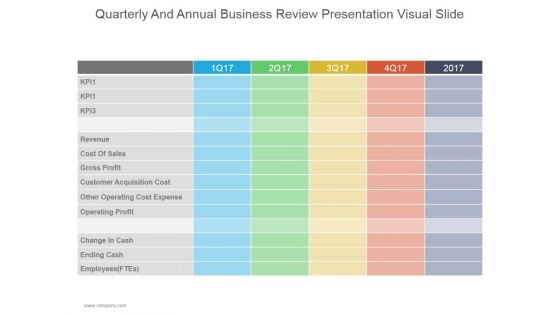
Quarterly And Annual Business Review Ppt PowerPoint Presentation Graphics
This is a quarterly and annual business review ppt powerpoint presentation graphics. This is a five stage process. The stages in this process are cost of sales, gross profit, customer acquisition cost, other operating cost expense, operating profit, change in cash, ending cash.
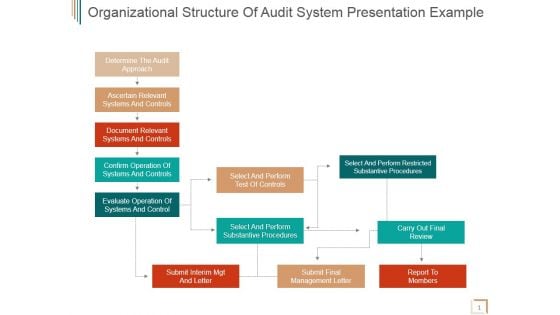
Organizational Structure Of Audit System Ppt PowerPoint Presentation Samples
This is a organizational structure of audit system ppt powerpoint presentation samples. This is a twelve stage process. The stages in this process are determine the audit approach, ascertain relevant systems and controls, document relevant systems and controls, confirm operation of systems and controls, evaluate operation of systems and control, submit interim mgt and letter.
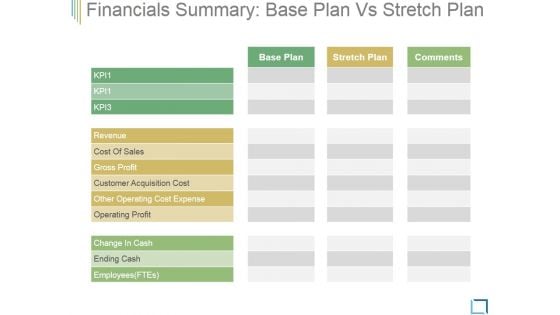
Financials Summary Base Plan Vs Stretch Plan Ppt PowerPoint Presentation Visuals
This is a financials summary base plan vs stretch plan ppt powerpoint presentation visuals. This is a three stage process. The stages in this process are revenue, cost of sales, gross profit, customer acquisition cost, other operating cost expense, operating profit, change in cash.
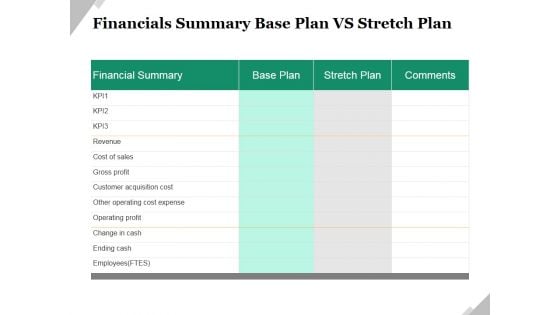
Financials Summary Base Plan Vs Stretch Plan Ppt PowerPoint Presentation Slides Information
This is a financials summary base plan vs stretch plan ppt powerpoint presentation slides information. This is a two stage process. The stages in this process are revenue, cost of sales, gross profit, customer acquisition cost, other operating cost expense, operating profit.
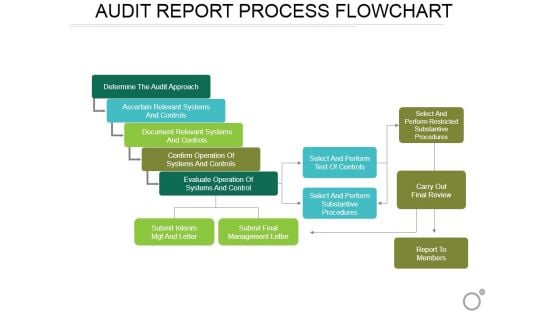
Audit Report Process Flowchart Ppt PowerPoint Presentation Layouts Microsoft
This is a audit report process flowchart ppt powerpoint presentation layouts microsoft. This is a four stage process. The stages in this process are determine the audit approach, ascertain relevant systems and controls, document relevant systems and controls, confirm operation of systems and controls, evaluate operation of systems and control, submit interim mgt and letter.
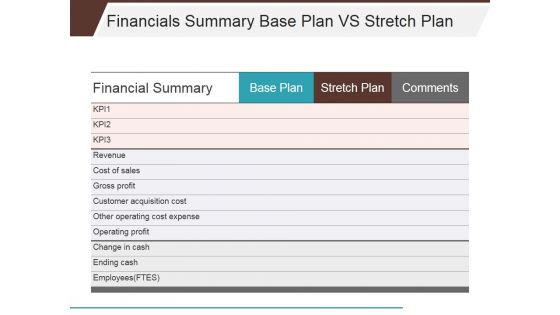
Financials Summary Base Plan Vs Stretch Plan Ppt PowerPoint Presentation Infographics Themes
This is a financials summary base plan vs stretch plan ppt powerpoint presentation infographics themes. This is a three stage process. The stages in this process are revenue, cost of sales, gross profit, customer acquisition cost, other operating cost expense, operating profit.
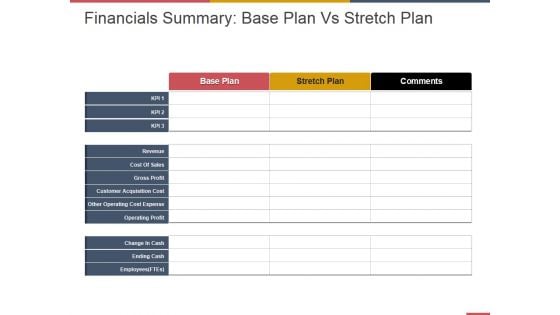
Financials Summary Base Plan Vs Stretch Plan Ppt PowerPoint Presentation Layouts Graphic Tips
This is a financials summary base plan vs stretch plan ppt powerpoint presentation layouts graphic tips. This is a three stage process. The stages in this process are cost of sales, gross profit, customer acquisition cost, other operating cost expense, operating profit.
Machine Learning Vector Icon Ppt PowerPoint Presentation Professional Show
Presenting this set of slides with name machine learning vector icon ppt powerpoint presentation professional show. The topics discussed in these slides are operating model icon, product management, technical operations. This is a completely editable PowerPoint presentation and is available for immediate download. Download now and impress your audience.
Process Automation Vector Icon Ppt PowerPoint Presentation Slides Diagrams
Presenting this set of slides with name process automation vector icon ppt powerpoint presentation slides diagrams. This is a one stage process. The stages in this process are operating model icon, product management, technical operations. This is a completely editable PowerPoint presentation and is available for immediate download. Download now and impress your audience.
Product Management Vector Icon Ppt PowerPoint Presentation Gallery Themes
Presenting this set of slides with name product management vector icon ppt powerpoint presentation gallery themes. The topics discussed in these slides are operating model icon, product management, technical operations. This is a completely editable PowerPoint presentation and is available for immediate download. Download now and impress your audience.


 Continue with Email

 Home
Home


