Daily Plan

Transforming Manufacturing With Automation Industrial Robot Shipment Prediction Topics PDF
This slide represents the industrial robot shipment prediction for the 3rd and 2nd editions from 2018 to 2024. It also shows the impact of the Covid-19 pandemic on the IIoT industry during 2019 and 2020, but the market is stable now. Want to ace your presentation in front of a live audience Our Transforming Manufacturing With Automation Industrial Robot Shipment Prediction Topics PDF can help you do that by engaging all the users towards you. Slidegeeks experts have put their efforts and expertise into creating these impeccable powerpoint presentations so that you can communicate your ideas clearly. Moreover, all the templates are customizable, and easy to edit and downloadable. Use these for both personal and commercial use.
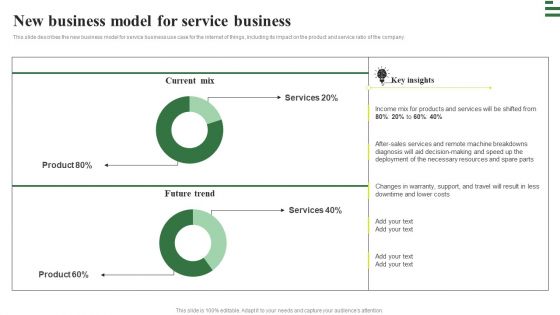
Transforming Manufacturing With Automation New Business Model For Service Formats PDF
This slide describes the new business model for service business use case for the internet of things, including its impact on the product and service ratio of the company. There are so many reasons you need a Transforming Manufacturing With Automation New Business Model For Service Formats PDF. The first reason is you cannot spend time making everything from scratch, Thus, Slidegeeks has made presentation templates for you too. You can easily download these templates from our website easily.
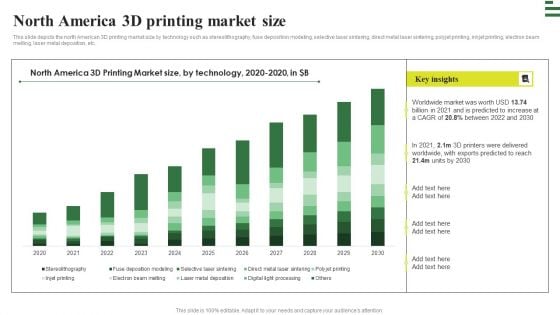
Transforming Manufacturing With Automation North America 3D Printing Market Size Portrait PDF
This slide depicts the north American 3D printing market size by technology such as stereolithography, fuse deposition modeling, selective laser sintering, direct metal laser sintering, polyjet printing, inkjet printing, electron beam melting, laser metal deposition, etc. Do you have to make sure that everyone on your team knows about any specific topic I yes, then you should give Transforming Manufacturing With Automation North America 3D Printing Market Size Portrait PDF a try. Our experts have put a lot of knowledge and effort into creating this impeccable Transforming Manufacturing With Automation North America 3D Printing Market Size Portrait PDF. You can use this template for your upcoming presentations, as the slides are perfect to represent even the tiniest detail. You can download these templates from the Slidegeeks website and these are easy to edit. So grab these today.
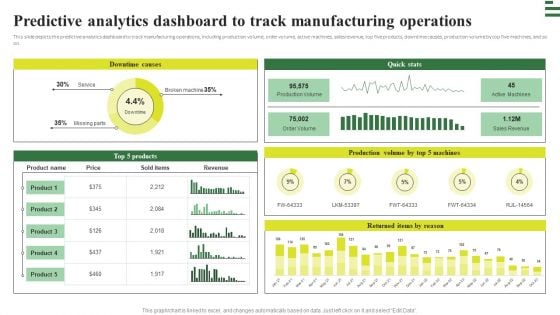
Transforming Manufacturing With Automation Predictive Analytics Dashboard To Track Diagrams PDF
This slide depicts the predictive analytics dashboard to track manufacturing operations, including production volume, order volume, active machines, sales revenue, top five products, downtime causes, production volume by top five machines, and so on. Get a simple yet stunning designed Transforming Manufacturing With Automation Predictive Analytics Dashboard To Track Diagrams PDF. It is the best one to establish the tone in your meetings. It is an excellent way to make your presentations highly effective. So, download this PPT today from Slidegeeks and see the positive impacts. Our easy to edit Transforming Manufacturing With Automation Predictive Analytics Dashboard To Track Diagrams PDF can be your go to option for all upcoming conferences and meetings. So, what are you waiting for Grab this template today.
Allocating Budget For Performance Marketing Activities Icons PDF
This slide showcases budget allocation for performance marketing activities to run online promotional campaigns. Its key elements are Facebook ads, Instagram ads, Google display ads, YouTube ads etc. This modern and well-arranged Allocating Budget For Performance Marketing Activities Icons PDF provides lots of creative possibilities. It is very simple to customize and edit with the Powerpoint Software. Just drag and drop your pictures into the shapes. All facets of this template can be edited with Powerpoint, no extra software is necessary. Add your own material, put your images in the places assigned for them, adjust the colors, and then you can show your slides to the world, with an animated slide included.
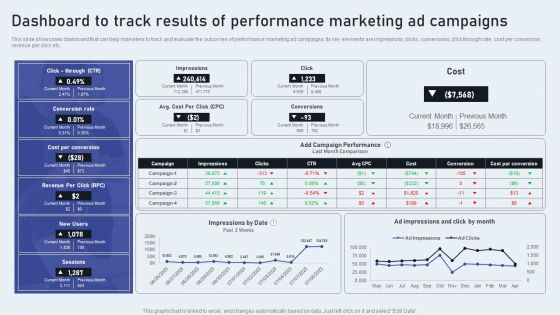
Dashboard To Track Results Of Performance Marketing Ad Campaigns Formats PDF
This slide showcases dashboard that can help marketers to track and evaluate the outcomes of performance marketing ad campaigns. Its key elements are impressions, clicks, conversions, click through rate, cost per conversion, revenue per click etc. Retrieve professionally designed Dashboard To Track Results Of Performance Marketing Ad Campaigns Formats PDF to effectively convey your message and captivate your listeners. Save time by selecting pre-made slideshows that are appropriate for various topics, from business to educational purposes. These themes come in many different styles, from creative to corporate, and all of them are easily adjustable and can be edited quickly. Access them as PowerPoint templates or as Google Slides themes. You do not have to go on a hunt for the perfect presentation because Slidegeeks got you covered from everywhere.
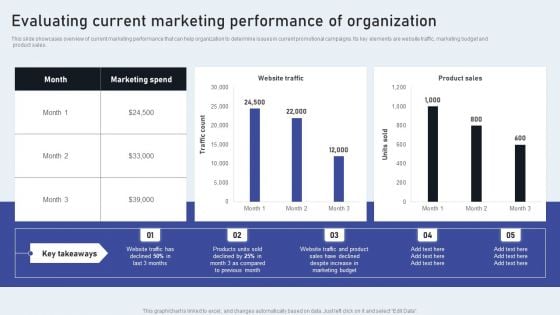
Evaluating Current Marketing Performance Of Organization Rules PDF
This slide showcases overview of current marketing performance that can help organization to determine issues in current promotional campaigns. Its key elements are website traffic, marketing budget and product sales. This Evaluating Current Marketing Performance Of Organization Rules PDF from Slidegeeks makes it easy to present information on your topic with precision. It provides customization options, so you can make changes to the colors, design, graphics, or any other component to create a unique layout. It is also available for immediate download, so you can begin using it right away. Slidegeeks has done good research to ensure that you have everything you need to make your presentation stand out. Make a name out there for a brilliant performance.
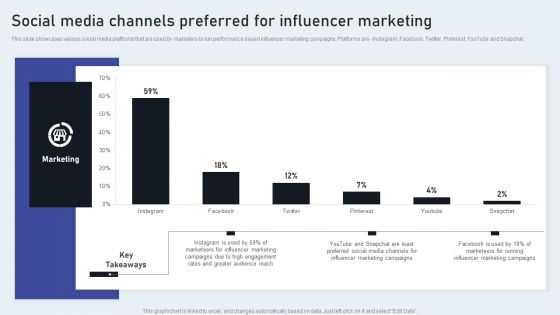
Social Media Channels Preferred For Influencer Marketing Graphics PDF
This slide showcases various social media platforms that are used by marketers to run performance based influencer marketing campaigns. Platforms are - Instagram, Facebook, Twitter, Pinterest, YouTube and Snapchat. This Social Media Channels Preferred For Influencer Marketing Graphics PDF is perfect for any presentation, be it in front of clients or colleagues. It is a versatile and stylish solution for organizing your meetings. The Social Media Channels Preferred For Influencer Marketing Graphics PDF features a modern design for your presentation meetings. The adjustable and customizable slides provide unlimited possibilities for acing up your presentation. Slidegeeks has done all the homework before launching the product for you. So, do not wait, grab the presentation templates today
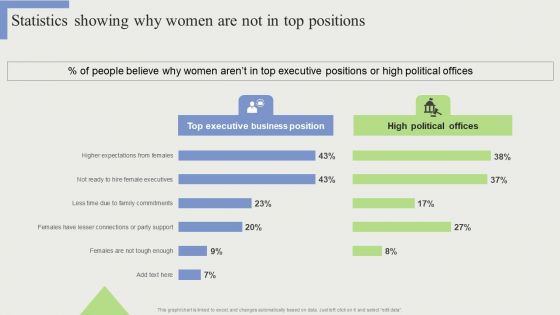
Statistics Showing Why Women Are Not In Top Positions Formats PDF
There are so many reasons you need a Statistics Showing Why Women Are Not In Top Positions Formats PDF. The first reason is you can not spend time making everything from scratch, Thus, Slidegeeks has made presentation templates for you too. You can easily download these templates from our website easily.
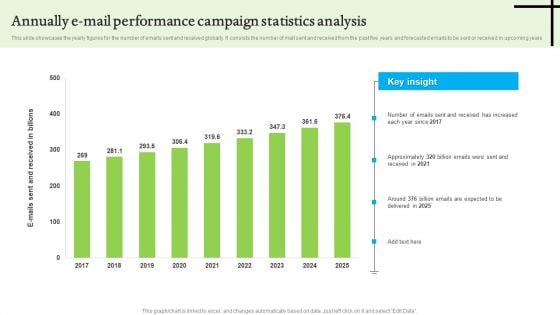
Annually E Mail Performance Campaign Statistics Analysis Infographics PDF
This slide showcases the yearly figures for the number of emails sent and received globally. It consists the number of mail sent and received from the past five years and forecasted emails to be sent or received in upcoming years. Showcasing this set of slides titled Annually E Mail Performance Campaign Statistics Analysis Infographics PDF. The topics addressed in these templates are Annually E Mail Performance, Campaign Statistics Analysis. All the content presented in this PPT design is completely editable. Download it and make adjustments in color, background, font etc. as per your unique business setting.
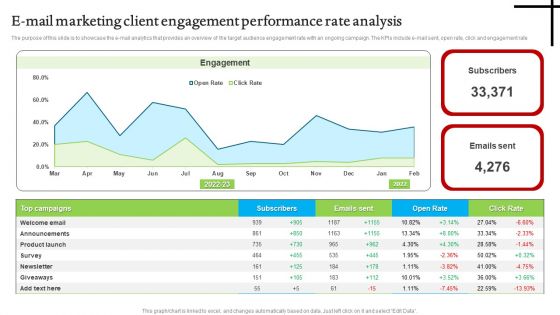
E Mail Marketing Client Engagement Performance Rate Analysis Ideas PDF
The purpose of this slide is to showcase the e-mail analytics that provides an overview of the target audience engagement rate with an ongoing campaign. The KPIs include e-mail sent, open rate, click and engagement rate. Showcasing this set of slides titled E Mail Marketing Client Engagement Performance Rate Analysis Ideas PDF. The topics addressed in these templates are E Mail Marketing, Client Engagement Performance, Rate Analysis. All the content presented in this PPT design is completely editable. Download it and make adjustments in color, background, font etc. as per your unique business setting.
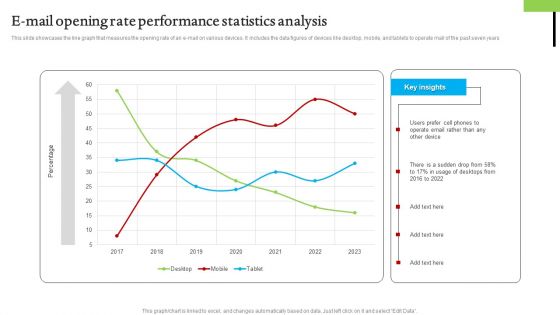
E Mail Opening Rate Performance Statistics Analysis Mockup PDF
This slide showcases the line graph that measures the opening rate of an e-mail on various devices. It includes the data figures of devices like desktop, mobile, and tablets to operate mail of the past seven years. Showcasing this set of slides titled E Mail Opening Rate Performance Statistics Analysis Mockup PDF. The topics addressed in these templates are E Mail Opening Rate, Performance Statistics Analysis. All the content presented in this PPT design is completely editable. Download it and make adjustments in color, background, font etc. as per your unique business setting.
E Mail Performance Analytics Metrics Tracking Report Analysis Demonstration PDF
The purpose of this slide is to showcase an e-mail analytics mechanism in order to track the performance of certain e-mail marketing based on various metrics. Certain KPIs include open rate, click rate, unsubscribe rate etc. Pitch your topic with ease and precision using this E Mail Performance Analytics Metrics Tracking Report Analysis Demonstration PDF. This layout presents information on E Mail Performance Analytics, Metrics Tracking Report Analysis. It is also available for immediate download and adjustment. So, changes can be made in the color, design, graphics or any other component to create a unique layout.
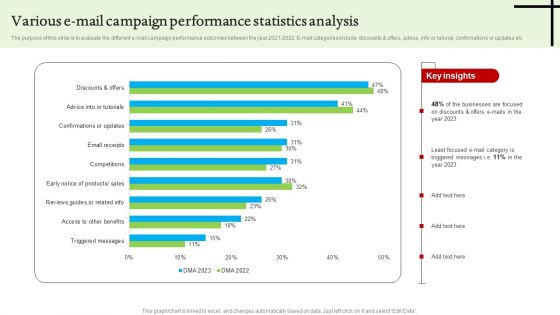
Various E Mail Campaign Performance Statistics Analysis Graphics PDF
The purpose of this slide is to evaluate the different e-mail campaign performance outcomes between the year 2021-2022. E-mail categories include discounts and offers, advice, info or tutorial, confirmations or updates etc. Showcasing this set of slides titled Various E Mail Campaign Performance Statistics Analysis Graphics PDF. The topics addressed in these templates are Various E Mail Campaign, Performance Statistics Analysis. All the content presented in this PPT design is completely editable. Download it and make adjustments in color, background, font etc. as per your unique business setting.
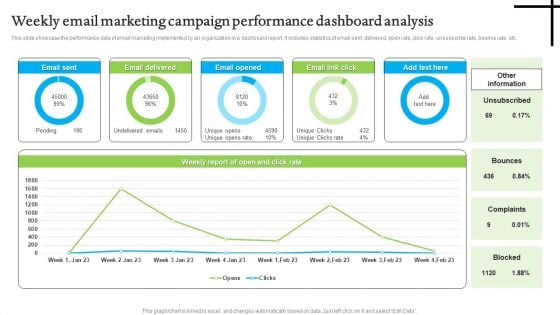
Weekly Email Marketing Campaign Performance Dashboard Analysis Structure PDF
This slide showcase the performance data of email marketing implemented by an organization in a dashboard report. It includes statistics of email sent, delivered, open rate, click rate, unsubscribe rate, bounce rate, etc. Pitch your topic with ease and precision using this Weekly Email Marketing Campaign Performance Dashboard Analysis Structure PDF. This layout presents information on Weekly Email Marketing, Campaign Performance Dashboard Analysis. It is also available for immediate download and adjustment. So, changes can be made in the color, design, graphics or any other component to create a unique layout.
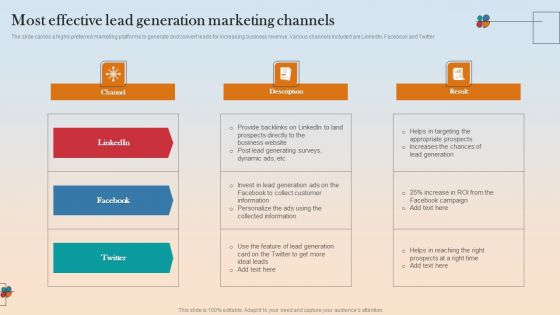
Most Effective Lead Generation Marketing Channels Designs PDF
The slide carries a highly preferred marketing platforms to generate and convert leads for increasing business revenue. Various channels included are LinkedIn, Facebook and Twitter. Showcasing this set of slides titled Most Effective Lead Generation Marketing Channels Designs PDF. The topics addressed in these templates are Lead Generating Surveys, Collected Information, Facebook Campaign. All the content presented in this PPT design is completely editable. Download it and make adjustments in color, background, font etc. as per your unique business setting.
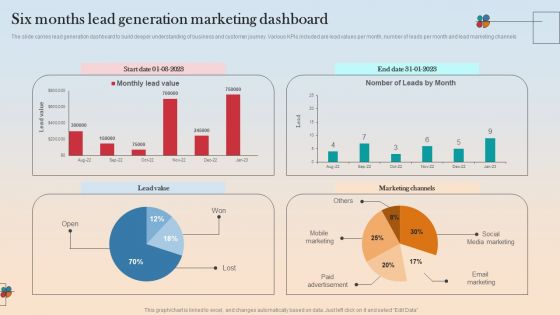
Six Months Lead Generation Marketing Dashboard Inspiration PDF
The slide carries lead generation dashboard to build deeper understanding of business and customer journey. Various KPIs included are lead values per month, number of leads per month and lead marketing channels. Showcasing this set of slides titled Six Months Lead Generation Marketing Dashboard Inspiration PDF. The topics addressed in these templates are Six Months Lead Generation, Marketing Dashboard. All the content presented in this PPT design is completely editable. Download it and make adjustments in color, background, font etc. as per your unique business setting.
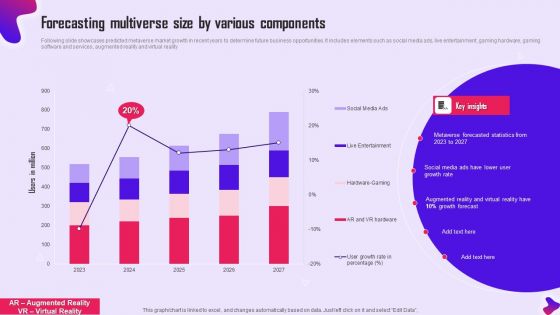
Forecasting Multiverse Size By Various Components Structure PDF
Following slide showcases predicted metaverse market growth in recent years to determine future business opportunities. It includes elements such as social media ads, live entertainment, gaming hardware, gaming software and services, augmented reality and virtual reality. Showcasing this set of slides titled Forecasting Multiverse Size By Various Components Structure PDF. The topics addressed in these templates are Forecasting Multiverse Size, Various Components. All the content presented in this PPT design is completely editable. Download it and make adjustments in color, background, font etc. as per your unique business setting.
KPI Dashboard For Tracking Multiverse Market Growth Background PDF
Following slide demonstrates KPI dashboard for predicting metaverse market share growth to determine business development opportunities. It includes elements such as total addressable market insights, global market share, monthly active users on metaverse and market size growth. Showcasing this set of slides titled KPI Dashboard For Tracking Multiverse Market Growth Background PDF. The topics addressed in these templates are Addressable Market Insights, Global Market Share, Growth Prediction. All the content presented in this PPT design is completely editable. Download it and make adjustments in color, background, font etc. as per your unique business setting.
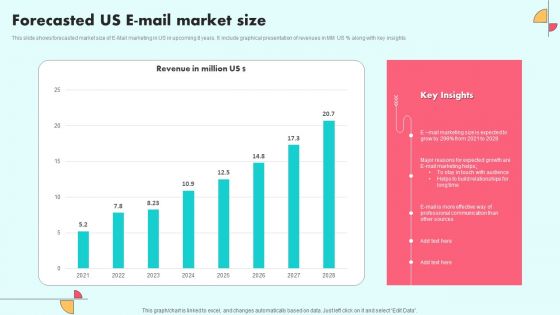
Forecasted Us E Mail Market Size Ideas PDF
This slide shows forecasted market size of E-Mail marketing in US in upcoming 8 years. It include graphical presentation of revenues in MM US percentage along with key insights. Pitch your topic with ease and precision using this Forecasted Us E Mail Market Size Ideas PDF. This layout presents information on E Mail Marketing, Sources, Communication. It is also available for immediate download and adjustment. So, changes can be made in the color, design, graphics or any other component to create a unique layout.
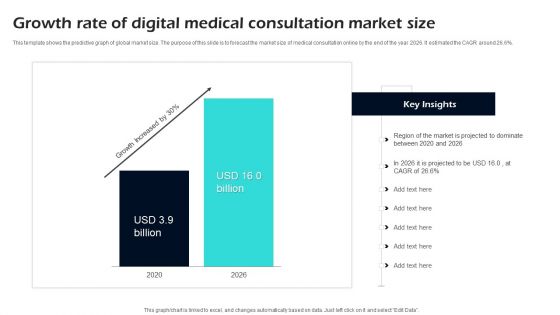
Growth Rate Of Digital Medical Consultation Market Size Ppt Information
This template shows the predictive graph of global market size. The purpose of this slide is to forecast the market size of medical consultation online by the end of the year 2026. It estimated the CAGR around 26.6 percentage. Showcasing this set of slides titled Growth Rate Of Digital Medical Consultation Market Size Ppt Information. The topics addressed in these templates are Growth, Digital, Market. All the content presented in this PPT design is completely editable. Download it and make adjustments in color, background, font etc. as per your unique business setting.
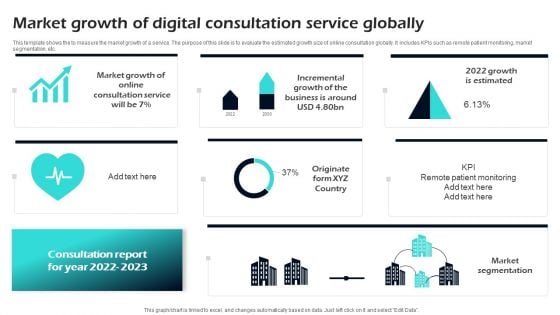
Market Growth Of Digital Consultation Service Globally Ppt Infographics
This template shows the to measure the market growth of a service. The purpose of this slide is to evaluate the estimated growth size of online consultation globally. It includes KPIs such as remote patient monitoring, market segmentation, etc. Showcasing this set of slides titled Market Growth Of Digital Consultation Service Globally Ppt Infographics. The topics addressed in these templates are Growth, Digital, Service. All the content presented in this PPT design is completely editable. Download it and make adjustments in color, background, font etc. as per your unique business setting.
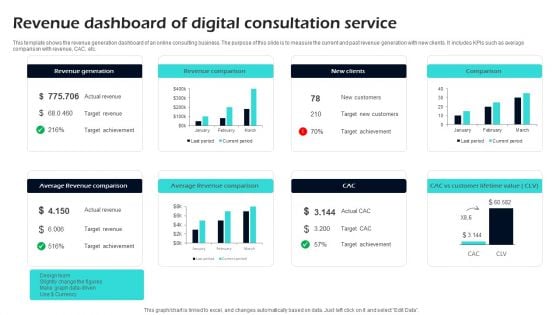
Revenue Dashboard Of Digital Consultation Service Ppt Designs
This template shows the revenue generation dashboard of an online consulting business. The purpose of this slide is to measure the current and past revenue generation with new clients. It includes KPIs such as average comparison with revenue, CAC, etc. Pitch your topic with ease and precision using this Revenue Dashboard Of Digital Consultation Service Ppt Designs. This layout presents information on Revenue, Digital, Consultation. It is also available for immediate download and adjustment. So, changes can be made in the color, design, graphics or any other component to create a unique layout.
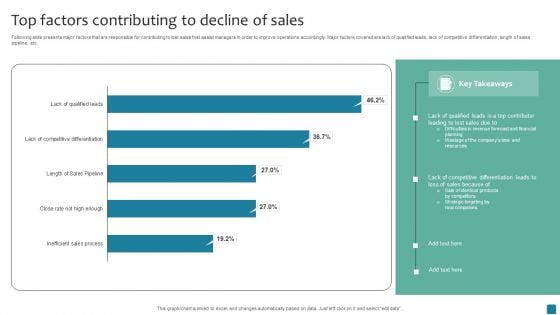
Top Factors Contributing To Decline Of Sales Demonstration PDF
Following slide presents major factors that are responsible for contributing to lost sales that assist managers in order to improve operations accordingly. Major factors covered are lack of qualified leads, lack of competitive differentiation, length of sales pipeline, etc. Showcasing this set of slides titled Top Factors Contributing To Decline Of Sales Demonstration PDF. The topics addressed in these templates are Top Factors Contributing, Decline Of Sales. All the content presented in this PPT design is completely editable. Download it and make adjustments in color, background, font etc. as per your unique business setting.
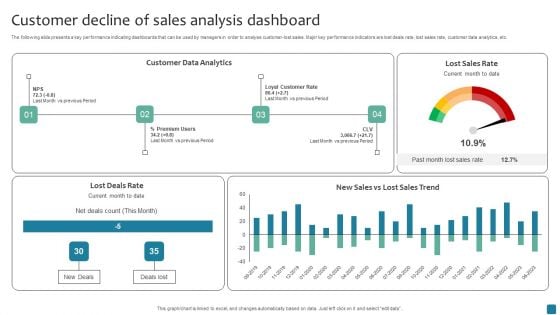
Customer Decline Of Sales Analysis Dashboard Rules PDF
The following slide presents a key performance indicating dashboards that can be used by managers in order to analyse customer-lost sales. Major key performance indicators are lost deals rate, lost sales rate, customer data analytics, etc. Pitch your topic with ease and precision using this Customer Decline Of Sales Analysis Dashboard Rules PDF. This layout presents information on Customer Data Analytics. It is also available for immediate download and adjustment. So, changes can be made in the color, design, graphics or any other component to create a unique layout.
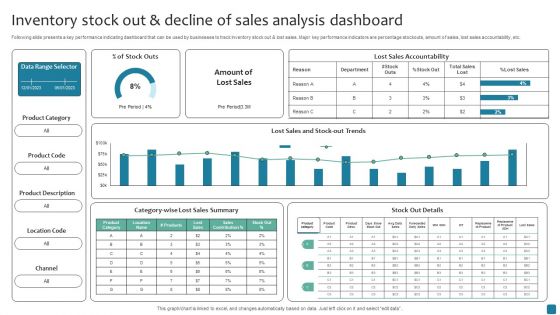
Inventory Stock Out And Decline Of Sales Analysis Dashboard Inspiration PDF
Following slide presents a key performance indicating dashboard that can be used by businesses to track Inventory stock out and lost sales. Major key performance indicators are percentage stockouts, amount of sales, lost sales accountability, etc. Pitch your topic with ease and precision using this Inventory Stock Out And Decline Of Sales Analysis Dashboard Inspiration PDF. This layout presents information on Lost Sales Summary, Stock Out Details It is also available for immediate download and adjustment. So, changes can be made in the color, design, graphics or any other component to create a unique layout.
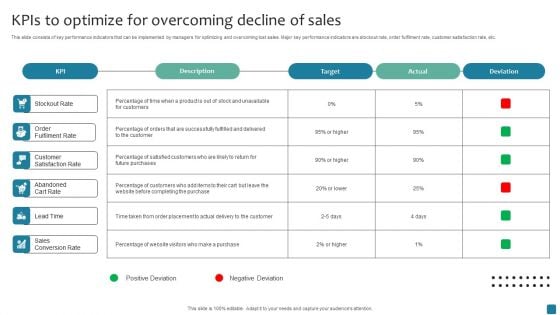
Kpis To Optimize For Overcoming Decline Of Sales Mockup PDF
This slide consists of key performance indicators that can be implemented by managers for optimizing and overcoming lost sales. Major key performance indicators are stockout rate, order fulfilment rate, customer satisfaction rate, etc. Showcasing this set of slides titled Kpis To Optimize For Overcoming Decline Of Sales Mockup PDF. The topics addressed in these templates are Target, Actual, Deviation. All the content presented in this PPT design is completely editable. Download it and make adjustments in color, background, font etc. as per your unique business setting.
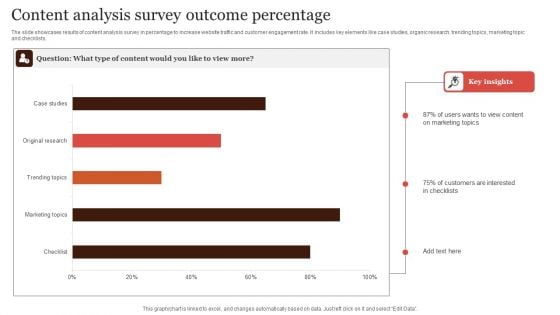
Content Analysis Survey Outcome Percentage Formats PDF
The slide showcases results of content analysis survey in percentage to increase website traffic and customer engagement rate. It includes key elements like case studies, organic research, trending topics, marketing topic and checklists. Showcasing this set of slides titled Content Analysis Survey Outcome Percentage Formats PDF. The topics addressed in these templates are Content Analysis, Survey Outcome Percentage. All the content presented in this PPT design is completely editable. Download it and make adjustments in color, background, font etc. as per your unique business setting.
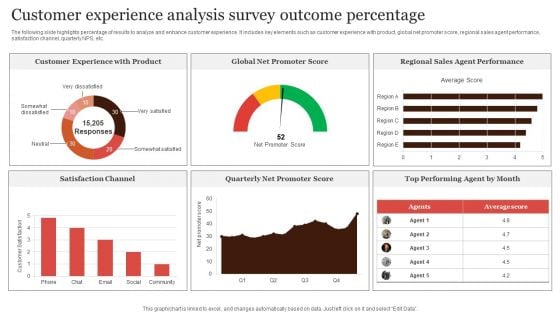
Customer Experience Analysis Survey Outcome Percentage Portrait PDF
The following slide highlights percentage of results to analyze and enhance customer experience. It includes key elements such as customer experience with product, global net promoter score, regional sales agent performance, satisfaction channel, quarterly NPS, etc. Pitch your topic with ease and precision using this Customer Experience Analysis Survey Outcome Percentage Portrait PDF. This layout presents information on Customer Experience, Promoter Score, Regional Sales. It is also available for immediate download and adjustment. So, changes can be made in the color, design, graphics or any other component to create a unique layout.
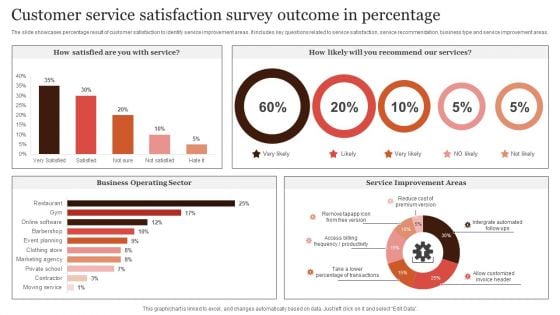
Customer Service Satisfaction Survey Outcome In Percentage Microsoft PDF
The slide showcases percentage result of customer satisfaction to identify service improvement areas. It includes key questions related to service satisfaction, service recommendation, business type and service improvement areas. Pitch your topic with ease and precision using this Customer Service Satisfaction Survey Outcome In Percentage Microsoft PDF. This layout presents information on Customer Service, Satisfaction Survey, Outcome In Percentage. It is also available for immediate download and adjustment. So, changes can be made in the color, design, graphics or any other component to create a unique layout.
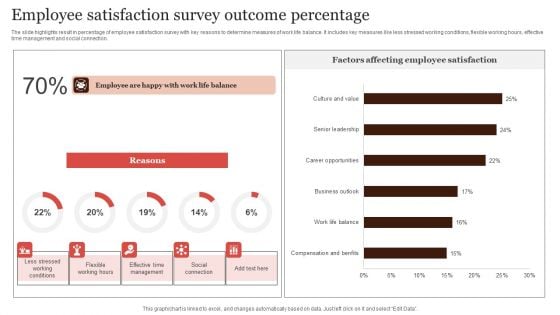
Employee Satisfaction Survey Outcome Percentage Graphics PDF
The slide highlights result in percentage of employee satisfaction survey with key reasons to determine measures of work life balance. It includes key measures like less stressed working conditions, flexible working hours, effective time management and social connection. Showcasing this set of slides titled Employee Satisfaction Survey Outcome Percentage Graphics PDF. The topics addressed in these templates are Factors Affecting, Employee Satisfaction, Survey Outcome Percentage. All the content presented in this PPT design is completely editable. Download it and make adjustments in color, background, font etc. as per your unique business setting.
Online Shopping Survey Outcome In Percentage Icons PDF
The slide showcases percentage results to analyze experience of online shopping to identify areas for enhancing shopping experience. It includes key elements such as reasons for online shopping, elements considered by customers and shopping platforms. Pitch your topic with ease and precision using this Online Shopping Survey Outcome In Percentage Icons PDF. This layout presents information on Price Comparison, Product Information, Online Reviews. It is also available for immediate download and adjustment. So, changes can be made in the color, design, graphics or any other component to create a unique layout.
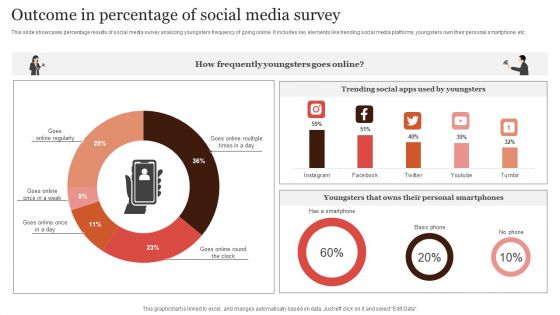
Outcome In Percentage Of Social Media Survey Demonstration PDF
This slide showcases percentage results of social media survey analyzing youngsters frequency of going online. It includes key elements like trending social media platforms, youngsters own their personal smartphone, etc. Showcasing this set of slides titled Outcome In Percentage Of Social Media Survey Demonstration PDF. The topics addressed in these templates are Frequently Youngsters, Trending Social Apps, Personal Smartphones. All the content presented in this PPT design is completely editable. Download it and make adjustments in color, background, font etc. as per your unique business setting.
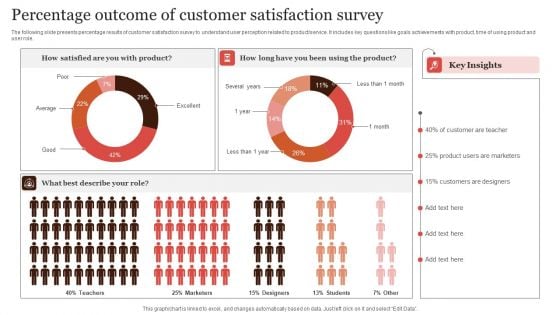
Percentage Outcome Of Customer Satisfaction Survey Infographics PDF
The following slide presents percentage results of customer satisfaction survey to understand user perception related to product or service. It includes key questions like goals achievements with product, time of using product and user role. Pitch your topic with ease and precision using this Percentage Outcome Of Customer Satisfaction Survey Infographics PDF. This layout presents information on Percentage Outcome, Customer Satisfaction Survey. It is also available for immediate download and adjustment. So, changes can be made in the color, design, graphics or any other component to create a unique layout.
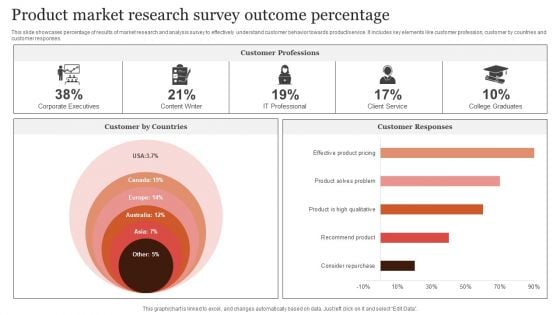
Product Market Research Survey Outcome Percentage Elements PDF
This slide showcases percentage of results of market research and analysis survey to effectively understand customer behavior towards product or service. It includes key elements like customer profession, customer by countries and customer responses. Pitch your topic with ease and precision using this Product Market Research Survey Outcome Percentage Elements PDF. This layout presents information on Customer By Countries, Customer Professions, Customer Responses. It is also available for immediate download and adjustment. So, changes can be made in the color, design, graphics or any other component to create a unique layout.
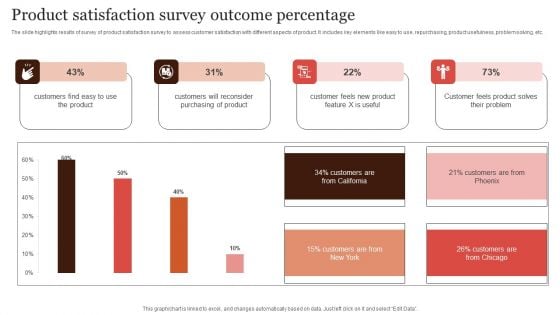
Product Satisfaction Survey Outcome Percentage Elements PDF
The slide highlights results of survey of product satisfaction survey to assess customer satisfaction with different aspects of product. It includes key elements like easy to use, repurchasing, product usefulness, problem solving, etc. Showcasing this set of slides titled Product Satisfaction Survey Outcome Percentage Elements PDF. The topics addressed in these templates are Customers Will Reconsider, Purchasing Of Product, Survey Outcome Percentage. All the content presented in this PPT design is completely editable. Download it and make adjustments in color, background, font etc. as per your unique business setting.
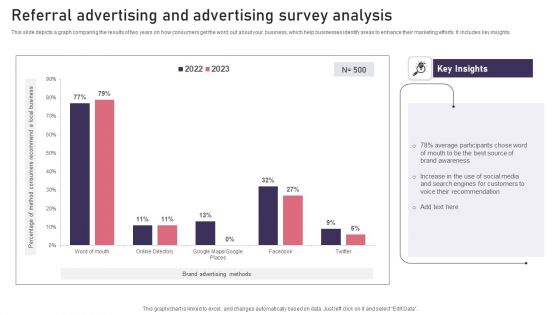
Referral Advertising And Advertising Survey Analysis Background PDF
This slide depicts a graph comparing the results of two years on how consumers get the word out about your business, which help businesses identify areas to enhance their marketing efforts. It includes key insights. Showcasing this set of slides titled Referral Advertising And Advertising Survey Analysis Background PDF. The topics addressed in these templates are Referral Advertising, Advertising Survey Analysis. All the content presented in this PPT design is completely editable. Download it and make adjustments in color, background, font etc. as per your unique business setting.
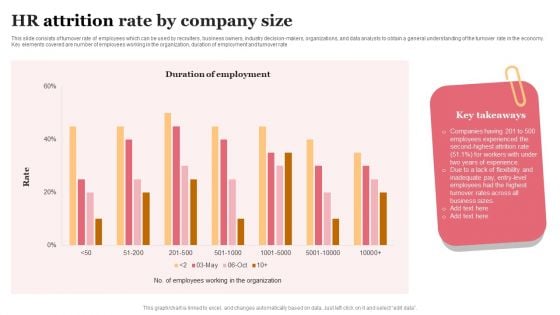
HR Attrition Rate By Company Size Elements PDF
This slide consists of turnover rate of employees which can be used by recruiters, business owners, industry decision-makers, organizations, and data analysts to obtain a general understanding of the turnover rate in the economy. Key elements covered are number of employees working in the organization, duration of employment and turnover rate. Pitch your topic with ease and precision using this HR Attrition Rate By Company Size Elements PDF. This layout presents information on Key Takeaways, Business Sizes, Employees. It is also available for immediate download and adjustment. So, changes can be made in the color, design, graphics or any other component to create a unique layout.
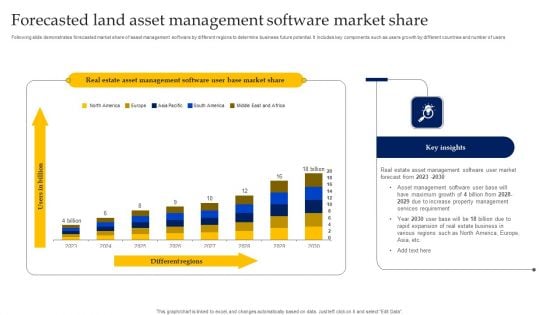
Forecasted Land Asset Management Software Market Share Introduction PDF
Following slide demonstrates forecasted market share of asset management software by different regions to determine business future potential. It includes key components such as users growth by different countries and number of users. Showcasing this set of slides titled Forecasted Land Asset Management Software Market Share Introduction PDF. The topics addressed in these templates are Services Requirement, Asset Management, Maximum Growth. All the content presented in this PPT design is completely editable. Download it and make adjustments in color, background, font etc. as per your unique business setting.
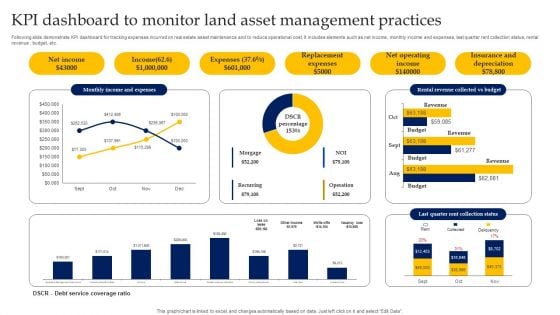
KPI Dashboard To Monitor Land Asset Management Practices Clipart PDF
Following slide demonstrate KPI dashboard for tracking expenses incurred on real estate asset maintenance and to reduce operational cost. It includes elements such as net income, monthly income and expenses, last quarter rent collection status, rental revenue , budget, etc. Pitch your topic with ease and precision using this KPI Dashboard To Monitor Land Asset Management Practices Clipart PDF. This layout presents information on Revenue, Budget, Income. It is also available for immediate download and adjustment. So, changes can be made in the color, design, graphics or any other component to create a unique layout.
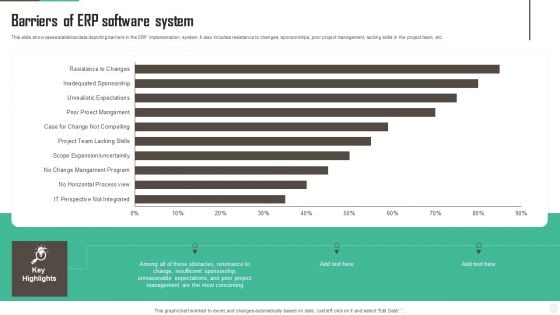
Barriers Of ERP Software System Ideas PDF
Showcasing this set of slides titled Barriers Of ERP Software System Ideas PDF Ppt Template. The topics addressed in these templates are Software, System, Sponsorship. All the content presented in this PPT design is completely editable. Download it and make adjustments in color, background, font etc. as per your unique business setting.
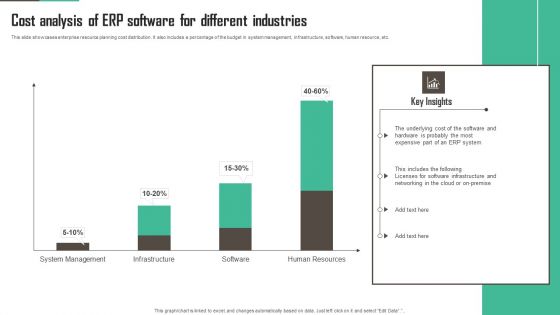
Cost Analysis Of ERP Software For Different Industries Inspiration PDF
Pitch your topic with ease and precision using this Cost Analysis Of ERP Software For Different Industries Inspiration PDF Download. This layout presents information on Underlying Cost, Expensive Part, Software Infrastructure. It is also available for immediate download and adjustment. So, changes can be made in the color, design, graphics or any other component to create a unique layout.
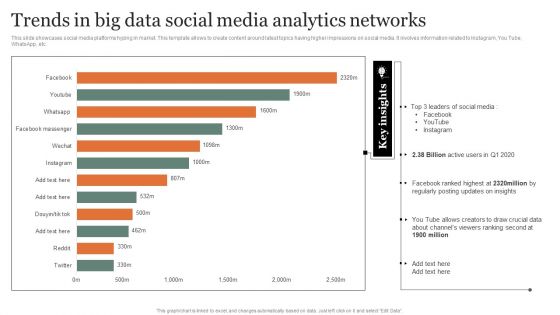
Trends In Big Data Social Media Analytics Networks Guidelines PDF
This slide showcases social media platforms hyping in market. This template allows to create content around latest topics having higher impressions on social media. It involves information related to Instagram, You Tube, WhatsApp, etc. Showcasing this set of slides titled Trends In Big Data Social Media Analytics Networks Guidelines PDF Topics. The topics addressed in these templates are Analytics Networks, Posting Updates, Ranking Second. All the content presented in this PPT design is completely editable. Download it and make adjustments in color, background, font etc. as per your unique business setting.
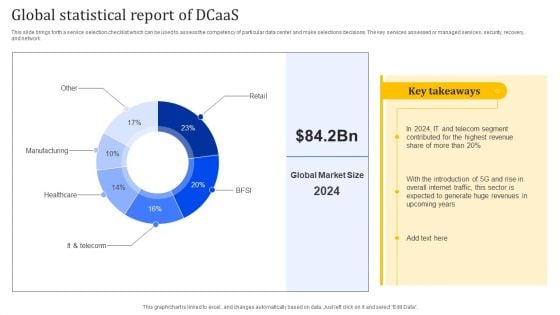
Global Statistical Report Of Dcaas Portrait PDF
This slide brings forth a service selection checklist which can be used to assess the competency of particular data center and make selections decisions. The key services assessed or managed services, security, recovery, and network. Showcasing this set of slides titled Global Statistical Report Of Dcaas Portrait PDF. The topics addressed in these templates are Manufacturing, Healthcare, Global Statistical. All the content presented in this PPT design is completely editable. Download it and make adjustments in color, background, font etc. as per your unique business setting.
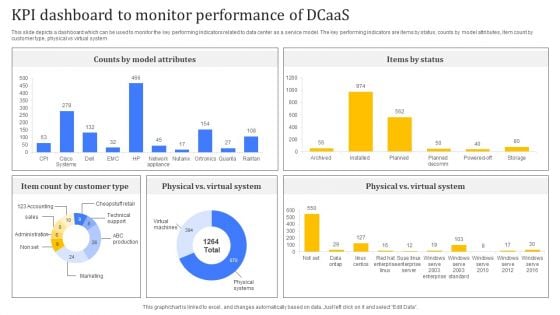
KPI Dashboard To Monitor Performance Of Dcaas Pictures PDF
Following slide highlights major benefits of applying data center as a service to business operations which can be used by businesses looking to modernize their IT infrastructure. Major benefits are in terms of scalability, flexibility, cost effectiveness, and security. Pitch your topic with ease and precision using this KPI Dashboard To Monitor Performance Of Dcaas Pictures PDF. This layout presents information on Customer Type, Counts By Model Attributes, Items By Status. It is also available for immediate download and adjustment. So, changes can be made in the color, design, graphics or any other component to create a unique layout.
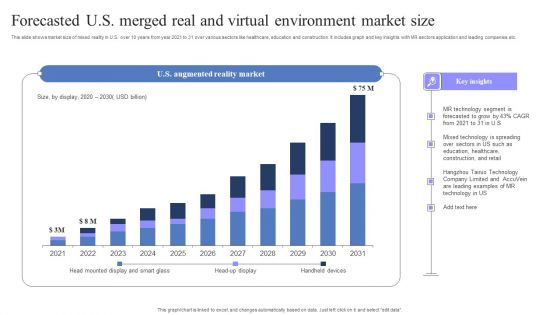
Forecasted U S Merged Real And Virtual Environment Market Size Rules PDF
This slide shows market size of mixed reality in U.S. over 10 years from year 2021 to 31 over various sectors like healthcare, education and construction. It includes graph and key insights with MR sectors application and leading companies etc. Showcasing this set of slides titled Forecasted U S Merged Real And Virtual Environment Market Size Rules PDF. The topics addressed in these templates are MR Technology Segment, Mixed Technology, Technology Company Limited. All the content presented in this PPT design is completely editable. Download it and make adjustments in color, background, font etc. as per your unique business setting.
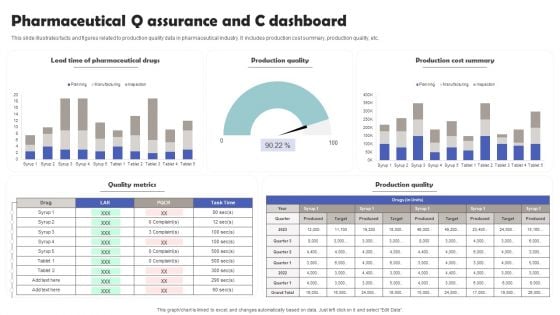
Pharmaceutical Q Assurance And C Dashboard Template PDF
This slide illustrates facts and figures related to production quality data in pharmaceutical industry. It includes production cost summary, production quality, etc. Showcasing this set of slides titled Pharmaceutical Q Assurance And C Dashboard Template PDF. The topics addressed in these templates are Pharmaceutical Drugs, Production Quality, Production Cost Summary. All the content presented in this PPT design is completely editable. Download it and make adjustments in color, background, font etc. as per your unique business setting.
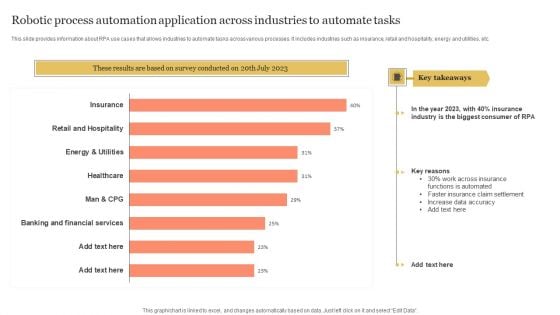
Robotic Process Automation Application Across Industries To Automate Tasks Portrait PDF
This slide provides information about RPA use cases that allows industries to automate tasks across various processes. It includes industries such as insurance, retail and hospitality, energy and utilities, etc. Showcasing this set of slides titled Robotic Process Automation Application Across Industries To Automate Tasks Portrait PDF. The topics addressed in these templates are Across Insurance Functions, Faster Insurance, Increase Data Accuracy. All the content presented in this PPT design is completely editable. Download it and make adjustments in color, background, font etc. as per your unique business setting.
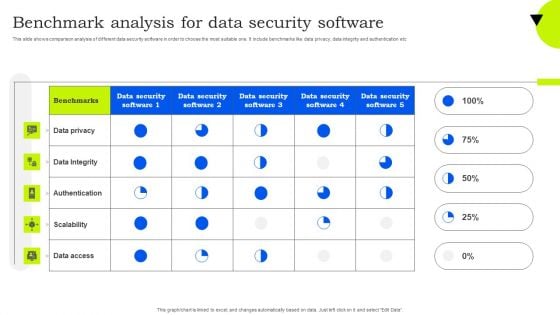
Benchmark Analysis For Data Security Software Mockup PDF
This slide shows comparison analysis of different data security software in order to choose the most suitable one. It include benchmarks like data privacy, data integrity and authentication etc. Showcasing this set of slides titled Benchmark Analysis For Data Security Software Mockup PDF. The topics addressed in these templates are Data Privacy, Data Integrity, Authentication. All the content presented in this PPT design is completely editable. Download it and make adjustments in color, background, font etc. as per your unique business setting.
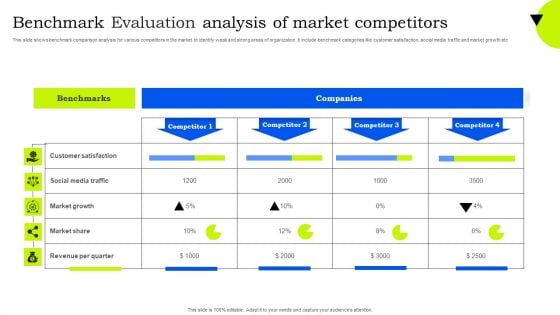
Benchmark Evaluation Analysis Of Market Competitors Sample PDF
This slide shows benchmark comparison analysis for various competitors in the market to identify weak and strong areas of organization. It include benchmark categories like customer satisfaction, social media traffic and market growth etc. Showcasing this set of slides titled Benchmark Evaluation Analysis Of Market Competitors Sample PDF. The topics addressed in these templates are Customer Satisfaction, Social Media Traffic, Market Growth. All the content presented in this PPT design is completely editable. Download it and make adjustments in color, background, font etc. as per your unique business setting.
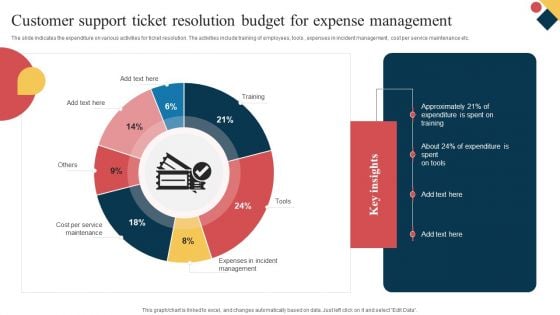
Customer Support Ticket Resolution Budget For Expense Management Summary PDF
The slide indicates the expenditure on various activities for ticket resolution. The activities include training of employees, tools , expenses in incident management , cost per service maintenance etc. Showcasing this set of slides titled Customer Support Ticket Resolution Budget For Expense Management Summary PDF. The topics addressed in these templates are Cost Per Service Maintenance, Expenses Incident Management, Training. All the content presented in this PPT design is completely editable. Download it and make adjustments in color, background, font etc. as per your unique business setting.
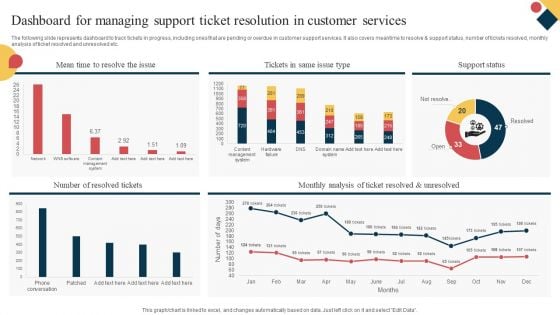
Dashboard For Managing Support Ticket Resolution In Customer Services Ideas PDF
The following slide represents dashboard to track tickets in progress, including ones that are pending or overdue in customer support services. It also covers meantime to resolve and support status, number of tickets resolved, monthly analysis of ticket resolved and unresolved etc. Showcasing this set of slides titled Dashboard For Managing Support Ticket Resolution In Customer Services Ideas PDF. The topics addressed in these templates are Resolved Tickets, Ticket Resolved Unresolved, Support Status. All the content presented in this PPT design is completely editable. Download it and make adjustments in color, background, font etc. as per your unique business setting.
Digital Sales Metrics Showing Enhancement Icons PDF
The following slide represents statistics of online sales key performance indicators KPIs which can assist marketing manager to review their performance and take necessary steps. It include different metrics such as add to cart rate, conversion rate, and revenue per session. Showcasing this set of slides titled Digital Sales Metrics Showing Enhancement Icons PDF. The topics addressed in these templates are Quarterly Online Sales Metrics, Targeted Right Customers, Offered Product Recommendations. All the content presented in this PPT design is completely editable. Download it and make adjustments in color, background, font etc. as per your unique business setting.
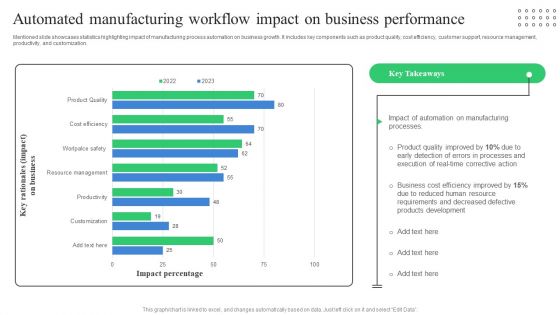
Automated Manufacturing Workflow Impact On Business Performance Sample PDF
Mentioned slide showcases statistics highlighting impact of manufacturing process automation on business growth. It includes key components such as product quality, cost efficiency, customer support, resource management, productivity, and customization. Showcasing this set of slides titled Automated Manufacturing Workflow Impact On Business Performance Sample PDF. The topics addressed in these templates are Product Quality Improved, Business Cost Efficiency, Defective Products Development. All the content presented in this PPT design is completely editable. Download it and make adjustments in color, background, font etc. as per your unique business setting.
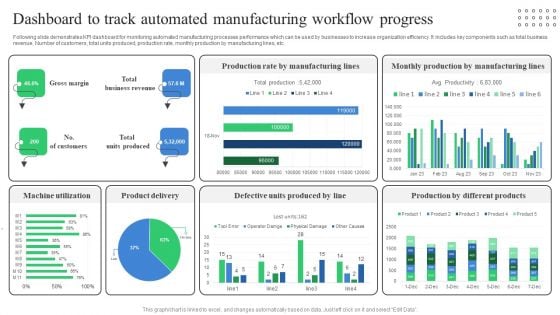
Dashboard To Track Automated Manufacturing Workflow Progress Professional PDF
Following slide demonstrates KPI dashboard for monitoring automated manufacturing processes performance which can be used by businesses to increase organization efficiency. It includes key components such as total business revenue, Number of customers, total units produced, production rate, monthly production by manufacturing lines, etc. Showcasing this set of slides titled Dashboard To Track Automated Manufacturing Workflow Progress Professional PDF. The topics addressed in these templates are Machine Utilization, Product Delivery, Defective Units Produced. All the content presented in this PPT design is completely editable. Download it and make adjustments in color, background, font etc. as per your unique business setting.
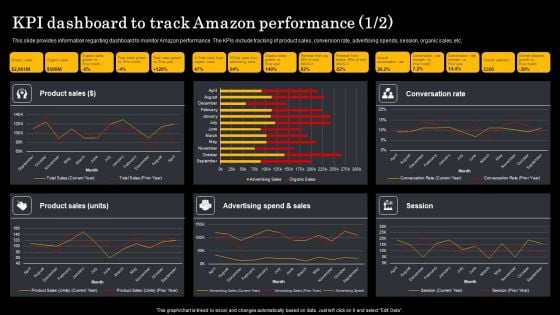
Assessment Of Amazon Brand Performance KPI Dashboard To Track Amazon Elements PDF
This slide provides information regarding dashboard to monitor Amazon performance. The KPIs include tracking of product sales, conversion rate, advertising spends, session, organic sales, etc. Slidegeeks is one of the best resources for PowerPoint templates. You can download easily and regulate Assessment Of Amazon Brand Performance KPI Dashboard To Track Amazon Elements PDF for your personal presentations from our wonderful collection. A few clicks is all it takes to discover and get the most relevant and appropriate templates. Use our Templates to add a unique zing and appeal to your presentation and meetings. All the slides are easy to edit and you can use them even for advertisement purposes.
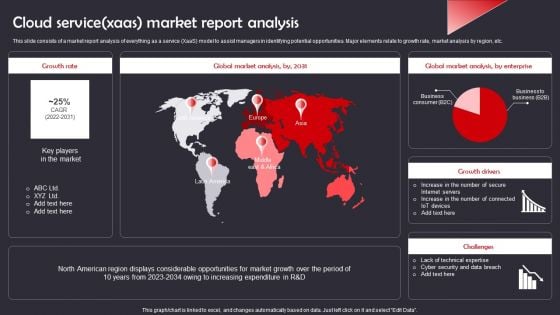
Cloud Service Xaas Market Report Analysis Ideas PDF
This slide consists of a market report analysis of everything as a service XaaS model to assist managers in identifying potential opportunities. Major elements relate to growth rate, market analysis by region, etc. Showcasing this set of slides titled Cloud Service Xaas Market Report Analysis Ideas PDF. The topics addressed in these templates are Growth Rate, Global Market Analysis, Global Market Analysis. All the content presented in this PPT design is completely editable. Download it and make adjustments in color, background, font etc. as per your unique business setting.
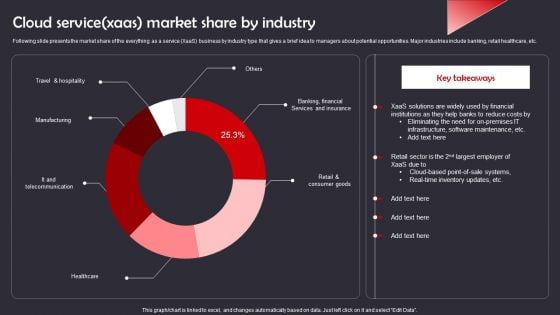
Cloud Service Xaas Market Share By Industry Designs PDF
Following slide presents the market share of the everything as a service XaaS business by industry type that gives a brief idea to managers about potential opportunities. Major industries include banking, retail healthcare, etc. Showcasing this set of slides titled Cloud Service Xaas Market Share By Industry Designs PDF. The topics addressed in these templates are Travel Hospitality, Manufacturing, It Telecommunication. All the content presented in this PPT design is completely editable. Download it and make adjustments in color, background, font etc. as per your unique business setting.
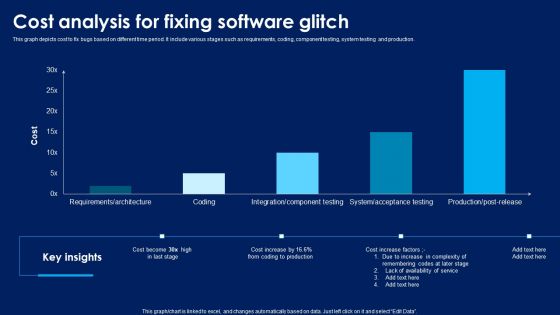
Cost Analysis For Fixing Software Glitch Inspiration PDF
This graph depicts cost to fix bugs based on different time period. It include various stages such as requirements, coding, component testing, system testing and production. Showcasing this set of slides titled Cost Analysis For Fixing Software Glitch Inspiration PDF. The topics addressed in these templates are Increase Complexity, Remembering Codes, Lack Availability Service . All the content presented in this PPT design is completely editable. Download it and make adjustments in color, background, font etc. as per your unique business setting.
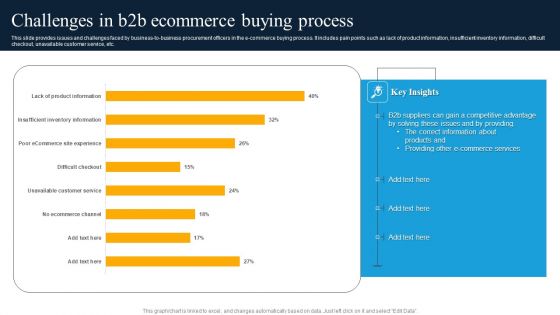
Challenges In B2b Ecommerce Buying Process Clipart PDF
This slide provides issues and challenges faced by business-to-business procurement officers in the e-commerce buying process. It includes pain points such as lack of product information, insufficient inventory information, difficult checkout, unavailable customer service, etc. Showcasing this set of slides titled Challenges In B2b Ecommerce Buying Process Clipart PDF. The topics addressed in these templates are The Correct Information, Products, Providing Other E-Commerce Services. All the content presented in this PPT design is completely editable. Download it and make adjustments in color, background, font etc. as per your unique business setting.


 Continue with Email

 Home
Home


