Daily Plan
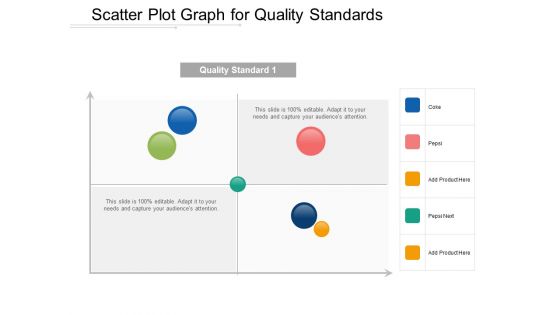
Scatter Plot Graph For Quality Standards Ppt Powerpoint Presentation Show Infographics
This is a scatter plot graph for quality standards ppt powerpoint presentation show infographics. This is a four stage process. The stages in this process are scatter plot, probability plots, plot diagram.

Man Standing With Stack Of Us Currency Notes Bundles Ppt Powerpoint Presentation File Slides
This is a man standing with stack of us currency notes bundles ppt powerpoint presentation file slides. This is a three stage process. The stages in this process are stacked bar, pile bar, heap bar.
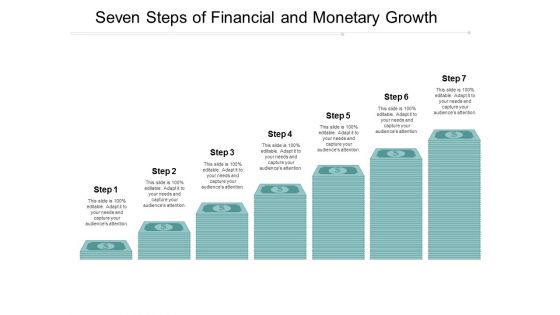
Seven Steps Of Financial And Monetary Growth Ppt Powerpoint Presentation Inspiration Backgrounds
This is a seven steps of financial and monetary growth ppt powerpoint presentation inspiration backgrounds. This is a seven stage process. The stages in this process are stacked bar, pile bar, heap bar.
Stack Of Coins For Bitcoin Transactions Ppt Powerpoint Presentation Icon Infographics
This is a stack of coins for bitcoin transactions ppt powerpoint presentation icon infographics. This is a four stage process. The stages in this process are stacked bar, pile bar, heap bar.

Stack Of Dollar Currency Banknotes For Financial Success Ppt Powerpoint Presentation Slides Background
This is a stack of dollar currency banknotes for financial success ppt powerpoint presentation slides background. This is a five stage process. The stages in this process are stacked bar, pile bar, heap bar.
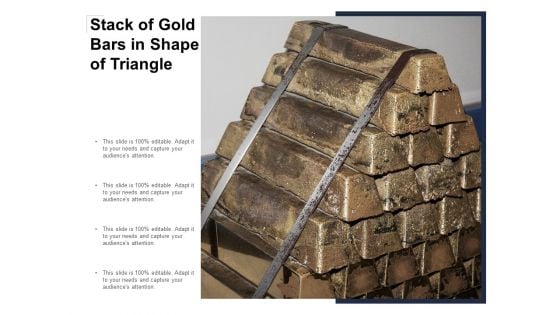
Stack Of Gold Bars In Shape Of Triangle Ppt Powerpoint Presentation Infographic Template Guidelines
This is a stack of gold bars in shape of triangle ppt powerpoint presentation infographic template guidelines. This is a four stage process. The stages in this process are stacked bar, pile bar, heap bar.

Stack Of Shiny Gold Bars Ppt Powerpoint Presentation Gallery Show
This is a stack of shiny gold bars ppt powerpoint presentation gallery show. This is a four stage process. The stages in this process are stacked bar, pile bar, heap bar.
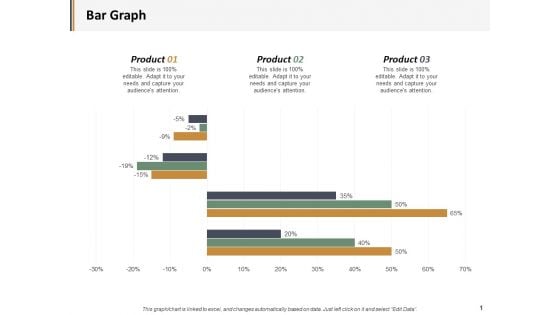
Bar Graph Percentage Product Ppt PowerPoint Presentation Layouts Microsoft
This is a bar graph percentage product ppt powerpoint presentation layouts microsoft. This is a three stage process. The stages in this process are business, management, marketing, percentage, product.
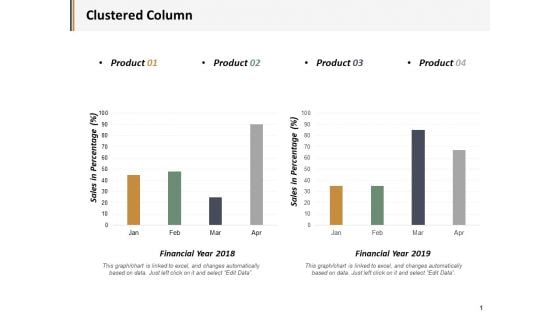
Clustered Column Product Ppt PowerPoint Presentation Show Guidelines
This is a clustered column product ppt powerpoint presentation show guidelines. This is a four stage process. The stages in this process are business, management, marketing, percentage, product.
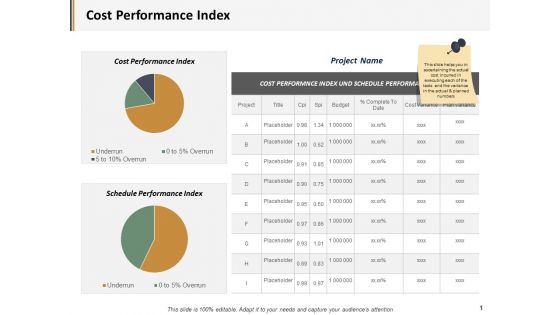
Cost Performance Index Ppt PowerPoint Presentation Inspiration Graphics Example
This is a cost performance index ppt powerpoint presentation inspiration graphics example. This is a three stage process. The stages in this process are business, management, marketing, percentage, product.
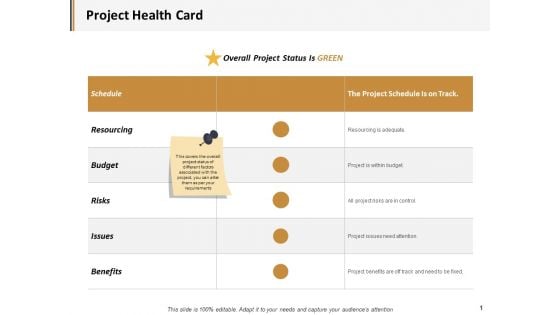
Project Health Card Resourcing Ppt PowerPoint Presentation Summary Graphics Download
This is a project health card resourcing ppt powerpoint presentation summary graphics download. This is a six stage process. The stages in this process are business, management, marketing, percentage, product.
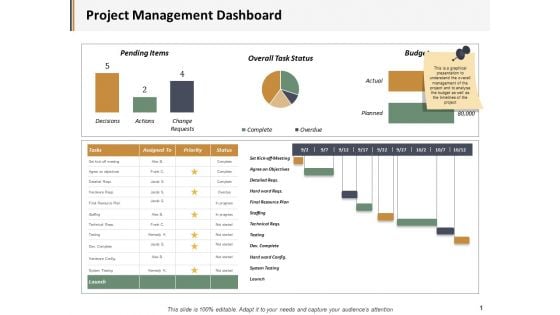
Project Management Dashboard Ppt PowerPoint Presentation Deck
This is a project management dashboard ppt powerpoint presentation deck. This is a five stage process. The stages in this process are business, management, marketing, percentage, product.
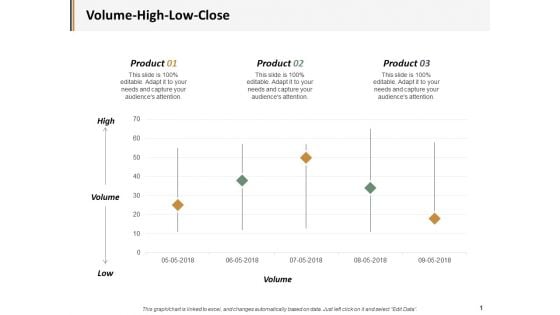
Volume High Low Close Ppt PowerPoint Presentation Ideas Example Introduction
This is a volume high low close ppt powerpoint presentation ideas example introduction. This is a three stage process. The stages in this process are business, management, marketing, percentage, product.
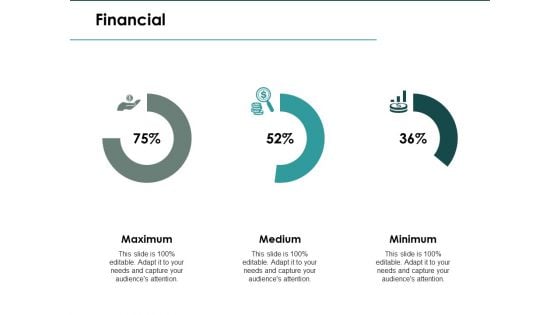
Financial Maximum Ppt PowerPoint Presentation Model Master Slide
This is a financial maximum ppt powerpoint presentation model master slide. This is a three stage process. The stages in this process are financial, maximum, medium, minimum, marketing.
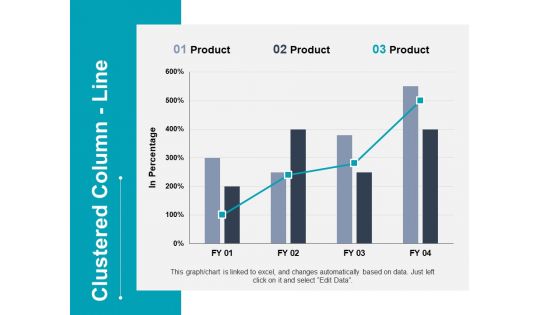
Clustered Column Line Investment Ppt PowerPoint Presentation Styles Smartart
This is a clustered column line investment ppt powerpoint presentation styles smartart. This is a three stage process. The stages in this process are finance, analysis, business, investment, marketing.
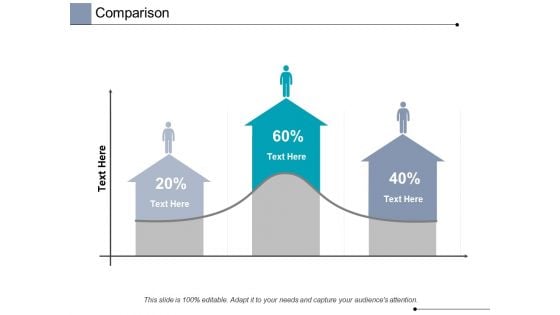
Comparison Finance Ppt PowerPoint Presentation Pictures Good
This is a comparison finance ppt powerpoint presentation pictures good. This is a three stage process. The stages in this process are finance, analysis, business, investment, marketing.
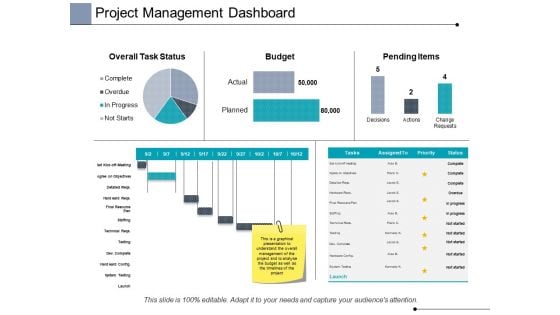
Project Management Dashboard Ppt PowerPoint Presentation Infographic Template Graphics
This is a project management dashboard ppt powerpoint presentation infographic template graphics. This is a three stage process. The stages in this process are finance, analysis, business, investment, marketing.

Comparison Marketing Ppt PowerPoint Presentation Gallery Graphic Tips
This is a comparison marketing ppt powerpoint presentation gallery graphic tips. This is a three stage process. The stages in this process are finance, analysis, business, investment, marketing.
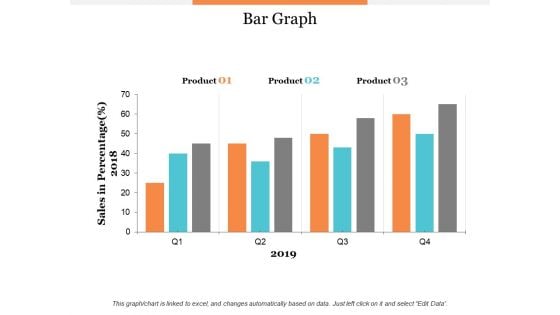
Bar Graph Product Ppt PowerPoint Presentation Model Graphic Tips
This is a bar graph product ppt powerpoint presentation model graphic tips. This is a three stage process. The stages in this process are product, percentage, business, management, marketing.
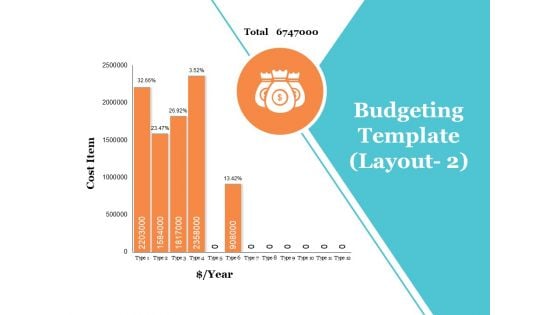
Budgeting Template Ppt PowerPoint Presentation Gallery Design Inspiration
This is a budgeting template ppt powerpoint presentation gallery design inspiration. This is a five stage process. The stages in this process are product, percentage, business, management, marketing.
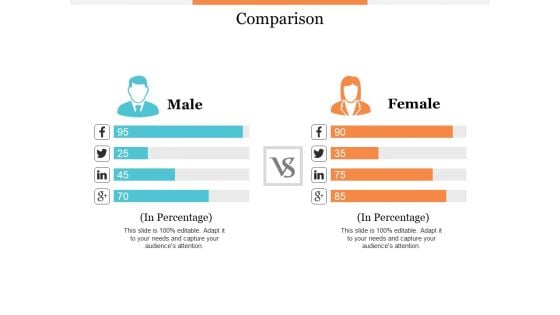
Comparison Male And Female Ppt PowerPoint Presentation Professional Skills
This is a comparison male and female ppt powerpoint presentation professional skills. This is a two stage process. The stages in this process are product, percentage, business, management, marketing.
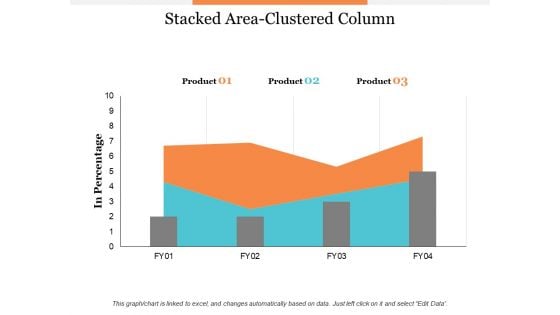
Stacked Area Clustered Column Ppt PowerPoint Presentation Infographic Template Summary
This is a stacked area clustered column ppt powerpoint presentation infographic template summary. This is a three stage process. The stages in this process are business, management, marketing, percentage, product.
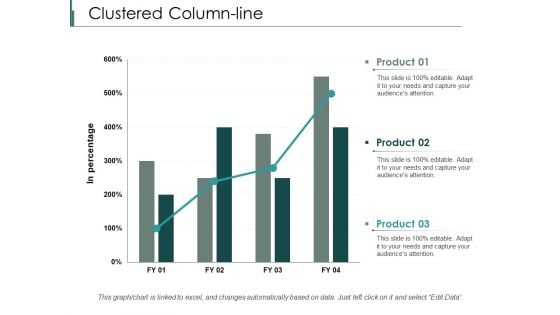
Clustered Column Line Marketing Ppt PowerPoint Presentation Ideas
This is a clustered column line marketing ppt powerpoint presentation ideas. This is a three stage process. The stages in this process are finance, analysis, business, investment, marketing.
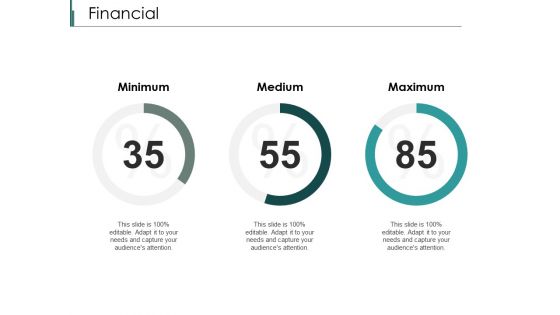
Financial Minimum Medium Ppt PowerPoint Presentation Summary Themes
This is a financial minimum medium ppt powerpoint presentation summary themes. This is a three stage process. The stages in this process are financial, maximum, medium, minimum, marketing.
Project Management Dashboard Finance Ppt PowerPoint Presentation Styles Icons
This is a project management dashboard finance ppt powerpoint presentation styles icons. This is a three stage process. The stages in this process are finance, analysis, business, investment, marketing.
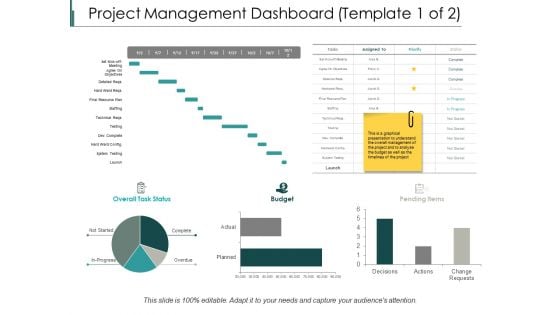
Project Management Dashboard Ppt PowerPoint Presentation Slides Styles
This is a project management dashboard ppt powerpoint presentation slides styles. This is a three stage process. The stages in this process are finance, analysis, business, investment, marketing.
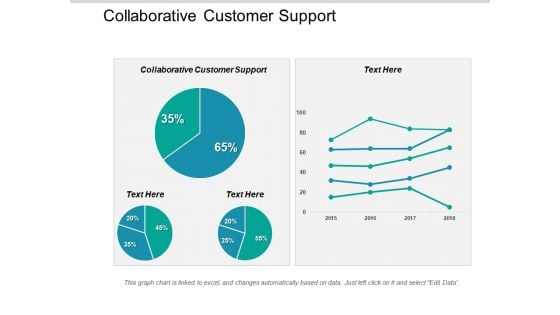
Collaborative Customer Support Ppt PowerPoint Presentation Inspiration Slides Cpb
This is a collaborative customer support ppt powerpoint presentation inspiration slides cpb. This is a two stage process. The stages in this process are collaborative customer support.
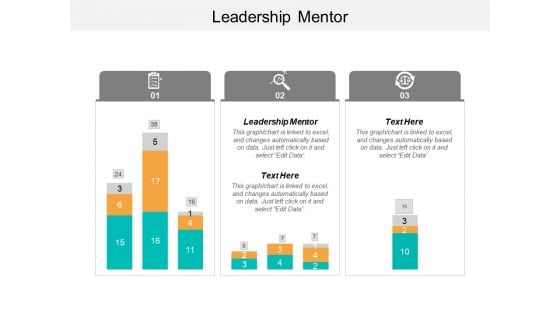
Leadership Mentor Ppt PowerPoint Presentation Diagram Ppt Cpb
This is a leadership mentor ppt powerpoint presentation diagram ppt cpb. This is a three stage process. The stages in this process are leadership mentor.
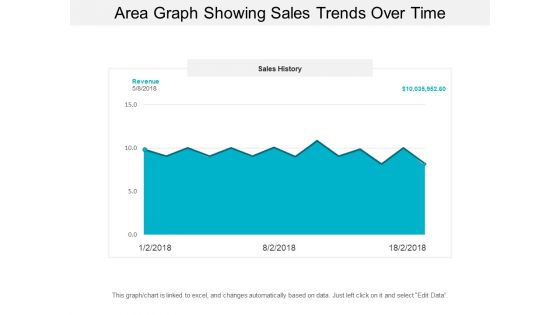
Area Graph Showing Sales Trends Over Time Ppt PowerPoint Presentation Model Background Designs
This is a area graph showing sales trends over time ppt powerpoint presentation model background designs. This is a three stage process. The stages in this process are financial analysis, quantitative, statistical modelling.
Bar Graph Icon For Data Analysis Ppt PowerPoint Presentation Pictures Ideas
This is a bar graph icon for data analysis ppt powerpoint presentation pictures ideas. This is a four stage process. The stages in this process are financial analysis, quantitative, statistical modelling.
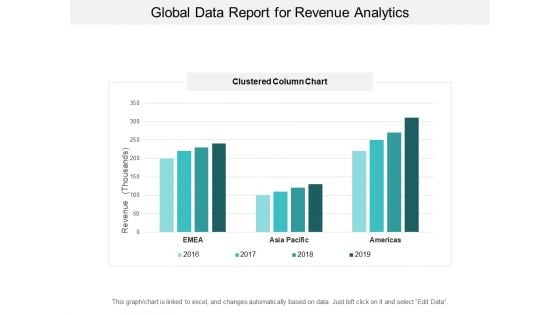
Global Data Report For Revenue Analytics Ppt PowerPoint Presentation Inspiration Visuals
This is a global data report for revenue analytics ppt powerpoint presentation inspiration visuals. This is a four stage process. The stages in this process are financial analysis, quantitative, statistical modelling.
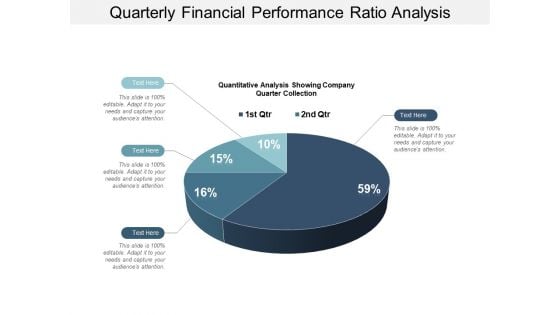
Quarterly Financial Performance Ratio Analysis Ppt PowerPoint Presentation Model Format Ideas
This is a quarterly financial performance ratio analysis ppt powerpoint presentation model format ideas. This is a four stage process. The stages in this process are financial analysis, quantitative, statistical modelling.
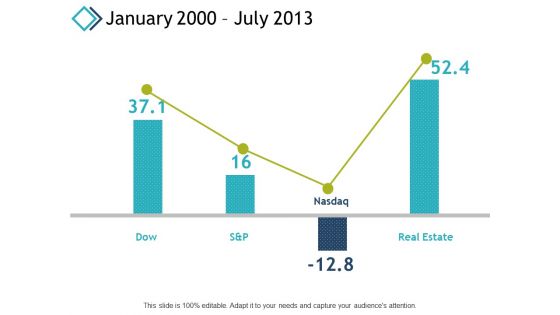
January 2000 July 2013 Marketing Ppt PowerPoint Presentation File Slide Download
This is a january 2000 july 2013 marketing ppt powerpoint presentation file slide download. This is a four stage process. The stages in this process are finance, analysis, business, investment, marketing.
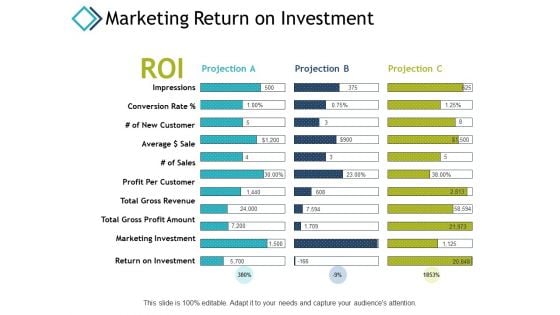
Marketing Return On Investment Ppt PowerPoint Presentation Infographics Files
This is a marketing return on investment ppt powerpoint presentation infographics files. This is a three stage process. The stages in this process are marketing investment, impressions, return on investment, finance, marketing.

Industry Market Share Ppt PowerPoint Presentation Pictures Format
This is a industry market share ppt powerpoint presentation pictures format. This is a six stage process. The stages in this process are percentage, product, management, marketing, business.
Market Potential Ppt PowerPoint Presentation Icon Influencers
This is a market potential ppt powerpoint presentation icon influencers. This is a six stage process. The stages in this process are percentage, product, management, marketing, business.

Sales Projections Ppt PowerPoint Presentation Summary Show
This is a sales projections ppt powerpoint presentation summary show. This is a five stage process. The stages in this process are business, marketing, management, percentage, product.
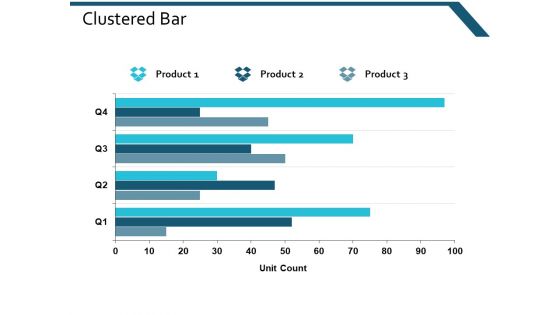
Clustered Bar Investment Ppt Powerpoint Presentation Gallery Clipart
This is a clustered bar investment ppt powerpoint presentation gallery clipart. This is a three stage process. The stages in this process are clustered bar, finance, marketing, management, analysis.
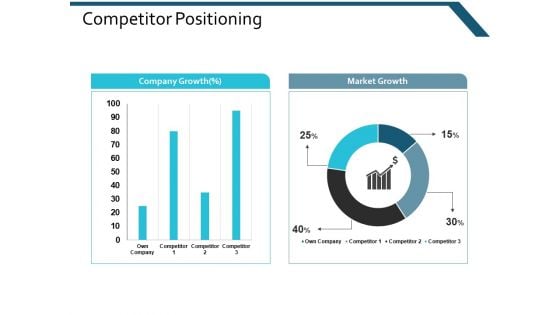
Competitor Positioning Ppt Powerpoint Presentation Pictures Gridlines
This is a competitor positioning ppt powerpoint presentation pictures gridlines. This is a two stage process. The stages in this process are finance, marketing, management, investment, analysis.
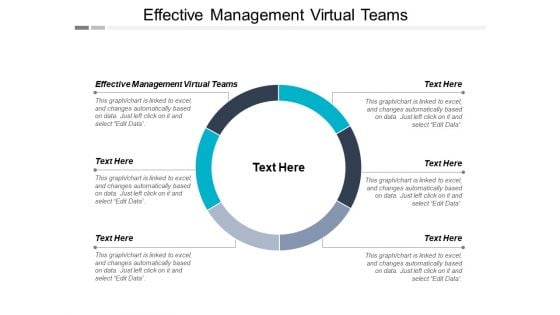
Effective Management Virtual Teams Ppt PowerPoint Presentation Infographics Ideas Cpb
This is a effective management virtual teams ppt powerpoint presentation infographics ideas cpb. This is a six stage process. The stages in this process are effective management virtual teams.
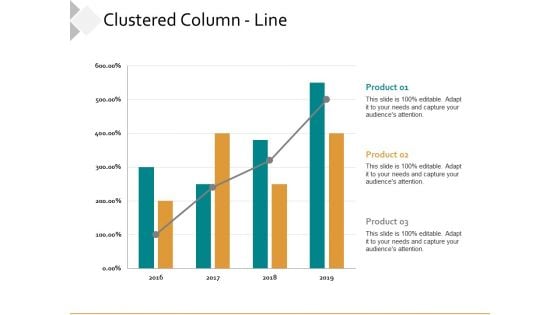
Clustered Column Line Ppt PowerPoint Presentation Summary Guidelines
This is a clustered column line ppt powerpoint presentation summary guidelines. This is a three stage process. The stages in this process are business, management, percentage, product, marketing.
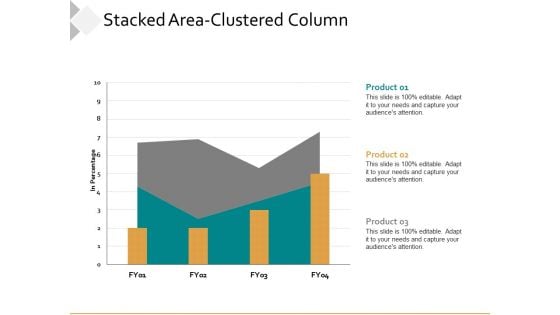
Stacked Area Clustered Column Ppt PowerPoint Presentation Model Slides
This is a stacked area clustered column ppt powerpoint presentation model slides. This is a three stage process. The stages in this process are business, management, percentage, product, marketing.
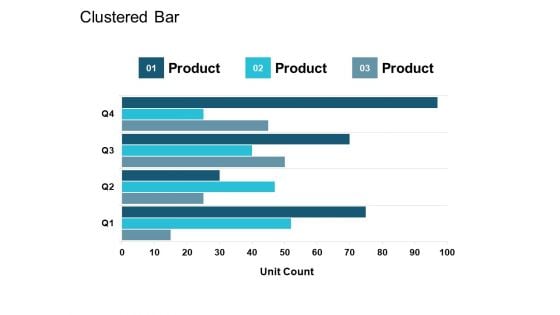
Clustered Bar Product Ppt PowerPoint Presentation Inspiration Elements
This is a clustered bar product ppt powerpoint presentation inspiration elements. This is a three stage process. The stages in this process are percentage, product, business, management, marketing.
Financial Percentage Ppt PowerPoint Presentation Icon Templates
This is a financial percentage ppt powerpoint presentation icon templates. This is a three stage process. The stages in this process are business, marketing, management, financial.

Comparison Male And Female Ppt PowerPoint Presentation File Styles
This is a comparison male and female ppt powerpoint presentation file styles. This is a two stage process. The stages in this process are business, marketing, management, compression.
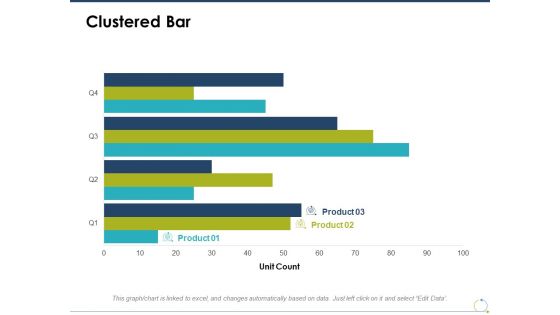
Clustered Bar Finance Ppt PowerPoint Presentation Model Grid
This is a clustered bar finance ppt powerpoint presentation model grid. This is a three stage process. The stages in this process are finance, marketing, management, investment.
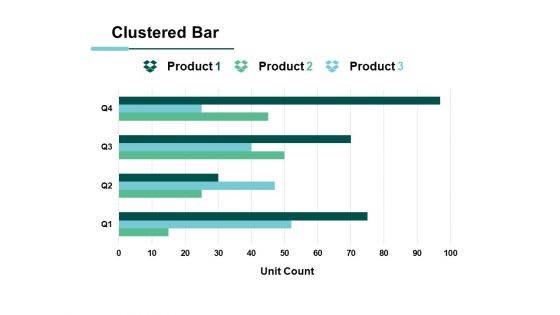
Clustered Bar Financial Ppt PowerPoint Presentation Model Format
This is a clustered bar financial ppt powerpoint presentation model format. This is a three stage process. The stages in this process are business, management, marketing, percentage, product.
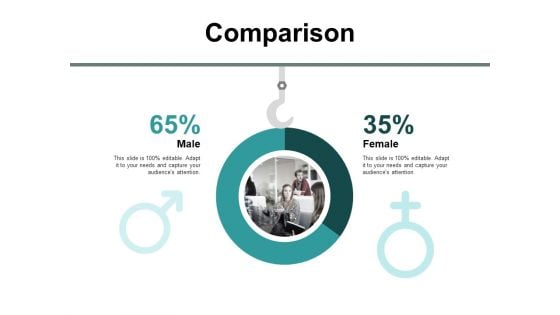
Comparison Male Female Ppt PowerPoint Presentation Show Influencers
This is a comparison male female ppt powerpoint presentation show influencers. This is a two stage process. The stages in this process are comparison, male, female, marketing, management.

Comparison Minimum Ppt PowerPoint Presentation File Visual Aids
This is a comparison minimum ppt powerpoint presentation file visual aids. This is a three stage process. The stages in this process are financial, maximum, medium, minimum, marketing.
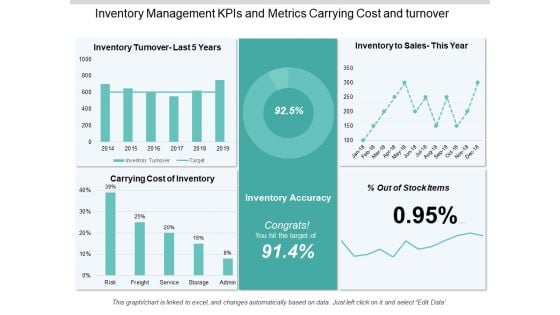
Inventory Management Kpis And Metrics Carrying Cost And Turnover Ppt PowerPoint Presentation Information
This is a inventory management kpis and metrics carrying cost and turnover ppt powerpoint presentation information. This is a five stage process. The stages in this process are logistics performance, logistics dashboard, logistics kpis.
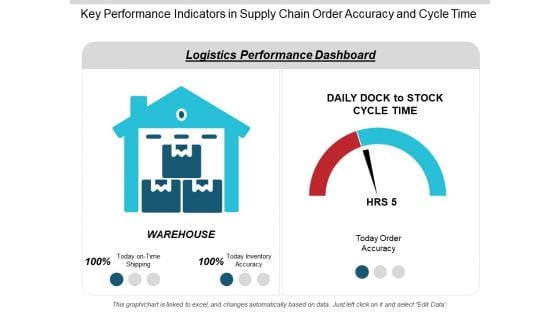
Key Performance Indicators In Supply Chain Order Accuracy And Cycle Time Ppt PowerPoint Presentation Infographics Slideshow
This is a key performance indicators in supply chain order accuracy and cycle time ppt powerpoint presentation infographics slideshow. This is a two stage process. The stages in this process are logistics performance, logistics dashboard, logistics kpis.

Kpis In Shipping Perfect Order Rate And On Time Shipment Ppt PowerPoint Presentation Show Guide
This is a kpis in shipping perfect order rate and on time shipment ppt powerpoint presentation show guide. This is a six stage process. The stages in this process are logistics performance, logistics dashboard, logistics kpis.
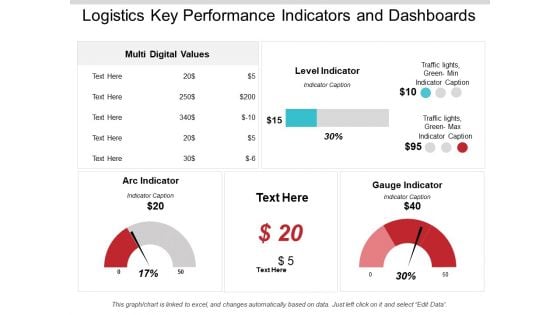
Logistics Key Performance Indicators And Dashboards Ppt PowerPoint Presentation Infographics Background Image
This is a logistics key performance indicators and dashboards ppt powerpoint presentation infographics background image. This is a three stage process. The stages in this process are logistics performance, logistics dashboard, logistics kpis.
Logistics Kpis And Metrics Percentage Of Orders Delivered Ppt PowerPoint Presentation Icon
This is a logistics kpis and metrics percentage of orders delivered ppt powerpoint presentation icon. This is a five stage process. The stages in this process are logistics performance, logistics dashboard, logistics kpis.
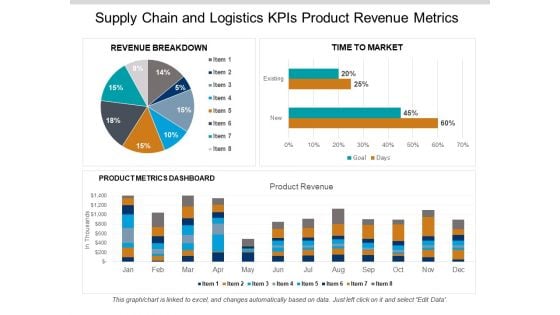
Supply Chain And Logistics Kpis Product Revenue Metrics Ppt PowerPoint Presentation Gallery Aids
This is a supply chain and logistics kpis product revenue metrics ppt powerpoint presentation gallery aids. This is a three stage process. The stages in this process are logistics performance, logistics dashboard, logistics kpis.
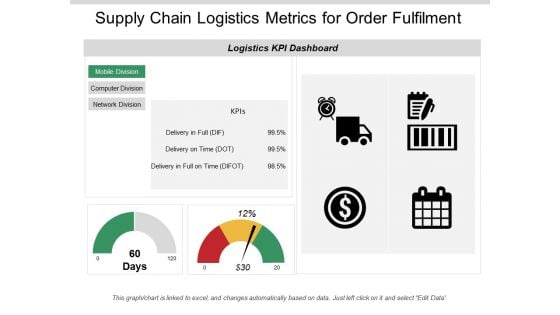
Supply Chain Logistics Metrics For Order Fulfilment Ppt PowerPoint Presentation Infographic Template Information
This is a supply chain logistics metrics for order fulfilment ppt powerpoint presentation infographic template information. This is a two stage process. The stages in this process are logistics performance, logistics dashboard, logistics kpis.

Supply Chain Metrics Fleet Efficiency Loading Time And Weight Ppt PowerPoint Presentation Portfolio Guidelines
This is a supply chain metrics fleet efficiency loading time and weight ppt powerpoint presentation portfolio guidelines. This is a four stage process. The stages in this process are logistics performance, logistics dashboard, logistics kpis.
Customer Satisfaction Levels High Medium Low Indicator Dashboard Ppt PowerPoint Presentation Icon Show
This is a customer satisfaction levels high medium low indicator dashboard ppt powerpoint presentation icon show. This is a six stage process. The stages in this process are performance dashboard, performance meter, performance kpi.
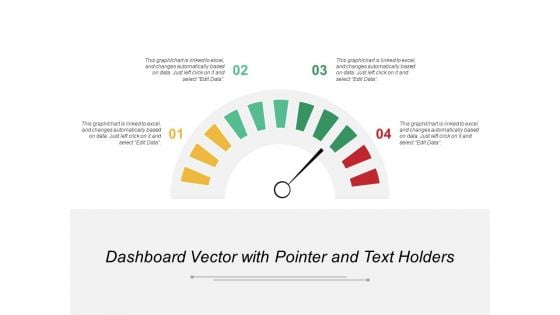
Dashboard Vector With Pointer And Text Holders Ppt PowerPoint Presentation Portfolio Format Ideas
This is a dashboard vector with pointer and text holders ppt powerpoint presentation portfolio format ideas. This is a four stage process. The stages in this process are performance dashboard, performance meter, performance kpi.
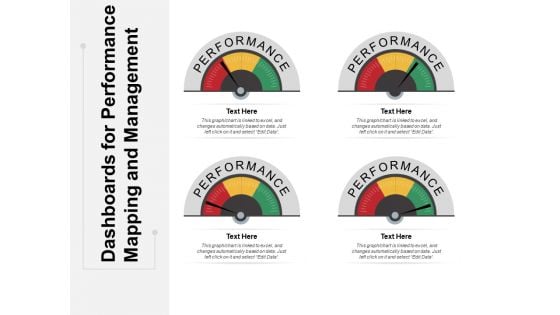
Dashboards For Performance Mapping And Management Ppt PowerPoint Presentation Ideas File Formats
This is a dashboards for performance mapping and management ppt powerpoint presentation ideas file formats. This is a four stage process. The stages in this process are performance dashboard, performance meter, performance kpi.


 Continue with Email

 Home
Home


