Dashboard Icon
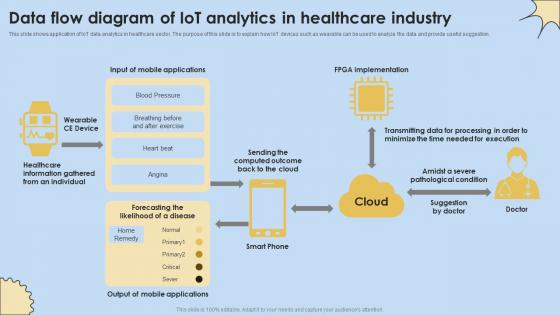
Data Flow Diagram Of IoT Analytics In Healthcare Industry Internet Of Things Analysis Clipart Pdf
This slide shows application of IoT data analytics in healthcare sector. The purpose of this slide is to explain how IoT devices such as wearable can be used to analyze the data and provide useful suggestion. If you are looking for a format to display your unique thoughts, then the professionally designed Data Flow Diagram Of IoT Analytics In Healthcare Industry Internet Of Things Analysis Clipart Pdf is the one for you. You can use it as a Google Slides template or a PowerPoint template. Incorporate impressive visuals, symbols, images, and other charts. Modify or reorganize the text boxes as you desire. Experiment with shade schemes and font pairings. Alter, share or cooperate with other people on your work. Download Data Flow Diagram Of IoT Analytics In Healthcare Industry Internet Of Things Analysis Clipart Pdf and find out how to give a successful presentation. Present a perfect display to your team and make your presentation unforgettable. This slide shows application of IoT data analytics in healthcare sector. The purpose of this slide is to explain how IoT devices such as wearable can be used to analyze the data and provide useful suggestion.
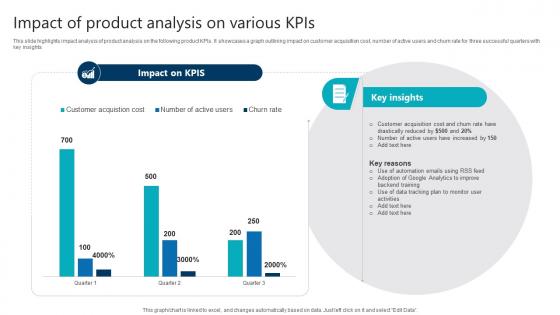
Impact Of Product Analysis On Various Kpis Product Analytics Implementation Data Analytics V
This slide highlights impact analysis of product analysis on the following product KPIs. It showcases a graph outlining impact on customer acquisition cost, number of active users and churn rate for three successful quarters with key insights Are you searching for a Impact Of Product Analysis On Various Kpis Product Analytics Implementation Data Analytics V that is uncluttered, straightforward, and original Its easy to edit, and you can change the colors to suit your personal or business branding. For a presentation that expresses how much effort you have put in, this template is ideal With all of its features, including tables, diagrams, statistics, and lists, its perfect for a business plan presentation. Make your ideas more appealing with these professional slides. Download Impact Of Product Analysis On Various Kpis Product Analytics Implementation Data Analytics V from Slidegeeks today. This slide highlights impact analysis of product analysis on the following product KPIs. It showcases a graph outlining impact on customer acquisition cost, number of active users and churn rate for three successful quarters with key insights
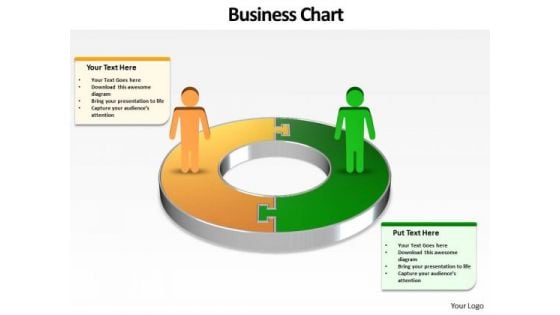
Ppt Busines Men Silhouettes Standing On Circular Chart PowerPoint Templates
PPT busines men silhouettes standing on circular chart PowerPoint Templates-Diagrams for PowerPoint Circle arrow offer an elegant alternative to the boring bullet points used in Presentations. The items are professionally animated and are easily editable. This diagram is useful to show interrelated factors, give and take interaction etc.-PPT busines men silhouettes standing on circular chart PowerPoint Templates-arrow, bar, board, business, button, calendar, chart, collection, computer, connection, data, demographics, design, document, earth, eco, elements, globe, graph, graphics, growth, icon, illustration, infochart, infographic, infomation, information, internet, label, map, modern, network, people, pie, presentation, recycle, report, sale, set, shape, sign, statistic, symbol, team, template, vector Your ideas will click with our Ppt Busines Men Silhouettes Standing On Circular Chart PowerPoint Templates. The audience will be in complete agreement.
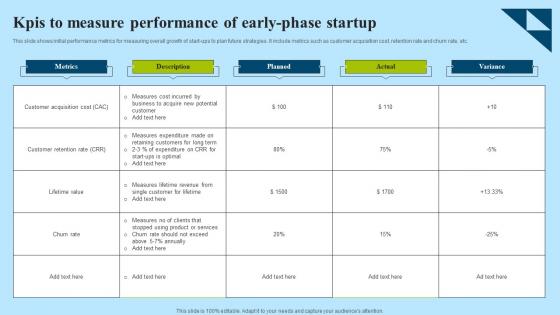
KPIs To Measure Performance Of Early Phase Startup Professional Pdf
This slide shows initial performance metrics for measuring overall growth of start-ups to plan future strategies. It include metrics such as customer acquisition cost, retention rate and churn rate, etc. Showcasing this set of slides titled KPIs To Measure Performance Of Early Phase Startup Professional Pdf. The topics addressed in these templates are Metrics, Description, Planned. All the content presented in this PPT design is completely editable. Download it and make adjustments in color, background, font etc. as per your unique business setting. This slide shows initial performance metrics for measuring overall growth of start-ups to plan future strategies. It include metrics such as customer acquisition cost, retention rate and churn rate, etc.
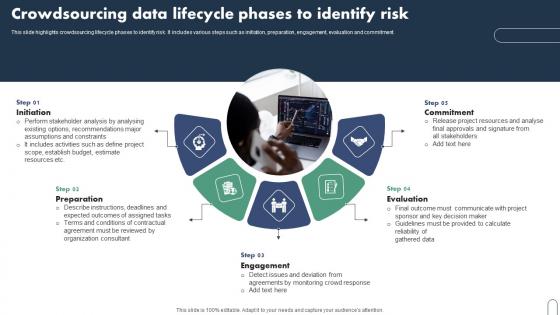
Crowdsourcing Data Lifecycle Phases To Identify Risk Pictures Pdf
This slide highlights crowdsourcing lifecycle phases to identify risk. It includes various steps such as initiation, preparation, engagement, evaluation and commitment. Pitch your topic with ease and precision using this Crowdsourcing Data Lifecycle Phases To Identify Risk Pictures Pdf This layout presents information on Preparation, Engagement, Evaluation, Commitment It is also available for immediate download and adjustment. So, changes can be made in the color, design, graphics or any other component to create a unique layout. This slide highlights crowdsourcing lifecycle phases to identify risk. It includes various steps such as initiation, preparation, engagement, evaluation and commitment.
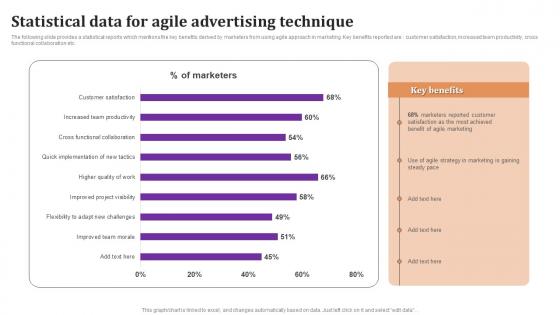
Statistical Data For Agile Advertising Technique Diagrams Pdf
The following slide provides a statistical reports which mentions the key benefits derived by marketers from using agile approach in marketing. Key benefits reported are customer satisfaction, increased team productivity, cross functional collaboration etc. Pitch your topic with ease and precision using this Statistical Data For Agile Advertising Technique Diagrams Pdf This layout presents information on Statistical Data, Agile Advertising, Technique It is also available for immediate download and adjustment. So, changes can be made in the color, design, graphics or any other component to create a unique layout. The following slide provides a statistical reports which mentions the key benefits derived by marketers from using agile approach in marketing. Key benefits reported are customer satisfaction, increased team productivity, cross functional collaboration etc.
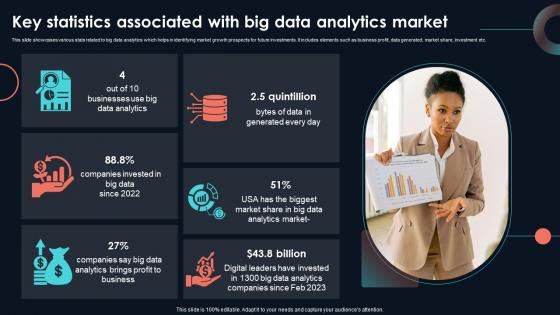
Key Statistics Associated With Big Data Developing Strategic Insights Using Big Data Analytics SS V
This slide showcases various stats related to big data analytics which helps in identifying market growth prospects for future investments. It includes elements such as business profit, data generated, market share, investment etc. If you are looking for a format to display your unique thoughts, then the professionally designed Key Statistics Associated With Big Data Developing Strategic Insights Using Big Data Analytics SS V is the one for you. You can use it as a Google Slides template or a PowerPoint template. Incorporate impressive visuals, symbols, images, and other charts. Modify or reorganize the text boxes as you desire. Experiment with shade schemes and font pairings. Alter, share or cooperate with other people on your work. Download Key Statistics Associated With Big Data Developing Strategic Insights Using Big Data Analytics SS V and find out how to give a successful presentation. Present a perfect display to your team and make your presentation unforgettable. This slide showcases various stats related to big data analytics which helps in identifying market growth prospects for future investments. It includes elements such as business profit, data generated, market share, investment etc.

Key Metrics Used To Track Product Analytics Product Analytics Implementation Data Analytics V
This slide outlines major metrics used by businesses to analyse product performance aimed at making necessary improvements. It covers key metrics such as engagement, retention, customer lifetime value, number of crashes and feature adoption rate with benefits Do you know about Slidesgeeks Key Metrics Used To Track Product Analytics Product Analytics Implementation Data Analytics V These are perfect for delivering any kind od presentation. Using it, create PowerPoint presentations that communicate your ideas and engage audiences. Save time and effort by using our pre-designed presentation templates that are perfect for a wide range of topic. Our vast selection of designs covers a range of styles, from creative to business, and are all highly customizable and easy to edit. Download as a PowerPoint template or use them as Google Slides themes. This slide outlines major metrics used by businesses to analyse product performance aimed at making necessary improvements. It covers key metrics such as engagement, retention, customer lifetime value, number of crashes and feature adoption rate with benefits
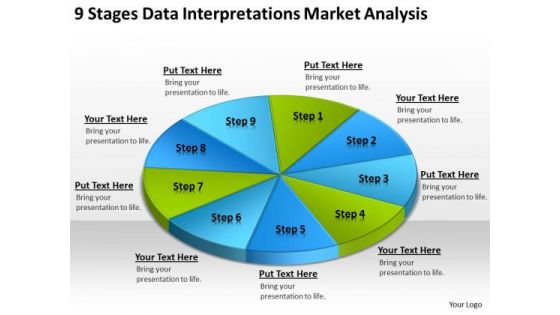
Data Interpretations Market Analysis Templates For Business Plan PowerPoint
We present our data interpretations market analysis templates for business plan PowerPoint.Present our Circle Charts PowerPoint Templates because Our PowerPoint Templates and Slides come in all colours, shades and hues. They help highlight every nuance of your views. Use our Business PowerPoint Templates because Our PowerPoint Templates and Slides will let you Hit the right notes. Watch your audience start singing to your tune. Download our Shapes PowerPoint Templates because Our PowerPoint Templates and Slides will fulfill your every need. Use them and effectively satisfy the desires of your audience. Present our Signs PowerPoint Templates because Our PowerPoint Templates and Slides will provide you a launch platform. Give a lift off to your ideas and send them into orbit. Use our Metaphors-Visual Concepts PowerPoint Templates because You have a driving passion to excel in your field. Our PowerPoint Templates and Slides will prove ideal vehicles for your ideas.Use these PowerPoint slides for presentations relating to business, chart, circle, circular, diagram, economy, finance, framework, graph, isolated, percentage, pie chart, results, scheme, statistics, stats, strategy, success. The prominent colors used in the PowerPoint template are Blue, Green, Blue light. Affiliate our Data Interpretations Market Analysis Templates For Business Plan PowerPoint to your thoughts. They will develop an affinity for them.
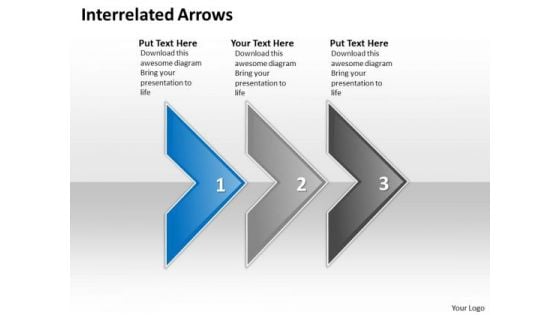
Ppt Interrelated Arrows Three Practice The PowerPoint Macro Steps Business Templates
PPT interrelated arrows three practice the powerpoint macro steps Business Templates-Use this graphical approach to represent global business issues such as financial data, stock market Exchange, increase in sales, corporate presentations and more. This image has been conceived to enable you to emphatically communicate your ideas in your Business, Marketing PPT presentation.-PPT interrelated arrows three practice the powerpoint macro steps Business Templates-Aim, Arrow, Arrowheads, Badge, Border, Click, Connection, Curve, Design, Direction, Download, Element, Fuchsia, Icon, Illustration, Indicator, Internet, Magenta, Mark, Object, Orientation, Pointer, Shadow, Shape, Sign Achieve high-performance with our Ppt Interrelated Arrows Three Practice The PowerPoint Macro Steps Business Templates. They will make you look good.

Graph Illustrating Impact Of Prescriptive Analytics Data Analytics SS V
This slide showcases graph highlighting impact analysis of prescriptive analytics on businesses via use of major performance indicators. It provides information total revenue, inventory levels and labour costs with key insights.Take your projects to the next level with our ultimate collection of Graph Illustrating Impact Of Prescriptive Analytics Data Analytics SS V. Slidegeeks has designed a range of layouts that are perfect for representing task or activity duration, keeping track of all your deadlines at a glance. Tailor these designs to your exact needs and give them a truly corporate look with your own brand colors they will make your projects stand out from the rest This slide showcases graph highlighting impact analysis of prescriptive analytics on businesses via use of major performance indicators. It provides information total revenue, inventory levels and labour costs with key insights.
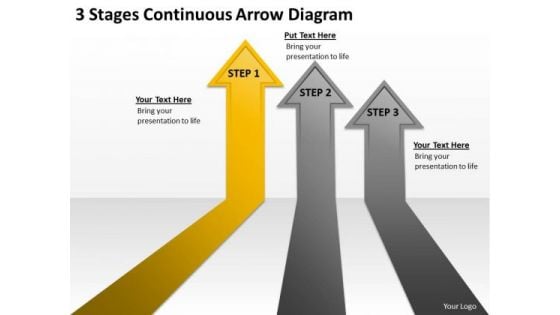
PowerPoint Arrows Diagram Templates Backgrounds For Slides
abstract, arrow, arrowhead, art, aspiration, backdrop, background, blue, color, concept, cool, data, design, diagram, direction, effect, element, frame, funky, graphic, graphs, icon, idea, illustration, investment, line, modern, motion, moving, painting, paper, perspective, print, red, sales, set, shape, shiny, sign, speed, striped, style, success, symbol, technology, up, vector, way, yellow Be an organizational driver with our PowerPoint Arrows Diagram Templates Backgrounds For Slides. They will make you look good.
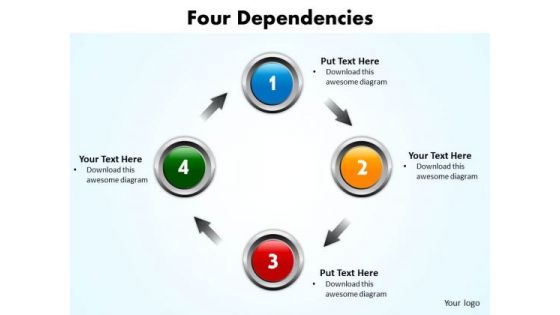
Ppt Four Dependencies PowerPoint Templates
PPT four dependencies PowerPoint Templates--PowerPoint presentations on Accuracy, Accurate, Aim, Arrow, Ball, Dependencies, , Business, Center, Circle, Color, Communication, Competition, Concept, Connection, Corporate, Design, Direction, Excellence, Global, Goal, Graphic, Group, Hit, Icon, Idea, Illustration, Isolated, Jackpot, Logo, Mark, Nobody, Perfect, Performance, Point, Pointer, Precise, Precision, Purpose, Red, Round, Score, Shape, Sign, Sphere, Spot, Succes-PPT four dependencies PowerPoint Templates Create alliances with our Ppt Four Dependencies PowerPoint Templates. Generate familiarity within your team.
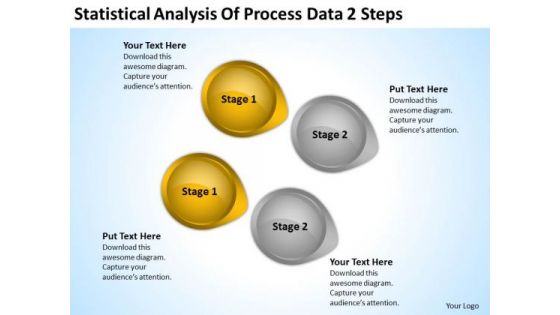
Levels Of Parallel Processing Data 2 Steps Ppt PowerPoint Templates Backgrounds For Slides
We present our levels of parallel processing data 2 steps ppt PowerPoint templates backgrounds for slides.Download and present our Business PowerPoint Templates because Our PowerPoint Templates and Slides will embellish your thoughts. See them provide the desired motivation to your team. Present our Circle Charts PowerPoint Templates because Our PowerPoint Templates and Slides offer you the needful to organise your thoughts. Use them to list out your views in a logical sequence. Download and present our Arrows PowerPoint Templates because Our PowerPoint Templates and Slides provide you with a vast range of viable options. Select the appropriate ones and just fill in your text. Present our Shapes PowerPoint Templates because Our PowerPoint Templates and Slides team portray an attitude of elegance. Personify this quality by using them regularly. Use our Signs PowerPoint Templates because Our PowerPoint Templates and Slides offer you the needful to organise your thoughts. Use them to list out your views in a logical sequence.Use these PowerPoint slides for presentations relating to 3d, abstract, analysis, arrow, background, business, button, chart, circle, circular, color, concept, conservation, cycle, development, diagram, direction, eco, ecology, energy, environment, flow, flowchart, globe, graphic, growing, growth, icon, internet, isolated, object, power, process, protection, recyclable, recycle, recycling, render, resource, saving, sign, solution, sphere, statistic, sustainable, symbol, technology, white. The prominent colors used in the PowerPoint template are Brown, Gray, Black. You can be sure our levels of parallel processing data 2 steps ppt PowerPoint templates backgrounds for slides look good visually. People tell us our analysis PowerPoint templates and PPT Slides are specially created by a professional team with vast experience. They diligently strive to come up with the right vehicle for your brilliant Ideas. You can be sure our levels of parallel processing data 2 steps ppt PowerPoint templates backgrounds for slides will impress their bosses and teams. Use our chart PowerPoint templates and PPT Slides are the best it can get when it comes to presenting. Presenters tell us our levels of parallel processing data 2 steps ppt PowerPoint templates backgrounds for slides look good visually. We assure you our chart PowerPoint templates and PPT Slides are topically designed to provide an attractive backdrop to any subject. Our Levels Of Parallel Processing Data 2 Steps Ppt PowerPoint Templates Backgrounds For Slides put your thoughts in a capsule. Deliver it to them in the correct doses.

Global Data Security Industry Report Powerpoint Presentation Slides IR V
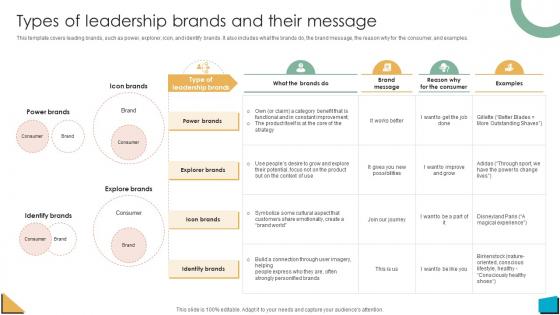
Brand Authority Types Of Leadership Brands And Their Message Strategy SS V
This template covers leading brands, such as power, explorer, icon, and identify brands. It also includes what the brands do, the brand message, the reason why for the consumer, and examples. This Brand Authority Types Of Leadership Brands And Their Message Strategy SS V from Slidegeeks makes it easy to present information on your topic with precision. It provides customization options, so you can make changes to the colors, design, graphics, or any other component to create a unique layout. It is also available for immediate download, so you can begin using it right away. Slidegeeks has done good research to ensure that you have everything you need to make your presentation stand out. Make a name out there for a brilliant performance. This template covers leading brands, such as power, explorer, icon, and identify brands. It also includes what the brands do, the brand message, the reason why for the consumer, and examples.
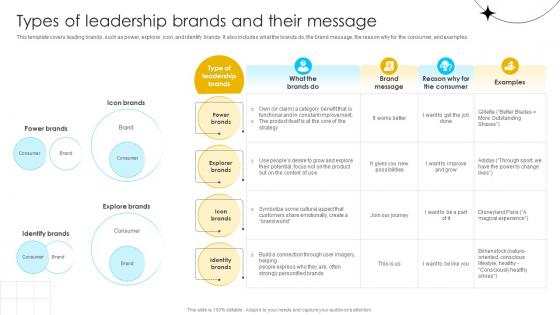
Brand Influence Types Of Leadership Brands And Their Message Strategy SS V
This template covers leading brands, such as power, explorer, icon, and identify brands. It also includes what the brands do, the brand message, the reason why for the consumer, and examples. This Brand Influence Types Of Leadership Brands And Their Message Strategy SS V from Slidegeeks makes it easy to present information on your topic with precision. It provides customization options, so you can make changes to the colors, design, graphics, or any other component to create a unique layout. It is also available for immediate download, so you can begin using it right away. Slidegeeks has done good research to ensure that you have everything you need to make your presentation stand out. Make a name out there for a brilliant performance. This template covers leading brands, such as power, explorer, icon, and identify brands. It also includes what the brands do, the brand message, the reason why for the consumer, and examples.
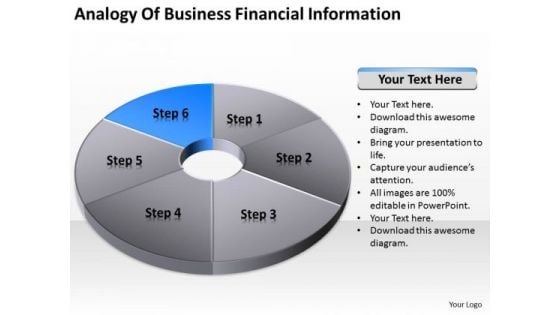
Pie Donut Diagram 6 Stages Ppt Free Downloadable Business Plan Template PowerPoint Templates
We present our pie donut diagram 6 stages ppt free downloadable business plan template PowerPoint templates.Present our Finance PowerPoint Templates because Our PowerPoint Templates and Slides are a sure bet. Gauranteed to win against all odds. Use our Marketing PowerPoint Templates because They will Put the wind in your sails. Skim smoothly over the choppy waters of the market. Present our Money PowerPoint Templates because Our PowerPoint Templates and Slides are conceived by a dedicated team. Use them and give form to your wondrous ideas. Download our Success PowerPoint Templates because Our PowerPoint Templates and Slides are designed to help you succeed. They have all the ingredients you need. Download our Business PowerPoint Templates because It will Give impetus to the hopes of your colleagues. Our PowerPoint Templates and Slides will aid you in winning their trust.Use these PowerPoint slides for presentations relating to Pie, Chart, Market, Statistics, Sales, Slice, Economy, Display, Corporate, Business, Concept, Render, Success, Presentation, Diagram, Percentage, Graphic, Finance, Data, Bank, Report, Marketing, Accounting, Management, Graph, Illustration, Icon, Piece, Strategy, Money, Growth, Company, Control, Competition, Progress, Account, Sheet, Profit, Part, Information, Investment, Improvement, Banking, Index, Financial. The prominent colors used in the PowerPoint template are Blue, Gray, White. With our Pie Donut Diagram 6 Stages Ppt Free Downloadable Business Plan Template PowerPoint Templates the goal is never far away. Your thoughts will always dribble through.
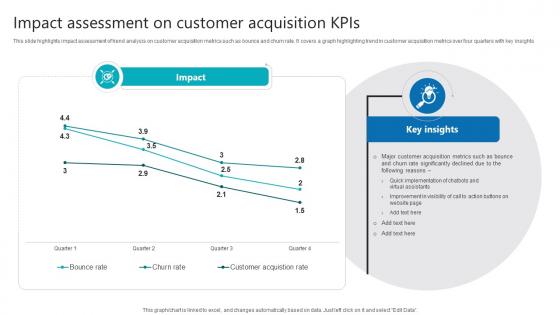
Impact Assessment On Customer Acquisition Kpis Product Analytics Implementation Data Analytics V
This slide highlights impact assessment of trend analysis on customer acquisition metrics such as bounce and churn rate. It covers a graph highlighting trend in customer acquisition metrics over four quarters with key insights The Impact Assessment On Customer Acquisition Kpis Product Analytics Implementation Data Analytics V is a compilation of the most recent design trends as a series of slides. It is suitable for any subject or industry presentation, containing attractive visuals and photo spots for businesses to clearly express their messages. This template contains a variety of slides for the user to input data, such as structures to contrast two elements, bullet points, and slides for written information. Slidegeeks is prepared to create an impression. This slide highlights impact assessment of trend analysis on customer acquisition metrics such as bounce and churn rate. It covers a graph highlighting trend in customer acquisition metrics over four quarters with key insights
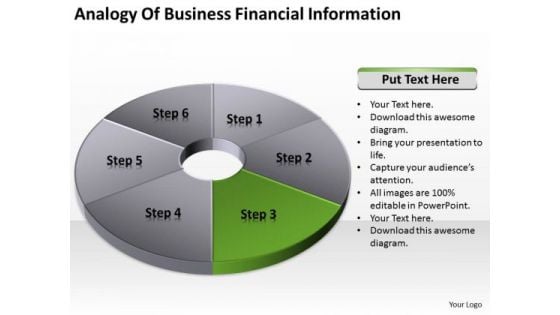
Pie Donut Diagram 6 Stages Professional Business Plan Template PowerPoint Templates
We present our pie donut diagram 6 stages professional business plan template PowerPoint templates.Use our Finance PowerPoint Templates because Our PowerPoint Templates and Slides come in all colours, shades and hues. They help highlight every nuance of your views. Present our Marketing PowerPoint Templates because Our PowerPoint Templates and Slides are effectively colour coded to prioritise your plans They automatically highlight the sequence of events you desire. Download and present our Money PowerPoint Templates because It can be used to Set your controls for the heart of the sun. Our PowerPoint Templates and Slides will be the propellant to get you there. Download and present our Success PowerPoint Templates because Our PowerPoint Templates and Slides will let your words and thoughts hit bullseye everytime. Download and present our Business PowerPoint Templates because Our PowerPoint Templates and Slides are conceived by a dedicated team. Use them and give form to your wondrous ideas.Use these PowerPoint slides for presentations relating to Pie, Chart, Market, Statistics, Sales, Slice, Economy, Display, Corporate, Business, Concept, Render, Success, Presentation, Diagram, Percentage, Graphic, Finance, Data, Bank, Report, Marketing, Accounting, Management, Graph, Illustration, Icon, Piece, Strategy, Money, Growth, Company, Control, Competition, Progress, Account, Sheet, Profit, Part, Information, Investment, Improvement, Banking, Index, Financial. The prominent colors used in the PowerPoint template are Green, Gray, White. You will find our Pie Donut Diagram 6 Stages Professional Business Plan Template PowerPoint Templates fighting fit. They will give you able-bodied assistance.
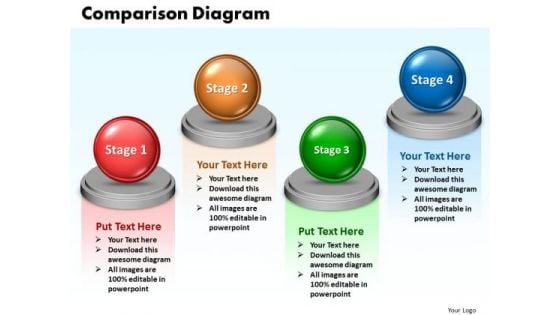
Ppt Comparison Network Diagram PowerPoint Template 4 Phase Templates
PPT comparison network diagram powerpoint template 4 phase Templates-This PowerPoint diagram slide shows four opposing views. You can use the This PowerPoint diagram slide to represent views from different functions on an issue.-PPT comparison network diagram powerpoint template 4 phase Templates-Abstract, Achievement, Business, Chart, Comparison, Concepts, Data, Descriptive, Design, Development, Diagram, Element, Figure, Finance, Financial, Graph, Graphic, Growth, Icon, Ideas, Improvement, Investment, Market, Money, Progress, Raise, Real, Report, Revenue, Sale, Shape, Sign, Silhouette, Stock, Success, Symbol, Technology Reveal the depth of your knowledge. Showcase your erudition on our Ppt Comparison Network Diagram PowerPoint Template 4 Phase Templates.
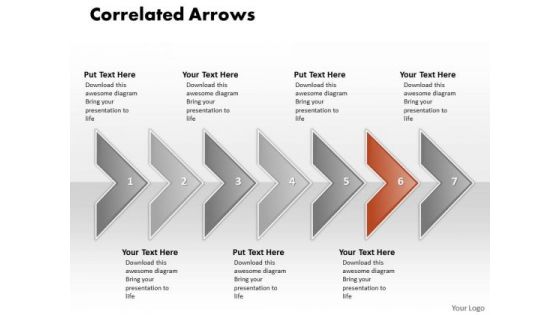
Ppt 7 Phase Diagram Correlated Arrows In Horizontal Line PowerPoint Templates
PPT 7 phase diagram correlated arrows in horizontal line PowerPoint Templates-The above template contains a graphic of seven arrows in straight line. This image signifies the concept of correlated activities. Adjust the above image in your PPT presentations to visually support your content in your PPT slideshows related to Market surveys, Statistics and Analysis. Create captivating presentations to deliver comparative facts and figures.-PPT 7 phase diagram correlated arrows in horizontal line PowerPoint Templates-Aim, Arrow, Badge, Border, Color, Connection, Curve, Design, Direction, Download, Icon, Illustration, Indicator, Internet, Label, Link, Magenta, Mark, Next, Object, Orientation, Paper, Peeling, Pointer, Rounded, Set, Shadow, Shape, Sign Educate your team with a winning presentation with our Ppt 7 Phase Diagram Correlated Arrows In Horizontal Line PowerPoint Templates. You will come out on top.
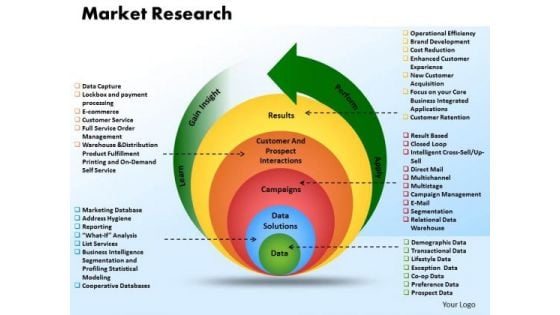
Business Circle Chart PowerPoint Templates Business Market Research Data Ppt Slides
Business Circle Chart PowerPoint Templates Business market research data PPT Slides-\nThis PowerPoint diagram slide shows a circular process withan arrow. Useful to represent process slides-Business Circle Chart PowerPoint Templates Business market research data PPT Slides-This template can be used for presentations relating to 3d, Abstract, Around, Arrow, Background, Bright, Business, Card, Chart, Circle, Circular, Circulation, Collection, Colorful, Communication, Concept, Cycle, Cyclic, Design, Direction, Element, Flow, Glass, Glossy, Graphic, Icon, Illustration, Modern, Motion, Network Crown yourself with our Business Circle Chart PowerPoint Templates Business Market Research Data Ppt Slides. You will acquire the feel of a champion.
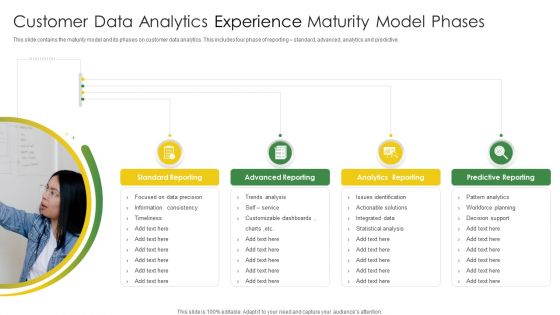
Customer Data Analytics Experience Maturity Model Phases Download PDF
This slide contains the maturity model and its phases on customer data analytics. This includes four phase of reporting standard, advanced, analytics and predictive. Presenting Customer Data Analytics Experience Maturity Model Phases Download PDF to dispense important information. This template comprises four stages. It also presents valuable insights into the topics including Advanced Reporting, Analytics Reporting, Predictive Reporting, Standard Reporting. This is a completely customizable PowerPoint theme that can be put to use immediately. So, download it and address the topic impactfully.
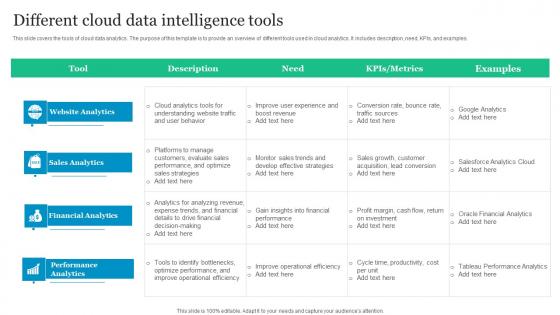
Different Cloud Data Intelligence Tools Themes Pdf
This slide covers the tools of cloud data analytics. The purpose of this template is to provide an overview of different tools used in cloud analytics. It includes description, need, KPIs, and examples. Showcasing this set of slides titled Different Cloud Data Intelligence Tools Themes Pdf. The topics addressed in these templates are Website Analytics, Sales Analytics, Financial Analytics. All the content presented in this PPT design is completely editable. Download it and make adjustments in color, background, font etc. as per your unique business setting. This slide covers the tools of cloud data analytics. The purpose of this template is to provide an overview of different tools used in cloud analytics. It includes description, need, KPIs, and examples.
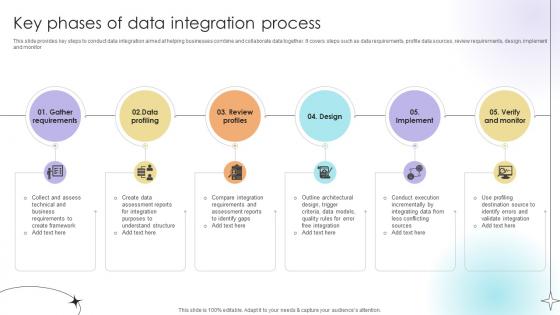
Key Phases Of Data Integration Process Data Analytics SS V
This slide provides key steps to conduct data integration aimed at helping businesses combine and collaborate data together. It covers steps such as data requirements, profile data sources, review requirements, design, implement and monitor.Slidegeeks is here to make your presentations a breeze with Key Phases Of Data Integration Process Data Analytics SS V With our easy-to-use and customizable templates, you can focus on delivering your ideas rather than worrying about formatting. With a variety of designs to choose from, you are sure to find one that suits your needs. And with animations and unique photos, illustrations, and fonts, you can make your presentation pop. So whether you are giving a sales pitch or presenting to the board, make sure to check out Slidegeeks first This slide provides key steps to conduct data integration aimed at helping businesses combine and collaborate data together. It covers steps such as data requirements, profile data sources, review requirements, design, implement and monitor.
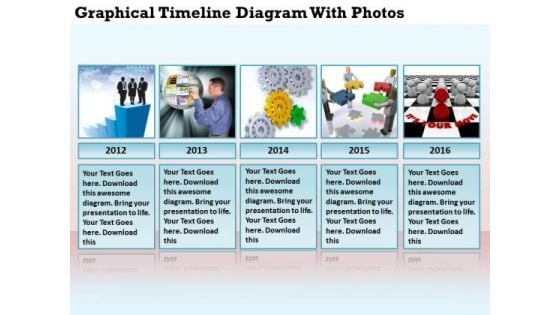
Business Charts Graphical Timeline Diagram With Photos PowerPoint Slides
We present our business charts graphical timeline diagram with photos PowerPoint Slides.Use our Spheres PowerPoint Templates because Our PowerPoint Templates and Slides will let you Hit the target. Go the full distance with ease and elan. Download and present our Business PowerPoint Templates because Our PowerPoint Templates and Slides will embellish your thoughts. See them provide the desired motivation to your team. Download and present our Marketing PowerPoint Templates because Our PowerPoint Templates and Slides will let you meet your Deadlines. Download our Flow Charts PowerPoint Templates because Our PowerPoint Templates and Slides will bullet point your ideas. See them fall into place one by one. Present our Future PowerPoint Templates because Our PowerPoint Templates and Slides will definately Enhance the stature of your presentation. Adorn the beauty of your thoughts with their colourful backgrounds.Use these PowerPoint slides for presentations relating to Agenda, agendum, arrow, art, bar, board, business, button, calendar, chart, data,design, developments, diagram, economics, elements, graph, graphics, growth,icon, illustration, infochart, infographic, infomation, information, life, meeting,modern, month, number, organizer, pointer, presentation, proceedings,report, set, sign, statistic, structure, symbol, tag, time, timeframe, timeline, vector, visualization. The prominent colors used in the PowerPoint template are Blue light, Gray, White. Concentrate on the assignment with our Business Charts Graphical Timeline Diagram With Photos PowerPoint Slides. Don't give a fig about other issues.
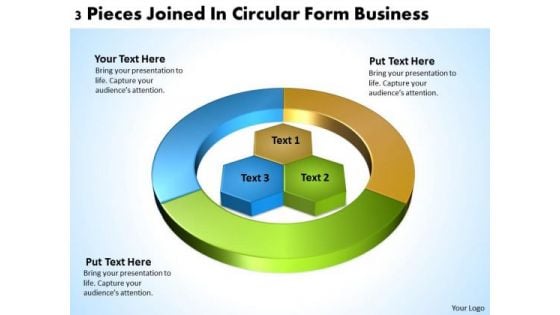
Joined Circular Form Business PowerPoint Theme Plans Software Slides
We present our joined circular form business powerpoint theme plans software Slides.Download our Hexagon PowerPoint Templates because They will Put the wind in your sails. Skim smoothly over the choppy waters of the market. Download and present our Circle Charts PowerPoint Templates because You can Zap them with our PowerPoint Templates and Slides. See them reel under the impact. Download and present our Circle Charts PowerPoint Templates because It will get your audience in sync. Download and present our Ring Charts PowerPoint Templates because You have gained great respect for your brilliant ideas. Use our PowerPoint Templates and Slides to strengthen and enhance your reputation. Download and present our Shapes PowerPoint Templates because Our PowerPoint Templates and Slides are designed to help you succeed. They have all the ingredients you need.Use these PowerPoint slides for presentations relating to process, diagram, business, project, arrow, flow, icon, chart, art, market, isolated, statistics, percent, economy, white, blank, concept, value, circle, graphic, data, element, report, management, graph, wheel, cycle, design, growth, profit, information, background, financial, adding. The prominent colors used in the PowerPoint template are Yellow, Blue, Green. Demonstrate your work ethic with our Joined Circular Form Business PowerPoint Theme Plans Software Slides. Give credence to your impeccable reputation.
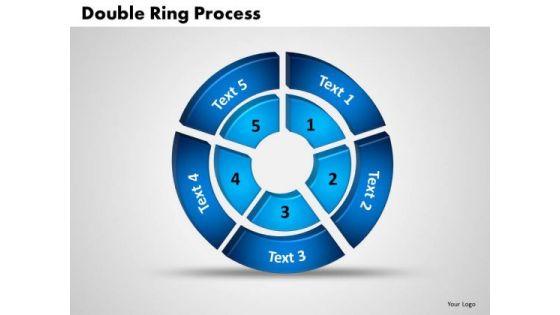
PowerPoint Templates Double Ring Success Ppt Design
PowerPoint Templates Double Ring Success PPT Design-You can embed your own ideas to this diagram make it more innovative and attractive.-3d, blue, ring process, chart, double, circle, circular, continuity, cycle, diagram, dimensional, graph, green, icon, motion, movement, pattern, process, pie, recycling, red, repetition, report, ring, round, scheme, section, set, sign, slice, spinning, turn, vector-PowerPoint Templates Double Ring Success PPT Design Make our PowerPoint Templates Double Ring Success Ppt Design the abode for your thoughts. They will exist in complete comfort.
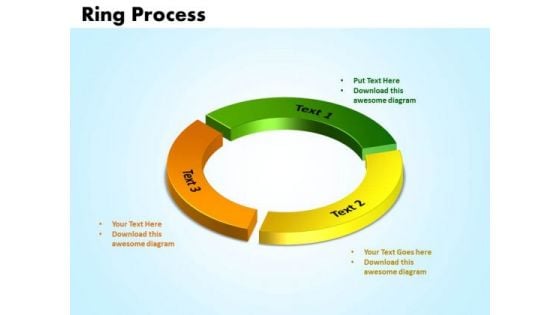
PowerPoint Templates Ring Process Business Ppt Slides
PowerPoint Templates ring process Business PPT Slides-Use this ring process diagram to represent a continuing sequence of stages, tasks, or events in a circular flow. -3d, blue, ring process, chart, circle, circular, continuity, cycle, diagram, dimensional, graph, green, icon, motion, movement, pattern, process, pie, recycling, red, repetition, report, ring, round, scheme, section, set, sign, slice, spinning, turn, vector-PowerPoint Templates ring process Business PPT Slides Our PowerPoint Templates Ring Process Business Ppt Slides will elevate the experience. Lift your thoughts to a higher plane.
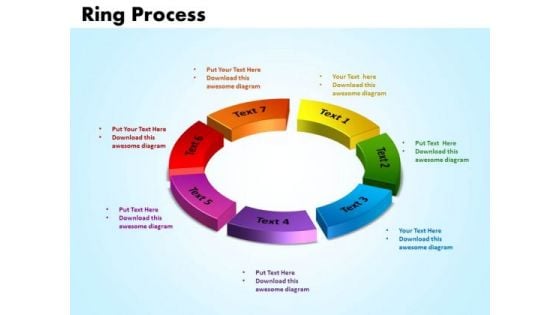
PowerPoint Templates Ring Process Download Ppt Design
PowerPoint Templates Ring Process Download PPT Design-Use this ring process diagram to represent a continuing sequence of stages, tasks, or events in a circular flow. -3d, blue, ring process, chart, circle, circular, continuity, cycle, diagram, dimensional, graph, green, icon, motion, movement, pattern, process, pie, recycling, red, repetition, report, ring, round, scheme, section, set, sign, slice, spinning, turn, vector-PowerPoint Templates Ring Process Download PPT Design Our PowerPoint Templates Ring Process Download Ppt Design are based on experience. They do not contain anything fanciful.
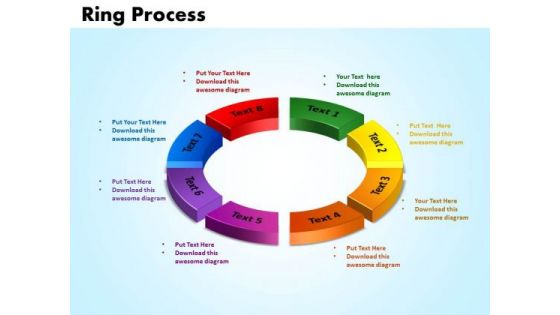
PowerPoint Presentation Ring Process Success Ppt Template
PowerPoint Presentation Ring Process Success PPT Template-Highlight the stages and steps of a business process or flow with this ring process Success PPT template.-3d, blue, ring process, chart, circle, circular, continuity, cycle, diagram, dimensional, graph, green, icon, motion, movement, pattern, process, pie, recycling, red, repetition, report, ring, round, scheme, section, set, sign, slice, spinning, turn, vector-PowerPoint Presentation Ring Process Success PPT Template Confirm to them that you are the expert. Our PowerPoint Presentation Ring Process Success Ppt Template will affirm your thoughts.
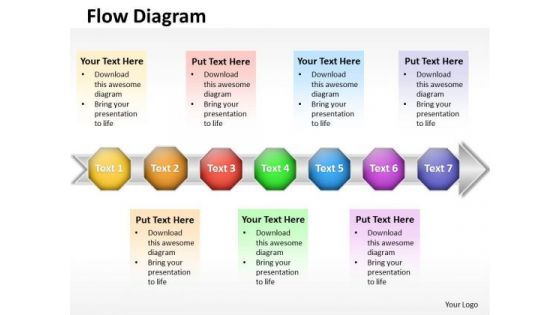
Ppt 7 Sequential Stages New Business PowerPoint Presentation Data Flow Diagram Templates
PPT 7 sequential stages new business PowerPoint presentation data flow diagram Templates-This PowerPoint Diagram shows you the Homogeneous Abstraction of seven approaches on the Arrow. It shows the successive concepts used in a procedure. This diagram will fit for Business Presentations. -PPT 7 sequential stages new business PowerPoint presentation data flow diagram Templates-arrow, art, assess, blue, business, chart, chevron, clip, clipart, colorful, compliance, corporate, design, development, diagram, flow, glossy, graphic, hierarchy, icon, illustration, implement, info graphic, levels, marketing, modern, plan, process, shape, shiny, square, stages, vector Compel your team with our Ppt 7 Sequential Stages New Business PowerPoint Presentation Data Flow Diagram Templates. Download without worries with our money back guaranteee.
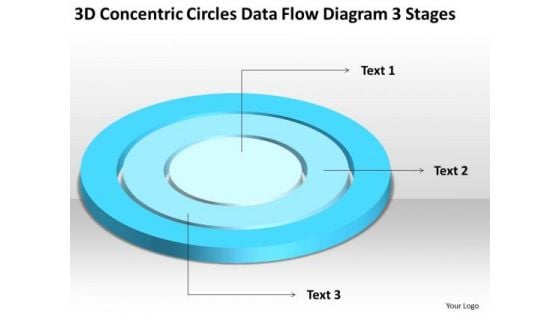
Concentric Circles Data Flow Diagram 3 Stages Business Plan For Non Profit PowerPoint Slides
We present our concentric circles data flow diagram 3 stages business plan for non profit PowerPoint Slides.Present our Circle Charts PowerPoint Templates because Our PowerPoint Templates and Slides team portray an attitude of elegance. Personify this quality by using them regularly. Download our Shapes PowerPoint Templates because You will get more than you ever bargained for. Download our Signs PowerPoint Templates because Timeline crunches are a fact of life. Meet all deadlines using our PowerPoint Templates and Slides. Use our Maketing PowerPoint Templates because you can Add colour to your speech with our PowerPoint Templates and Slides. Your presentation will leave your audience speechless. Use our Metaphors-Visual Concepts PowerPoint Templates because Our PowerPoint Templates and Slides are like the strings of a tennis racquet. Well strung to help you serve aces.Use these PowerPoint slides for presentations relating to diagram, circular, market, bar, advertise, interface, business, concept, vector, sign, success, presentation, symbol, template, circle, brochure, finance, data, description, report, marketing, title, label, abstract, management, graph, four, illustration, icon, pie, chart, strategy, catalog, research, web, design, growth, text, professional, banner, account, profit, information, background, info-graphic, analyze, financial, button, goals. The prominent colors used in the PowerPoint template are Blue, Blue light, White. Our Concentric Circles Data Flow Diagram 3 Stages Business Plan For Non Profit PowerPoint Slides are evidently advantageous. The balance will tilt in your favour.
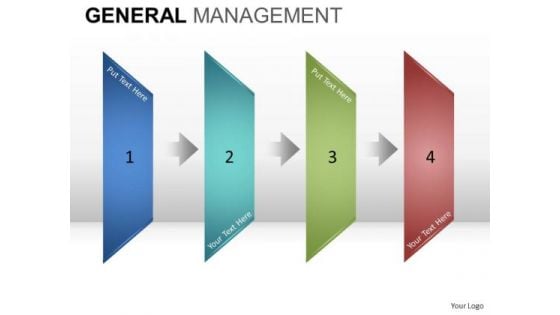
PowerPoint Templates Screeing Process Ppt Slides Download
PowerPoint_Templates_Screeing_Process_PPT_Slides_Download-These high quality powerpoint pre-designed slides and powerpoint templates have been carefully created by our professional team to help you impress your audience. All slides have been created and are 100% editable in powerpoint. Each and every property of any graphic - color, size, orientation, shading, outline etc. can be modified to help you build an effective powerpoint presentation. Any text can be entered at any point in the powerpoint template or slide. Simply DOWNLOAD, TYPE and PRESENT! These PowerPoint presentation slides can be used to represent themes relating to --Abstract, action, analysis, blank, business, chart, clipart, commerce, concept, conceptual, design, diagram, direction, flow, generic, goals, guide, guidelines, heirarchy, icon, idea, illustration, lingakes, links, manage, management, mba, model, organization, performance, plan, process, project, relationship, representation, resource, steps, strategy, success, tactics, theoretical, theory, tool, workflow-PowerPoint_Templates_Screeing_Process_PPT_Slides_Download Put up the facts and figures on our PowerPoint Templates Screeing Process Ppt Slides Download. Display the data for everyone's consumption.
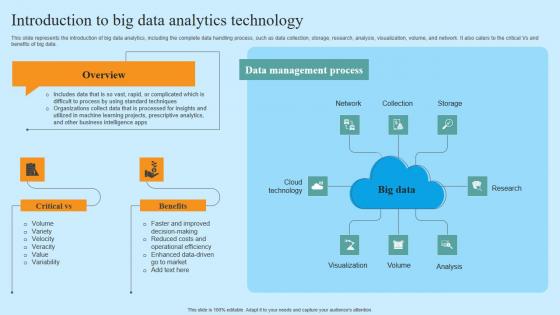
Introduction To Big Data Analytics Technology Hyper Automation Solutions Designs Pdf
This slide represents the introduction of big data analytics, including the complete data handling process, such as data collection, storage, research, analysis, visualization, volume, and network. It also caters to the critical Vs and benefits of big data. Retrieve professionally designed Introduction To Big Data Analytics Technology Hyper Automation Solutions Designs Pdf to effectively convey your message and captivate your listeners. Save time by selecting pre-made slideshows that are appropriate for various topics, from business to educational purposes. These themes come in many different styles, from creative to corporate, and all of them are easily adjustable and can be edited quickly. Access them as PowerPoint templates or as Google Slides themes. You do not have to go on a hunt for the perfect presentation because Slidegeeks got you covered from everywhere. This slide represents the introduction of big data analytics, including the complete data handling process, such as data collection, storage, research, analysis, visualization, volume, and network. It also caters to the critical Vs and benefits of big data.
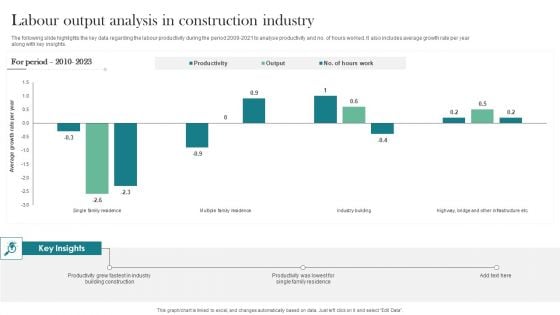
Labour Output Analysis In Construction Industry Information PDF
The following slide highlights the key data regarding the labour productivity during the period 2009 2021 to analyse productivity and no. of hours worked. It also includes average growth rate per year along with key insights. Showcasing this set of slides titled Labour Output Analysis In Construction Industry Information PDF. The topics addressed in these templates are Labour Construction, Output Analysis Icon. All the content presented in this PPT design is completely editable. Download it and make adjustments in color, background, font etc. as per your unique business setting.
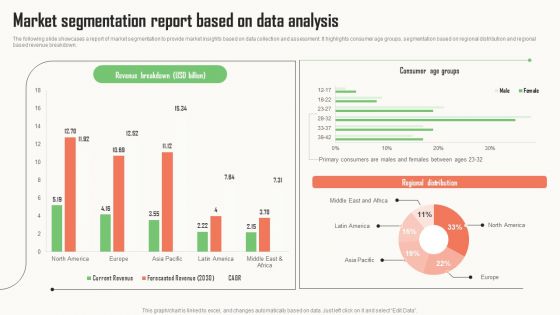
Strategic Market Insight Implementation Guide Market Segmentation Report Based On Data Analysis Themes PDF
The following slide showcases a report of market segmentation to provide market insights based on data collection and assessment. It highlights consumer age groups, segmentation based on regional distribution and regional based revenue breakdown. Presenting this PowerPoint presentation, titled Strategic Market Insight Implementation Guide Market Segmentation Report Based On Data Analysis Themes PDF, with topics curated by our researchers after extensive research. This editable presentation is available for immediate download and provides attractive features when used. Download now and captivate your audience. Presenting this Strategic Market Insight Implementation Guide Market Segmentation Report Based On Data Analysis Themes PDF. Our researchers have carefully researched and created these slides with all aspects taken into consideration. This is a completely customizable Strategic Market Insight Implementation Guide Market Segmentation Report Based On Data Analysis Themes PDF that is available for immediate downloading. Download now and make an impact on your audience. Highlight the attractive features available with our PPTs.
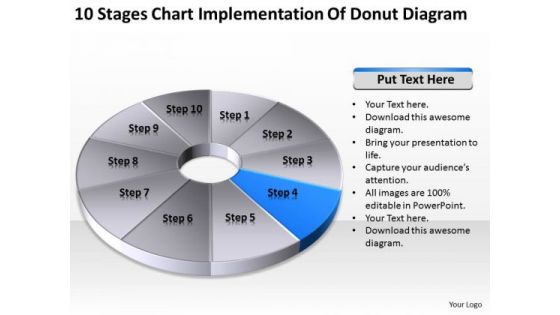
10 Stages Chart Implementation Of Donut Diagram Business Plan PowerPoint Slides
We present our 10 stages chart implementation of donut diagram business plan PowerPoint Slides.Download and present our Circle Charts PowerPoint Templates because It will get your audience in sync. Present our Marketing PowerPoint Templates because Our PowerPoint Templates and Slides will generate and maintain the level of interest you desire. They will create the impression you want to imprint on your audience. Download and present our Signs PowerPoint Templates because You can Zap them with our PowerPoint Templates and Slides. See them reel under the impact. Use our Finance PowerPoint Templates because Our PowerPoint Templates and Slides will embellish your thoughts. See them provide the desired motivation to your team. Present our Business PowerPoint Templates because You will get more than you ever bargained for. Use these PowerPoint slides for presentations relating to chart, pie, graph, vector, 3d, icon, diagram, progress, business, circular, design, information, market, opinion, corporate, sign, symbol, shadow, percentage, graphic, finance, data, element, drawing, report, marketing, shape, illustration, earnings, number, strategy, money, dimensional, survey, growth, colorful, global, account, part, investment, statistic, financial, results, portion. The prominent colors used in the PowerPoint template are Blue, Gray, Black. Get a firm handle on your discussion with our 10 Stages Chart Implementation Of Donut Diagram Business Plan PowerPoint Slides. Try us out and see what a difference our templates make.
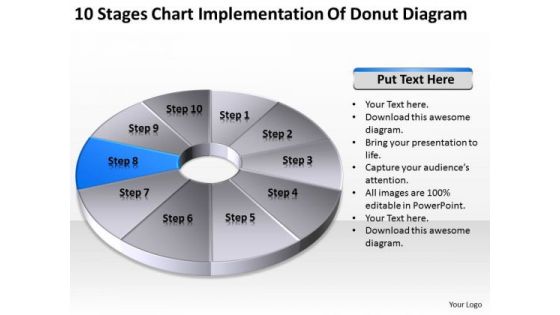
10 Stages Chart Implementation Of Donut Diagram Ppt Making Business Plan PowerPoint Template
We present our 10 stages chart implementation of donut diagram ppt making business plan PowerPoint template.Download our Circle Charts PowerPoint Templates because You should Kick up a storm with our PowerPoint Templates and Slides. The heads of your listeners will swirl with your ideas. Download our Marketing PowerPoint Templates because Our PowerPoint Templates and Slides are topically designed to provide an attractive backdrop to any subject. Present our Signs PowerPoint Templates because Our PowerPoint Templates and Slides provide you with a vast range of viable options. Select the appropriate ones and just fill in your text. Download and present our Finance PowerPoint Templates because It will mark the footprints of your journey. Illustrate how they will lead you to your desired destination. Download our Business PowerPoint Templates because our PowerPoint Templates and Slides will give your ideas the shape.Use these PowerPoint slides for presentations relating to chart, pie, graph, vector, 3d, icon, diagram, progress, business, circular, design, information, market, opinion, corporate, sign, symbol, shadow, percentage, graphic, finance, data, element, drawing, report, marketing, shape, illustration, earnings, number, strategy, money, dimensional, survey, growth, colorful, global, account, part, investment, statistic, financial, results, portion. The prominent colors used in the PowerPoint template are Blue, Gray, Black. Counsel teams with our 10 Stages Chart Implementation Of Donut Diagram Ppt Making Business Plan PowerPoint Template. Download without worries with our money back guaranteee.
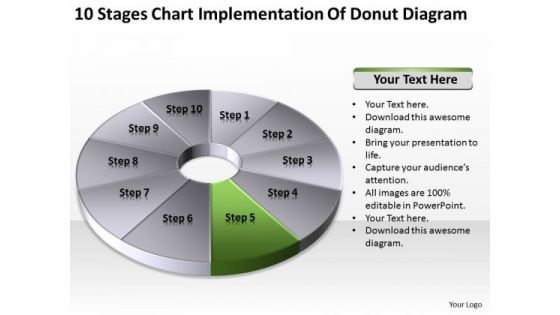
10 Stages Chart Implementation Of Donut Diagram Ppt Business Plan PowerPoint Slides
We present our 10 stages chart implementation of donut diagram ppt business plan PowerPoint Slides.Download our Circle Charts PowerPoint Templates because Our PowerPoint Templates and Slides come in all colours, shades and hues. They help highlight every nuance of your views. Download our Marketing PowerPoint Templates because Our PowerPoint Templates and Slides are like the strings of a tennis racquet. Well strung to help you serve aces. Use our Signs PowerPoint Templates because Our PowerPoint Templates and Slides are designed to help you succeed. They have all the ingredients you need. Present our Finance PowerPoint Templates because Our PowerPoint Templates and Slides will let you Hit the right notes. Watch your audience start singing to your tune. Download our Business PowerPoint Templates because These PowerPoint Templates and Slides will give the updraft to your ideas. See them soar to great heights with ease.Use these PowerPoint slides for presentations relating to chart, pie, graph, vector, 3d, icon, diagram, progress, business, circular, design, information, market, opinion, corporate, sign, symbol, shadow, percentage, graphic, finance, data, element, drawing, report, marketing, shape, illustration, earnings, number, strategy, money, dimensional, survey, growth, colorful, global, account, part, investment, statistic, financial, results, portion. The prominent colors used in the PowerPoint template are Green, Gray, Black. Embolden them with your thoughts. Our 10 Stages Chart Implementation Of Donut Diagram Ppt Business Plan PowerPoint Slides will get them all animated.
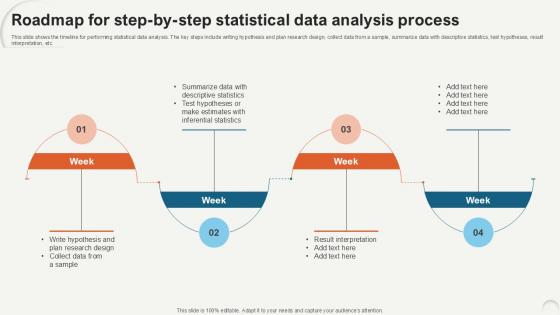
Roadmap For Step By Step Statistical Data Analytics For Informed Decision Ppt PowerPoint
This slide shows the timeline for performing statistical data analysis. The key steps include writing hypothesis and plan research design, collect data from a sample, summarize data with descriptive statistics, test hypotheses, result interpretation, etc. Retrieve professionally designed Roadmap For Step By Step Statistical Data Analytics For Informed Decision Ppt PowerPoint to effectively convey your message and captivate your listeners. Save time by selecting pre-made slideshows that are appropriate for various topics, from business to educational purposes. These themes come in many different styles, from creative to corporate, and all of them are easily adjustable and can be edited quickly. Access them as PowerPoint templates or as Google Slides themes. You do not have to go on a hunt for the perfect presentation because Slidegeeks got you covered from everywhere. This slide shows the timeline for performing statistical data analysis. The key steps include writing hypothesis and plan research design, collect data from a sample, summarize data with descriptive statistics, test hypotheses, result interpretation, etc.
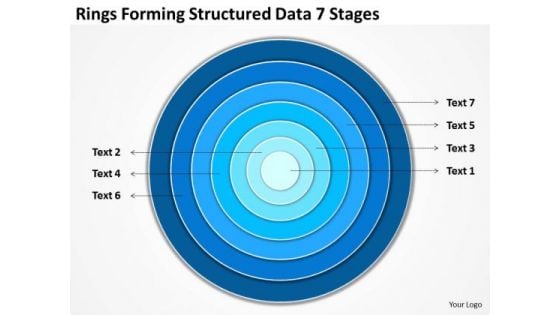
Rings Forming Structured Data 7 Stages Step By Business Plan Template PowerPoint Slides
We present our rings forming structured data 7 stages step by business plan template PowerPoint Slides.Use our Circle Charts PowerPoint Templates because They will Put your wonderful verbal artistry on display. Our PowerPoint Templates and Slides will provide you the necessary glam and glitter. Present our Shapes PowerPoint Templates because It will Give impetus to the hopes of your colleagues. Our PowerPoint Templates and Slides will aid you in winning their trust. Download and present our Signs PowerPoint Templates because Our PowerPoint Templates and Slides will let you Clearly mark the path for others to follow. Download and present our Maketing PowerPoint Templates because It will mark the footprints of your journey. Illustrate how they will lead you to your desired destination. Use our Metaphors-Visual Concepts PowerPoint Templates because Our PowerPoint Templates and Slides has conjured up a web of all you need with the help of our great team. Use them to string together your glistening ideas.Use these PowerPoint slides for presentations relating to diagram, circular, market, bar, advertise, interface, business, concept, vector, sign, success, presentation, symbol, template, circle, brochure, finance, data, description, report, marketing, title, label, abstract, management, graph, four, illustration, icon, pie, chart, strategy, catalog, research, web, design, growth, text, professional, banner, account, profit, information, background, info-graphic, analyze, financial, button, goals. The prominent colors used in the PowerPoint template are Blue, Blue light, White. Face your audience with our Rings Forming Structured Data 7 Stages Step By Business Plan Template PowerPoint Slides. You will come out on top.
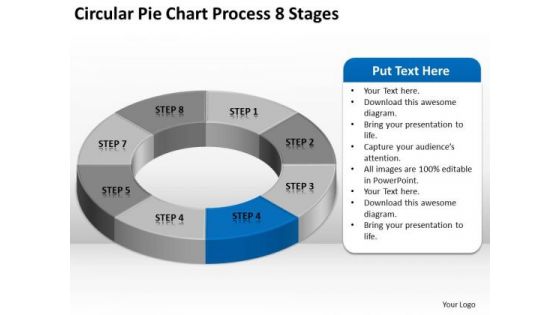
Circular Pie Chart Process 8 Stages Business Plan PowerPoint Slide
We present our circular pie chart process 8 stages business plan PowerPoint Slide.Download our Marketing PowerPoint Templates because Our PowerPoint Templates and Slides are designed to help you succeed. They have all the ingredients you need. Download our Finance PowerPoint Templates because Our PowerPoint Templates and Slides are the chords of your song. String them along and provide the lilt to your views. Present our Business PowerPoint Templates because Our PowerPoint Templates and Slides are the chords of your song. String them along and provide the lilt to your views. Use our Circle Charts PowerPoint Templates because Our PowerPoint Templates and Slides will provide weight to your words. They will bring out the depth of your thought process. Present our Shapes PowerPoint Templates because Our PowerPoint Templates and Slides are created with admirable insight. Use them and give your group a sense of your logical mind.Use these PowerPoint slides for presentations relating to Chart, Pie, Graph, Vector, 3d, Icon, Diagram, Progress, Business, Circular, Design, Information, Market, Opinion, Corporate, Sign, Symbol, Shadow, Percentage, Graphic, Finance, Data, Element, Drawing, Report, Marketing, Shape, Illustration, Earnings, Number, Strategy, Money, Dimensional, Survey, Growth, Colorful, Global, Account, Part, Investment, Statistic, Financial. The prominent colors used in the PowerPoint template are Blue, Gray, White. Commence the festivity with our Circular Pie Chart Process 8 Stages Business Plan PowerPoint Slide. Put them all in a celeberatory mood.
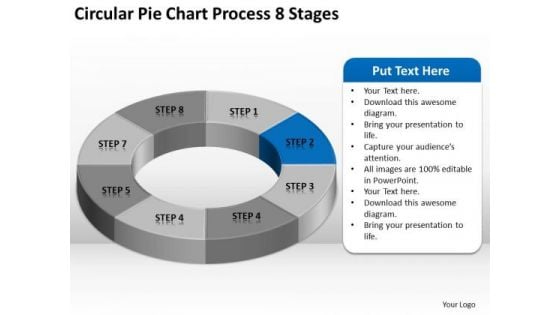
Circular Pie Chart Process 8 Stages Business Plan PowerPoint Slides
We present our circular pie chart process 8 stages business plan PowerPoint Slides.Download our Marketing PowerPoint Templates because Our PowerPoint Templates and Slides are designed to help you succeed. They have all the ingredients you need. Use our Finance PowerPoint Templates because It can be used to Set your controls for the heart of the sun. Our PowerPoint Templates and Slides will be the propellant to get you there. Download our Business PowerPoint Templates because It can Leverage your style with our PowerPoint Templates and Slides. Charm your audience with your ability. Use our Circle Charts PowerPoint Templates because you should once Tap the ingenuity of our PowerPoint Templates and Slides. They are programmed to succeed. Download our Shapes PowerPoint Templates because You can Hit the nail on the head with our PowerPoint Templates and Slides. Embed your ideas in the minds of your audience.Use these PowerPoint slides for presentations relating to Chart, Pie, Graph, Vector, 3d, Icon, Diagram, Progress, Business, Circular, Design, Information, Market, Opinion, Corporate, Sign, Symbol, Shadow, Percentage, Graphic, Finance, Data, Element, Drawing, Report, Marketing, Shape, Illustration, Earnings, Number, Strategy, Money, Dimensional, Survey, Growth, Colorful, Global, Account, Part, Investment, Statistic, Financial. The prominent colors used in the PowerPoint template are Blue, Gray, White. Start accelerating revenue growth with our Circular Pie Chart Process 8 Stages Business Plan PowerPoint Slides. They will make you look good.
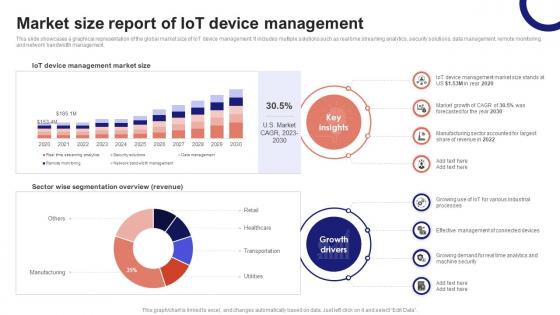
IoT Device Management Fundamentals Market Size Report Of IoT Device Management IoT Ss V
This slide showcases a graphical representation of the global market size of IoT device management. It includes multiple solutions such as real time streaming analytics, security solutions, data management, remote monitoring, and network bandwidth management. Slidegeeks has constructed IoT Device Management Fundamentals Market Size Report Of IoT Device Management IoT SS V after conducting extensive research and examination. These presentation templates are constantly being generated and modified based on user preferences and critiques from editors. Here, you will find the most attractive templates for a range of purposes while taking into account ratings and remarks from users regarding the content. This is an excellent jumping-off point to explore our content and will give new users an insight into our top-notch PowerPoint Templates. This slide showcases a graphical representation of the global market size of IoT device management. It includes multiple solutions such as real time streaming analytics, security solutions, data management, remote monitoring, and network bandwidth management.

Types Of Data Monitored In Product Analytics Product Analytics Implementation Data Analytics V
This slide outlines major categories of data tracked using product analytics aimed at improving performance to increase business revenue. It covers categories such as event tracking as well as properties Are you searching for a Types Of Data Monitored In Product Analytics Product Analytics Implementation Data Analytics V that is uncluttered, straightforward, and original Its easy to edit, and you can change the colors to suit your personal or business branding. For a presentation that expresses how much effort you have put in, this template is ideal With all of its features, including tables, diagrams, statistics, and lists, its perfect for a business plan presentation. Make your ideas more appealing with these professional slides. Download Types Of Data Monitored In Product Analytics Product Analytics Implementation Data Analytics V from Slidegeeks today. This slide outlines major categories of data tracked using product analytics aimed at improving performance to increase business revenue. It covers categories such as event tracking as well as properties
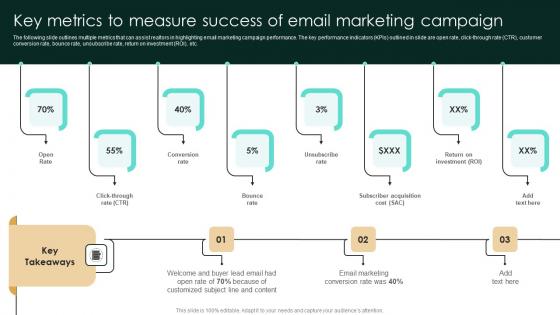
Key Metrics To Measure Success Of Email Marketing Campaign Diagrams Pdf
The following slide outlines multiple metrics that can assist realtors in highlighting email marketing campaign performance. The key performance indicators KPIs outlined in slide are open rate, click-through rate CTR, customer conversion rate, bounce rate, unsubscribe rate, return on investment ROI, etc. Retrieve professionally designed Key Metrics To Measure Success Of Email Marketing Campaign Diagrams Pdf to effectively convey your message and captivate your listeners. Save time by selecting pre-made slideshows that are appropriate for various topics, from business to educational purposes. These themes come in many different styles, from creative to corporate, and all of them are easily adjustable and can be edited quickly. Access them as PowerPoint templates or as Google Slides themes. You do not have to go on a hunt for the perfect presentation because Slidegeeks got you covered from everywhere. The following slide outlines multiple metrics that can assist realtors in highlighting email marketing campaign performance. The key performance indicators KPIs outlined in slide are open rate, click-through rate CTR, customer conversion rate, bounce rate, unsubscribe rate, return on investment ROI, etc.
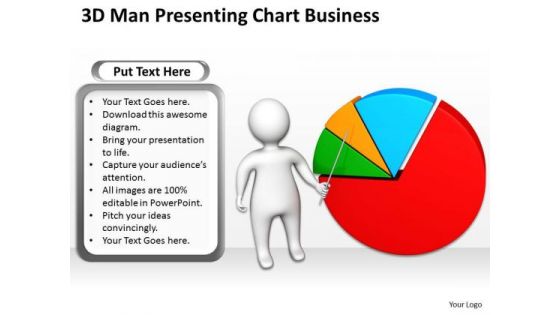
Business Model Diagram Examples 3d Man Presenting Chart PowerPoint Theme Slides
We present our business model diagram examples 3d man presenting chart powerpoint theme Slides.Download and present our Business PowerPoint Templates because They will bring a lot to the table. Their alluring flavours will make your audience salivate. Download our Finance PowerPoint Templates because Our PowerPoint Templates and Slides will bullet point your ideas. See them fall into place one by one. Use our People PowerPoint Templates because Our PowerPoint Templates and Slides will let your team Walk through your plans. See their energy levels rise as you show them the way. Use our Marketing PowerPoint Templates because You are well armed with penetrative ideas. Our PowerPoint Templates and Slides will provide the gunpowder you need. Download our Success PowerPoint Templates because Our PowerPoint Templates and Slides are Clear and concise. Use them and dispel any doubts your team may have.Use these PowerPoint slides for presentations relating to 3d, arrow, business, businessman, cartoon, character, chart, concept, corporate, data, development, diagram, display, figure, finance, financial, graph, graphic, green, growth, guy, human, icon, idea, illustration, information, investment, isolated, market, marketing, men, office, part, people, person, pie, presentation, professional, progress, red, reflection, report, shape, shiny, sign, slice, statistic, success, white. The prominent colors used in the PowerPoint template are Green, Red, Blue. Professionals tell us our business model diagram examples 3d man presenting chart powerpoint theme Slides are readymade to fit into any presentation structure. Use our concept PowerPoint templates and PPT Slides are designed by professionals Use our business model diagram examples 3d man presenting chart powerpoint theme Slides will impress their bosses and teams. Customers tell us our corporate PowerPoint templates and PPT Slides are topically designed to provide an attractive backdrop to any subject. Presenters tell us our business model diagram examples 3d man presenting chart powerpoint theme Slides look good visually. People tell us our concept PowerPoint templates and PPT Slides will save the presenter time. Coach subordinates with our Business Model Diagram Examples 3d Man Presenting Chart PowerPoint Theme Slides. Download without worries with our money back guaranteee.
Circular Pie Chart Process 8 Stages Business Plan Forms PowerPoint Slides
We present our circular pie chart process 8 stages business plan forms PowerPoint Slides.Download our Marketing PowerPoint Templates because Our PowerPoint Templates and Slides will give good value for money. They also have respect for the value of your time. Download and present our Finance PowerPoint Templates because Our PowerPoint Templates and Slides will help you be quick off the draw. Just enter your specific text and see your points hit home. Download our Business PowerPoint Templates because Our PowerPoint Templates and Slides will generate and maintain the level of interest you desire. They will create the impression you want to imprint on your audience. Download and present our Circle Charts PowerPoint Templates because You have gained great respect for your brilliant ideas. Use our PowerPoint Templates and Slides to strengthen and enhance your reputation. Present our Shapes PowerPoint Templates because They will Put the wind in your sails. Skim smoothly over the choppy waters of the market.Use these PowerPoint slides for presentations relating to Chart, Pie, Graph, Vector, 3d, Icon, Diagram, Progress, Business, Circular, Design, Information, Market, Opinion, Corporate, Sign, Symbol, Shadow, Percentage, Graphic, Finance, Data, Element, Drawing, Report, Marketing, Shape, Illustration, Earnings, Number, Strategy, Money, Dimensional, Survey, Growth, Colorful, Global, Account, Part, Investment, Statistic, Financial. The prominent colors used in the PowerPoint template are Blue light, Gray, White. Get the largest value at the lowest price with our Circular Pie Chart Process 8 Stages Business Plan Forms PowerPoint Slides. Dont waste time struggling with PowerPoint. Let us do it for you.
Circular Pie Chart Process 8 Stages Business Plan Executive Summary PowerPoint Templates
We present our circular pie chart process 8 stages business plan executive summary PowerPoint templates.Download and present our Marketing PowerPoint Templates because Our PowerPoint Templates and Slides will let you Hit the right notes. Watch your audience start singing to your tune. Use our Finance PowerPoint Templates because Our PowerPoint Templates and Slides are effectively colour coded to prioritise your plans They automatically highlight the sequence of events you desire. Download our Business PowerPoint Templates because you should Experience excellence with our PowerPoint Templates and Slides. They will take your breath away. Download our Circle Charts PowerPoint Templates because Our PowerPoint Templates and Slides ensures Effective communication. They help you put across your views with precision and clarity. Download our Shapes PowerPoint Templates because Our PowerPoint Templates and Slides are like the strings of a tennis racquet. Well strung to help you serve aces.Use these PowerPoint slides for presentations relating to Chart, Pie, Graph, Vector, 3d, Icon, Diagram, Progress, Business, Circular, Design, Information, Market, Opinion, Corporate, Sign, Symbol, Shadow, Percentage, Graphic, Finance, Data, Element, Drawing, Report, Marketing, Shape, Illustration, Earnings, Number, Strategy, Money, Dimensional, Survey, Growth, Colorful, Global, Account, Part, Investment, Statistic, Financial. The prominent colors used in the PowerPoint template are Blue, Gray, White. Steal the affection of your audience. Our Circular Pie Chart Process 8 Stages Business Plan Executive Summary PowerPoint Templates will abet you in the crime.
Circular Pie Chart Process 8 Stages Business Plan Template PowerPoint Templates
We present our circular pie chart process 8 stages business plan template PowerPoint templates.Present our Marketing PowerPoint Templates because It will Give impetus to the hopes of your colleagues. Our PowerPoint Templates and Slides will aid you in winning their trust. Use our Finance PowerPoint Templates because You can Connect the dots. Fan expectations as the whole picture emerges. Use our Business PowerPoint Templates because Watching this your Audience will Grab their eyeballs, they wont even blink. Use our Circle Charts PowerPoint Templates because Our PowerPoint Templates and Slides are created with admirable insight. Use them and give your group a sense of your logical mind. Download and present our Shapes PowerPoint Templates because Our PowerPoint Templates and Slides have the Brilliant backdrops. Guaranteed to illuminate the minds of your audience.Use these PowerPoint slides for presentations relating to Chart, Pie, Graph, Vector, 3d, Icon, Diagram, Progress, Business, Circular, Design, Information, Market, Opinion, Corporate, Sign, Symbol, Shadow, Percentage, Graphic, Finance, Data, Element, Drawing, Report, Marketing, Shape, Illustration, Earnings, Number, Strategy, Money, Dimensional, Survey, Growth, Colorful, Global, Account, Part, Investment, Statistic, Financial. The prominent colors used in the PowerPoint template are Blue light, Gray, White. Battle it out with our Circular Pie Chart Process 8 Stages Business Plan Template PowerPoint Templates. You will come out on top.
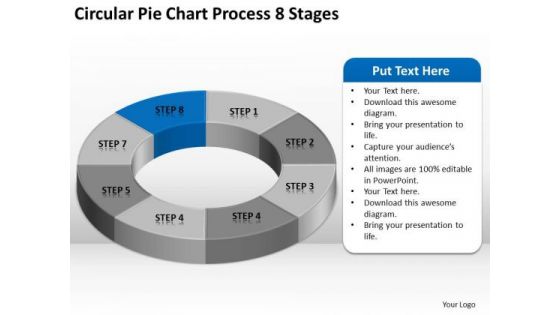
Circular Pie Chart Process 8 Stages Ppt Business Plan Financials PowerPoint Slides
We present our circular pie chart process 8 stages ppt business plan financials PowerPoint Slides.Present our Marketing PowerPoint Templates because Our PowerPoint Templates and Slides come in all colours, shades and hues. They help highlight every nuance of your views. Use our Finance PowerPoint Templates because you should Experience excellence with our PowerPoint Templates and Slides. They will take your breath away. Present our Business PowerPoint Templates because You can Create a matrix with our PowerPoint Templates and Slides. Feel the strength of your ideas click into place. Download our Circle Charts PowerPoint Templates because Our PowerPoint Templates and Slides team portray an attitude of elegance. Personify this quality by using them regularly. Present our Shapes PowerPoint Templates because It is Aesthetically crafted by artistic young minds. Our PowerPoint Templates and Slides are designed to display your dexterity.Use these PowerPoint slides for presentations relating to Chart, Pie, Graph, Vector, 3d, Icon, Diagram, Progress, Business, Circular, Design, Information, Market, Opinion, Corporate, Sign, Symbol, Shadow, Percentage, Graphic, Finance, Data, Element, Drawing, Report, Marketing, Shape, Illustration, Earnings, Number, Strategy, Money, Dimensional, Survey, Growth, Colorful, Global, Account, Part, Investment, Statistic, Financial. The prominent colors used in the PowerPoint template are Blue, Gray, White. Our Circular Pie Chart Process 8 Stages Ppt Business Plan Financials PowerPoint Slides compare to a classic dessert. Your audience will have their cake and eat it too.
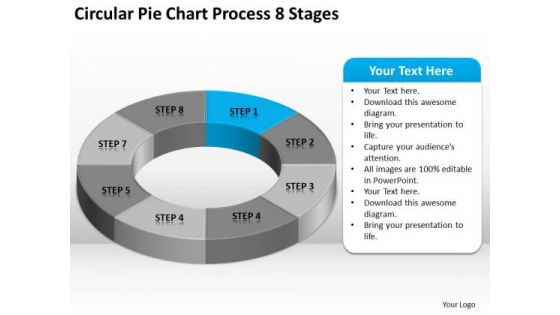
Circular Pie Chart Process 8 Stages Sample Nonprofit Business Plan PowerPoint Slides
We present our circular pie chart process 8 stages sample nonprofit business plan PowerPoint Slides.Download and present our Marketing PowerPoint Templates because You can Channelise the thoughts of your team with our PowerPoint Templates and Slides. Urge them to focus on the goals you have set. Use our Finance PowerPoint Templates because It can Bubble and burst with your ideas. Use our Business PowerPoint Templates because Our PowerPoint Templates and Slides will let you Hit the target. Go the full distance with ease and elan. Download and present our Circle Charts PowerPoint Templates because Our PowerPoint Templates and Slides will let your words and thoughts hit bullseye everytime. Use our Shapes PowerPoint Templates because Our PowerPoint Templates and Slides are focused like a searchlight beam. They highlight your ideas for your target audience.Use these PowerPoint slides for presentations relating to Chart, Pie, Graph, Vector, 3d, Icon, Diagram, Progress, Business, Circular, Design, Information, Market, Opinion, Corporate, Sign, Symbol, Shadow, Percentage, Graphic, Finance, Data, Element, Drawing, Report, Marketing, Shape, Illustration, Earnings, Number, Strategy, Money, Dimensional, Survey, Growth, Colorful, Global, Account, Part, Investment, Statistic, Financial. The prominent colors used in the PowerPoint template are Blue light, Gray, White. Give an exhaustive account with our Circular Pie Chart Process 8 Stages Sample Nonprofit Business Plan PowerPoint Slides. Your thoughts will illuminate every little detail.
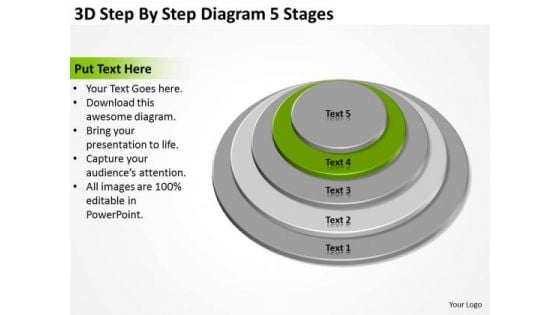
By Diagram 5 Stages How To Write Business Plan For PowerPoint Templates
We present our by diagram 5 stages how to write business plan for PowerPoint templates.Use our Process and Flows PowerPoint Templates because It will let you Set new benchmarks with our PowerPoint Templates and Slides. They will keep your prospects well above par. Download our Circle Charts PowerPoint Templates because Our PowerPoint Templates and Slides will Activate the energies of your audience. Get their creative juices flowing with your words. Present our Business PowerPoint Templates because our PowerPoint Templates and Slides are the string of your bow. Fire of your ideas and conquer the podium. Use our Flow Charts PowerPoint Templates because It will Raise the bar of your Thoughts. They are programmed to take you to the next level. Download our Shapes PowerPoint Templates because It will Strengthen your hand with your thoughts. They have all the aces you need to win the day.Use these PowerPoint slides for presentations relating to Chart, round, growth, pyramid, market, isolated, demographic, infochart, document, isometric, piechart, perspective, business, blank, concept, vector, sign,diagramchart, visual, presentation, glossy, symbol, template, diagram, circle, ring, graphic, finance, data, stock, element, report, abstract, graph, illustration, icon,economic, rating, web, infographic, design, text, organization, information, background, office, statistic, financial. The prominent colors used in the PowerPoint template are Green, White, Gray. Stand on your own feet with our By Diagram 5 Stages How To Write Business Plan For PowerPoint Templates. They will deliver all the assistance you need.
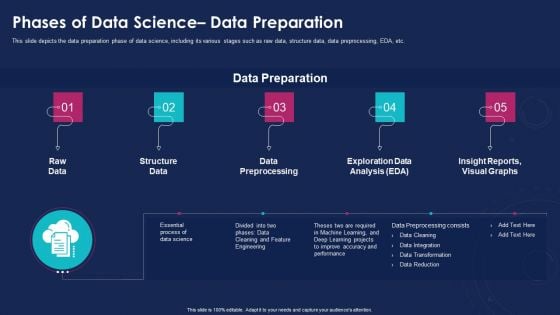
Data Analytics IT Phases Of Data Science Data Preparation Ppt Professional Example Topics PDF
This slide depicts the data preparation phase of data science, including its various stages such as raw data, structure data, data preprocessing, EDA, etc. This is a data analytics it phases of data science data preparation ppt professional example topics pdf template with various stages. Focus and dispense information on five stages using this creative set, that comes with editable features. It contains large content boxes to add your information on topics like raw data, structure data, data preprocessing, exploration data analysis, insight reports, visual graphs. You can also showcase facts, figures, and other relevant content using this PPT layout. Grab it now.

Quarterly Report To Analyze Marketing Revenue Quarterly Report Ppt Sample
This slide highlights key revenue sources, including data access fees and product sales, alongside detailed expense allocations, with seminars and staff compensation leading costs. If your project calls for a presentation, then Slidegeeks is your go-to partner because we have professionally designed, easy-to-edit templates that are perfect for any presentation. After downloading, you can easily edit Quarterly Report To Analyze Marketing Revenue Quarterly Report Ppt Sample and make the changes accordingly. You can rearrange slides or fill them with different images. Check out all the handy templates This slide highlights key revenue sources, including data access fees and product sales, alongside detailed expense allocations, with seminars and staff compensation leading costs.
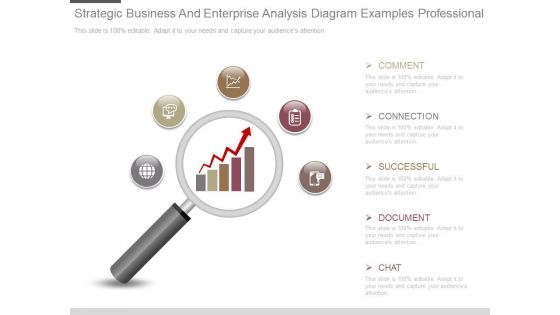
Strategic Business And Enterprise Analysis Diagram Examples Professional
This is a strategic business and enterprise analysis diagram examples professional. This is a five stage process. The stages in this process are comment, connection, successful, document, chat.\n\n\n\n\n\n\n\n
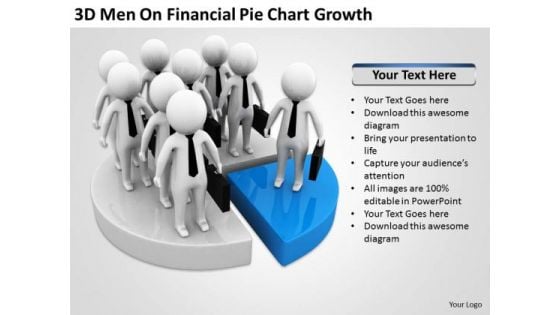
Men In Business On Financial Pie Chart Growth PowerPoint Templates Ppt Backgrounds For Slides
We present our men in business on financial pie chart growth PowerPoint templates PPT backgrounds for slides.Download and present our People PowerPoint Templates because Our PowerPoint Templates and Slides offer you the needful to organise your thoughts. Use them to list out your views in a logical sequence. Download and present our Finance PowerPoint Templates because You can Zap them with our PowerPoint Templates and Slides. See them reel under the impact. Present our Business PowerPoint Templates because You can Create a matrix with our PowerPoint Templates and Slides. Feel the strength of your ideas click into place. Download and present our Marketing PowerPoint Templates because Our PowerPoint Templates and Slides will let your team Walk through your plans. See their energy levels rise as you show them the way. Download and present our Success PowerPoint Templates because You can Bait your audience with our PowerPoint Templates and Slides. They will bite the hook of your ideas in large numbers.Use these PowerPoint slides for presentations relating to 3d, business, character, chart, colorful, concept, data, diagram, document, figure, finance, financial, four, global, graphic, growth, human, icon, idea, information, investment, isolated, leadership, man, market, marketing, number, part, people, person, pie, plan, presentation, progress, report icon, results, rise, shape, shiny, sign, small, solution, statistic, up, white. The prominent colors used in the PowerPoint template are Blue, Gray, Black. PowerPoint presentation experts tell us our men in business on financial pie chart growth PowerPoint templates PPT backgrounds for slides are specially created by a professional team with vast experience. They diligently strive to come up with the right vehicle for your brilliant Ideas. People tell us our character PowerPoint templates and PPT Slides are effectively colour coded to prioritise your plans They automatically highlight the sequence of events you desire. We assure you our men in business on financial pie chart growth PowerPoint templates PPT backgrounds for slides effectively help you save your valuable time. We assure you our diagram PowerPoint templates and PPT Slides will save the presenter time. Presenters tell us our men in business on financial pie chart growth PowerPoint templates PPT backgrounds for slides will save the presenter time. Use our colorful PowerPoint templates and PPT Slides are the best it can get when it comes to presenting. Convincing others can be an exacting business. Address their doubts with our Men In Business On Financial Pie Chart Growth PowerPoint Templates Ppt Backgrounds For Slides.
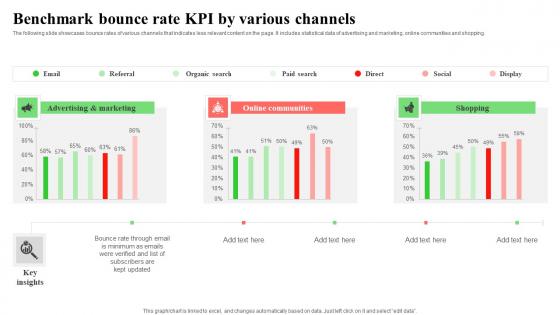
Benchmark Bounce Rate KPI By Various Channels Infographics Pdf
The following slide showcases bounce rates of various channels that indicates less relevant content on the page. It includes statistical data of advertising and marketing, online communities and shopping. Pitch your topic with ease and precision using this Benchmark Bounce Rate KPI By Various Channels Infographics Pdf. This layout presents information on Advertising,Marketing, Online Communities. It is also available for immediate download and adjustment. So, changes can be made in the color, design, graphics or any other component to create a unique layout. The following slide showcases bounce rates of various channels that indicates less relevant content on the page. It includes statistical data of advertising and marketing, online communities and shopping.

 Home
Home