Dashboard Icon
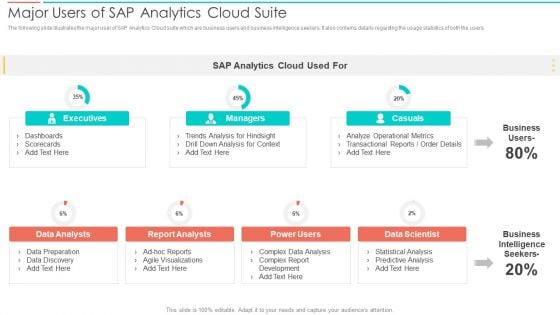
SAC Planning And Implementation Major Users Of SAP Analytics Cloud Suite Diagrams PDF
The following slide illustrates the major user of SAP Analytics Cloud suite which are business users and business intelligence seekers. It also contains details regarding the usage statistics of both the users. Deliver an awe inspiring pitch with this creative SAC Planning And Implementation Major Users Of SAP Analytics Cloud Suite Diagrams PDF bundle. Topics like Executives, Casuals, Business Intelligence Seekers, Data Scientist can be discussed with this completely editable template. It is available for immediate download depending on the needs and requirements of the user.

Cost Performance Index Ppt PowerPoint Presentation Infographics Themes
This is a cost performance index ppt powerpoint presentation infographics themes. This is a two stage process. The stages in this process are cost performance index, ev term, value, finance.
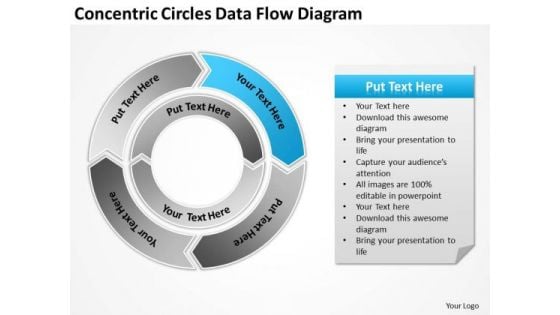
Concentric Circles Data Flow Diagram Business Plan Financials PowerPoint Slides
We present our concentric circles data flow diagram business plan financials PowerPoint Slides.Download and present our Arrows PowerPoint Templates because You can Bait your audience with our PowerPoint Templates and Slides. They will bite the hook of your ideas in large numbers. Present our Process and Flows PowerPoint Templates because You can Channelise the thoughts of your team with our PowerPoint Templates and Slides. Urge them to focus on the goals you have set. Download and present our Flow Charts PowerPoint Templates because Watching this your Audience will Grab their eyeballs, they wont even blink. Download and present our Circle Charts PowerPoint Templates because you can Add colour to your speech with our PowerPoint Templates and Slides. Your presentation will leave your audience speechless. Download and present our Business PowerPoint Templates because It will let you Set new benchmarks with our PowerPoint Templates and Slides. They will keep your prospects well above par.Use these PowerPoint slides for presentations relating to Arrows, speech, form, special, corporate, order, business, concept, arrow, bright, symbol, circle, match, usable, graphic, process,element, different, idea, shape, abstract, cycle, creative, illustration, piece, connection, chart, strategy, place, group, color, colorful, text, access, part, conceptual. The prominent colors used in the PowerPoint template are Blue light, Gray, Black. Our Concentric Circles Data Flow Diagram Business Plan Financials PowerPoint Slides are based on experience. They do not contain anything fanciful.
Top Business People 3d Man With Pie Chart New PowerPoint Presentation Templates
We present our top business people 3d man with pie chart new powerpoint presentation templates.Present our Circle Charts PowerPoint Templates because You can Be the star of the show with our PowerPoint Templates and Slides. Rock the stage with your ideas. Present our Business PowerPoint Templates because Our PowerPoint Templates and Slides will Activate the energies of your audience. Get their creative juices flowing with your words. Download our People PowerPoint Templates because our PowerPoint Templates and Slides will give your ideas the shape. Use our Shapes PowerPoint Templates because It will mark the footprints of your journey. Illustrate how they will lead you to your desired destination. Download our Success PowerPoint Templates because You can Channelise the thoughts of your team with our PowerPoint Templates and Slides. Urge them to focus on the goals you have set.Use these PowerPoint slides for presentations relating to 3d,active, analysis, business, cartoon, character, chart, commerce, company, data,diagram, earning, economy, figures, financial, forecast, gain, goal, graph, growth,guy, income, investment, male, man, market, money, monthly, number, person,pie, planning, positive, profit, profitable, progress, pushing, report, research,results, revenue, sale, sheet, spreadsheet, statement, statistics, stock, table. The prominent colors used in the PowerPoint template are Blue , Gray, Black. We assure you our top business people 3d man with pie chart new powerpoint presentation templates provide you with a vast range of viable options. Select the appropriate ones and just fill in your text. You can be sure our character PowerPoint templates and PPT Slides will make the presenter successul in his career/life. Use our top business people 3d man with pie chart new powerpoint presentation templates will make the presenter successul in his career/life. We assure you our chart PowerPoint templates and PPT Slides will get their audience's attention. Use our top business people 3d man with pie chart new powerpoint presentation templates will make you look like a winner. Professionals tell us our chart PowerPoint templates and PPT Slides will generate and maintain the level of interest you desire. They will create the impression you want to imprint on your audience. Convincing an audience can be demanding. Assert your credibilitywith our Top Business People 3d Man With Pie Chart New PowerPoint Presentation Templates.
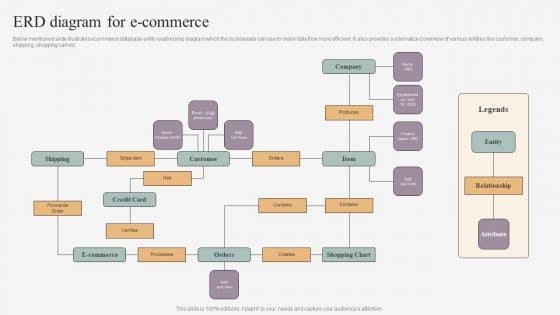
ERD Diagram For E Commerce Infographics PDF
Below mentioned slide illustrates ecommerce database entity relationship diagram which the businesses can use to make data flow more efficient. It also provides systematized overview of various entities like customer, company, shipping, shopping cart etc. Showcasing this set of slides titled ERD Diagram For E Commerce Infographics PDF. The topics addressed in these templates are Shipping, Customer, Company, Entity, Shopping Chart, Credit Card, Relationship. All the content presented in this PPT design is completely editable. Download it and make adjustments in color, background, font etc. as per your unique business setting.
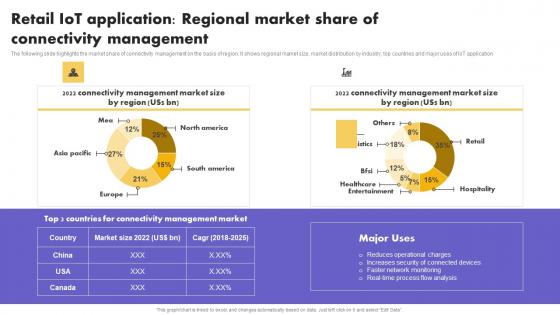
IoT Application In Global Retail IoT Application Regional Market Share Diagrams Pdf
The following slide highlights the market share of connectivity management on the basis of region. It shows regional market size, market distribution by industry, top countries and major uses of IoT application.The IoT Application In Global Retail IoT Application Regional Market Share Diagrams Pdf is a compilation of the most recent design trends as a series of slides. It is suitable for any subject or industry presentation, containing attractive visuals and photo spots for businesses to clearly express their messages. This template contains a variety of slides for the user to input data, such as structures to contrast two elements, bullet points, and slides for written information. Slidegeeks is prepared to create an impression. The following slide highlights the market share of connectivity management on the basis of region. It shows regional market size, market distribution by industry, top countries and major uses of IoT application
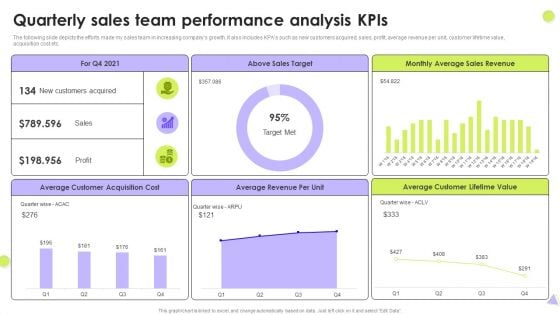
Quarterly Sales Team Performance Analysis Kpis Slides PDF
The following slide depicts the efforts made my sales team in increasing companys growth. It also includes KPAs such as new customers acquired, sales, profit, average revenue per unit, customer lifetime value, acquisition cost etc. Showcasing this set of slides titled Quarterly Sales Team Performance Analysis Kpis Slides PDF. The topics addressed in these templates are Above Sales Target, Average Sales Revenue, Average Customer. All the content presented in this PPT design is completely editable. Download it and make adjustments in color, background, font etc. as per your unique business setting.
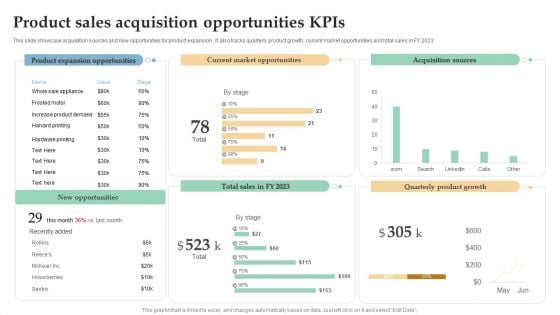
Product Sales Acquisition Opportunities Kpis Ppt Pictures Slide PDF
This slide showcase acquisition sources and new opportunities for product expansion . It also tracks quarterly product growth, current market opportunities and total sales in FY 2023. Pitch your topic with ease and precision using this Product Sales Acquisition Opportunities Kpis Ppt Pictures Slide PDF. This layout presents information on Product Expansion Opportunities, Current Market Opportunities, Acquisition Sources. It is also available for immediate download and adjustment. So, changes can be made in the color, design, graphics or any other component to create a unique layout.
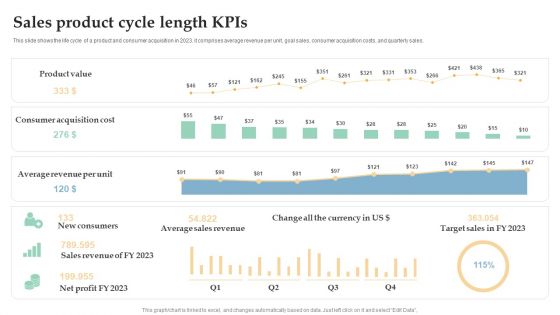
Sales Product Cycle Length Kpis Ppt Pictures Aids PDF
This slide shows the life cycle of a product and consumer acquisition in 2023. it comprises average revenue per unit, goal sales, consumer acquisition costs, and quarterly sales. Showcasing this set of slides titled Sales Product Cycle Length Kpis Ppt Pictures Aids PDF. The topics addressed in these templates are Product Value, Consumer Acquisition Cost, Average Revenue, Per Unit. All the content presented in this PPT design is completely editable. Download it and make adjustments in color, background, font etc. as per your unique business setting.
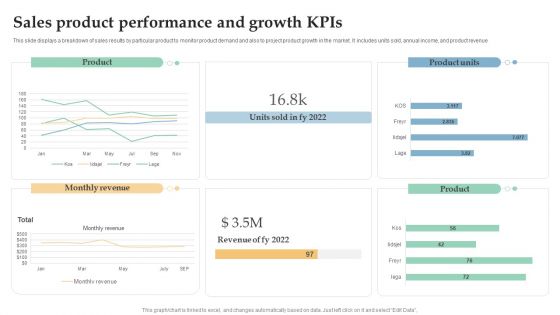
Sales Product Performance And Growth Kpis Ppt Layouts Mockup PDF
This slide displays a breakdown of sales results by particular product to monitor product demand and also to project product growth in the market. It includes units sold, annual income, and product revenue. Pitch your topic with ease and precision using this Sales Product Performance And Growth Kpis Ppt Layouts Mockup PDF. This layout presents information on Monthly Revenue, Product, Product Units. It is also available for immediate download and adjustment. So, changes can be made in the color, design, graphics or any other component to create a unique layout.
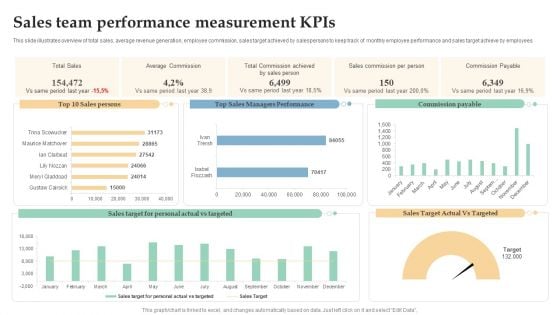
Sales Team Performance Measurement Kpis Ppt Professional Templates PDF
This slide illustrates overview of total sales, average revenue generation, employee commission, sales target achieved by salespersons to keep track of monthly employee performance and sales target achieve by employees. Showcasing this set of slides titled Sales Team Performance Measurement Kpis Ppt Professional Templates PDF. The topics addressed in these templates are Total Sales, Average Commission, Sales Commission, Per Person. All the content presented in this PPT design is completely editable. Download it and make adjustments in color, background, font etc. as per your unique business setting.
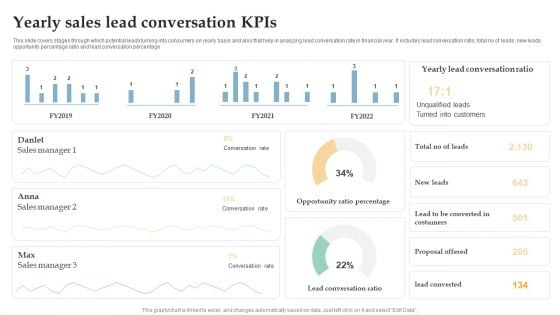
Yearly Sales Lead Conversation Kpis Ppt Inspiration Brochure PDF
This slide covers stages through which potential leads turning into consumers on yearly basis and also that help in analyzing lead conversation rate in financial year. It includes lead conversation ratio, total no of leads, new leads opportunity percentage ratio and lead conversation percentage. Pitch your topic with ease and precision using this Yearly Sales Lead Conversation Kpis Ppt Inspiration Brochure PDF. This layout presents information on Sales Manager, Conversation Rate, Opportunity Ratio Percentage. It is also available for immediate download and adjustment. So, changes can be made in the color, design, graphics or any other component to create a unique layout.
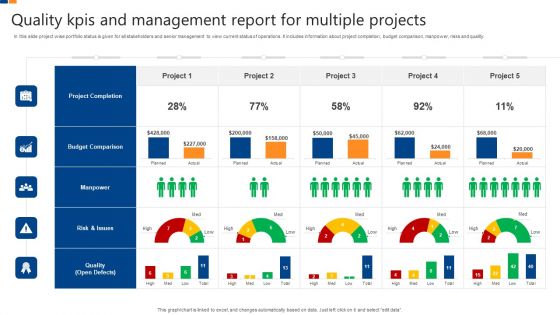
Quality Kpis And Management Report For Multiple Projects Elements PDF
In this slide project wise portfolio status is given for all stakeholders and senior management to view current status of operations. It includes information about project completion, budget comparison, manpower, risks and quality. Pitch your topic with ease and precision using this Quality Kpis And Management Report For Multiple Projects Elements PDF. This layout presents information on Project Completion, Budget Comparison, Manpower, Risks And Quality. It is also available for immediate download and adjustment. So, changes can be made in the color, design, graphics or any other component to create a unique layout.
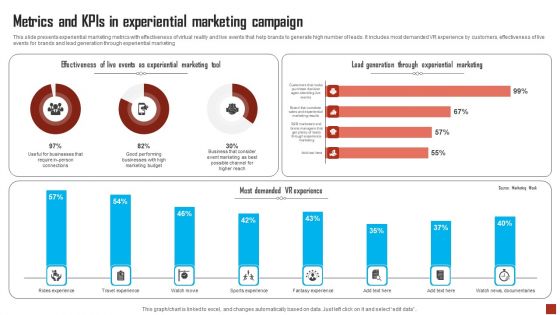
Metrics And Kpis In Experiential Marketing Campaign Structure PDF
This slide presents experiential marketing metrics with effectiveness of virtual reality and live events that help brands to generate high number of leads. It includes most demanded VR experience by customers, effectiveness of live events for brands and lead generation through experiential marketing. Pitch your topic with ease and precision using this Metrics And Kpis In Experiential Marketing Campaign Structure PDF. This layout presents information on Experiential Marketing, Business, Metrics. It is also available for immediate download and adjustment. So, changes can be made in the color, design, graphics or any other component to create a unique layout.
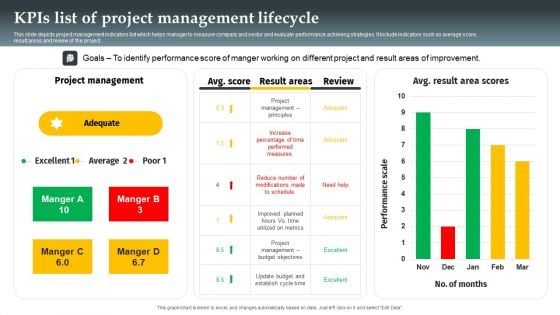
Kpis List Of Project Management Lifecycle Formats PDF
This slide depicts project management indicators list which helps manager to measure company and sector and evaluate performance achieving strategies. It include indicators such as average score, result areas and review of the project. Pitch your topic with ease and precision using this Kpis List Of Project Management Lifecycle Formats PDF. This layout presents information on Project Management, Performance Score, Average. It is also available for immediate download and adjustment. So, changes can be made in the color, design, graphics or any other component to create a unique layout.
Digital Recruitment Trends Ppt PowerPoint Presentation Pictures Diagrams Cpb
Presenting this set of slides with name digital recruitment trends ppt powerpoint presentation pictures diagrams cpb. This is an editable Powerpoint three stages graphic that deals with topics like digital recruitment trends to help convey your message better graphically. This product is a premium product available for immediate download and is 100 percent editable in Powerpoint. Download this now and use it in your presentations to impress your audience.
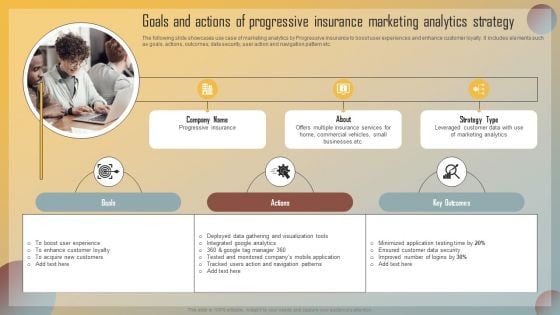
Guide For Marketing Analytics To Improve Decisions Goals And Actions Of Progressive Insurance Marketing Diagrams PDF
The following slide showcases use case of marketing analytics by Progressive insurance to boost user experiences and enhance customer loyalty. It includes elements such as goals, actions, outcomes, data security, user action and navigation pattern etc. Present like a pro with Guide For Marketing Analytics To Improve Decisions Goals And Actions Of Progressive Insurance Marketing Diagrams PDF Create beautiful presentations together with your team, using our easy to use presentation slides. Share your ideas in real time and make changes on the fly by downloading our templates. So whether you are in the office, on the go, or in a remote location, you can stay in sync with your team and present your ideas with confidence. With Slidegeeks presentation got a whole lot easier. Grab these presentations today.
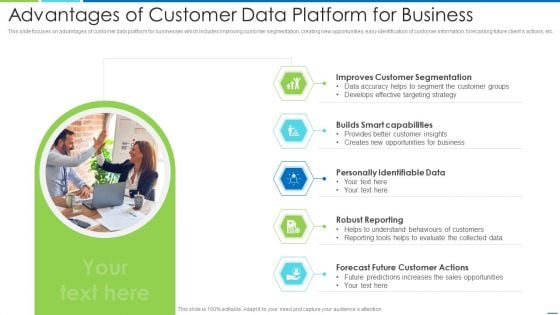
Advantages Of Customer Data Platform For Business Summary PDF
This slide focuses on advantages of customer data platform for businesses which includes improving customer segmentation, creating new opportunities, easy identification of customer information, forecasting future clients actions, etc. Presenting advantages of customer data platform for business summary pdf to dispense important information. This template comprises five stages. It also presents valuable insights into the topics including improves customer segmentation, builds smart capabilities, personally identifiable data, robust reporting, forecast future customer actions. This is a completely customizable PowerPoint theme that can be put to use immediately. So, download it and address the topic impactfully.
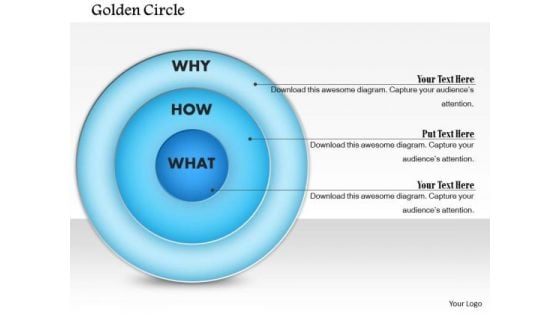
Business Framework Golden Circle PowerPoint Presentation
This business diagram has been designed with graphic of blue colored circle. This business slide is suitable to display data analysis in any business presentation. Use this slide to build a unique presentations for your viewers
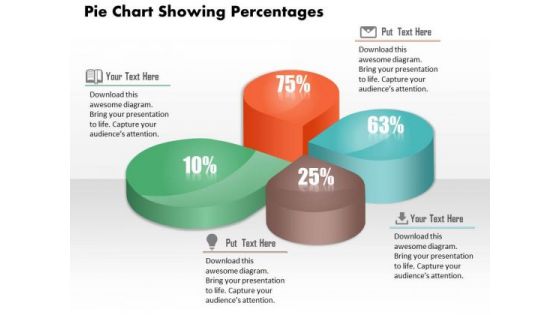
Business Diagram Pie Chart Showing Percentages Presentation Template
This image slide displays business consulting diagram of pie chart showing percentage. Pie Charts can be used to display a wide variety of information. When data is represented in the form of a pie chart the human eye finds it very easy to compare the data and quickly draw conclusions. In short they are a great visual aid and will add a touch of professionalism to any presentation which requires the display of data.

AI Logistics Management Automated Framework Themes PDF
The purpose of this slide is to showcase an automated workflow that compiles logistics data and forecasts operational outcomes by running different scenarios. Key components include plan, serve, source, deliver and make. Pitch your topic with ease and precision using this AI Logistics Management Automated Framework Themes PDF. This layout presents information on Demand Forecasting, Risk Analysis, Budget Analysis. It is also available for immediate download and adjustment. So, changes can be made in the color, design, graphics or any other component to create a unique layout.
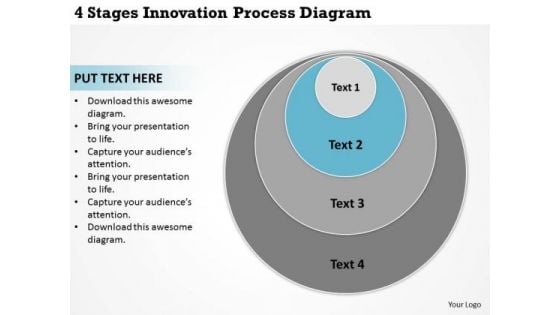
4 Stages Innovation Process Diagram Business Plan PowerPoint Slides
We present our 4 stages innovation process diagram business plan PowerPoint Slides.Use our Business PowerPoint Templates because It can Bubble and burst with your ideas. Present our Venn Diagrams PowerPoint Templates because Our PowerPoint Templates and Slides are topically designed to provide an attractive backdrop to any subject. Use our Layers PowerPoint Templates because Our PowerPoint Templates and Slides will embellish your thoughts. See them provide the desired motivation to your team. Download and present our Circle Charts PowerPoint Templates because You can Be the puppeteer with our PowerPoint Templates and Slides as your strings. Lead your team through the steps of your script. Use our Shapes PowerPoint Templates because Our PowerPoint Templates and Slides will effectively help you save your valuable time. They are readymade to fit into any presentation structure. Use these PowerPoint slides for presentations relating to diagram, process, business, graphic, design, ideas, model, data, chart, project, schema, corporate, implementation, tag, plan, engineering, concept, vector, success, symbol, stack, circle, guide, work flow, development, shape, team, management, cycle, steps, illustration, system, strategy, objects, phase, professional, organization, implement, background, image, detail, structure, product. The prominent colors used in the PowerPoint template are Blue light, Gray, White. Get all factions to act together. Our 4 Stages Innovation Process Diagram Business Plan PowerPoint Slides can help achieve a common cause.
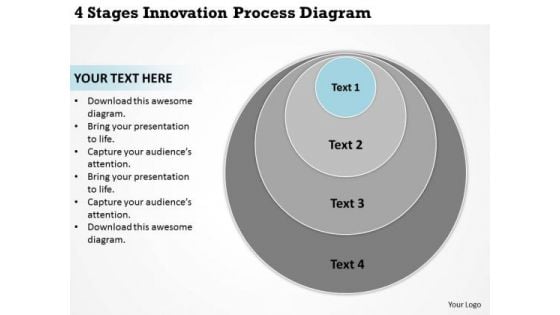
4 Stages Innovation Process Diagram Small Business PowerPoint Templates
We present our 4 stages innovation process diagram small business PowerPoint templates.Download our Business PowerPoint Templates because Our PowerPoint Templates and Slides are innately eco-friendly. Their high recall value negate the need for paper handouts. Use our Venn Diagrams PowerPoint Templates because Our PowerPoint Templates and Slides will provide weight to your words. They will bring out the depth of your thought process. Download our Layers PowerPoint Templates because Our PowerPoint Templates and Slides will weave a web of your great ideas. They are gauranteed to attract even the most critical of your colleagues. Present our Circle Charts PowerPoint Templates because Our PowerPoint Templates and Slides will let you Hit the target. Go the full distance with ease and elan. Download our Shapes PowerPoint Templates because Our PowerPoint Templates and Slides team portray an attitude of elegance. Personify this quality by using them regularly.Use these PowerPoint slides for presentations relating to diagram, process, business, graphic, design, ideas, model, data, chart, project, schema, corporate, implementation, tag, plan, engineering, concept, vector, success, symbol, stack, circle, guide, work flow, development, shape, team, management, cycle, steps, illustration, system, strategy, objects, phase, professional, organization, implement, background, image, detail, structure, product. The prominent colors used in the PowerPoint template are Blue light, Gray, White. Figure out the finances with our 4 Stages Innovation Process Diagram Small Business PowerPoint Templates. They help you get the calculations correct.
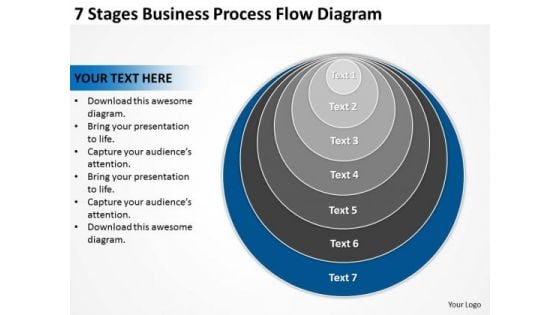
7 Stages Business Process Flow Diagram Plan PowerPoint Templates
We present our 7 stages business process flow diagram plan PowerPoint templates.Download our Business PowerPoint Templates because Our PowerPoint Templates and Slides are focused like a searchlight beam. They highlight your ideas for your target audience. Use our Venn Diagrams PowerPoint Templates because You have gained great respect for your brilliant ideas. Use our PowerPoint Templates and Slides to strengthen and enhance your reputation. Present our Layers PowerPoint Templates because Our PowerPoint Templates and Slides are focused like a searchlight beam. They highlight your ideas for your target audience. Use our Circle Charts PowerPoint Templates because Your success is our commitment. Our PowerPoint Templates and Slides will ensure you reach your goal. Present our Shapes PowerPoint Templates because You canTake a leap off the starting blocks with our PowerPoint Templates and Slides. They will put you ahead of the competition in quick time.Use these PowerPoint slides for presentations relating to diagram, process, business, graphic, design, ideas, model, data, chart, project, schema, corporate, implementation, tag, plan, engineering, concept, vector, success, symbol, stack, circle, guide, work flow, development, shape, team, management, cycle, steps, illustration, system, strategy, objects, phase, professional, organization, implement, background, image, detail, structure, product. The prominent colors used in the PowerPoint template are Blue, Black, Gray. Get people out of bed with our 7 Stages Business Process Flow Diagram Plan PowerPoint Templates. Just download, type and present.
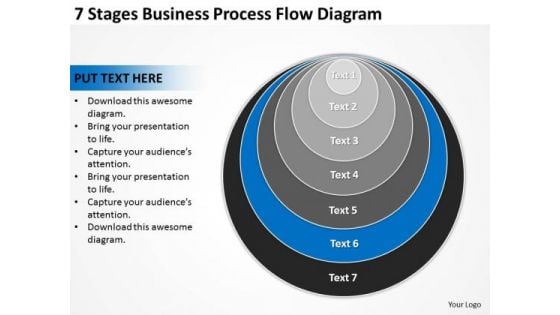
7 Stages Business Process Flow Diagram Ppt Plan PowerPoint Template
We present our 7 stages business process flow diagram ppt plan PowerPoint template.Download our Business PowerPoint Templates because It will Give impetus to the hopes of your colleagues. Our PowerPoint Templates and Slides will aid you in winning their trust. Present our Venn Diagrams PowerPoint Templates because Our PowerPoint Templates and Slides are truly out of this world. Even the MIB duo has been keeping tabs on our team. Download our Layers PowerPoint Templates because Our PowerPoint Templates and Slides will definately Enhance the stature of your presentation. Adorn the beauty of your thoughts with their colourful backgrounds. Download our Circle Charts PowerPoint Templates because You have the co-ordinates for your destination of success. Let our PowerPoint Templates and Slides map out your journey. Use our Shapes PowerPoint Templates because It can Conjure up grand ideas with our magical PowerPoint Templates and Slides. Leave everyone awestruck by the end of your presentation.Use these PowerPoint slides for presentations relating to diagram, process, business, graphic, design, ideas, model, data, chart, project, schema, corporate, implementation, tag, plan, engineering, concept, vector, success, symbol, stack, circle, guide, work flow, development, shape, team, management, cycle, steps, illustration, system, strategy, objects, phase, professional, organization, implement, background, image, detail, structure, product. The prominent colors used in the PowerPoint template are Blue light, Black, Gray. The assistance of our 7 Stages Business Process Flow Diagram Ppt Plan PowerPoint Template is not just figurative. Experience their effect in front of your eyes.
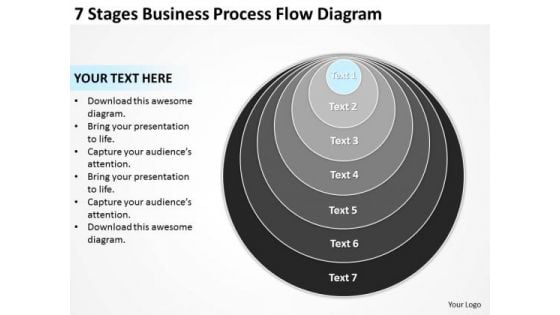
7 Stages Business Process Flow Diagram Ppt Plan PowerPoint Templates
We present our 7 stages business process flow diagram ppt plan PowerPoint templates.Present our Business PowerPoint Templates because you should once Tap the ingenuity of our PowerPoint Templates and Slides. They are programmed to succeed. Use our Venn Diagrams PowerPoint Templates because Our PowerPoint Templates and Slides are endowed to endure. Ideas conveyed through them will pass the test of time. Use our Layers PowerPoint Templates because You can Inspire your team with our PowerPoint Templates and Slides. Let the force of your ideas flow into their minds. Download and present our Circle Charts PowerPoint Templates because You can Inspire your team with our PowerPoint Templates and Slides. Let the force of your ideas flow into their minds. Present our Shapes PowerPoint Templates because Our PowerPoint Templates and Slides are effectively colour coded to prioritise your plans They automatically highlight the sequence of events you desire.Use these PowerPoint slides for presentations relating to diagram, process, business, graphic, design, ideas, model, data, chart, project, schema, corporate, implementation, tag, plan, engineering, concept, vector, success, symbol, stack, circle, guide, work flow, development, shape, team, management, cycle, steps, illustration, system, strategy, objects, phase, professional, organization, implement, background, image, detail, structure, product. The prominent colors used in the PowerPoint template are Blue light, Black, Gray. Put the audience firmly in your favour. Extract their appreciation with our 7 Stages Business Process Flow Diagram Ppt Plan PowerPoint Templates.
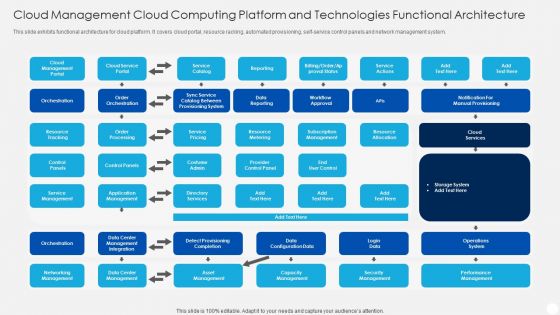
Cloud Management Cloud Computing Platform And Technologies Functional Architecture Inspiration PDF
This slide exhibits functional architecture for cloud platform. It covers cloud portal, resource racking, automated provisioning, self-service control panels and network management system. Presenting cloud management cloud computing platform and technologies functional architecture inspiration pdf to dispense important information. This template comprises one stages. It also presents valuable insights into the topics including cloud management portal, orchestration, resource tracking, control panels. This is a completely customizable PowerPoint theme that can be put to use immediately. So, download it and address the topic impactfully.
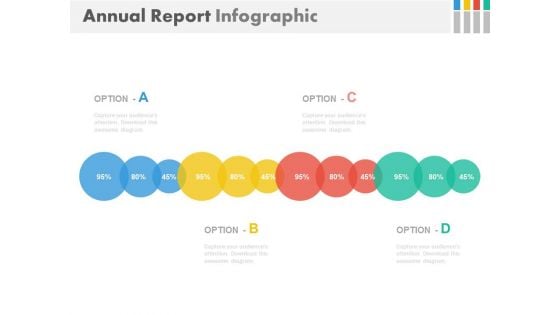
Linear Chart For Annual Business Report Powerpoint Slides
This PowerPoint template contains graphics of linear circle chart. You may download this PPT slide design to display annual business report. You can easily customize this template to make it more unique as per your need.
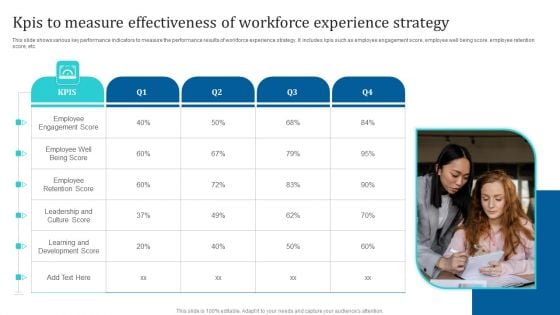
Kpis To Measure Effectiveness Of Workforce Experience Strategy Ppt PowerPoint Presentation File Ideas PDF
This slide shows various key performance indicators to measure the performance results of workforce experience strategy. It includes kpis such as employee engagement score, employee well being score, employee retention score, etc. Presenting Kpis To Measure Effectiveness Of Workforce Experience Strategy Ppt PowerPoint Presentation File Ideas PDF to dispense important information. This template comprises four stages. It also presents valuable insights into the topics including Employee Engagement Score, Employee Retention Score, Culture Score. This is a completely customizable PowerPoint theme that can be put to use immediately. So, download it and address the topic impactfully.

Business Data Graph Finance PowerPoint Themes And PowerPoint Slides 0511
Microsoft PowerPoint Slide and Theme with increasing bar chart business data graph with world map The audience will erupt in applause. Touch their hearts with our Business Data Graph Finance PowerPoint Themes And PowerPoint Slides 0511.
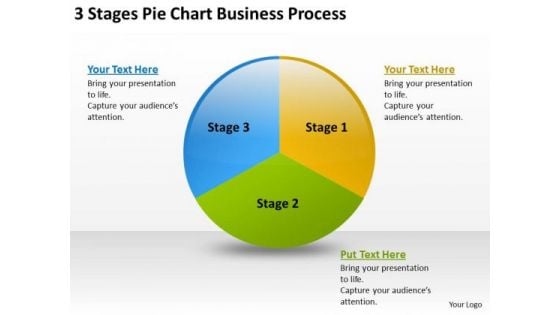
Chart Business PowerPoint Theme Process Writing Simple Plan Templates
We present our chart business powerpoint theme process writing simple plan templates.Download and present our Circle Charts PowerPoint Templates because Our PowerPoint Templates and Slides are aesthetically designed to attract attention. We gaurantee that they will grab all the eyeballs you need. Download and present our Flow Charts PowerPoint Templates because It is Aesthetically crafted by artistic young minds. Our PowerPoint Templates and Slides are designed to display your dexterity. Present our Business PowerPoint Templates because You can Stir your ideas in the cauldron of our PowerPoint Templates and Slides. Cast a magic spell on your audience. Download and present our Shapes PowerPoint Templates because you can Break through with our PowerPoint Templates and Slides. Bring down the mental barriers of your audience. Present our Marketing PowerPoint Templates because It can Bubble and burst with your ideas.Use these PowerPoint slides for presentations relating to Analyzing, business, capital, commerce, communication, company, decrease, descending, direction, earnings, economic, economy, finance, financial, graph,grow, growth, index, information, investment, leader, manage, management, marketing, money, organization, part, partition, percentage, pie, piechart, graph, piece, plan, presentation, process, profit, progress, report, resource, results, selling, slice, statistic, success, system, team, theory. The prominent colors used in the PowerPoint template are Green, Yellow, Blue. Set up the base with our Chart Business PowerPoint Theme Process Writing Simple Plan Templates. You will soon celebrate success.
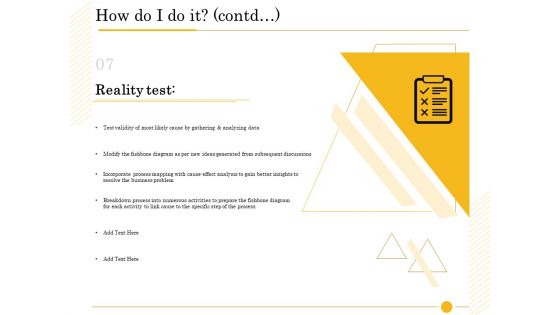
The Fishbone Analysis Tool How Do I Do It Contd Activities Infographics PDF
Deliver an awe-inspiring pitch with this creative the fishbone analysis tool how do i do it contd activities infographics pdf bundle. Topics like gathering analyzing data, modify fishbone diagram, incorporate process mapping, activities prepare, subsequent discussions, specific process can be discussed with this completely editable template. It is available for immediate download depending on the needs and requirements of the user.
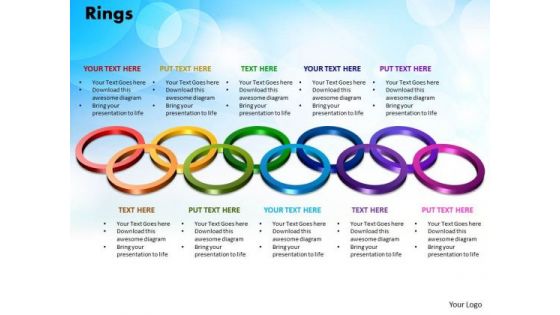
PowerPoint Process Rings Business Ppt Theme
PowerPoint Process Rings Business PPT Theme-This PowerPoint Diagram Shows the Colorful Interconnected Rings. SmartArt graphics add color, shape, and emphasis to your text and data, and they're a snap to use. This PowerPoint Template Signifies the Strategy, Planning required for Business.-PowerPoint Process Rings Business PPT Theme Make unique presentations with our PowerPoint Process Rings Business Ppt Theme. You'll always stay ahead of the game.
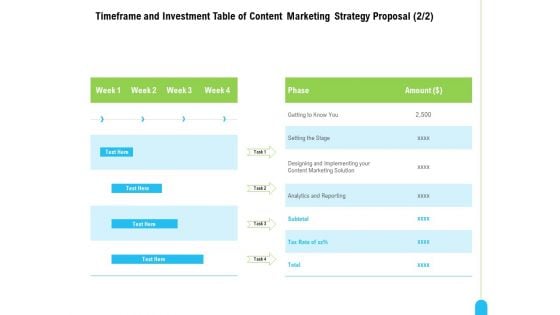
Strategic Marketing Approach Timeframe Investment Table Of Content Marketing Strategy Proposal Phase Summary PDF
Deliver an awe-inspiring pitch with this creative strategic marketing approach timeframe investment table of content marketing strategy proposal phase summary pdf bundle. Topics like designing and implementing your content marketing solution, analytics and reporting can be discussed with this completely editable template. It is available for immediate download depending on the needs and requirements of the user.
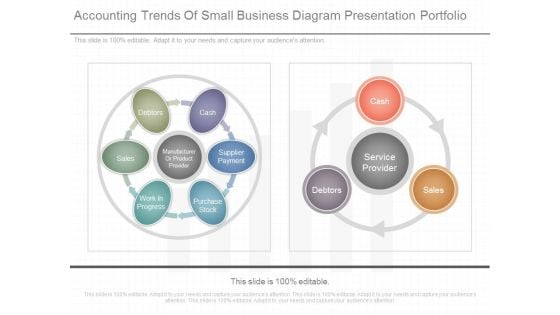
Accounting Trends Of Small Business Diagram Presentation Portfolio
This is a accounting trends of small business diagram presentation portfolio. This is a one stage process. The stages in this process are manufacturer or product provider, cash, supplier payment, purchase stock, work in progress, sales, service provider, cash, debtors, sales.
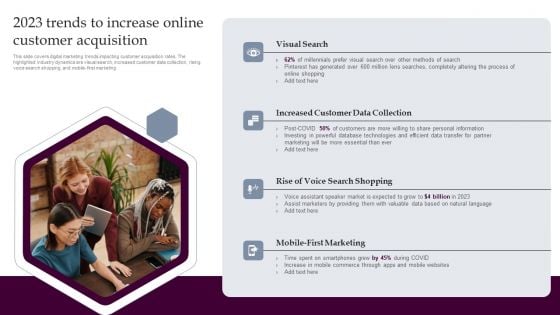
2023 Trends To Increase Online Customer Acquisition Strategies For Acquiring Consumers Themes PDF
This slide covers digital marketing trends impacting customer acquisition rates. The highlighted industry dynamics are visual search, increased customer data collection, rising voice search shopping, and mobile-first marketing. If you are looking for a format to display your unique thoughts, then the professionally designed 30 60 90 Days Plan Strategies For Acquiring Consumers With Customer Acquisition Budget Mockup PDF is the one for you. You can use it as a Google Slides template or a PowerPoint template. Incorporate impressive visuals, symbols, images, and other charts. Modify or reorganize the text boxes as you desire. Experiment with shade schemes and font pairings. Alter, share or cooperate with other people on your work. Download 30 60 90 Days Plan Strategies For Acquiring Consumers With Customer Acquisition Budget Mockup PDF and find out how to give a successful presentation. Present a perfect display to your team and make your presentation unforgettable.
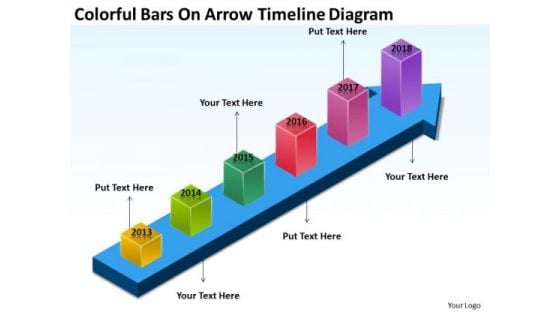
Colorful Bars On Arrow Timeline Diagram Developing Business Plan PowerPoint Slides
We present our colorful bars on arrow timeline diagram developing business plan PowerPoint Slides.Use our Arrows PowerPoint Templates because It can Bubble and burst with your ideas. Download our Business PowerPoint Templates because our PowerPoint Templates and Slides are a looking glass. Train them on the magnificent future you have in mind. Present our Finance PowerPoint Templates because Our PowerPoint Templates and Slides are like the strings of a tennis racquet. Well strung to help you serve aces. Download and present our Marketing PowerPoint Templates because Our PowerPoint Templates and Slides will let you Hit the target. Go the full distance with ease and elan. Present our Success PowerPoint Templates because Our PowerPoint Templates and Slides are focused like a searchlight beam. They highlight your ideas for your target audience.Use these PowerPoint slides for presentations relating to achievement, analyzing, arrow sign, aspirations, bar graph, bull market, business, chart, concepts, data, diagram, expressing positivity, finance, graph, graphic, grow, growth, height chart, idea, illustration, image, improvement, inflation, investment, making money, market, marketing, measure, money, moving, moving up, number, price, profit, progress, report, rise, savings, shiny, sign, solution, statistic, stock, stock market, success, symbol, up, white. The prominent colors used in the PowerPoint template are Blue, Yellow, Green. Our Colorful Bars On Arrow Timeline Diagram Developing Business Plan PowerPoint Slides conform to all clauses. They are amenable to any conditions.
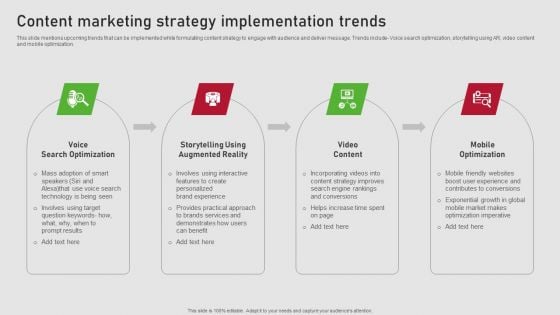
Creating Content Marketing Technique For Brand Promotions Content Marketing Strategy Implementation Trends Themes PDF
This slide mentions upcoming trends that can be implemented while formulating content strategy to engage with audience and deliver message. Trends include- Voice search optimization, storytelling using AR, video content and mobile optimization. Whether you have daily or monthly meetings, a brilliant presentation is necessary. Creating Content Marketing Technique For Brand Promotions Content Marketing Strategy Implementation Trends Themes PDF can be your best option for delivering a presentation. Represent everything in detail using Creating Content Marketing Technique For Brand Promotions Content Marketing Strategy Implementation Trends Themes PDF and make yourself stand out in meetings. The template is versatile and follows a structure that will cater to your requirements. All the templates prepared by Slidegeeks are easy to download and edit. Our research experts have taken care of the corporate themes as well. So, give it a try and see the results.
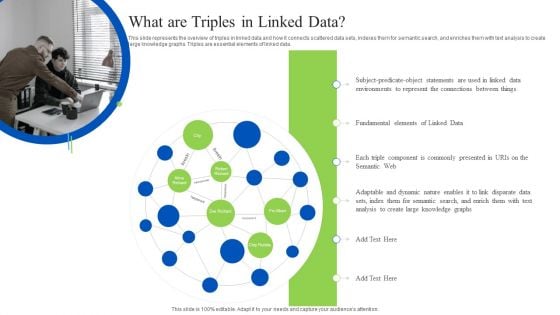
Linked Data Visualization What Are Triples In Linked Data Ppt Model Topics PDF
This slide represents the overview of triples in linked data and how it connects scattered data sets, indexes them for semantic search, and enriches them with text analysis to create large knowledge graphs. Triples are essential elements of linked data. Retrieve professionally designed Linked Data Visualization What Are Triples In Linked Data Ppt Model Topics PDF to effectively convey your message and captivate your listeners. Save time by selecting pre-made slideshows that are appropriate for various topics, from business to educational purposes. These themes come in many different styles, from creative to corporate, and all of them are easily adjustable and can be edited quickly. Access them as PowerPoint templates or as Google Slides themes. You dont have to go on a hunt for the perfect presentation because Slidegeeks got you covered from everywhere.
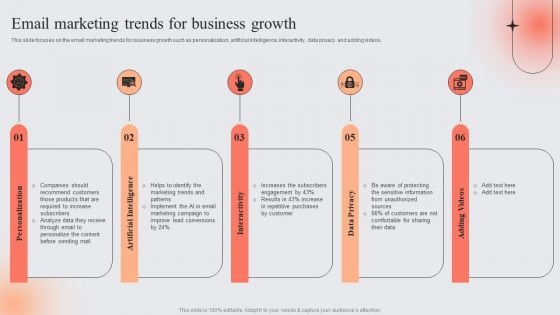
E Marketing Techniques To Boost Sales Email Marketing Trends For Business Growth Introduction PDF
This slide focuses on the email marketing trends for business growth such as personalization, artificial intelligence, interactivity, data privacy and adding videos. Do you know about Slidesgeeks E Marketing Techniques To Boost Sales Email Marketing Trends For Business Growth Introduction PDF. These are perfect for delivering any kind od presentation. Using it, create PowerPoint presentations that communicate your ideas and engage audiences. Save time and effort by using our pre designed presentation templates that are perfect for a wide range of topic. Our vast selection of designs covers a range of styles, from creative to business, and are all highly customizable and easy to edit. Download as a PowerPoint template or use them as Google Slides themes.
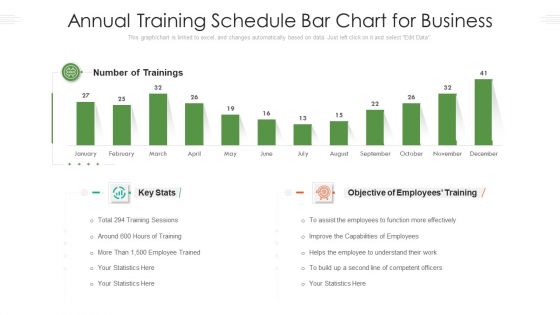
Annual Training Schedule Bar Chart For Business Ppt PowerPoint Presentation File Infographics PDF
This graph chart is linked to excel, and changes automatically based on data. Just left click on it and select Edit Data. Showcasing this set of slides titled annual training schedule bar chart for business ppt powerpoint presentation file infographics pdf. The topics addressed in these templates are trainings, employees, competent officers. All the content presented in this PPT design is completely editable. Download it and make adjustments in color, background, font etc. as per your unique business setting.
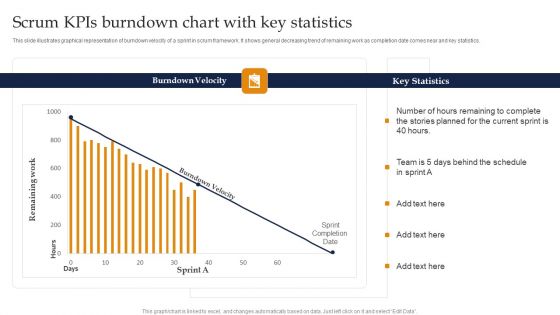
Scrum Kpis Burndown Chart With Key Statistics Ppt Pictures Visual Aids PDF
This slide illustrates graphical representation of burndown velocity of a sprint in scrum framework. It shows general decreasing trend of remaining work as completion date comes near and key statistics. Pitch your topic with ease and precision using this Scrum Kpis Burndown Chart With Key Statistics Ppt Pictures Visual Aids PDF. This layout presents information on Burndown Velocity, Key Statistics, Current Sprint. It is also available for immediate download and adjustment. So, changes can be made in the color, design, graphics or any other component to create a unique layout.
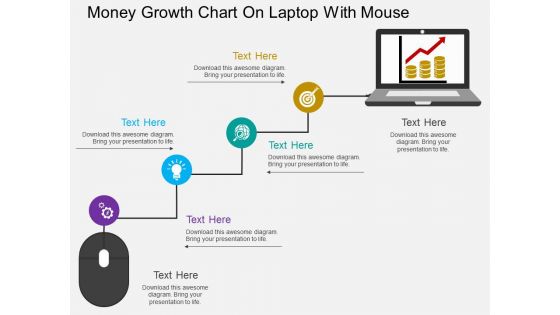
Money Growth Chart On Laptop With Mouse Powerpoint Template
This business slide displays money growth chart on laptop with mouse. This diagram is a data visualization tool that gives you a simple way to present statistical information. This slide helps your audience examine and interpret the data you present.

Construction Production Facilities Key Technology Trends In Infrastructure Diagrams PDF
Presenting this set of slides with name construction production facilities key technology trends in infrastructure diagrams pdf. This is a five stage process. The stages in this process are ageing workforce, smart city and smart customer, industrial internet of things iot, diversification and internationalization, urbanization and ageing infrastructure. This is a completely editable PowerPoint presentation and is available for immediate download. Download now and impress your audience.
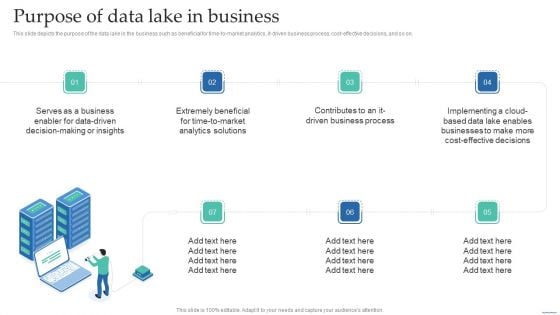
Purpose Of Data Lake In Business Data Lake Creation With Hadoop Cluster Summary PDF
This slide depicts the purpose of the data lake in the business such as beneficial for time-to-market analytics, it-driven business process, cost-effective decisions, and so on.Do you know about Slidesgeeks Purpose Of Data Lake In Business Data Lake Creation With Hadoop Cluster Summary PDF These are perfect for delivering any kind od presentation. Using it, create PowerPoint presentations that communicate your ideas and engage audiences. Save time and effort by using our pre-designed presentation templates that are perfect for a wide range of topic. Our vast selection of designs covers a range of styles, from creative to business, and are all highly customizable and easy to edit. Download as a PowerPoint template or use them as Google Slides themes.
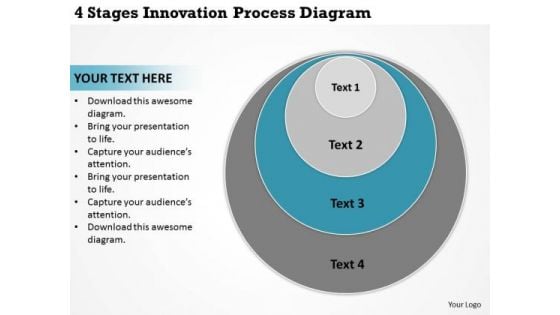
4 Stages Innovation Process Diagram Best Business Plan Templates PowerPoint Slides
We present our 4 stages innovation process diagram best business plan templates PowerPoint Slides.Present our Business PowerPoint Templates because Our PowerPoint Templates and Slides will embellish your thoughts. See them provide the desired motivation to your team. Use our Venn Diagrams PowerPoint Templates because You should Ascend the ladder of success with ease. Our PowerPoint Templates and Slides will provide strong and sturdy steps. Download and present our Layers PowerPoint Templates because It can be used to Set your controls for the heart of the sun. Our PowerPoint Templates and Slides will be the propellant to get you there. Download our Circle Charts PowerPoint Templates because You are an avid believer in ethical practices. Highlight the benefits that accrue with our PowerPoint Templates and Slides. Use our Shapes PowerPoint Templates because Our PowerPoint Templates and Slides ensures Effective communication. They help you put across your views with precision and clarity.Use these PowerPoint slides for presentations relating to diagram, process, business, graphic, design, ideas, model, data, chart, project, schema, corporate, implementation, tag, plan, engineering, concept, vector, success, symbol, stack, circle, guide, work flow, development, shape, team, management, cycle, steps, illustration, system, strategy, objects, phase, professional, organization, implement, background, image, detail, structure, product. The prominent colors used in the PowerPoint template are Blue light, Gray, White. Beat criticism with our 4 Stages Innovation Process Diagram Best Business Plan Templates PowerPoint Slides. You will come out on top.
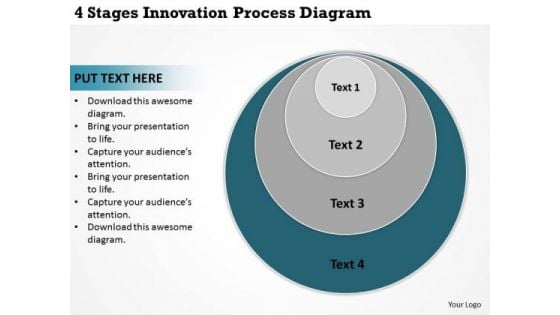
4 Stages Innovation Process Diagram Ppt Simple Business Plans PowerPoint Templates
We present our 4 stages innovation process diagram ppt simple business plans PowerPoint templates.Present our Business PowerPoint Templates because Our PowerPoint Templates and Slides provide you with a vast range of viable options. Select the appropriate ones and just fill in your text. Download our Venn Diagrams PowerPoint Templates because Our PowerPoint Templates and Slides will effectively help you save your valuable time. They are readymade to fit into any presentation structure. Download our Layers PowerPoint Templates because Our PowerPoint Templates and Slides will Activate the energies of your audience. Get their creative juices flowing with your words. Present our Circle Charts PowerPoint Templates because It is Aesthetically crafted by artistic young minds. Our PowerPoint Templates and Slides are designed to display your dexterity. Download our Shapes PowerPoint Templates because Our PowerPoint Templates and Slides are conceived by a dedicated team. Use them and give form to your wondrous ideas.Use these PowerPoint slides for presentations relating to diagram, process, business, graphic, design, ideas, model, data, chart, project, schema, corporate, implementation, tag, plan, engineering, concept, vector, success, symbol, stack, circle, guide, work flow, development, shape, team, management, cycle, steps, illustration, system, strategy, objects, phase, professional, organization, implement, background, image, detail, structure, product. The prominent colors used in the PowerPoint template are Blue, Gray, White. You have been given an exacting task. Plan your approach with our 4 Stages Innovation Process Diagram Ppt Simple Business Plans PowerPoint Templates.
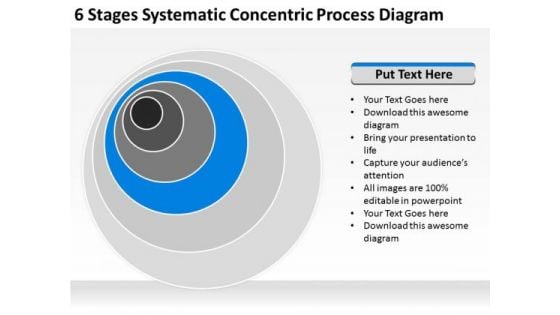
6 Stages Systematic Concentric Process Diagram Business Plan Companies PowerPoint Slides
We present our 6 stages systematic concentric process diagram business plan companies PowerPoint Slides.Download our Business PowerPoint Templates because Our PowerPoint Templates and Slides will Embellish your thoughts. They will help you illustrate the brilliance of your ideas. Download and present our Venn Diagrams PowerPoint Templates because Your audience will believe you are the cats whiskers. Download our Layers PowerPoint Templates because Our PowerPoint Templates and Slides will let you Hit the right notes. Watch your audience start singing to your tune. Download our Circle Charts PowerPoint Templates because Our PowerPoint Templates and Slides are truly out of this world. Even the MIB duo has been keeping tabs on our team. Use our Shapes PowerPoint Templates because Our PowerPoint Templates and Slides are topically designed to provide an attractive backdrop to any subject.Use these PowerPoint slides for presentations relating to diagram, process, business, graphic, design, ideas, model, data, chart, project, schema, corporate, implementation, tag, plan, engineering, concept, vector, success, symbol, stack, circle, guide, work flow, development, shape, team, management, cycle, steps, illustration, system, strategy, objects, phase, professional, organization, implement, background, image, detail, structure, product. The prominent colors used in the PowerPoint template are Blue light, Gray, White. Our 6 Stages Systematic Concentric Process Diagram Business Plan Companies PowerPoint Slides have more than what meets the eye. They contain additional dimensions.
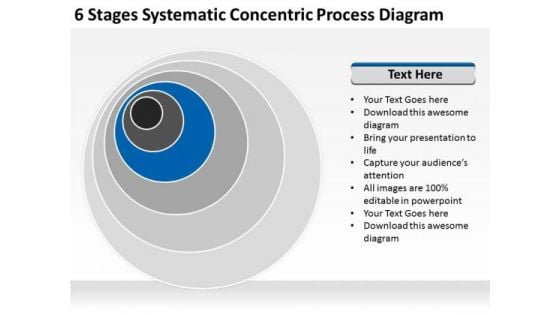
6 Stages Systematic Concentric Process Diagram Business Plan Formats PowerPoint Slides
We present our 6 stages systematic concentric process diagram business plan formats PowerPoint Slides.Use our Business PowerPoint Templates because You should Throw the gauntlet with our PowerPoint Templates and Slides. They are created to take up any challenge. Download and present our Venn Diagrams PowerPoint Templates because Our PowerPoint Templates and Slides has conjured up a web of all you need with the help of our great team. Use them to string together your glistening ideas. Use our Layers PowerPoint Templates because Our PowerPoint Templates and Slides will let you Hit the target. Go the full distance with ease and elan. Download and present our Circle Charts PowerPoint Templates because Our PowerPoint Templates and Slides will provide you the cutting edge. Slice through the doubts in the minds of your listeners. Download and present our Shapes PowerPoint Templates because They will Put your wonderful verbal artistry on display. Our PowerPoint Templates and Slides will provide you the necessary glam and glitter.Use these PowerPoint slides for presentations relating to diagram, process, business, graphic, design, ideas, model, data, chart, project, schema, corporate, implementation, tag, plan, engineering, concept, vector, success, symbol, stack, circle, guide, work flow, development, shape, team, management, cycle, steps, illustration, system, strategy, objects, phase, professional, organization, implement, background, image, detail, structure, product. The prominent colors used in the PowerPoint template are Blue, Black, Gray. Observe growth with our 6 Stages Systematic Concentric Process Diagram Business Plan Formats PowerPoint Slides. Download without worries with our money back guaranteee.
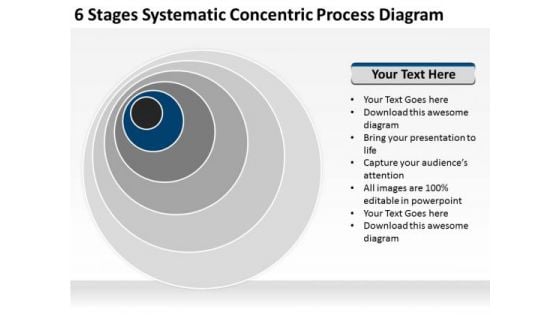
6 Stages Systematic Concentric Process Diagram Online Business Plan PowerPoint Slides
We present our 6 stages systematic concentric process diagram online business plan PowerPoint Slides.Download our Business PowerPoint Templates because Our PowerPoint Templates and Slides will let you Illuminate the road ahead to Pinpoint the important landmarks along the way. Present our Venn Diagrams PowerPoint Templates because Your audience will believe you are the cats whiskers. Download our Layers PowerPoint Templates because you can Add colour to your speech with our PowerPoint Templates and Slides. Your presentation will leave your audience speechless. Present our Circle Charts PowerPoint Templates because Our PowerPoint Templates and Slides offer you the needful to organise your thoughts. Use them to list out your views in a logical sequence. Present our Shapes PowerPoint Templates because Our PowerPoint Templates and Slides will let your team Walk through your plans. See their energy levels rise as you show them the way.Use these PowerPoint slides for presentations relating to diagram, process, business, graphic, design, ideas, model, data, chart, project, schema, corporate, implementation, tag, plan, engineering, concept, vector, success, symbol, stack, circle, guide, work flow, development, shape, team, management, cycle, steps, illustration, system, strategy, objects, phase, professional, organization, implement, background, image, detail, structure, product. The prominent colors used in the PowerPoint template are Blue, Black, Gray. Depend on no one with our 6 Stages Systematic Concentric Process Diagram Online Business Plan PowerPoint Slides. You will come out on top.
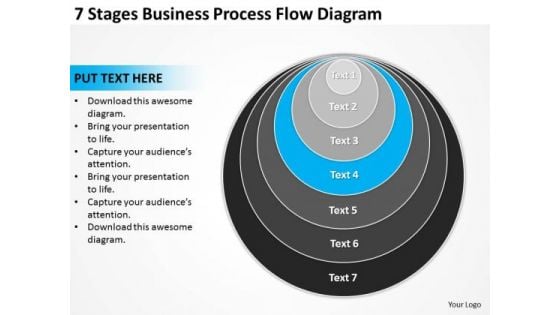
7 Stages Business Process Flow Diagram Ppt Basic Plan PowerPoint Slides
We present our 7 stages business process flow diagram ppt basic plan PowerPoint Slides.Present our Business PowerPoint Templates because Our PowerPoint Templates and Slides will generate and maintain the level of interest you desire. They will create the impression you want to imprint on your audience. Download our Venn Diagrams PowerPoint Templates because Our PowerPoint Templates and Slides come in all colours, shades and hues. They help highlight every nuance of your views. Present our Layers PowerPoint Templates because It will let you Set new benchmarks with our PowerPoint Templates and Slides. They will keep your prospects well above par. Download our Circle Charts PowerPoint Templates because our PowerPoint Templates and Slides are the string of your bow. Fire of your ideas and conquer the podium. Present our Shapes PowerPoint Templates because Our PowerPoint Templates and Slides offer you the needful to organise your thoughts. Use them to list out your views in a logical sequence.Use these PowerPoint slides for presentations relating to diagram, process, business, graphic, design, ideas, model, data, chart, project, schema, corporate, implementation, tag, plan, engineering, concept, vector, success, symbol, stack, circle, guide, work flow, development, shape, team, management, cycle, steps, illustration, system, strategy, objects, phase, professional, organization, implement, background, image, detail, structure, product. The prominent colors used in the PowerPoint template are Blue, Black, Gray. Bolster the excitement with our 7 Stages Business Process Flow Diagram Ppt Basic Plan PowerPoint Slides. They will not let the enthusiasm fade.
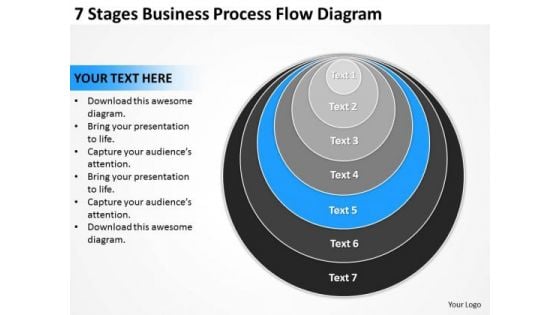
7 Stages Business Process Flow Diagram Ppt Plan Model PowerPoint Templates
We present our 7 stages business process flow diagram ppt plan model PowerPoint templates.Present our Business PowerPoint Templates because Our PowerPoint Templates and Slides will embellish your thoughts. See them provide the desired motivation to your team. Download and present our Venn Diagrams PowerPoint Templates because It will Give impetus to the hopes of your colleagues. Our PowerPoint Templates and Slides will aid you in winning their trust. Present our Layers PowerPoint Templates because Our PowerPoint Templates and Slides will let you Illuminate the road ahead to Pinpoint the important landmarks along the way. Download and present our Circle Charts PowerPoint Templates because You aspire to touch the sky with glory. Let our PowerPoint Templates and Slides provide the fuel for your ascent. Download our Shapes PowerPoint Templates because Our PowerPoint Templates and Slides offer you the widest possible range of options.Use these PowerPoint slides for presentations relating to diagram, process, business, graphic, design, ideas, model, data, chart, project, schema, corporate, implementation, tag, plan, engineering, concept, vector, success, symbol, stack, circle, guide, work flow, development, shape, team, management, cycle, steps, illustration, system, strategy, objects, phase, professional, organization, implement, background, image, detail, structure, product. The prominent colors used in the PowerPoint template are Blue, Black, Gray. Customise your 7 Stages Business Process Flow Diagram Ppt Plan Model PowerPoint Templates as per your choice. Discover that they are amenable and adaptive.
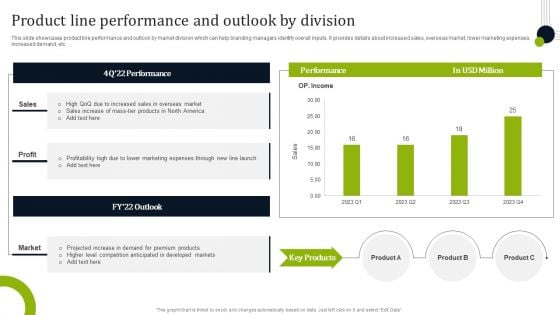
Introducing New Commodities Through Product Line Extension Product Line Performance And Outlook Infographics PDF
This slide showcases product line performance and outlook by market division which can help branding managers identify overall inputs. It provides details about increased sales, overseas market, lower marketing expenses, increased demand, etc. The Introducing New Commodities Through Product Line Extension Product Line Performance And Outlook Infographics PDF is a compilation of the most recent design trends as a series of slides. It is suitable for any subject or industry presentation, containing attractive visuals and photo spots for businesses to clearly express their messages. This template contains a variety of slides for the user to input data, such as structures to contrast two elements, bullet points, and slides for written information. Slidegeeks is prepared to create an impression.
Agenda Checklist Infographic For Business Performance Management Tool Themes PDF
Persuade your audience using this agenda checklist infographic for business performance management tool themes pdf. This PPT design covers three stages, thus making it a great tool to use. It also caters to a variety of topics including agenda checklist infographic for business performance management tool. Download this PPT design now to present a convincing pitch that not only emphasizes the topic but also showcases your presentation skills.
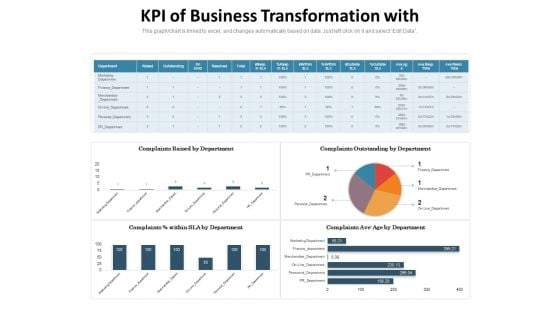
KPI Of Business Transformation With Ppt PowerPoint Presentation Infographics Microsoft PDF
Presenting this set of slides with name kpi of business transformation with ppt powerpoint presentation infographics microsoft pdf. The topics discussed in these slides are complaints raised by department, complaints outstanding by department, complaints ave age by department, marketing department, finance marketing. This is a completely editable PowerPoint presentation and is available for immediate download. Download now and impress your audience.
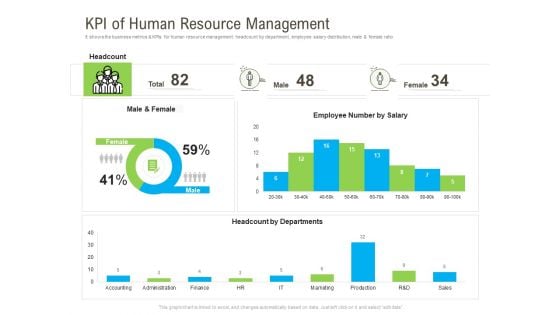
Rapid Innovation In HR Technology Space KPI Of Human Resource Management Infographics PDF
Deliver an awe inspiring pitch with this creative rapid innovation in hr technology space kpi of human resource management infographics pdf bundle. Topics like accounting, administration, finance, marketing, sales can be discussed with this completely editable template. It is available for immediate download depending on the needs and requirements of the user.

Business Framework 3 Axis Graph Diagram PowerPoint Presentation
This business diagram displays 3 axis graphs with cubes. This editable slide contains the concept of business and success. Use this diagram in your business presentations to display data in graphical manner.

Factors That Affects Data Integration Architecture Data Integration Strategies For Business
This slide highlights the various factor that effect data integration architecture. The purpose of this slide is to explain the data integration architecture factors that are storage, cloud-based, ETL vs. ELT, real-time data integration, and AI-powered and their structural impact on architecture. Retrieve professionally designed Factors That Affects Data Integration Architecture Data Integration Strategies For Business to effectively convey your message and captivate your listeners. Save time by selecting pre-made slideshows that are appropriate for various topics, from business to educational purposes. These themes come in many different styles, from creative to corporate, and all of them are easily adjustable and can be edited quickly. Access them as PowerPoint templates or as Google Slides themes. You do not have to go on a hunt for the perfect presentation because Slidegeeks got you covered from everywhere. This slide highlights the various factor that effect data integration architecture. The purpose of this slide is to explain the data integration architecture factors that are storage, cloud-based, ETL vs. ELT, real-time data integration, and AI-powered and their structural impact on architecture.
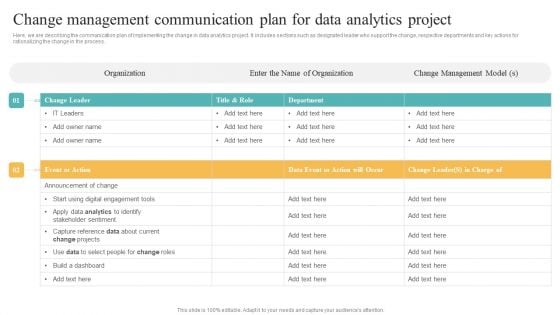
Change Management Communication Plan For Data Analytics Project Topics PDF
Here, we are describing the communication plan of implementing the change in data analytics project. It includes sections such as designated leader who support the change, respective departments and key actions for rationalizing the change in the process. If you are looking for a format to display your unique thoughts, then the professionally designed Change Management Communication Plan For Data Analytics Project Topics PDF is the one for you. You can use it as a Google Slides template or a PowerPoint template. Incorporate impressive visuals, symbols, images, and other charts. Modify or reorganize the text boxes as you desire. Experiment with shade schemes and font pairings. Alter, share or cooperate with other people on your work. Download Change Management Communication Plan For Data Analytics Project Topics PDF and find out how to give a successful presentation. Present a perfect display to your team and make your presentation unforgettable.
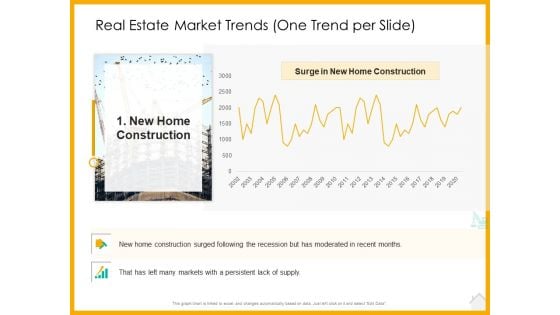
Real Estate Property Management System Real Estate Market Trends One Trend Per Slide Construction Ppt Infographics Visuals PDF
Deliver and pitch your topic in the best possible manner with this real estate property management system real estate market trends one trend per slide construction ppt infographics visuals pdf. Use them to share invaluable insights on real estate market trends one trend per slide and impress your audience. This template can be altered and modified as per your expectations. So, grab it now.

 Home
Home