Dashboard Icon
Dashboard For Tracking Efficiency Of Job Position Reorganization Communication Plan Pictures Pdf
This slide displays the dashboard for tracking the efficiency of business communication plan for restructuring job positions. The purpose of this slide is to help the business manager effectively communicate all necessary information to relevant stakeholders for smooth transitioning.Showcasing this set of slides titled Dashboard For Tracking Efficiency Of Job Position Reorganization Communication Plan Pictures Pdf The topics addressed in these templates are Stakeholder Possesses, Overall Experience, Pending Scores All the content presented in this PPT design is completely editable. Download it and make adjustments in color, background, font etc. as per your unique business setting. This slide displays the dashboard for tracking the efficiency of business communication plan for restructuring job positions. The purpose of this slide is to help the business manager effectively communicate all necessary information to relevant stakeholders for smooth transitioning.
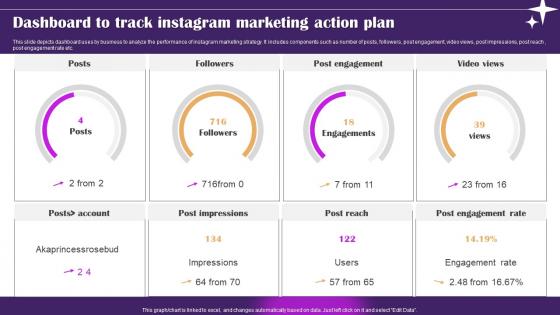
Dashboard To Track Instagram Marketing Action Plan Ppt Professional Image pdf
This slide depicts dashboard uses by business to analyze the performance of instagram marketing strategy. It includes components such as number of posts, followers, post engagement, video views, post impressions, post reach, post engagement rate etc. Showcasing this set of slides titled Dashboard To Track Instagram Marketing Action Plan Ppt Professional Image pdf. The topics addressed in these templates are Post Engagement, Video Views. All the content presented in this PPT design is completely editable. Download it and make adjustments in color, background, font etc. as per your unique business setting. This slide depicts dashboard uses by business to analyze the performance of instagram marketing strategy. It includes components such as number of posts, followers, post engagement, video views, post impressions, post reach , post engagement rate etc.
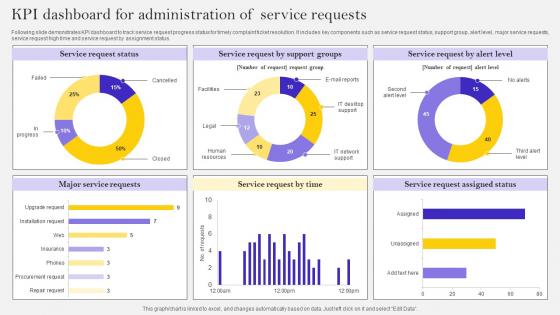
KPI Dashboard For Administration Of Service Requests Ppt Show Inspiration Pdf
Following slide demonstrates KPI dashboard to track service request progress status for timely complaint ticket resolution. It includes key components such as service request status, support group, alert level, major service requests, service request high time and service request by assignment status. Showcasing this set of slides titled KPI Dashboard For Administration Of Service Requests Ppt Show Inspiration Pdf. The topics addressed in these templates are Major Service Requests, Service Request, High Time. All the content presented in this PPT design is completely editable. Download it and make adjustments in color, background, font etc. as per your unique business setting. Following slide demonstrates KPI dashboard to track service request progress status for timely complaint ticket resolution. It includes key components such as service request status, support group, alert level, major service requests, service request high time and service request by assignment status.
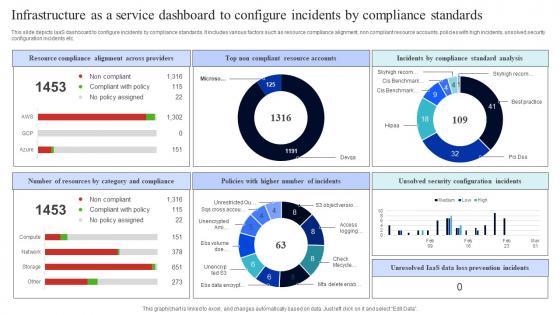
Infrastructure As A Service Dashboard To Configure Incidents By Compliance Standards Rules Pdf
This slide depicts IaaS dashboard to configure incidents by compliance standards. It includes various factors such as resource compliance alignment, non compliant resource accounts, policies with high incidents, unsolved security configuration incidents etc. Pitch your topic with ease and precision using this Infrastructure As A Service Dashboard To Configure Incidents By Compliance Standards Rules Pdf. This layout presents information on Resource Compliance Alignment, Across Providers, Top Non Compliant, Resource Accounts. It is also available for immediate download and adjustment. So, changes can be made in the color, design, graphics or any other component to create a unique layout. This slide depicts IaaS dashboard to configure incidents by compliance standards. It includes various factors such as resource compliance alignment, non compliant resource accounts, policies with high incidents, unsolved security configuration incidents etc.
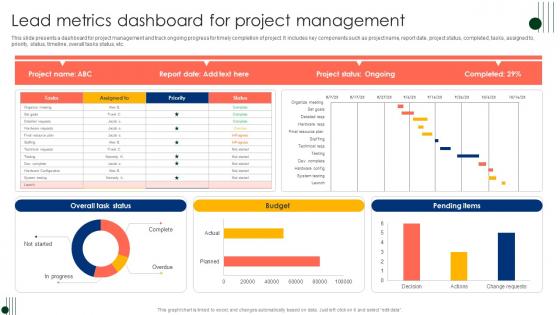
Lead Metrics Dashboard For Project Management Ppt Inspiration Example Introduction Pdf
This slide presents a dashboard for project management and track ongoing progress for timely completion of project. It includes key components such as project name, report date, project status, completed, tasks, assigned to, priority, status, timeline, overall tasks status, etc. Pitch your topic with ease and precision using this Lead Metrics Dashboard For Project Management Ppt Inspiration Example Introduction Pdf. This layout presents information on Project Status, Completed, Tasks, Assigned To. It is also available for immediate download and adjustment. So, changes can be made in the color, design, graphics or any other component to create a unique layout. This slide presents a dashboard for project management and track ongoing progress for timely completion of project. It includes key components such as project name, report date, project status, completed, tasks, assigned to, priority, status, timeline, overall tasks status, etc.
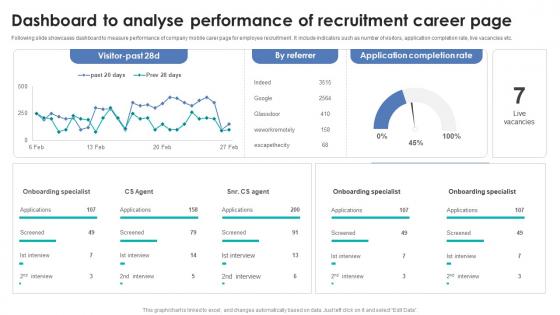
Integrating Automation For Effective Business Dashboard To Analyse Performance Of Recruitment
Following slide showcases dashboard to measure performance of company mobile carer page for employee recruitment . It include indicators such as number of visitors, application completion rate, live vacancies etc. Present like a pro with Integrating Automation For Effective Business Dashboard To Analyse Performance Of Recruitment. Create beautiful presentations together with your team, using our easy-to-use presentation slides. Share your ideas in real-time and make changes on the fly by downloading our templates. So whether you are in the office, on the go, or in a remote location, you can stay in sync with your team and present your ideas with confidence. With Slidegeeks presentation got a whole lot easier. Grab these presentations today. Following slide showcases dashboard to measure performance of company mobile carer page for employee recruitment . It include indicators such as number of visitors, application completion rate, live vacancies etc.
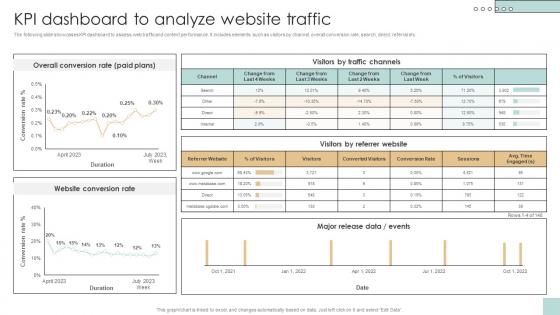
KPI Dashboard To Analyze Website Traffic Developing And Creating Digital Content Strategy SS V
The following slide showcases KPI dashboard to assess web traffic and content performance. It includes elements such as visitors by channel, overall conversion rate, search, direct, referral etc. The best PPT templates are a great way to save time, energy, and resources. Slidegeeks have 100 percent editable powerpoint slides making them incredibly versatile. With these quality presentation templates, you can create a captivating and memorable presentation by combining visually appealing slides and effectively communicating your message. Download KPI Dashboard To Analyze Website Traffic Developing And Creating Digital Content Strategy SS V from Slidegeeks and deliver a wonderful presentation. The following slide showcases KPI dashboard to assess web traffic and content performance. It includes elements such as visitors by channel, overall conversion rate, search, direct, referral etc.
Wireless Banking To Improve KPI Dashboard For Tracking Monthly Personal Fin SS V
This slide shows dashboard which can be used by individuals to track monthly expenses in order to get better understanding of his or her finances. It includes metrics such as users spending, savings, debt, etc. Slidegeeks is one of the best resources for PowerPoint templates. You can download easily and regulate Wireless Banking To Improve KPI Dashboard For Tracking Monthly Personal Fin SS V for your personal presentations from our wonderful collection. A few clicks is all it takes to discover and get the most relevant and appropriate templates. Use our Templates to add a unique zing and appeal to your presentation and meetings. All the slides are easy to edit and you can use them even for advertisement purposes. This slide shows dashboard which can be used by individuals to track monthly expenses in order to get better understanding of his or her finances. It includes metrics such as users spending, savings, debt, etc.
Smart Attendance Tracking Systems Dashboard Impact Of IoT Technology On Education IoT SS V
Following slide highlights dashboard to monitor and track student attendance by using Io enabled asset tracking devices. It includes indicators such as overtime, statistics, source, exceptions, pending requests, etc. Want to ace your presentation in front of a live audience Our Smart Attendance Tracking Systems Dashboard Impact Of IoT Technology On Education IoT SS V can help you do that by engaging all the users towards you. Slidegeeks experts have put their efforts and expertise into creating these impeccable powerpoint presentations so that you can communicate your ideas clearly. Moreover, all the templates are customizable, and easy-to-edit and downloadable. Use these for both personal and commercial use. Following slide highlights dashboard to monitor and track student attendance by using Io enabled asset tracking devices. It includes indicators such as overtime, statistics, source, exceptions, pending requests, etc.
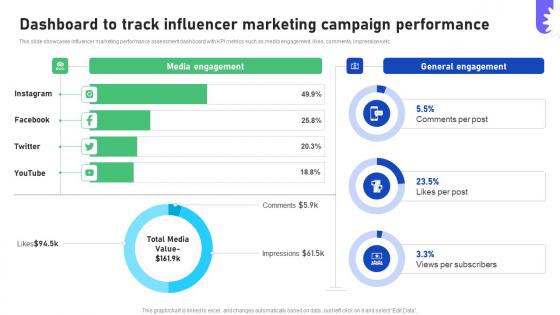
Improving Business Marketing Performance Dashboard To Track Influencer CRP DK SS V
This slide showcases influencer marketing performance assessment dashboard with KPI metrics such as media engagement, likes, comments, impressions etc. Are you in need of a template that can accommodate all of your creative concepts This one is crafted professionally and can be altered to fit any style. Use it with Google Slides or PowerPoint. Include striking photographs, symbols, depictions, and other visuals. Fill, move around, or remove text boxes as desired. Test out color palettes and font mixtures. Edit and save your work, or work with colleagues. Download Improving Business Marketing Performance Dashboard To Track Influencer CRP DK SS V and observe how to make your presentation outstanding. Give an impeccable presentation to your group and make your presentation unforgettable. This slide showcases influencer marketing performance assessment dashboard with KPI metrics such as media engagement, likes, comments, impressions etc.
Kpi Dashboard For Tracking Social Media Campaign Results Powerful Marketing Techniques Strategy SS V
This slide covers the dashboard for analyzing social media marketing campaigns. It includes metrics such as tweets, followers, followings, listed favorites, reach, views, Facebook engagement, clicks, likes, Instagram photos, etc. This Kpi Dashboard For Tracking Social Media Campaign Results Powerful Marketing Techniques Strategy SS V from Slidegeeks makes it easy to present information on your topic with precision. It provides customization options, so you can make changes to the colors, design, graphics, or any other component to create a unique layout. It is also available for immediate download, so you can begin using it right away. Slidegeeks has done good research to ensure that you have everything you need to make your presentation stand out. Make a name out there for a brilliant performance. This slide covers the dashboard for analyzing social media marketing campaigns. It includes metrics such as tweets, followers, followings, listed favorites, reach, views, Facebook engagement, clicks, likes, Instagram photos, etc.
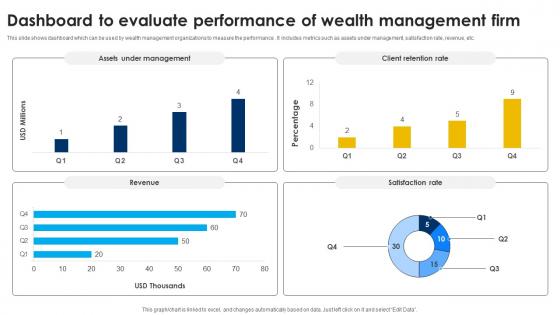
Dashboard To Evaluate Performance Strategic Wealth Management And Financial Fin SS V
This slide shows dashboard which can be used by wealth management organizations to measure the performance . It includes metrics such as assets under management, satisfaction rate, revenue, etc. Present like a pro with Dashboard To Evaluate Performance Strategic Wealth Management And Financial Fin SS V. Create beautiful presentations together with your team, using our easy-to-use presentation slides. Share your ideas in real-time and make changes on the fly by downloading our templates. So whether youre in the office, on the go, or in a remote location, you can stay in sync with your team and present your ideas with confidence. With Slidegeeks presentation got a whole lot easier. Grab these presentations today. This slide shows dashboard which can be used by wealth management organizations to measure the performance . It includes metrics such as assets under management, satisfaction rate, revenue, etc.
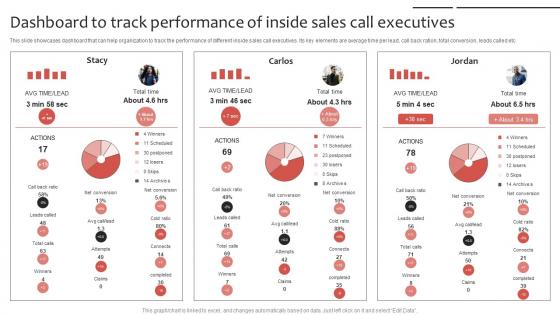
Phone Sales Strategy To Drive Leads Dashboard To Track Performance Strategy SS V
This slide showcases dashboard that can help organization to track the performance of different inside sales call executives. Its key elements are average time per lead, call back ration, total conversion, leads called etc. Slidegeeks has constructed Phone Sales Strategy To Drive Leads Dashboard To Track Performance Strategy SS V after conducting extensive research and examination. These presentation templates are constantly being generated and modified based on user preferences and critiques from editors. Here, you will find the most attractive templates for a range of purposes while taking into account ratings and remarks from users regarding the content. This is an excellent jumping-off point to explore our content and will give new users an insight into our top-notch PowerPoint Templates. This slide showcases dashboard that can help organization to track the performance of different inside sales call executives. Its key elements are average time per lead, call back ration, total conversion, leads called etc.
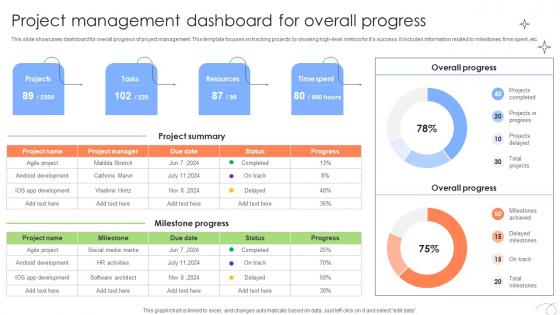
Executing And Monitoring Project Management Dashboard For Overall PM SS V
This slide showcases dashboard for overall progress of project management. This template focuses on tracking projects by showing high-level metrics for it is success. It includes information related to milestones, time spent, etc. Coming up with a presentation necessitates that the majority of the effort goes into the content and the message you intend to convey. The visuals of a PowerPoint presentation can only be effective if it supplements and supports the story that is being told. Keeping this in mind our experts created Executing And Monitoring Project Management Dashboard For Overall PM SS V to reduce the time that goes into designing the presentation. This way, you can concentrate on the message while our designers take care of providing you with the right template for the situation. This slide showcases dashboard for overall progress of project management. This template focuses on tracking projects by showing high-level metrics for it is success. It includes information related to milestones, time spent, etc.
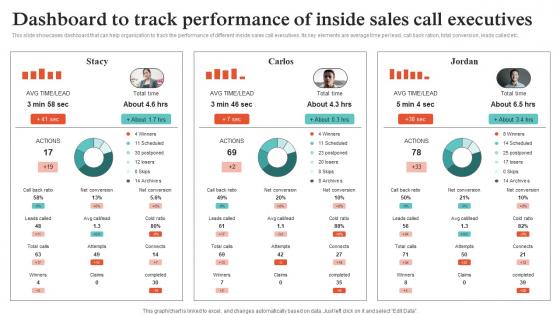
Virtual Sales Strategies For Business Dashboard To Track Performance Of Inside Strategy SS V
This slide showcases dashboard that can help organization to track the performance of different inside sales call executives. Its key elements are average time per lead, call back ration, total conversion, leads called etc. Make sure to capture your audiences attention in your business displays with our gratis customizable Virtual Sales Strategies For Business Dashboard To Track Performance Of Inside Strategy SS V. These are great for business strategies, office conferences, capital raising or task suggestions. If you desire to acquire more customers for your tech business and ensure they stay satisfied, create your own sales presentation with these plain slides. This slide showcases dashboard that can help organization to track the performance of different inside sales call executives. Its key elements are average time per lead, call back ration, total conversion, leads called etc.

Erp Management Dashboard To Optimize Marketing Erp And Digital Transformation For Maximizing DT SS V
This slide present an ERP management dashboard to help monitor the sales and marketing initiatives and boost business performance. It tracks sales overview, visitors, and campaign performance.This Erp Management Dashboard To Optimize Marketing Erp And Digital Transformation For Maximizing DT SS V from Slidegeeks makes it easy to present information on your topic with precision. It provides customization options, so you can make changes to the colors, design, graphics, or any other component to create a unique layout. It is also available for immediate download, so you can begin using it right away. Slidegeeks has done good research to ensure that you have everything you need to make your presentation stand out. Make a name out there for a brilliant performance. This slide present an ERP management dashboard to help monitor the sales and marketing initiatives and boost business performance. It tracks sales overview, visitors, and campaign performance.
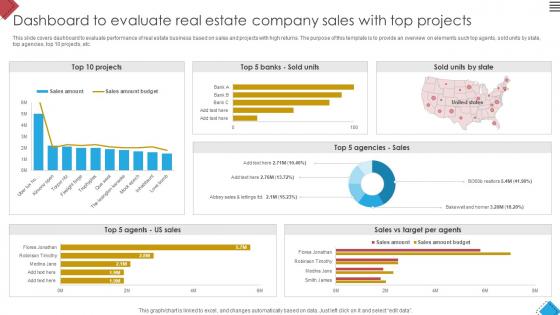
Blueprint For Effective Real Dashboard To Evaluate Real Estate Company Sales Strategy SS V
This slide covers dashboard to evaluate performance of real estate business based on sales and projects with high returns. The purpose of this template is to provide an overview on elements such top agents, sold units by state, top agencies, top 10 projects, etc. If your project calls for a presentation, then Slidegeeks is your go-to partner because we have professionally designed, easy-to-edit templates that are perfect for any presentation. After downloading, you can easily edit Blueprint For Effective Real Dashboard To Evaluate Real Estate Company Sales Strategy SS V and make the changes accordingly. You can rearrange slides or fill them with different images. Check out all the handy templates This slide covers dashboard to evaluate performance of real estate business based on sales and projects with high returns. The purpose of this template is to provide an overview on elements such top agents, sold units by state, top agencies, top 10 projects, etc.
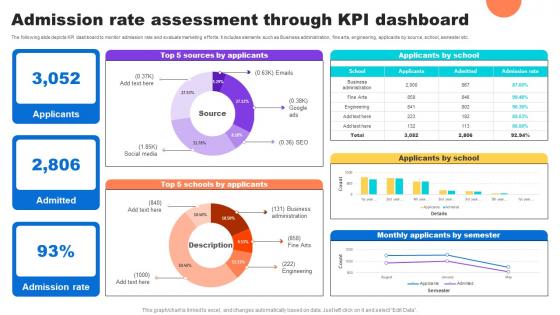
Admission Rate Assessment Through Kpi Dashboard Key Step To Implementation University Strategy SS V
The following slide depicts KPI dashboard to monitor admission rate and evaluate marketing efforts. It includes elements such as Business administration, fine arts, engineering, applicants by source, school, semester etc. Find a pre-designed and impeccable Admission Rate Assessment Through Kpi Dashboard Key Step To Implementation University Strategy SS V. The templates can ace your presentation without additional effort. You can download these easy-to-edit presentation templates to make your presentation stand out from others. So, what are you waiting for Download the template from Slidegeeks today and give a unique touch to your presentation. The following slide depicts KPI dashboard to monitor admission rate and evaluate marketing efforts. It includes elements such as Business administration, fine arts, engineering, applicants by source, school, semester etc.

Product Analytics Dashboard To Track Engagement Driving Business Success Integrating Product
This slide illustrates a dashboard to monitor customer engagement on company website by leveraging product analytics tools aimed at making necessary improvements. It covers insights regarding active monthly users, new users, total completed purchases, screen views, average duration of session, etc. There are so many reasons you need a Product Analytics Dashboard To Track Engagement Driving Business Success Integrating Product. The first reason is you can not spend time making everything from scratch, Thus, Slidegeeks has made presentation templates for you too. You can easily download these templates from our website easily. This slide illustrates a dashboard to monitor customer engagement on company website by leveraging product analytics tools aimed at making necessary improvements. It covers insights regarding active monthly users, new users, total completed purchases, screen views, average duration of session, etc.
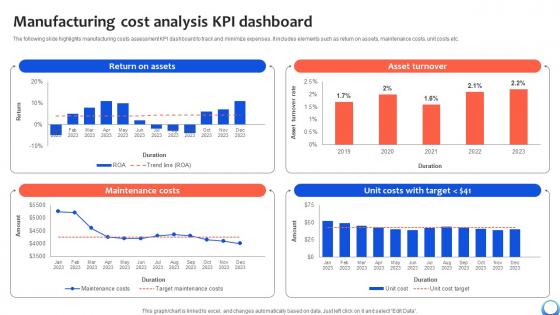
Manufacturing Cost Analysis KPI Dashboard Automating Production Process Strategy SS V
The following slide highlights manufacturing costs assessment KPI dashboard to track and minimize expenses. It includes elements such as return on assets, maintenance costs, unit costs etc. Make sure to capture your audiences attention in your business displays with our gratis customizable Manufacturing Cost Analysis KPI Dashboard Automating Production Process Strategy SS V. These are great for business strategies, office conferences, capital raising or task suggestions. If you desire to acquire more customers for your tech business and ensure they stay satisfied, create your own sales presentation with these plain slides. The following slide highlights manufacturing costs assessment KPI dashboard to track and minimize expenses. It includes elements such as return on assets, maintenance costs, unit costs etc.
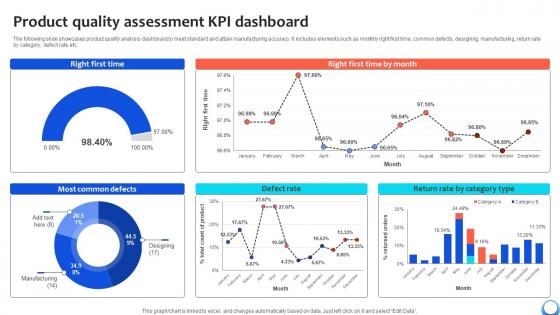
Product Quality Assessment KPI Dashboard Automating Production Process Strategy SS V
The following slide showcases product quality analysis dashboard to meet standard and attain manufacturing accuracy. It includes elements such as monthly right first time, common defects, designing, manufacturing, return rate by category, defect rate etc. Take your projects to the next level with our ultimate collection of Product Quality Assessment KPI Dashboard Automating Production Process Strategy SS V. Slidegeeks has designed a range of layouts that are perfect for representing task or activity duration, keeping track of all your deadlines at a glance. Tailor these designs to your exact needs and give them a truly corporate look with your own brand colors they will make your projects stand out from the rest The following slide showcases product quality analysis dashboard to meet standard and attain manufacturing accuracy. It includes elements such as monthly right first time, common defects, designing, manufacturing, return rate by category, defect rate etc.

Empowering The Future Smart Meters Dashboard For Effective Energy IoT SS V
This slide exhibits a dashboard that provides real-time energy specific information from multiple smart meters. It includes elements such as voltage, energy consumption, energy meters, alarms alert, and amperage Welcome to our selection of the Empowering The Future Smart Meters Dashboard For Effective Energy IoT SS V. These are designed to help you showcase your creativity and bring your sphere to life. Planning and Innovation are essential for any business that is just starting out. This collection contains the designs that you need for your everyday presentations. All of our PowerPoints are 100Percent editable, so you can customize them to suit your needs. This multi-purpose template can be used in various situations. Grab these presentation templates today. This slide exhibits a dashboard that provides real-time energy specific information from multiple smart meters. It includes elements such as voltage, energy consumption, energy meters, alarms alert, and amperage
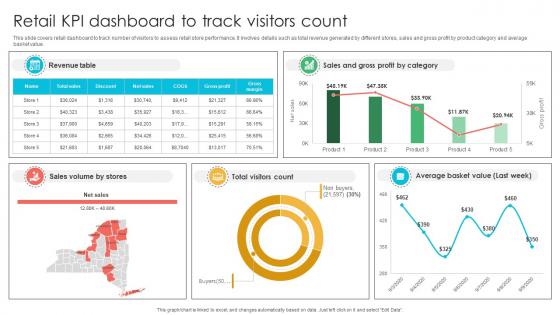
Marketing Strategies For Effective Retail KPI Dashboard To Track Visitors Count
This slide covers retail dashboard to track number of visitors to assess retail store performance. It involves details such as total revenue generated by different stores, sales and gross profit by product category and average basket value. Want to ace your presentation in front of a live audience Our Marketing Strategies For Effective Retail KPI Dashboard To Track Visitors Count can help you do that by engaging all the users towards you. Slidegeeks experts have put their efforts and expertise into creating these impeccable powerpoint presentations so that you can communicate your ideas clearly. Moreover, all the templates are customizable, and easy-to-edit and downloadable. Use these for both personal and commercial use. This slide covers retail dashboard to track number of visitors to assess retail store performance. It involves details such as total revenue generated by different stores, sales and gross profit by product category and average basket value.
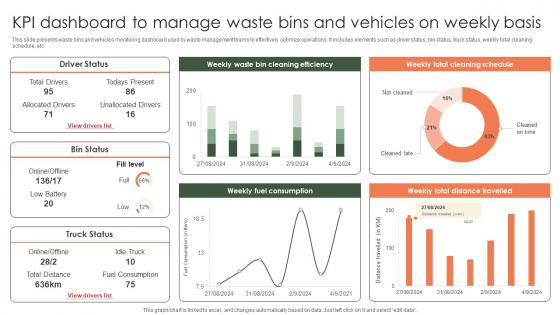
Kpi Dashboard To Manage Waste Bins And Vehicles On Weekly Implementation Of E Waste Guidelines
This slide presents waste bins and vehicles monitoring dashboard used by waste management teams to effectively optimize operations. It includes elements such as driver status, bin status, truck status, weekly total cleaning schedule, etc. Welcome to our selection of the Kpi Dashboard To Manage Waste Bins And Vehicles On Weekly Implementation Of E Waste Guidelines. These are designed to help you showcase your creativity and bring your sphere to life. Planning and Innovation are essential for any business that is just starting out. This collection contains the designs that you need for your everyday presentations. All of our PowerPoints are 100 percent editable, so you can customize them to suit your needs. This multi-purpose template can be used in various situations. Grab these presentation templates today. This slide presents waste bins and vehicles monitoring dashboard used by waste management teams to effectively optimize operations. It includes elements such as driver status, bin status, truck status, weekly total cleaning schedule, etc.
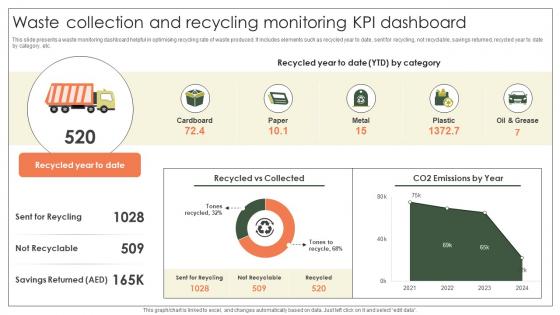
Waste Collection And Recycling Monitoring Kpi Dashboard Implementation Of E Waste Guidelines
This slide presents a waste monitoring dashboard helpful in optimising recycling rate of waste produced. It includes elements such as recycled year to date, sent for recycling, not recyclable, savings returned, recycled year to date by category, etc. From laying roadmaps to briefing everything in detail, our templates are perfect for you. You can set the stage with your presentation slides. All you have to do is download these easy-to-edit and customizable templates. Waste Collection And Recycling Monitoring Kpi Dashboard Implementation Of E Waste Guidelines will help you deliver an outstanding performance that everyone would remember and praise you for. Do download this presentation today. This slide presents a waste monitoring dashboard helpful in optimising recycling rate of waste produced. It includes elements such as recycled year to date, sent for recycling, not recyclable, savings returned, recycled year to date by category, etc.
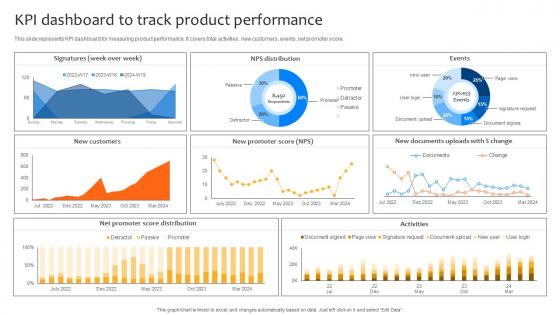
Deploying Strategies For Business KPI Dashboard To Track Product Performance Strategy SS V
This slide represents KPI dashboard for measuring product performance. It covers total activities, new customers, events, net promoter score. Coming up with a presentation necessitates that the majority of the effort goes into the content and the message you intend to convey. The visuals of a PowerPoint presentation can only be effective if it supplements and supports the story that is being told. Keeping this in mind our experts created Deploying Strategies For Business KPI Dashboard To Track Product Performance Strategy SS V to reduce the time that goes into designing the presentation. This way, you can concentrate on the message while our designers take care of providing you with the right template for the situation. This slide represents KPI dashboard for measuring product performance. It covers total activities, new customers, events, net promoter score.

Company Profit And Loss Dashboard With Income Statement Strategic Approaches To Corporate Financial
This slide provides a KPI dashboard that enables an organization to track revenue, expenses, and profit incurred in a specific period. It includes gross profit margin, OPEX ratio, operating profit margin, and net profit margin. Want to ace your presentation in front of a live audience Our Company Profit And Loss Dashboard With Income Statement Strategic Approaches To Corporate Financial can help you do that by engaging all the users towards you. Slidegeeks experts have put their efforts and expertise into creating these impeccable powerpoint presentations so that you can communicate your ideas clearly. Moreover, all the templates are customizable, and easy-to-edit and downloadable. Use these for both personal and commercial use. This slide provides a KPI dashboard that enables an organization to track revenue, expenses, and profit incurred in a specific period. It includes gross profit margin, OPEX ratio, operating profit margin, and net profit margin.
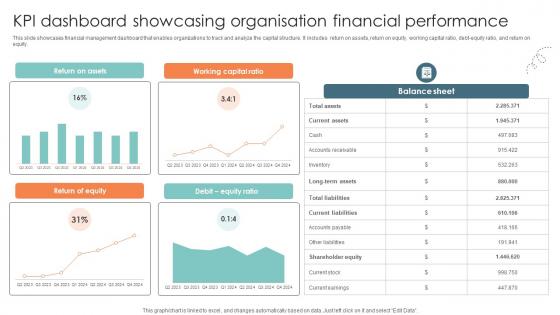
Kpi Dashboard Showcasing Organisation Financial Performance Strategic Approaches To Corporate Financial
This slide showcases financial management dashboard that enables organizations to track and analyze the capital structure. It includes return on assets, return on equity, working capital ratio, debt-equity ratio, and return on equity. This modern and well-arranged Kpi Dashboard Showcasing Organisation Financial Performance Strategic Approaches To Corporate Financial provides lots of creative possibilities. It is very simple to customize and edit with the Powerpoint Software. Just drag and drop your pictures into the shapes. All facets of this template can be edited with Powerpoint, no extra software is necessary. Add your own material, put your images in the places assigned for them, adjust the colors, and then you can show your slides to the world, with an animated slide included. This slide showcases financial management dashboard that enables organizations to track and analyze the capital structure. It includes return on assets, return on equity, working capital ratio, debt-equity ratio, and return on equity.
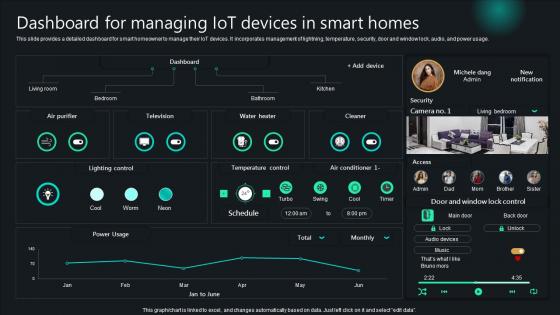
Dashboard For Managing IoT Devices In Smart Homes Unlocking Potential IoTs Application IoT SS V
This slide provides a detailed dashboard for smart homeowner to manage their IoT devices. It incorporates management of lightning, temperature, security, door and window lock, audio, and power usage. Slidegeeks is one of the best resources for PowerPoint templates. You can download easily and regulate Dashboard For Managing IoT Devices In Smart Homes Unlocking Potential IoTs Application IoT SS V for your personal presentations from our wonderful collection. A few clicks is all it takes to discover and get the most relevant and appropriate templates. Use our Templates to add a unique zing and appeal to your presentation and meetings. All the slides are easy to edit and you can use them even for advertisement purposes. This slide provides a detailed dashboard for smart homeowner to manage their IoT devices. It incorporates management of lightning, temperature, security, door and window lock, audio, and power usage.
Unlocking Potential IoTs Application Dashboard For Tracking IoT Devices Performance IoT SS V
This slide provides a dashboard for monitoring IoT devices that enhance agricultural practices. It incorporates IoT sensors to measure water tank capacity, Live crop monitoring, temperature and humidity measurements, control sprinklers, etc. Make sure to capture your audiences attention in your business displays with our gratis customizable Unlocking Potential IoTs Application Dashboard For Tracking IoT Devices Performance IoT SS V. These are great for business strategies, office conferences, capital raising or task suggestions. If you desire to acquire more customers for your tech business and ensure they stay satisfied, create your own sales presentation with these plain slides. This slide provides a dashboard for monitoring IoT devices that enhance agricultural practices. It incorporates IoT sensors to measure water tank capacity, Live crop monitoring, temperature and humidity measurements, control sprinklers, etc.
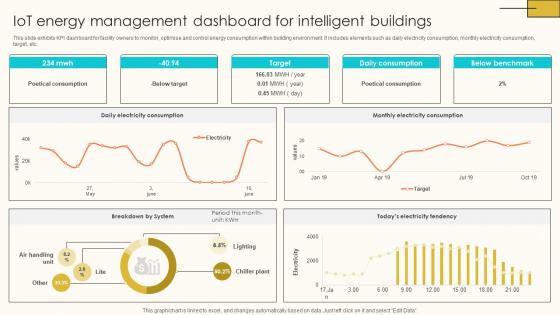
IoT Energy Management Dashboard For Internet Of Things Solutions To Enhance Energy IoT SS V
This slide exhibits KPI dashboard for facility owners to monitor, optimise and control energy consumption within building environment. It includes elements such as daily electricity consumption, monthly electricity consumption, target, etc. This modern and well-arranged IoT Energy Management Dashboard For Internet Of Things Solutions To Enhance Energy IoT SS V provides lots of creative possibilities. It is very simple to customize and edit with the Powerpoint Software. Just drag and drop your pictures into the shapes. All facets of this template can be edited with Powerpoint, no extra software is necessary. Add your own material, put your images in the places assigned for them, adjust the colors, and then you can show your slides to the world, with an animated slide included. This slide exhibits KPI dashboard for facility owners to monitor, optimise and control energy consumption within building environment. It includes elements such as daily electricity consumption, monthly electricity consumption, target, etc.
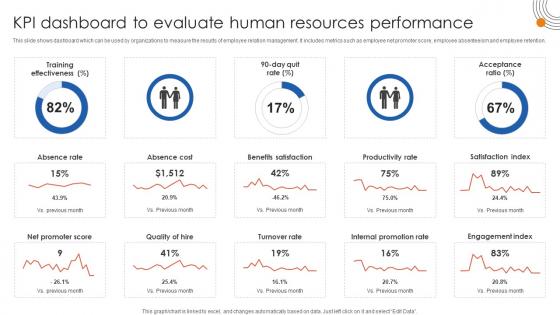
Human Resource Industrial Relationship Kpi Dashboard To Evaluate Human Resources Performance
This slide shows dashboard which can be used by organizations to measure the results of employee relation management. It includes metrics such as employee net promoter score, employee absenteeism and employee retention. Welcome to our selection of the Human Resource Industrial Relationship Kpi Dashboard To Evaluate Human Resources Performance. These are designed to help you showcase your creativity and bring your sphere to life. Planning and Innovation are essential for any business that is just starting out. This collection contains the designs that you need for your everyday presentations. All of our PowerPoints are 100Percent editable, so you can customize them to suit your needs. This multi-purpose template can be used in various situations. Grab these presentation templates today. This slide shows dashboard which can be used by organizations to measure the results of employee relation management. It includes metrics such as employee net promoter score, employee absenteeism and employee retention.
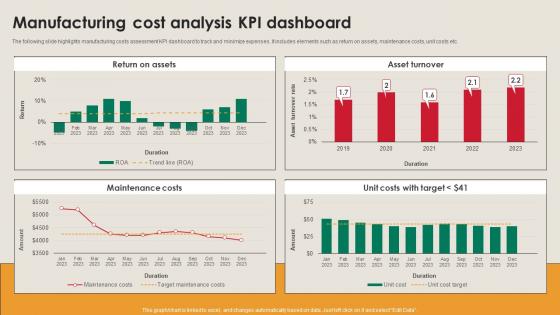
Manufacturing Cost Analysis KPI Dashboard Manufacturing Strategy Driving Industry 4 0
The following slide highlights manufacturing costs assessment KPI dashboard to track and minimize expenses. It includes elements such as return on assets, maintenance costs, unit costs etc. Find a pre-designed and impeccable Manufacturing Cost Analysis KPI Dashboard Manufacturing Strategy Driving Industry 4 0. The templates can ace your presentation without additional effort. You can download these easy-to-edit presentation templates to make your presentation stand out from others. So, what are you waiting for Download the template from Slidegeeks today and give a unique touch to your presentation. The following slide highlights manufacturing costs assessment KPI dashboard to track and minimize expenses. It includes elements such as return on assets, maintenance costs, unit costs etc.
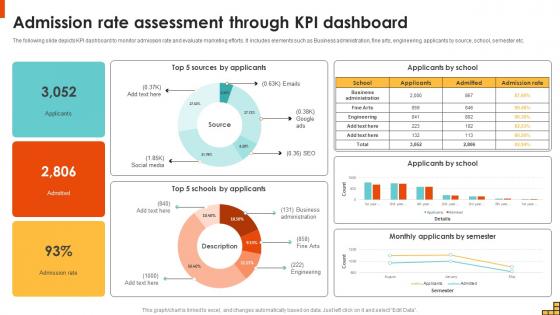
Admission Rate Assessment Through KPI Dashboard Running Marketing Campaigns Strategy SS V
The following slide depicts KPI dashboard to monitor admission rate and evaluate marketing efforts. It includes elements such as Business administration, fine arts, engineering, applicants by source, school, semester etc. Find a pre-designed and impeccable Admission Rate Assessment Through KPI Dashboard Running Marketing Campaigns Strategy SS V. The templates can ace your presentation without additional effort. You can download these easy-to-edit presentation templates to make your presentation stand out from others. So, what are you waiting for Download the template from Slidegeeks today and give a unique touch to your presentation. The following slide depicts KPI dashboard to monitor admission rate and evaluate marketing efforts. It includes elements such as Business administration, fine arts, engineering, applicants by source, school, semester etc.

KPI Dashboard To Analyze Email Campaign Performance Running Marketing Campaigns Strategy SS V
The following slide depicts KPI dashboard to review email campaign performance conducted by university. It includes elements such as open rate, click rate, emails sent, revenue by campaign, clicks, unique unsubscribes, etc. The best PPT templates are a great way to save time, energy, and resources. Slidegeeks have 100 percent editable powerpoint slides making them incredibly versatile. With these quality presentation templates, you can create a captivating and memorable presentation by combining visually appealing slides and effectively communicating your message. Download KPI Dashboard To Analyze Email Campaign Performance Running Marketing Campaigns Strategy SS V from Slidegeeks and deliver a wonderful presentation. The following slide depicts KPI dashboard to review email campaign performance conducted by university. It includes elements such as open rate, click rate, emails sent, revenue by campaign, clicks, unique unsubscribes, etc.
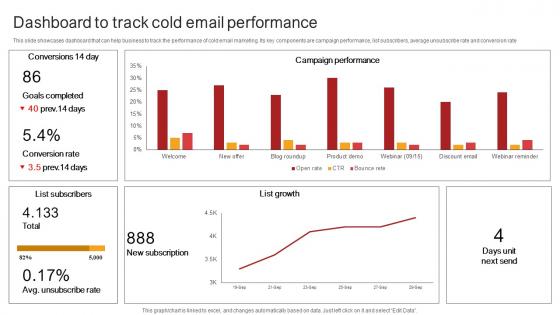
Remote Sales Plan For Dashboard To Track Cold Email Performance Strategy SS V
This slide showcases dashboard that can help business to track the performance of cold email marketing. Its key components are campaign performance, list subscribers, average unsubscribe rate and conversion rate. Slidegeeks is here to make your presentations a breeze with Remote Sales Plan For Dashboard To Track Cold Email Performance Strategy SS V With our easy-to-use and customizable templates, you can focus on delivering your ideas rather than worrying about formatting. With a variety of designs to choose from, you are sure to find one that suits your needs. And with animations and unique photos, illustrations, and fonts, you can make your presentation pop. So whether you are giving a sales pitch or presenting to the board, make sure to check out Slidegeeks first This slide showcases dashboard that can help business to track the performance of cold email marketing. Its key components are campaign performance, list subscribers, average unsubscribe rate and conversion rate.
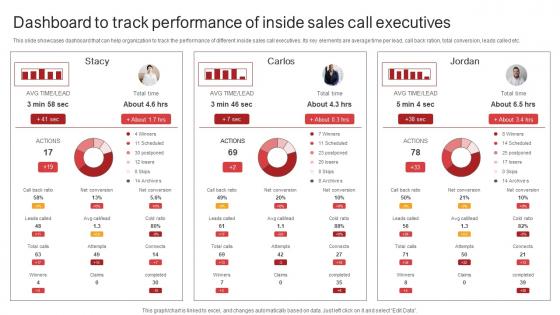
Remote Sales Plan For Lead Dashboard To Track Performance Of Inside Sales Strategy SS V
This slide showcases dashboard that can help organization to track the performance of different inside sales call executives. Its key elements are average time per lead, call back ration, total conversion, leads called etc. The best PPT templates are a great way to save time, energy, and resources. Slidegeeks have 100 percent editable powerpoint slides making them incredibly versatile. With these quality presentation templates, you can create a captivating and memorable presentation by combining visually appealing slides and effectively communicating your message. Download Remote Sales Plan For Lead Dashboard To Track Performance Of Inside Sales Strategy SS V from Slidegeeks and deliver a wonderful presentation. This slide showcases dashboard that can help organization to track the performance of different inside sales call executives. Its key elements are average time per lead, call back ration, total conversion, leads called etc.
Project Management Dashboard For Tracking Performance Closing A Project By Fulfilling PM SS V
This slide showcases dashboard for tracing project performance. This template focuses on changing the status of each task and graphs automatically tracking overall status. It covers aspects related to task priority, budget, etc. Find a pre-designed and impeccable Project Management Dashboard For Tracking Performance Closing A Project By Fulfilling PM SS V. The templates can ace your presentation without additional effort. You can download these easy-to-edit presentation templates to make your presentation stand out from others. So, what are you waiting for Download the template from Slidegeeks today and give a unique touch to your presentation. This slide showcases dashboard for tracing project performance. This template focuses on changing the status of each task and graphs automatically tracking overall status. It covers aspects related to task priority, budget, etc.
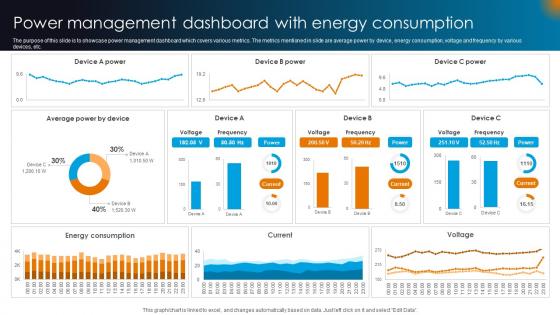
Integrating AI With IoT Power Management Dashboard With Energy Consumption IoT SS V
The purpose of this slide is to showcase power management dashboard which covers various metrics. The metrics mentioned in slide are average power by device, energy consumption, voltage and frequency by various devices, etc. Want to ace your presentation in front of a live audience Our Integrating AI With IoT Power Management Dashboard With Energy Consumption IoT SS V can help you do that by engaging all the users towards you. Slidegeeks experts have put their efforts and expertise into creating these impeccable powerpoint presentations so that you can communicate your ideas clearly. Moreover, all the templates are customizable, and easy-to-edit and downloadable. Use these for both personal and commercial use. The purpose of this slide is to showcase power management dashboard which covers various metrics. The metrics mentioned in slide are average power by device, energy consumption, voltage and frequency by various devices, etc.
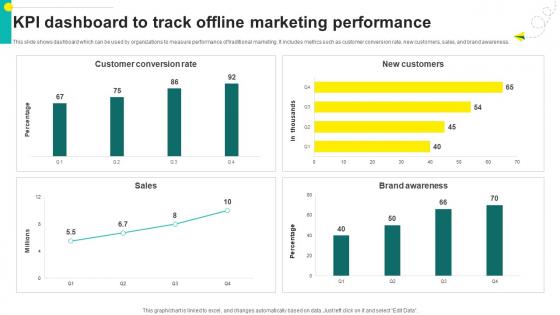
One On One Advertising Kpi Dashboard To Track Offline Marketing Performance Strategy SS V
This slide shows dashboard which can be used by organizations to measure performance of traditional marketing. It includes metrics such as customer conversion rate, new customers, sales, and brand awareness. Welcome to our selection of the One On One Advertising Kpi Dashboard To Track Offline Marketing Performance Strategy SS V. These are designed to help you showcase your creativity and bring your sphere to life. Planning and Innovation are essential for any business that is just starting out. This collection contains the designs that you need for your everyday presentations. All of our PowerPoints are 100Percent editable, so you can customize them to suit your needs. This multi-purpose template can be used in various situations. Grab these presentation templates today. This slide shows dashboard which can be used by organizations to measure performance of traditional marketing. It includes metrics such as customer conversion rate, new customers, sales, and brand awareness.
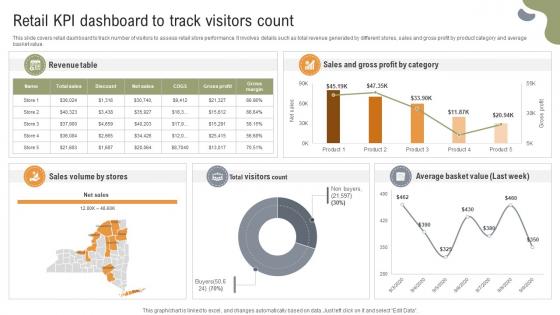
Implementing Strategies To Enhance Retail KPI Dashboard To Track Visitors Count
This slide covers retail dashboard to track number of visitors to assess retail store performance. It involves details such as total revenue generated by different stores, sales and gross profit by product category and average basket value. Want to ace your presentation in front of a live audience Our Implementing Strategies To Enhance Retail KPI Dashboard To Track Visitors Count can help you do that by engaging all the users towards you. Slidegeeks experts have put their efforts and expertise into creating these impeccable powerpoint presentations so that you can communicate your ideas clearly. Moreover, all the templates are customizable, and easy-to-edit and downloadable. Use these for both personal and commercial use. This slide covers retail dashboard to track number of visitors to assess retail store performance. It involves details such as total revenue generated by different stores, sales and gross profit by product category and average basket value.
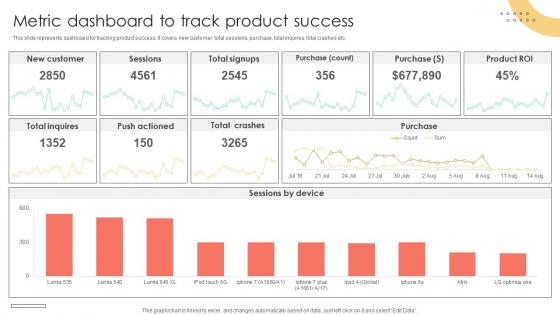
Brand Extension Techniques Metric Dashboard To Track Product Success Strategy SS V
This slide represents dashboard for tracking product success. It covers new customer, total sessions, purchase, total inquires, total crashes etc. Welcome to our selection of the Brand Extension Techniques Metric Dashboard To Track Product Success Strategy SS V. These are designed to help you showcase your creativity and bring your sphere to life. Planning and Innovation are essential for any business that is just starting out. This collection contains the designs that you need for your everyday presentations. All of our PowerPoints are 100Percent editable, so you can customize them to suit your needs. This multi-purpose template can be used in various situations. Grab these presentation templates today. This slide represents dashboard for tracking product success. It covers new customer, total sessions, purchase, total inquires, total crashes etc.

Employee Relations In Human Resource Dashboard To Analyze Employees Related Metrics Performance
This slide shows dashboard which can be used by organizations to measure the results of employee relation management. It includes metrics such as media coverage rate, social media engagement rate, share of voice and brand mentions. Present like a pro with Employee Relations In Human Resource Dashboard To Analyze Employees Related Metrics Performance. Create beautiful presentations together with your team, using our easy-to-use presentation slides. Share your ideas in real-time and make changes on the fly by downloading our templates. So whether you are in the office, on the go, or in a remote location, you can stay in sync with your team and present your ideas with confidence. With Slidegeeks presentation got a whole lot easier. Grab these presentations today. This slide shows dashboard which can be used by organizations to measure the results of employee relation management. It includes metrics such as media coverage rate, social media engagement rate, share of voice and brand mentions.
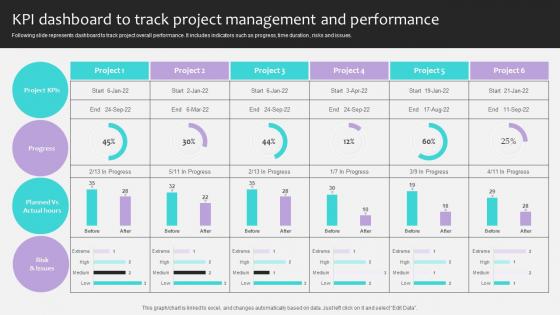
Project Stakeholders Management KPI Dashboard To Track Project Management Ppt Presentation
Following slide represents dashboard to track project overall performance. It includes indicators such as progress, time duration , risks and issues. Slidegeeks has constructed Project Stakeholders Management KPI Dashboard To Track Project Management Ppt Presentation after conducting extensive research and examination. These presentation templates are constantly being generated and modified based on user preferences and critiques from editors. Here, you will find the most attractive templates for a range of purposes while taking into account ratings and remarks from users regarding the content. This is an excellent jumping-off point to explore our content and will give new users an insight into our top-notch PowerPoint Templates. Following slide represents dashboard to track project overall performance. It includes indicators such as progress, time duration , risks and issues.

KPI Dashboard To Assess Retail Sales Food And Grocery Retail Ppt Sample
This slide covers KPI dashboard to analyze sales performance of retail store. It involves details such as total sales revenue, number of customers, average transaction price and average unit per customer. From laying roadmaps to briefing everything in detail, our templates are perfect for you. You can set the stage with your presentation slides. All you have to do is download these easy-to-edit and customizable templates. KPI Dashboard To Assess Retail Sales Food And Grocery Retail Ppt Sample will help you deliver an outstanding performance that everyone would remember and praise you for. Do download this presentation today. This slide covers KPI dashboard to analyze sales performance of retail store. It involves details such as total sales revenue, number of customers, average transaction price and average unit per customer.
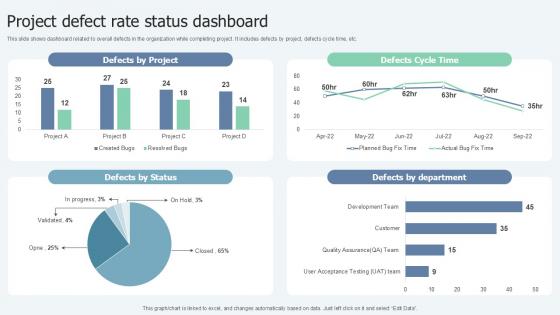
Project Defect Rate Status Dashboard Lean Six Sigma In Manufacturing Ppt Sample
This slide shows dashboard related to overall defects in the organization while completing project. It includes defects by project, defects cycle time, etc. Slidegeeks is here to make your presentations a breeze with Project Defect Rate Status Dashboard Lean Six Sigma In Manufacturing Ppt Sample With our easy-to-use and customizable templates, you can focus on delivering your ideas rather than worrying about formatting. With a variety of designs to choose from, you are sure to find one that suits your needs. And with animations and unique photos, illustrations, and fonts, you can make your presentation pop. So whether you are giving a sales pitch or presenting to the board, make sure to check out Slidegeeks first This slide shows dashboard related to overall defects in the organization while completing project. It includes defects by project, defects cycle time, etc.
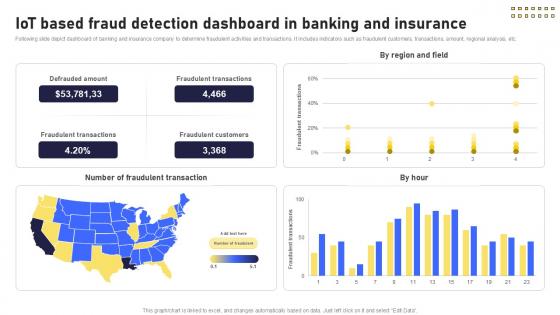
IoT Based Fraud Detection Dashboard Banking Future With IoT Ppt Example IoT SS V
Following slide depict dashboard of banking and insurance company to determine fraudulent activities and transactions. It includes indicators such as fraudulent customers, transactions, amount, regional analysis, etc. Present like a pro with IoT Based Fraud Detection Dashboard Banking Future With IoT Ppt Example IoT SS V. Create beautiful presentations together with your team, using our easy-to-use presentation slides. Share your ideas in real-time and make changes on the fly by downloading our templates. So whether you are in the office, on the go, or in a remote location, you can stay in sync with your team and present your ideas with confidence. With Slidegeeks presentation got a whole lot easier. Grab these presentations today. Following slide depict dashboard of banking and insurance company to determine fraudulent activities and transactions. It includes indicators such as fraudulent customers, transactions, amount, regional analysis, etc.
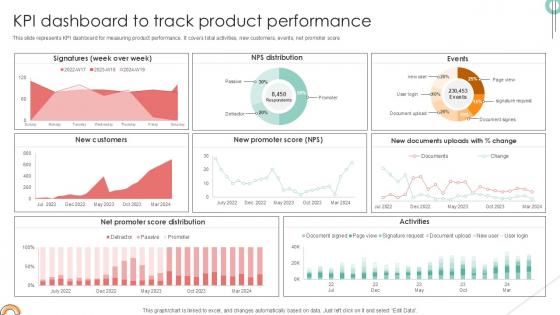
KPI Dashboard To Track Implementing Product Diversification PPT Presentation Strategy SS V
This slide represents KPI dashboard for measuring product performance. It covers total activities, new customers, events, net promoter score. This modern and well-arranged KPI Dashboard To Track Implementing Product Diversification PPT Presentation Strategy SS V provides lots of creative possibilities. It is very simple to customize and edit with the Powerpoint Software. Just drag and drop your pictures into the shapes. All facets of this template can be edited with Powerpoint, no extra software is necessary. Add your own material, put your images in the places assigned for them, adjust the colors, and then you can show your slides to the world, with an animated slide included. This slide represents KPI dashboard for measuring product performance. It covers total activities, new customers, events, net promoter score
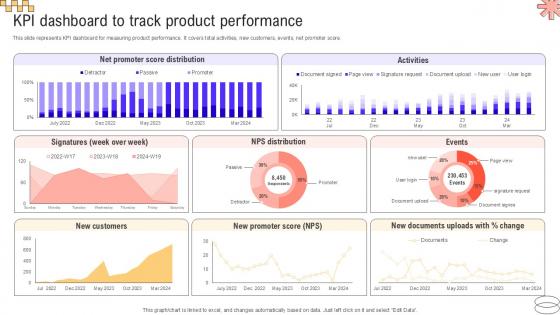
KPI Dashboard To Track Product Implementing Geographic Extension PPT Example Strategy SS V
This slide represents KPI dashboard for measuring product performance. It covers total activities, new customers, events, net promoter score. Coming up with a presentation necessitates that the majority of the effort goes into the content and the message you intend to convey. The visuals of a PowerPoint presentation can only be effective if it supplements and supports the story that is being told. Keeping this in mind our experts created KPI Dashboard To Track Product Implementing Geographic Extension PPT Example Strategy SS V to reduce the time that goes into designing the presentation. This way, you can concentrate on the message while our designers take care of providing you with the right template for the situation. This slide represents KPI dashboard for measuring product performance. It covers total activities, new customers, events, net promoter score.
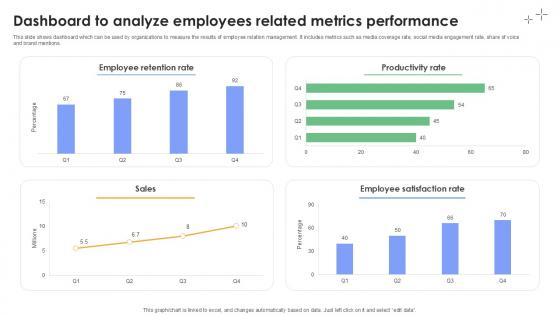
Dashboard To Analyze Employees Related Metrics Plan To Develop Ppt Slides
This slide shows dashboard which can be used by organizations to measure the results of employee relation management. It includes metrics such as media coverage rate, social media engagement rate, share of voice and brand mentions. Present like a pro with Dashboard To Analyze Employees Related Metrics Plan To Develop Ppt Slides. Create beautiful presentations together with your team, using our easy-to-use presentation slides. Share your ideas in real-time and make changes on the fly by downloading our templates. So whether you are in the office, on the go, or in a remote location, you can stay in sync with your team and present your ideas with confidence. With Slidegeeks presentation got a whole lot easier. Grab these presentations today. This slide shows dashboard which can be used by organizations to measure the results of employee relation management. It includes metrics such as media coverage rate, social media engagement rate, share of voice and brand mentions.
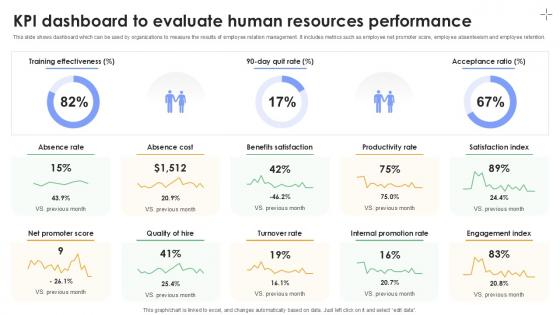
KPI Dashboard To Evaluate Human Resources Performance Plan To Develop Ppt Slides
This slide shows dashboard which can be used by organizations to measure the results of employee relation management. It includes metrics such as employee net promoter score, employee absenteeism and employee retention. Welcome to our selection of the KPI Dashboard To Evaluate Human Resources Performance Plan To Develop Ppt Slides. These are designed to help you showcase your creativity and bring your sphere to life. Planning and Innovation are essential for any business that is just starting out. This collection contains the designs that you need for your everyday presentations. All of our PowerPoints are 100Percent editable, so you can customize them to suit your needs. This multi-purpose template can be used in various situations. Grab these presentation templates today. This slide shows dashboard which can be used by organizations to measure the results of employee relation management. It includes metrics such as employee net promoter score, employee absenteeism and employee retention.
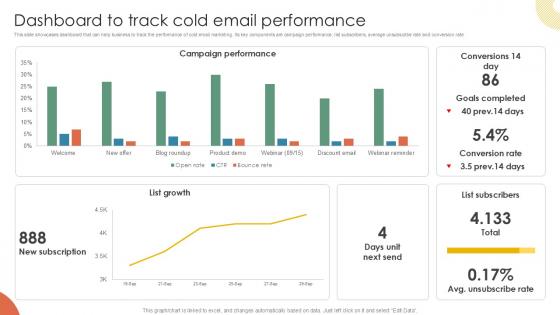
Dashboard To Track Cold Email Inside Vs Outside Sales PPT Example Strategy SS V
This slide showcases dashboard that can help business to track the performance of cold email marketing. Its key components are campaign performance, list subscribers, average unsubscribe rate and conversion rate. Slidegeeks is here to make your presentations a breeze with Dashboard To Track Cold Email Inside Vs Outside Sales PPT Example Strategy SS V With our easy-to-use and customizable templates, you can focus on delivering your ideas rather than worrying about formatting. With a variety of designs to choose from, you are sure to find one that suits your needs. And with animations and unique photos, illustrations, and fonts, you can make your presentation pop. So whether you are giving a sales pitch or presenting to the board, make sure to check out Slidegeeks first This slide showcases dashboard that can help business to track the performance of cold email marketing. Its key components are campaign performance, list subscribers, average unsubscribe rate and conversion rate
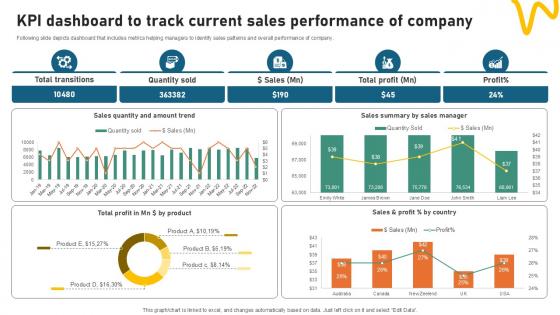
KPI Dashboard To Track Current Sales Sample Pitch Deck For Video Ppt Example
Following slide depicts dashboard that includes metrics helping managers to identify sales patterns and overall performance of company. Welcome to our selection of the KPI Dashboard To Track Current Sales Sample Pitch Deck For Video Ppt Example. These are designed to help you showcase your creativity and bring your sphere to life. Planning and Innovation are essential for any business that is just starting out. This collection contains the designs that you need for your everyday presentations. All of our PowerPoints are 100Percent editable, so you can customize them to suit your needs. This multi-purpose template can be used in various situations. Grab these presentation templates today. Following slide depicts dashboard that includes metrics helping managers to identify sales patterns and overall performance of company.
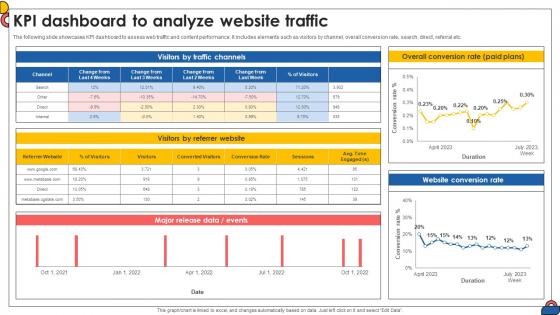
Kpi Dashboard To Analyze Website Traffic Comprehensive Guide To Implement Strategy SS V
The best PPT templates are a great way to save time, energy, and resources. Slidegeeks have 100 percent editable powerpoint slides making them incredibly versatile. With these quality presentation templates, you can create a captivating and memorable presentation by combining visually appealing slides and effectively communicating your message. Download Kpi Dashboard To Analyze Website Traffic Comprehensive Guide To Implement Strategy SS V from Slidegeeks and deliver a wonderful presentation. The following slide showcases KPI dashboard to assess web traffic and content performance. It includes elements such as visitors by channel, overall conversion rate, search, direct, referral etc.
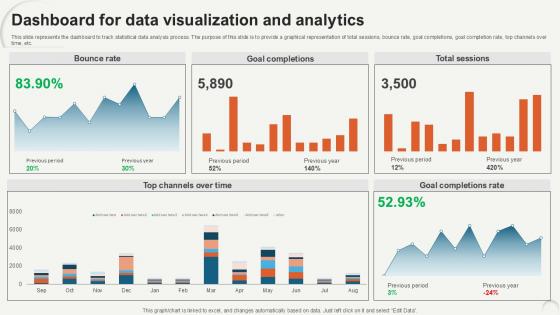
Dashboard For Data Visualization Data Analytics For Informed Decision Ppt Sample
This slide represents the dashboard to track statistical data analysis process. The purpose of this slide is to provide a graphical representation of total sessions, bounce rate, goal completions, goal completion rate, top channels over time, etc. Do you have an important presentation coming up Are you looking for something that will make your presentation stand out from the rest Look no further than Dashboard For Data Visualization Data Analytics For Informed Decision Ppt Sample. With our professional designs, you can trust that your presentation will pop and make delivering it a smooth process. And with Slidegeeks, you can trust that your presentation will be unique and memorable. So why wait Grab Dashboard For Data Visualization Data Analytics For Informed Decision Ppt Sample today and make your presentation stand out from the rest This slide represents the dashboard to track statistical data analysis process. The purpose of this slide is to provide a graphical representation of total sessions, bounce rate, goal completions, goal completion rate, top channels over time, etc.
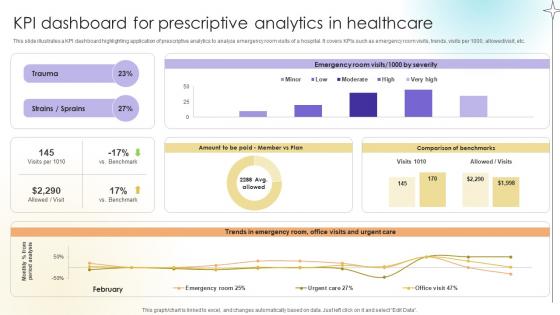
KPI Dashboard For Prescriptive Analytics In Healthcare Data Analytics SS V
This slide illustrates a KPI dashboard highlighting application of prescriptive analytics to analyze emergency room visits of a hospital. It covers KPIs such as emergency room visits, trends, visits per 1000, allowed or visit, etc. Find highly impressive KPI Dashboard For Prescriptive Analytics In Healthcare Data Analytics SS V on Slidegeeks to deliver a meaningful presentation. You can save an ample amount of time using these presentation templates. No need to worry to prepare everything from scratch because Slidegeeks experts have already done a huge research and work for you. You need to download KPI Dashboard For Prescriptive Analytics In Healthcare Data Analytics SS V for your upcoming presentation. All the presentation templates are 100 percent editable and you can change the color and personalize the content accordingly. Download now This slide illustrates a KPI dashboard highlighting application of prescriptive analytics to analyze emergency room visits of a hospital. It covers KPIs such as emergency room visits, trends, visits per 1000, allowed or visit, etc.

Product Analytics KPI Dashboard For Lead Generation Product Analytics Implementation Data Analytics V
This slide illustrates a dashboard to monitor the lead generation on website page using product analytics aimed at making necessary improvements. It covers insights regarding analysis of lead conversions, event retention rate and page views.Do you have to make sure that everyone on your team knows about any specific topic I yes, then you should give Product Analytics KPI Dashboard For Lead Generation Product Analytics Implementation Data Analytics V a try. Our experts have put a lot of knowledge and effort into creating this impeccable Product Analytics KPI Dashboard For Lead Generation Product Analytics Implementation Data Analytics V. You can use this template for your upcoming presentations, as the slides are perfect to represent even the tiniest detail. You can download these templates from the Slidegeeks website and these are easy to edit. So grab these today This slide illustrates a dashboard to monitor the lead generation on website page using product analytics aimed at making necessary improvements. It covers insights regarding analysis of lead conversions, event retention rate and page views
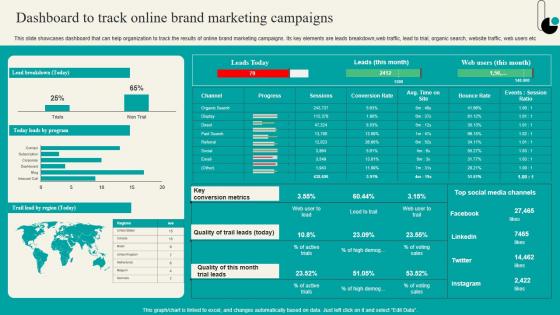
Dashboard To Track Online Brand Marketing Strategic Marketing Plan Themes PDF
This slide showcases dashboard that can help organization to track the results of online brand marketing campaigns. Its key elements are leads breakdown,web traffic, lead to trial, organic search, website traffic, web users etc. If you are looking for a format to display your unique thoughts, then the professionally designed Dashboard To Track Online Brand Marketing Strategic Marketing Plan Themes PDF is the one for you. You can use it as a Google Slides template or a PowerPoint template. Incorporate impressive visuals, symbols, images, and other charts. Modify or reorganize the text boxes as you desire. Experiment with shade schemes and font pairings. Alter, share or cooperate with other people on your work. Download Dashboard To Track Online Brand Marketing Strategic Marketing Plan Themes PDF and find out how to give a successful presentation. Present a perfect display to your team and make your presentation unforgettable. This slide showcases dashboard that can help organization to track the results of online brand marketing campaigns. Its key elements are leads breakdown,web traffic, lead to trial, organic search, website traffic, web users etc.
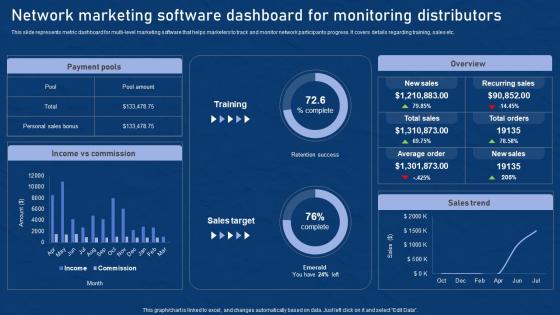
Network Marketing Software Dashboard Effective Network Marketing Promotion Tactics Themes Pdf
This slide represents metric dashboard for multi level marketing software that helps marketers to track and monitor network participants progress. It covers details regarding training, sales etc. If you are looking for a format to display your unique thoughts, then the professionally designed Network Marketing Software Dashboard Effective Network Marketing Promotion Tactics Themes Pdf is the one for you. You can use it as a Google Slides template or a PowerPoint template. Incorporate impressive visuals, symbols, images, and other charts. Modify or reorganize the text boxes as you desire. Experiment with shade schemes and font pairings. Alter, share or cooperate with other people on your work. Download Network Marketing Software Dashboard Effective Network Marketing Promotion Tactics Themes Pdf and find out how to give a successful presentation. Present a perfect display to your team and make your presentation unforgettable. This slide represents metric dashboard for multi level marketing software that helps marketers to track and monitor network participants progress. It covers details regarding training, sales etc.
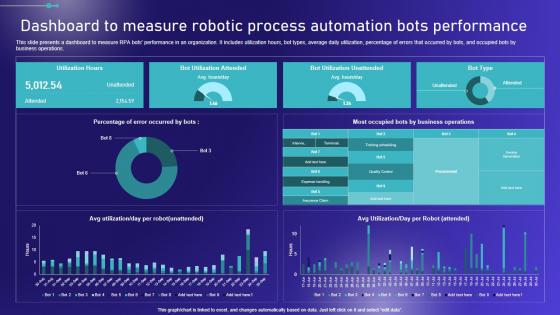
Dashboard To Measure Robotic Process Automation Embracing Robotic Process Diagrams PDF
This slide presents a dashboard to measure RPA bots performance in an organization. It includes utilization hours, bot types, average daily utilization, percentage of errors that occurred by bots, and occupied bots by business operations. If you are looking for a format to display your unique thoughts, then the professionally designed Dashboard To Measure Robotic Process Automation Embracing Robotic Process Diagrams PDF is the one for you. You can use it as a Google Slides template or a PowerPoint template. Incorporate impressive visuals, symbols, images, and other charts. Modify or reorganize the text boxes as you desire. Experiment with shade schemes and font pairings. Alter, share or cooperate with other people on your work. Download Dashboard To Measure Robotic Process Automation Embracing Robotic Process Diagrams PDF and find out how to give a successful presentation. Present a perfect display to your team and make your presentation unforgettable. This slide presents a dashboard to measure RPA bots performance in an organization. It includes utilization hours, bot types, average daily utilization, percentage of errors that occurred by bots, and occupied bots by business operations.
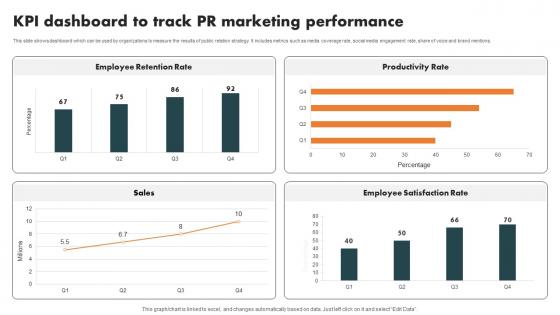
KPI Dashboard Track Pr Internal Branding Strategy For Enhanced Advocacy Infographics Pdf
This slide shows dashboard which can be used by organizations to measure the results of public relation strategy. It includes metrics such as media coverage rate, social media engagement rate, share of voice and brand mentions. Explore a selection of the finest KPI Dashboard Track Pr Internal Branding Strategy For Enhanced Advocacy Infographics Pdf here. With a plethora of professionally designed and pre made slide templates, you can quickly and easily find the right one for your upcoming presentation. You can use our KPI Dashboard Track Pr Internal Branding Strategy For Enhanced Advocacy Infographics Pdf to effectively convey your message to a wider audience. Slidegeeks has done a lot of research before preparing these presentation templates. The content can be personalized and the slides are highly editable. Grab templates today from Slidegeeks. This slide shows dashboard which can be used by organizations to measure the results of public relation strategy. It includes metrics such as media coverage rate, social media engagement rate, share of voice and brand mentions.
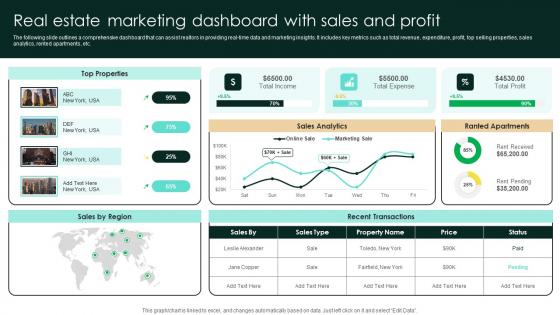
Real Estate Marketing Dashboard With Sales And Profit Strategic Real Estate Elements Pdf
The following slide outlines a comprehensive dashboard that can assist realtors in providing real-time data and marketing insights. It includes key metrics such as total revenue, expenditure, profit, top selling properties, sales analytics, rented apartments, etc. Whether you have daily or monthly meetings, a brilliant presentation is necessary. Real Estate Marketing Dashboard With Sales And Profit Strategic Real Estate Elements Pdf can be your best option for delivering a presentation. Represent everything in detail using Real Estate Marketing Dashboard With Sales And Profit Strategic Real Estate Elements Pdf and make yourself stand out in meetings. The template is versatile and follows a structure that will cater to your requirements. All the templates prepared by Slidegeeks are easy to download and edit. Our research experts have taken care of the corporate themes as well. So, give it a try and see the results. The following slide outlines a comprehensive dashboard that can assist realtors in providing real-time data and marketing insights. It includes key metrics such as total revenue, expenditure, profit, top selling properties, sales analytics, rented apartments, etc.
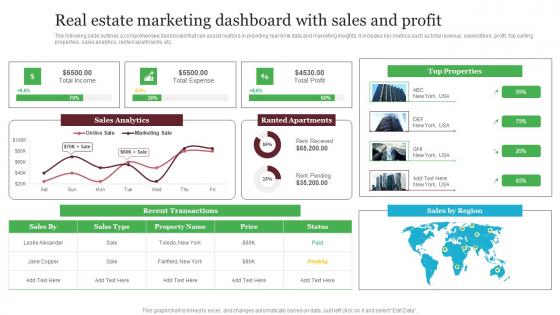
Real Estate Marketing Dashboard With Sales And Profit Out Of The Box Real Formats Pdf
The following slide outlines a comprehensive dashboard that can assist realtors in providing real-time data and marketing insights. It includes key metrics such as total revenue, expenditure, profit, top selling properties, sales analytics, rented apartments, etc. If you are looking for a format to display your unique thoughts, then the professionally designed Real Estate Marketing Dashboard With Sales And Profit Out Of The Box Real Formats Pdf is the one for you. You can use it as a Google Slides template or a PowerPoint template. Incorporate impressive visuals, symbols, images, and other charts. Modify or reorganize the text boxes as you desire. Experiment with shade schemes and font pairings. Alter, share or cooperate with other people on your work. Download Real Estate Marketing Dashboard With Sales And Profit Out Of The Box Real Formats Pdf and find out how to give a successful presentation. Present a perfect display to your team and make your presentation unforgettable. The following slide outlines a comprehensive dashboard that can assist realtors in providing real-time data and marketing insights. It includes key metrics such as total revenue, expenditure, profit, top selling properties, sales analytics, rented apartments, etc.
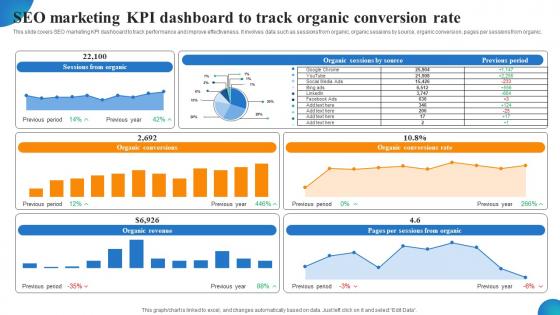
Seo Marketing KPI Dashboard To Track Organic Conversion Rate MDSS For Enhanced Template Pdf
This slide covers SEO marketing KPI dashboard to track performance and improve effectiveness. It involves data such as sessions from organic, organic sessions by source, organic conversion, pages per sessions from organic. Here you can discover an assortment of the finest PowerPoint and Google Slides templates. With these templates, you can create presentations for a variety of purposes while simultaneously providing your audience with an eye-catching visual experience. Download Seo Marketing KPI Dashboard To Track Organic Conversion Rate MDSS For Enhanced Template Pdf to deliver an impeccable presentation. These templates will make your job of preparing presentations much quicker, yet still, maintain a high level of quality. Slidegeeks has experienced researchers who prepare these templates and write high-quality content for you. Later on, you can personalize the content by editing the Seo Marketing KPI Dashboard To Track Organic Conversion Rate MDSS For Enhanced Template Pdf This slide covers SEO marketing KPI dashboard to track performance and improve effectiveness. It involves data such as sessions from organic, organic sessions by source, organic conversion, pages per sessions from organic.
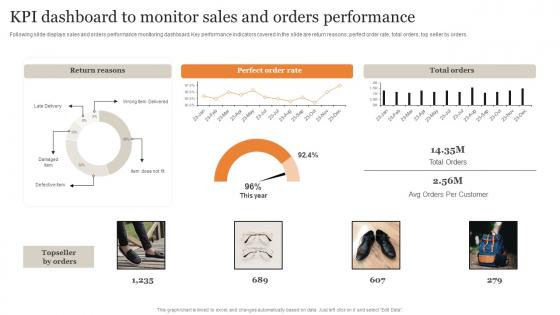
KPI Dashboard To Monitor Sales And Orders Performance Ultimate Guide Implementing Demonstration Pdf
Following slide displays sales and orders performance monitoring dashboard. Key performance indicators covered in the slide are return reasons, perfect order rate, total orders, top seller by orders. Here you can discover an assortment of the finest PowerPoint and Google Slides templates. With these templates, you can create presentations for a variety of purposes while simultaneously providing your audience with an eye-catching visual experience. Download KPI Dashboard To Monitor Sales And Orders Performance Ultimate Guide Implementing Demonstration Pdf to deliver an impeccable presentation. These templates will make your job of preparing presentations much quicker, yet still, maintain a high level of quality. Slidegeeks has experienced researchers who prepare these templates and write high-quality content for you. Later on, you can personalize the content by editing the KPI Dashboard To Monitor Sales And Orders Performance Ultimate Guide Implementing Demonstration Pdf Following slide displays sales and orders performance monitoring dashboard. Key performance indicators covered in the slide are return reasons, perfect order rate, total orders, top seller by orders.
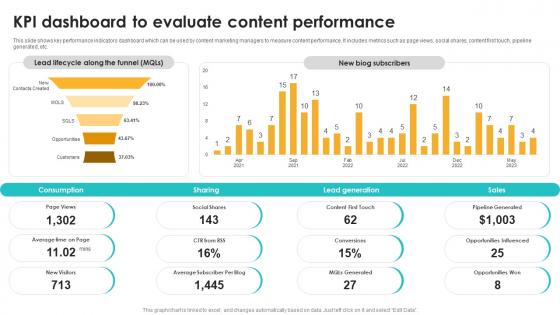
Kpi Dashboard To Evaluate Content Performance Seo Content Plan To Drive Strategy SS V
This slide shows key performance indicators dashboard which can be used by content marketing managers to measure content performance. It includes metrics such as page views, social shares, content first touch, pipeline generated, etc. This Kpi Dashboard To Evaluate Content Performance Seo Content Plan To Drive Strategy SS V is perfect for any presentation, be it in front of clients or colleagues. It is a versatile and stylish solution for organizing your meetings. The Kpi Dashboard To Evaluate Content Performance Seo Content Plan To Drive Strategy SS V features a modern design for your presentation meetings. The adjustable and customizable slides provide unlimited possibilities for acing up your presentation. Slidegeeks has done all the homework before launching the product for you. So, do not wait, grab the presentation templates today This slide shows key performance indicators dashboard which can be used by content marketing managers to measure content performance. It includes metrics such as page views, social shares, content first touch, pipeline generated, etc.
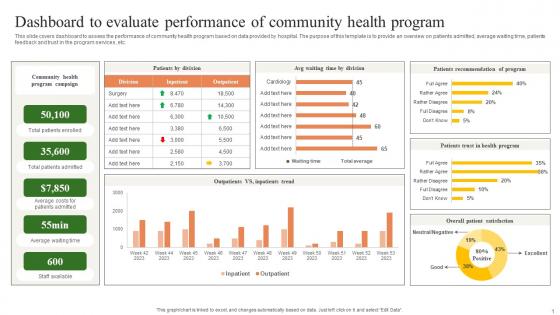
Dashboard To Evaluate Performance Of Building A Winning Community Outreach Strategy SS V
This slide covers dashboard to assess the performance of community health program based on data provided by hospital. The purpose of this template is to provide an overview on patients admitted, average waiting time, patients feedback and trust in the program services, etc. Find highly impressive Dashboard To Evaluate Performance Of Building A Winning Community Outreach Strategy SS V on Slidegeeks to deliver a meaningful presentation. You can save an ample amount of time using these presentation templates. No need to worry to prepare everything from scratch because Slidegeeks experts have already done a huge research and work for you. You need to download Dashboard To Evaluate Performance Of Building A Winning Community Outreach Strategy SS V for your upcoming presentation. All the presentation templates are 100 percent editable and you can change the color and personalize the content accordingly. Download now This slide covers dashboard to assess the performance of community health program based on data provided by hospital. The purpose of this template is to provide an overview on patients admitted, average waiting time, patients feedback and trust in the program services, etc.

KPI Dashboard Showcasing Smart Meter Internet Of Things Solutions To Enhance Energy IoT SS V
This slide exhibits a smart meter monitoring dashboard that provides valuable data, helpful in decision making and enhance regulatory compliance. It includes elements such as voltage, energy consumption, energy meters, energy consumption rate, etc. Here you can discover an assortment of the finest PowerPoint and Google Slides templates. With these templates, you can create presentations for a variety of purposes while simultaneously providing your audience with an eye-catching visual experience. Download KPI Dashboard Showcasing Smart Meter Internet Of Things Solutions To Enhance Energy IoT SS V to deliver an impeccable presentation. These templates will make your job of preparing presentations much quicker, yet still, maintain a high level of quality. Slidegeeks has experienced researchers who prepare these templates and write high-quality content for you. Later on, you can personalize the content by editing the KPI Dashboard Showcasing Smart Meter Internet Of Things Solutions To Enhance Energy IoT SS V. This slide exhibits a smart meter monitoring dashboard that provides valuable data, helpful in decision making and enhance regulatory compliance. It includes elements such as voltage, energy consumption, energy meters, energy consumption rate, etc.
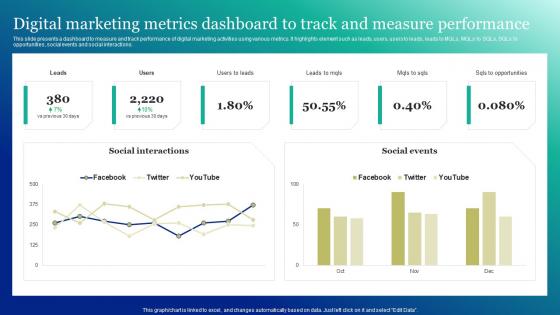
Digital Marketing Metrics Dashboard To Marketing And Promotion Automation Infographics Pdf
This slide presents a dashboard to measure and track performance of digital marketing activities using various metrics. It highlights element such as leads, users, users to leads, leads to MQLs, MQLs to SQLs, SQLs to opportunities, social events and social interactions.Whether you have daily or monthly meetings, a brilliant presentation is necessary. Digital Marketing Metrics Dashboard To Marketing And Promotion Automation Infographics Pdf can be your best option for delivering a presentation. Represent everything in detail using Digital Marketing Metrics Dashboard To Marketing And Promotion Automation Infographics Pdf and make yourself stand out in meetings. The template is versatile and follows a structure that will cater to your requirements. All the templates prepared by Slidegeeks are easy to download and edit. Our research experts have taken care of the corporate themes as well. So, give it a try and see the results. This slide presents a dashboard to measure and track performance of digital marketing activities using various metrics. It highlights element such as leads, users, users to leads, leads to MQLs, MQLs to SQLs, SQLs to opportunities, social events and social interactions.
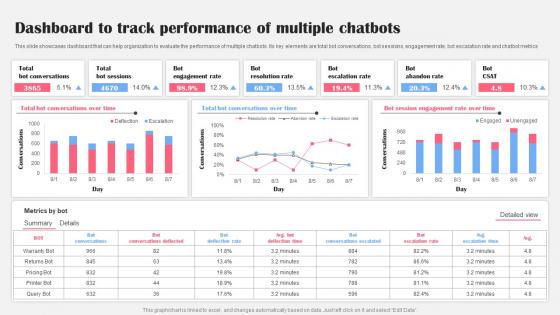
Dashboard To Track Performance Multiple AI Bot Application For Various Industries Demonstration Pdf
This slide showcases dashboard that can help organization to evaluate the performance of multiple chatbots. Its key elements are total bot conversations, bot sessions, engagement rate, bot escalation rate and chatbot metrics Are you searching for a Dashboard To Track Performance Multiple AI Bot Application For Various Industries Demonstration Pdf that is uncluttered, straightforward, and original Its easy to edit, and you can change the colors to suit your personal or business branding. For a presentation that expresses how much effort you have put in, this template is ideal With all of its features, including tables, diagrams, statistics, and lists, its perfect for a business plan presentation. Make your ideas more appealing with these professional slides. Download Dashboard To Track Performance Multiple AI Bot Application For Various Industries Demonstration Pdf from Slidegeeks today. This slide showcases dashboard that can help organization to evaluate the performance of multiple chatbots. Its key elements are total bot conversations, bot sessions, engagement rate, bot escalation rate and chatbot metrics
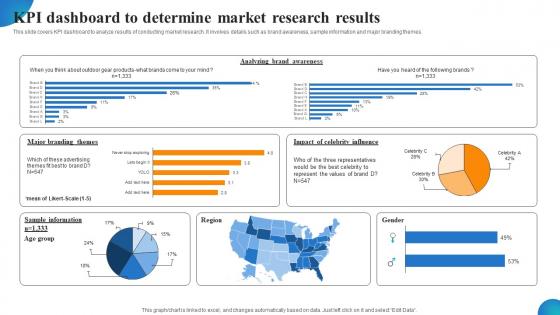
KPI Dashboard To Determine Market Research Results MDSS For Enhanced Ideas Pdf
This slide covers KPI dashboard to analyze results of conducting market research. It involves details such as brand awareness, sample information and major branding themes. If you are looking for a format to display your unique thoughts, then the professionally designed KPI Dashboard To Determine Market Research Results MDSS For Enhanced Ideas Pdf is the one for you. You can use it as a Google Slides template or a PowerPoint template. Incorporate impressive visuals, symbols, images, and other charts. Modify or reorganize the text boxes as you desire. Experiment with shade schemes and font pairings. Alter, share or cooperate with other people on your work. Download KPI Dashboard To Determine Market Research Results MDSS For Enhanced Ideas Pdf and find out how to give a successful presentation. Present a perfect display to your team and make your presentation unforgettable. This slide covers KPI dashboard to analyze results of conducting market research. It involves details such as brand awareness, sample information and major branding themes.
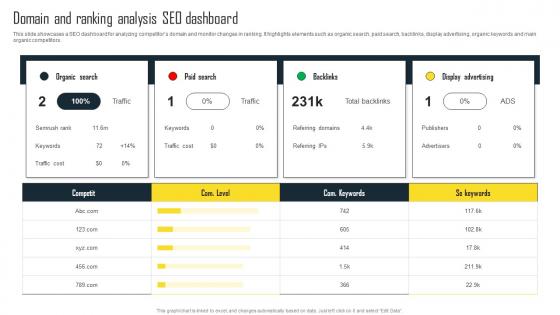
Domain And Ranking Analysis SEO Dashboard Efficient Plan For Conducting Competitor Clipart Pdf
This slide showcases a SEO dashboard for analyzing competitors domain and monitor changes in ranking. It highlights elements such as organic search, paid search, backlinks, display advertising, organic keywords and main organic competitors. Are you searching for a Domain And Ranking Analysis SEO Dashboard Efficient Plan For Conducting Competitor Clipart Pdf that is uncluttered, straightforward, and original It is easy to edit, and you can change the colors to suit your personal or business branding. For a presentation that expresses how much effort you have put in, this template is ideal With all of its features, including tables, diagrams, statistics, and lists, it is perfect for a business plan presentation. Make your ideas more appealing with these professional slides. Download Domain And Ranking Analysis SEO Dashboard Efficient Plan For Conducting Competitor Clipart Pdf from Slidegeeks today. This slide showcases a SEO dashboard for analyzing competitors domain and monitor changes in ranking. It highlights elements such as organic search, paid search, backlinks, display advertising, organic keywords and main organic competitors.
KPI Dashboard Tracking Seo Major Promotional Analytics Future Trends Guidelines Pdf
This slide covers the KPI dashboard for analyzing SEO metrics such as authority score, organic traffic, organic keywords, paid keywords, ref. Domains, site audit, link building tool, organic traffic, on page SEO checker, backlink audit, etc. Are you searching for a KPI Dashboard Tracking Seo Major Promotional Analytics Future Trends Guidelines Pdf that is uncluttered, straightforward, and original Its easy to edit, and you can change the colors to suit your personal or business branding. For a presentation that expresses how much effort you have put in, this template is ideal With all of its features, including tables, diagrams, statistics, and lists, its perfect for a business plan presentation. Make your ideas more appealing with these professional slides. Download KPI Dashboard Tracking Seo Major Promotional Analytics Future Trends Guidelines Pdf from Slidegeeks today. This slide covers the KPI dashboard for analyzing SEO metrics such as authority score, organic traffic, organic keywords, paid keywords, ref. Domains, site audit, link building tool, organic traffic, on page SEO checker, backlink audit, etc.
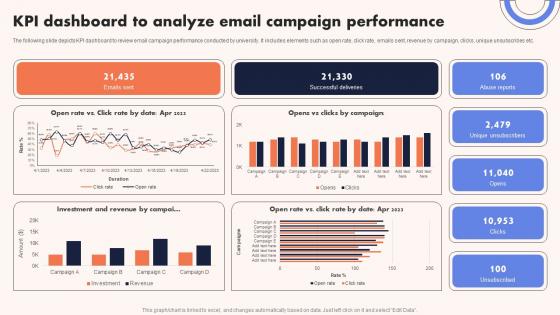
University Marketing Guide KPI Dashboard To Analyze Email Campaign Performance Strategy SS V
The following slide depicts KPI dashboard to review email campaign performance conducted by university. It includes elements such as open rate, click rate, emails sent, revenue by campaign, clicks, unique unsubscribes etc. Are you searching for a University Marketing Guide KPI Dashboard To Analyze Email Campaign Performance Strategy SS V that is uncluttered, straightforward, and original Its easy to edit, and you can change the colors to suit your personal or business branding. For a presentation that expresses how much effort you have put in, this template is ideal With all of its features, including tables, diagrams, statistics, and lists, its perfect for a business plan presentation. Make your ideas more appealing with these professional slides. Download University Marketing Guide KPI Dashboard To Analyze Email Campaign Performance Strategy SS V from Slidegeeks today. The following slide depicts KPI dashboard to review email campaign performance conducted by university. It includes elements such as open rate, click rate, emails sent, revenue by campaign, clicks, unique unsubscribes etc.

Salon Marketing Plan To Optimize Website Analytics Dashboard To Monitor Strategy SS V
This slide represent a website analytics dashboard tracking online traffic and appointments. It includes KPIs such as visitors count, purchasers count, booked appointments, forecasted booking count by month, visitor-to-customer conversion trend, customer acquisition through channels and visitors count by categories. Here you can discover an assortment of the finest PowerPoint and Google Slides templates. With these templates, you can create presentations for a variety of purposes while simultaneously providing your audience with an eye-catching visual experience. Download Salon Marketing Plan To Optimize Website Analytics Dashboard To Monitor Strategy SS V to deliver an impeccable presentation. These templates will make your job of preparing presentations much quicker, yet still, maintain a high level of quality. Slidegeeks has experienced researchers who prepare these templates and write high-quality content for you. Later on, you can personalize the content by editing the Salon Marketing Plan To Optimize Website Analytics Dashboard To Monitor Strategy SS V. This slide represent a website analytics dashboard tracking online traffic and appointments. It includes KPIs such as visitors count, purchasers count, booked appointments, forecasted booking count by month, visitor-to-customer conversion trend, customer acquisition through channels and visitors count by categories.
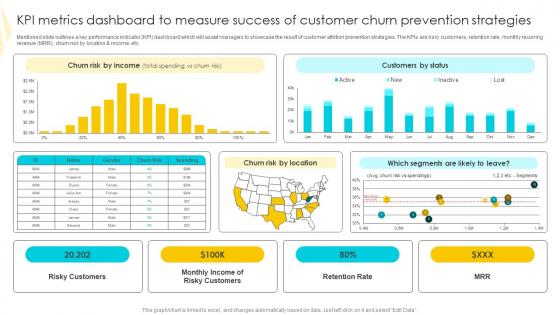
KPI Metrics Dashboard To Measure Strategies To Mitigate Customer Churn Formats Pdf
Mentioned slide outlines a key performance indicator KPI dashboard which will assist managers to showcase the result of customer attrition prevention strategies. The KPIs are risky customers, retention rate, monthly recurring revenue MRR, churn risk by location and income, etc. This KPI Metrics Dashboard To Measure Strategies To Mitigate Customer Churn Formats Pdf is perfect for any presentation, be it in front of clients or colleagues. It is a versatile and stylish solution for organizing your meetings. The KPI Metrics Dashboard To Measure Strategies To Mitigate Customer Churn Formats Pdf features a modern design for your presentation meetings. The adjustable and customizable slides provide unlimited possibilities for acing up your presentation. Slidegeeks has done all the homework before launching the product for you. So, do not wait, grab the presentation templates today Mentioned slide outlines a key performance indicator KPI dashboard which will assist managers to showcase the result of customer attrition prevention strategies. The KPIs are risky customers, retention rate, monthly recurring revenue MRR, churn risk by location and income, etc.
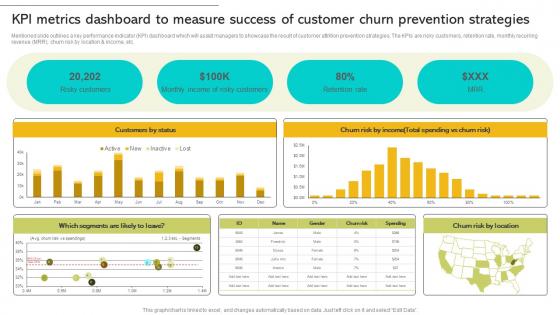
Implementing Strategies To Enhance Kpi Metrics Dashboard To Measure Success Of Customer Churn Ideas PDF
Mentioned slide outlines a key performance indicator KPI dashboard which will assist managers to showcase the result of customer attrition prevention strategies. The KPIs are risky customers, retention rate, monthly recurring revenue MRR, churn risk by location and income, etc. Explore a selection of the finest Implementing Strategies To Enhance Kpi Metrics Dashboard To Measure Success Of Customer Churn Ideas PDF here. With a plethora of professionally designed and pre-made slide templates, you can quickly and easily find the right one for your upcoming presentation. You can use our Implementing Strategies To Enhance Kpi Metrics Dashboard To Measure Success Of Customer Churn Ideas PDF to effectively convey your message to a wider audience. Slidegeeks has done a lot of research before preparing these presentation templates. The content can be personalized and the slides are highly editable. Grab templates today from Slidegeeks. Mentioned slide outlines a key performance indicator KPI dashboard which will assist managers to showcase the result of customer attrition prevention strategies. The KPIs are risky customers, retention rate, monthly recurring revenue MRR, churn risk by location and income, etc.
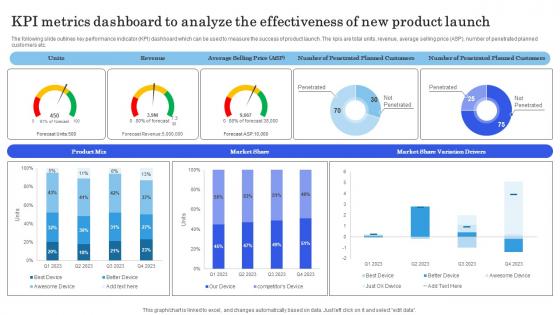
Launching New Commodity Kpi Metrics Dashboard To Analyze The Effectiveness Demonstration Pdf
The following slide outlines key performance indicator KPI dashboard which can be used to measure the success of product launch. The kpis are total units, revenue, average selling price ASP, number of penetrated planned customers etc. Explore a selection of the finest Launching New Commodity Kpi Metrics Dashboard To Analyze The Effectiveness Demonstration Pdf here. With a plethora of professionally designed and pre-made slide templates, you can quickly and easily find the right one for your upcoming presentation. You can use our Launching New Commodity Kpi Metrics Dashboard To Analyze The Effectiveness Demonstration Pdf to effectively convey your message to a wider audience. Slidegeeks has done a lot of research before preparing these presentation templates. The content can be personalized and the slides are highly editable. Grab templates today from Slidegeeks. The following slide outlines key performance indicator KPI dashboard which can be used to measure the success of product launch. The kpis are total units, revenue, average selling price ASP, number of penetrated planned customers etc.
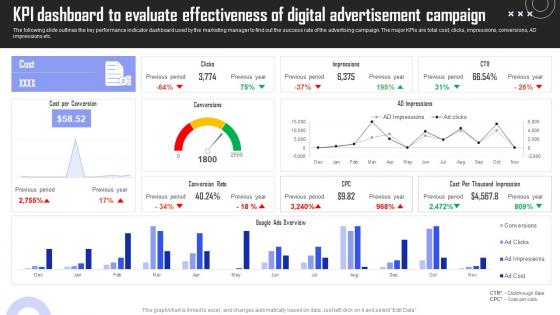
KPI Dashboard Evaluate Brand Building Techniques To Gain Competitive Edge Template Pdf
The following slide outlines the key performance indicator dashboard used by the marketing manager to find out the success rate of the advertising campaign. The major KPIs are total cost, clicks, impressions, conversions, AD impressions etc. Explore a selection of the finest KPI Dashboard Evaluate Brand Building Techniques To Gain Competitive Edge Template Pdf here. With a plethora of professionally designed and pre made slide templates, you can quickly and easily find the right one for your upcoming presentation. You can use our KPI Dashboard Evaluate Brand Building Techniques To Gain Competitive Edge Template Pdf to effectively convey your message to a wider audience. Slidegeeks has done a lot of research before preparing these presentation templates. The content can be personalized and the slides are highly editable. Grab templates today from Slidegeeks. The following slide outlines the key performance indicator dashboard used by the marketing manager to find out the success rate of the advertising campaign. The major KPIs are total cost, clicks, impressions, conversions, AD impressions etc.
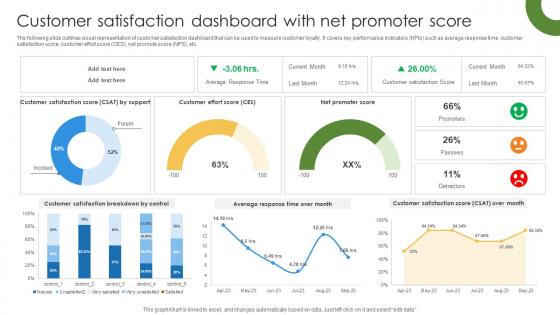
Marketing Growth Strategy Customer Satisfaction Dashboard With Net Promoter Strategy SS V
The following slide outlines visual representation of customer satisfaction dashboard that can be used to measure customer loyalty. It covers key performance indicators KPIs such as average response time, customer satisfaction score, customer effort score CES, net promote score NPS, etc. Get a simple yet stunning designed Marketing Growth Strategy Customer Satisfaction Dashboard With Net Promoter Strategy SS V. It is the best one to establish the tone in your meetings. It is an excellent way to make your presentations highly effective. So, download this PPT today from Slidegeeks and see the positive impacts. Our easy-to-edit Marketing Growth Strategy Customer Satisfaction Dashboard With Net Promoter Strategy SS V can be your go-to option for all upcoming conferences and meetings. So, what are you waiting for Grab this template today. The following slide outlines visual representation of customer satisfaction dashboard that can be used to measure customer loyalty. It covers key performance indicators KPIs such as average response time, customer satisfaction score, customer effort score CES, net promote score NPS, etc.
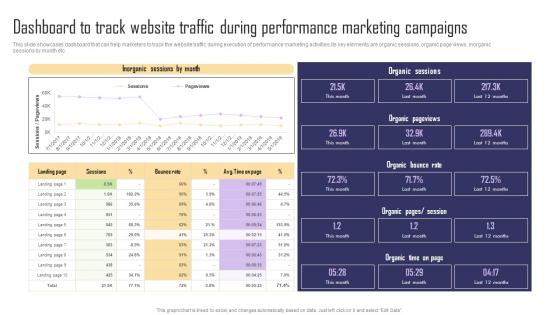
Dashboard To Track Website Traffic During Performance Paid Internet Marketing Strategy Guidelines Pdf
This slide showcases dashboard that can help marketers to track the website traffic during execution of performance marketing activities.Its key elements are organic sessions, organic page views, inorganic sessions by month etc. Whether you have daily or monthly meetings, a brilliant presentation is necessary. Dashboard To Track Website Traffic During Performance Paid Internet Marketing Strategy Guidelines Pdf can be your best option for delivering a presentation. Represent everything in detail using Dashboard To Track Website Traffic During Performance Paid Internet Marketing Strategy Guidelines Pdf and make yourself stand out in meetings. The template is versatile and follows a structure that will cater to your requirements. All the templates prepared by Slidegeeks are easy to download and edit. Our research experts have taken care of the corporate themes as well. So, give it a try and see the results. This slide showcases dashboard that can help marketers to track the website traffic during execution of performance marketing activities.Its key elements are organic sessions, organic page views, inorganic sessions by month etc.
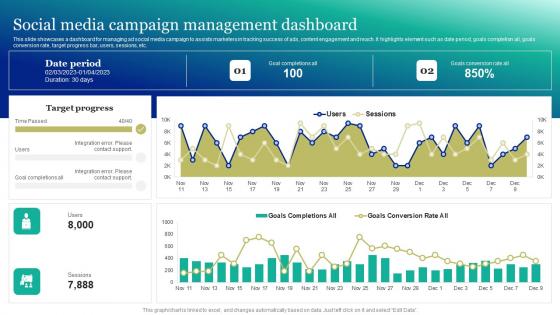
Social Media Campaign Management Dashboard Marketing And Promotion Automation Clipart Pdf
This slide showcases a dashboard for managing ad social media campaign to assists marketers in tracking success of ads, content engagement and reach. It highlights element such as date period, goals completion all, goals conversion rate, target progress bar, users, sessions, etc. Whether you have daily or monthly meetings, a brilliant presentation is necessary. Social Media Campaign Management Dashboard Marketing And Promotion Automation Clipart Pdf can be your best option for delivering a presentation. Represent everything in detail using Social Media Campaign Management Dashboard Marketing And Promotion Automation Clipart Pdf and make yourself stand out in meetings. The template is versatile and follows a structure that will cater to your requirements. All the templates prepared by Slidegeeks are easy to download and edit. Our research experts have taken care of the corporate themes as well. So, give it a try and see the results. This slide showcases a dashboard for managing ad social media campaign to assists marketers in tracking success of ads, content engagement and reach. It highlights element such as date period, goals completion all, goals conversion rate, target progress bar, users, sessions, etc.
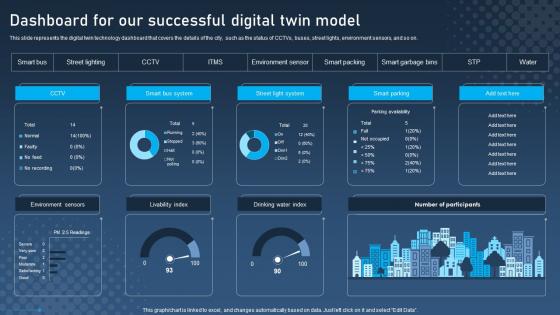
Dashboard For Our Successful Digital Twin Digital Twins For Enhanced Industrial Inspiration Pdf
This slide represents the digital twin technology dashboard that covers the details of the city, such as the status of CCTVs, buses, street lights, environment sensors, and so on. Whether you have daily or monthly meetings, a brilliant presentation is necessary. Dashboard For Our Successful Digital Twin Digital Twins For Enhanced Industrial Inspiration Pdf can be your best option for delivering a presentation. Represent everything in detail using Dashboard For Our Successful Digital Twin Digital Twins For Enhanced Industrial Inspiration Pdf and make yourself stand out in meetings. The template is versatile and follows a structure that will cater to your requirements. All the templates prepared by Slidegeeks are easy to download and edit. Our research experts have taken care of the corporate themes as well. So, give it a try and see the results. This slide represents the digital twin technology dashboard that covers the details of the city, such as the status of CCTVs, buses, street lights, environment sensors, and so on.
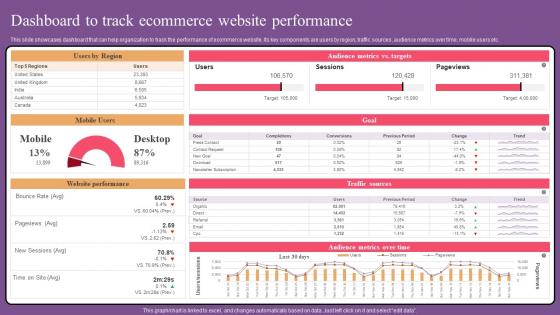
Dashboard To Track Ecommerce Website Optimization To Improve Product Sale Elements Pdf
This slide showcases dashboard that can help organization to track the performance of ecommerce website. Its key components are users by region, traffic sources, audience metrics over time, mobile users etc. Whether you have daily or monthly meetings, a brilliant presentation is necessary. Dashboard To Track Ecommerce Website Optimization To Improve Product Sale Elements Pdf can be your best option for delivering a presentation. Represent everything in detail using Dashboard To Track Ecommerce Website Optimization To Improve Product Sale Elements Pdf and make yourself stand out in meetings. The template is versatile and follows a structure that will cater to your requirements. All the templates prepared by Slidegeeks are easy to download and edit. Our research experts have taken care of the corporate themes as well. So, give it a try and see the results. This slide showcases dashboard that can help organization to track the performance of ecommerce website. Its key components are users by region, traffic sources, audience metrics over time, mobile users etc.
Dashboard For Tracking Referral Techniques For Generating Brand Awareness Sample Pdf
This slide covers the KPI dashboard for brands to evaluate the performance of referral marketing campaigns. It includes metrics such as referral participation rate, referred customers, referral conversion rate, total revenue generated, etc Whether you have daily or monthly meetings, a brilliant presentation is necessary. Dashboard For Tracking Referral Techniques For Generating Brand Awareness Sample Pdf can be your best option for delivering a presentation. Represent everything in detail using Dashboard For Tracking Referral Techniques For Generating Brand Awareness Sample Pdf and make yourself stand out in meetings. The template is versatile and follows a structure that will cater to your requirements. All the templates prepared by Slidegeeks are easy to download and edit. Our research experts have taken care of the corporate themes as well. So, give it a try and see the results. This slide covers the KPI dashboard for brands to evaluate the performance of referral marketing campaigns. It includes metrics such as referral participation rate, referred customers, referral conversion rate, total revenue generated, etc.
Dashboard For Tracking Referral Marketing Tracking Word Mouth Marketing Slides PDF
This slide covers the KPI dashboard for brands to evaluate the performance of referral marketing campaigns. It includes metrics such as referral participation rate, referred customers, referral conversion rate, total revenue generated, etc. Whether you have daily or monthly meetings, a brilliant presentation is necessary. Dashboard For Tracking Referral Marketing Tracking Word Mouth Marketing Slides PDF can be your best option for delivering a presentation. Represent everything in detail using Dashboard For Tracking Referral Marketing Tracking Word Mouth Marketing Slides PDF and make yourself stand out in meetings. The template is versatile and follows a structure that will cater to your requirements. All the templates prepared by Slidegeeks are easy to download and edit. Our research experts have taken care of the corporate themes as well. So, give it a try and see the results. This slide covers the KPI dashboard for brands to evaluate the performance of referral marketing campaigns. It includes metrics such as referral participation rate, referred customers, referral conversion rate, total revenue generated, etc.
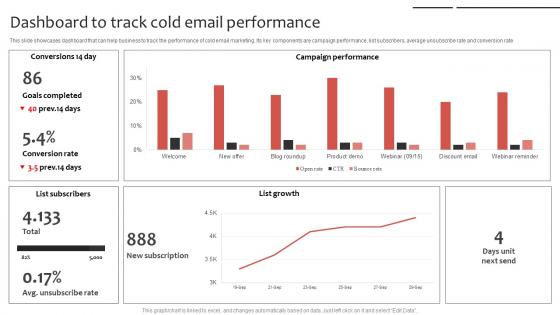
Phone Sales Strategy To Drive Dashboard To Track Cold Email Performance Strategy SS V
This slide showcases dashboard that can help business to track the performance of cold email marketing. Its key components are campaign performance, list subscribers, average unsubscribe rate and conversion rate. Whether you have daily or monthly meetings, a brilliant presentation is necessary. Phone Sales Strategy To Drive Dashboard To Track Cold Email Performance Strategy SS V can be your best option for delivering a presentation. Represent everything in detail using Phone Sales Strategy To Drive Dashboard To Track Cold Email Performance Strategy SS V and make yourself stand out in meetings. The template is versatile and follows a structure that will cater to your requirements. All the templates prepared by Slidegeeks are easy to download and edit. Our research experts have taken care of the corporate themes as well. So, give it a try and see the results. This slide showcases dashboard that can help business to track the performance of cold email marketing. Its key components are campaign performance, list subscribers, average unsubscribe rate and conversion rate
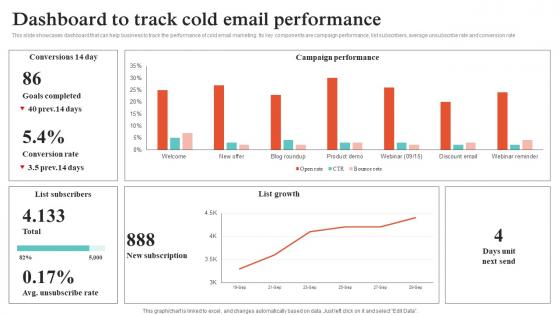
Virtual Sales Strategies Dashboard To Track Cold Email Performance Strategy SS V
This slide showcases dashboard that can help business to track the performance of cold email marketing. Its key components are campaign performance, list subscribers, average unsubscribe rate and conversion rate. Whether you have daily or monthly meetings, a brilliant presentation is necessary. Virtual Sales Strategies Dashboard To Track Cold Email Performance Strategy SS V can be your best option for delivering a presentation. Represent everything in detail using Virtual Sales Strategies Dashboard To Track Cold Email Performance Strategy SS V and make yourself stand out in meetings. The template is versatile and follows a structure that will cater to your requirements. All the templates prepared by Slidegeeks are easy to download and edit. Our research experts have taken care of the corporate themes as well. So, give it a try and see the results. This slide showcases dashboard that can help business to track the performance of cold email marketing. Its key components are campaign performance, list subscribers, average unsubscribe rate and conversion rate.
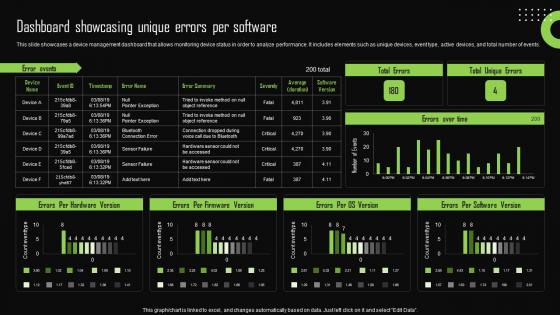
Dashboard Showcasing Unique Errors Per Software Iot Device Management Infographics Pdf
This slide showcases a device management dashboard that allows monitoring device status in order to analyze performance. It includes elements such as unique devices, event type, active devices, and total number of events. If you are looking for a format to display your unique thoughts, then the professionally designed Dashboard Showcasing Unique Errors Per Software Iot Device Management Infographics Pdf is the one for you. You can use it as a Google Slides template or a PowerPoint template. Incorporate impressive visuals, symbols, images, and other charts. Modify or reorganize the text boxes as you desire. Experiment with shade schemes and font pairings. Alter, share or cooperate with other people on your work. Download Dashboard Showcasing Unique Errors Per Software Iot Device Management Infographics Pdf and find out how to give a successful presentation. Present a perfect display to your team and make your presentation unforgettable. This slide showcases a device management dashboard that allows monitoring device status in order to analyze performance. It includes elements such as unique devices, event type, active devices, and total number of events.
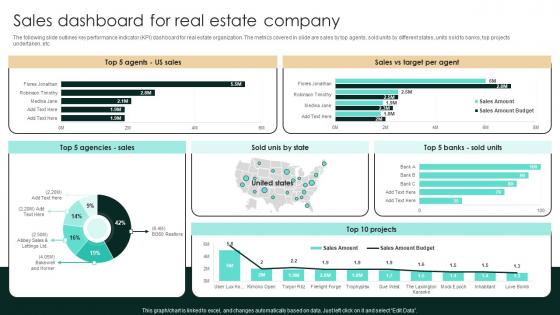
Sales Dashboard For Real Estate Company Strategic Real Estate Introduction Pdf
The following slide outlines key performance indicator KPI dashboard for real estate organization. The metrics covered in slide are sales by top agents, sold units by different states, units sold to banks, top projects undertaken, etc. If you are looking for a format to display your unique thoughts, then the professionally designed Sales Dashboard For Real Estate Company Strategic Real Estate Introduction Pdf is the one for you. You can use it as a Google Slides template or a PowerPoint template. Incorporate impressive visuals, symbols, images, and other charts. Modify or reorganize the text boxes as you desire. Experiment with shade schemes and font pairings. Alter, share or cooperate with other people on your work. Download Sales Dashboard For Real Estate Company Strategic Real Estate Introduction Pdf and find out how to give a successful presentation. Present a perfect display to your team and make your presentation unforgettable. The following slide outlines key performance indicator KPI dashboard for real estate organization. The metrics covered in slide are sales by top agents, sold units by different states, units sold to banks, top projects undertaken, etc.
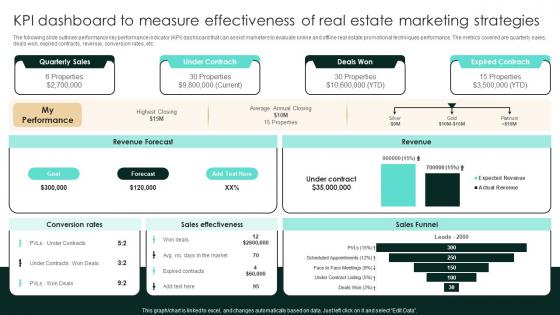
KPI Dashboard To Measure Effectiveness Of Real Estate Marketing Strategic Real Estate Structure Pdf
The following slide outlines performance key performance indicator KPI dashboard that can assist marketers to evaluate online and offline real estate promotional techniques performance. The metrics covered are quarterly sales, deals won, expired contracts, revenue, conversion rates, etc. Here you can discover an assortment of the finest PowerPoint and Google Slides templates. With these templates, you can create presentations for a variety of purposes while simultaneously providing your audience with an eye-catching visual experience. Download KPI Dashboard To Measure Effectiveness Of Real Estate Marketing Strategic Real Estate Structure Pdf to deliver an impeccable presentation. These templates will make your job of preparing presentations much quicker, yet still, maintain a high level of quality. Slidegeeks has experienced researchers who prepare these templates and write high-quality content for you. Later on, you can personalize the content by editing the KPI Dashboard To Measure Effectiveness Of Real Estate Marketing Strategic Real Estate Structure Pdf The following slide outlines performance key performance indicator KPI dashboard that can assist marketers to evaluate online and offline real estate promotional techniques performance. The metrics covered are quarterly sales, deals won, expired contracts, revenue, conversion rates, etc.
KPI Dashboard For Tracking Business Investment Portfolio Investment Fund PPT Example
Mentioned slide demonstrates the key performance indicator dashboard of the business financial portfolio.It includes key elements such as portfolio value, yield cost ratio, annual dividends, unrealized gains, investment style, investment allocation by sectors, etc. Here you can discover an assortment of the finest PowerPoint and Google Slides templates. With these templates, you can create presentations for a variety of purposes while simultaneously providing your audience with an eye catching visual experience. Download KPI Dashboard For Tracking Business Investment Portfolio Investment Fund PPT Example to deliver an impeccable presentation. These templates will make your job of preparing presentations much quicker, yet still, maintain a high level of quality. Slidegeeks has experienced researchers who prepare these templates and write high quality content for you. Later on, you can personalize the content by editing the KPI Dashboard For Tracking Business Investment Portfolio Investment Fund PPT Example. Mentioned slide demonstrates the key performance indicator dashboard of the business financial portfolio.It includes key elements such as portfolio value, yield cost ratio, annual dividends, unrealized gains, investment style, investment allocation by sectors, etc.
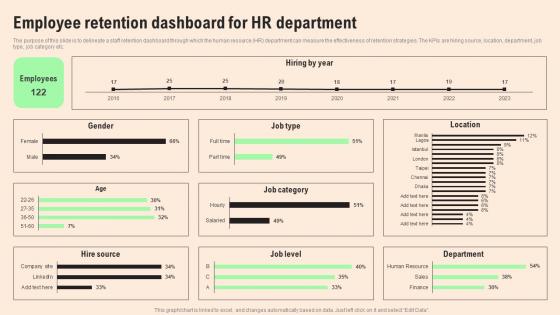
Employee Retention Dashboard HR Retention Techniques For Business Owners Background Pdf
The purpose of this slide is to delineate a staff retention dashboard through which the human resource HR department can measure the effectiveness of retention strategies. The KPIs are hiring source, location, department, job type, job category etc. Explore a selection of the finest Employee Retention Dashboard HR Retention Techniques For Business Owners Background Pdf here. With a plethora of professionally designed and pre made slide templates, you can quickly and easily find the right one for your upcoming presentation. You can use our Employee Retention Dashboard HR Retention Techniques For Business Owners Background Pdf to effectively convey your message to a wider audience. Slidegeeks has done a lot of research before preparing these presentation templates. The content can be personalized and the slides are highly editable. Grab templates today from Slidegeeks. The purpose of this slide is to delineate a staff retention dashboard through which the human resource HR department can measure the effectiveness of retention strategies. The KPIs are hiring source, location, department, job type, job category etc.

Salon Marketing Plan To Optimize Dashboard Monitoring Sales And Revenue Strategy SS V
This slide presents a dashboard tracking revenue and sales by products and services. It includes KPIs such as revenue by service and products, units sold, monthly revenue. Formulating a presentation can take up a lot of effort and time, so the content and message should always be the primary focus. The visuals of the PowerPoint can enhance the presenters message, so our Salon Marketing Plan To Optimize Dashboard Monitoring Sales And Revenue Strategy SS V was created to help save time. Instead of worrying about the design, the presenter can concentrate on the message while our designers work on creating the ideal templates for whatever situation is needed. Slidegeeks has experts for everything from amazing designs to valuable content, we have put everything into Salon Marketing Plan To Optimize Dashboard Monitoring Sales And Revenue Strategy SS V. This slide presents a dashboard tracking revenue and sales by products and services. It includes KPIs such as revenue by service and products, units sold, monthly revenue.
Erp Management Dashboard For Tracking Gross Erp And Digital Transformation For Maximizing DT SS V
This slide presents a ERP integrated finance monitoring dashboard that helps in tracking gross and net profit margin of business. It monitors KPIs such as balance, quick ratio, current ratio, total income, total expenses, accounts payable.Here you can discover an assortment of the finest PowerPoint and Google Slides templates. With these templates, you can create presentations for a variety of purposes while simultaneously providing your audience with an eye-catching visual experience. Download Erp Management Dashboard For Tracking Gross Erp And Digital Transformation For Maximizing DT SS V to deliver an impeccable presentation. These templates will make your job of preparing presentations much quicker, yet still, maintain a high level of quality. Slidegeeks has experienced researchers who prepare these templates and write high-quality content for you. Later on, you can personalize the content by editing the Erp Management Dashboard For Tracking Gross Erp And Digital Transformation For Maximizing DT SS V. This slide presents a ERP integrated finance monitoring dashboard that helps in tracking gross and net profit margin of business. It monitors KPIs such as balance, quick ratio, current ratio, total income, total expenses, accounts payable.
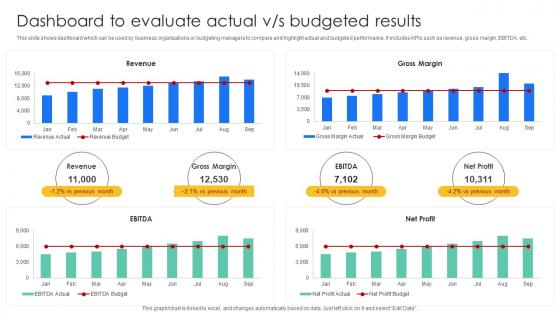
Dashboard To Evaluate Actual Vs Budgeted Results Effective And Efficient Tools To Develop Fin SS V
This slide shows dashboard which can be used by business organizations or budgeting managers to compare and highlight actual and budgeted performance. It includes KPIs such as revenue, gross margin, EBITDA, etc. Find highly impressive Dashboard To Evaluate Actual Vs Budgeted Results Effective And Efficient Tools To Develop Fin SS V on Slidegeeks to deliver a meaningful presentation. You can save an ample amount of time using these presentation templates. No need to worry to prepare everything from scratch because Slidegeeks experts have already done a huge research and work for you. You need to download Dashboard To Evaluate Actual Vs Budgeted Results Effective And Efficient Tools To Develop Fin SS V for your upcoming presentation. All the presentation templates are 100 percent editable and you can change the color and personalize the content accordingly. Download now This slide shows dashboard which can be used by business organizations or budgeting managers to compare and highlight actual and budgeted performance. It includes KPIs such as revenue, gross margin, EBITDA, etc.
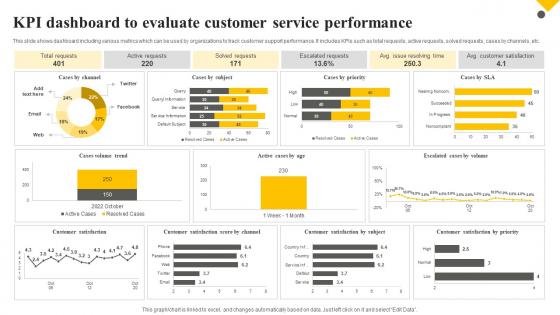
Client Support Plan To Increase Customer Kpi Dashboard To Evaluate Customer Service Performance Strategy SS V
This slide shows dashboard including various metrics which can be used by organizations to track customer support performance. It includes KPIs such as total requests, active requests, solved requests, cases by channels, etc. Find highly impressive Client Support Plan To Increase Customer Kpi Dashboard To Evaluate Customer Service Performance Strategy SS V on Slidegeeks to deliver a meaningful presentation. You can save an ample amount of time using these presentation templates. No need to worry to prepare everything from scratch because Slidegeeks experts have already done a huge research and work for you. You need to download Client Support Plan To Increase Customer Kpi Dashboard To Evaluate Customer Service Performance Strategy SS V for your upcoming presentation. All the presentation templates are 100 percent editable and you can change the color and personalize the content accordingly. Download now This slide shows dashboard including various metrics which can be used by organizations to track customer support performance. It includes KPIs such as total requests, active requests, solved requests, cases by channels, etc.
Dashboard For Tracking Social Media Comprehensive Guide To Wholesale Ppt Sample
This slide showcases social media marketing campaign performance tracking dashboard which helps identify most profitable advertising channel. It provides information regarding KPIs such as impressions, likes, comments, shares, clicks, followers, cost er sessions etc. Formulating a presentation can take up a lot of effort and time, so the content and message should always be the primary focus. The visuals of the PowerPoint can enhance the presenters message, so our Dashboard For Tracking Social Media Comprehensive Guide To Wholesale Ppt Sample was created to help save time. Instead of worrying about the design, the presenter can concentrate on the message while our designers work on creating the ideal templates for whatever situation is needed. Slidegeeks has experts for everything from amazing designs to valuable content, we have put everything into Dashboard For Tracking Social Media Comprehensive Guide To Wholesale Ppt Sample This slide showcases social media marketing campaign performance tracking dashboard which helps identify most profitable advertising channel. It provides information regarding KPIs such as impressions, likes, comments, shares, clicks, followers, cost er sessions etc.
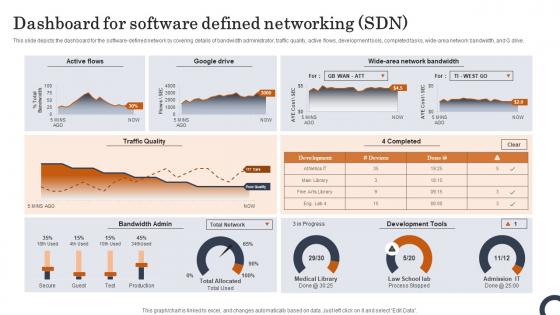
Dashboard For Software Defined Networking SDN Evolution Of SDN Controllers Topics Pdf
This slide depicts the dashboard for the software-defined network by covering details of bandwidth administrator, traffic quality, active flows, development tools, completed tasks, wide-area network bandwidth, and G drive. If you are looking for a format to display your unique thoughts, then the professionally designed Dashboard For Software Defined Networking SDN Evolution Of SDN Controllers Topics Pdf is the one for you. You can use it as a Google Slides template or a PowerPoint template. Incorporate impressive visuals, symbols, images, and other charts. Modify or reorganize the text boxes as you desire. Experiment with shade schemes and font pairings. Alter, share or cooperate with other people on your work. Download Dashboard For Software Defined Networking SDN Evolution Of SDN Controllers Topics Pdf and find out how to give a successful presentation. Present a perfect display to your team and make your presentation unforgettable. This slide depicts the dashboard for the software-defined network by covering details of bandwidth administrator, traffic quality, active flows, development tools, completed tasks, wide-area network bandwidth, and G drive.
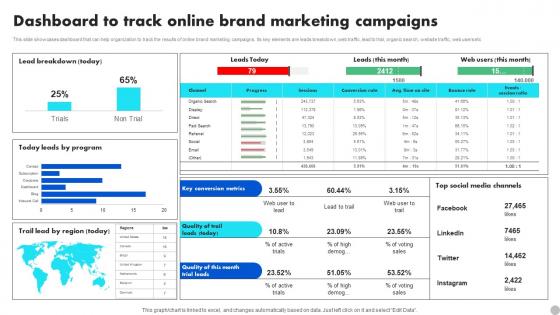
Dashboard To Track Online Brand Marketing Campaigns Brand Diversification Approach Information Pdf
This slide showcases dashboard that can help organization to track the results of online brand marketing campaigns. Its key elements are leads breakdown,web traffic, lead to trial, organic search, website traffic, web users etc. If you are looking for a format to display your unique thoughts, then the professionally designed Dashboard To Track Online Brand Marketing Campaigns Brand Diversification Approach Information Pdf is the one for you. You can use it as a Google Slides template or a PowerPoint template. Incorporate impressive visuals, symbols, images, and other charts. Modify or reorganize the text boxes as you desire. Experiment with shade schemes and font pairings. Alter, share or cooperate with other people on your work. Download Dashboard To Track Online Brand Marketing Campaigns Brand Diversification Approach Information Pdf and find out how to give a successful presentation. Present a perfect display to your team and make your presentation unforgettable. This slide showcases dashboard that can help organization to track the results of online brand marketing campaigns. Its key elements are leads breakdown,web traffic, lead to trial, organic search, website traffic, web users etc.
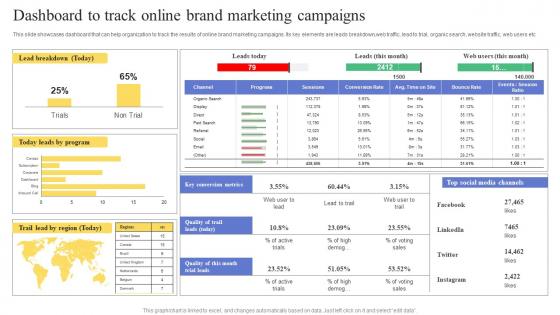
Dashboard To Track Online Brand Marketing Campaigns Maximizing Revenue Using Elements Pdf
This slide showcases dashboard that can help organization to track the results of online brand marketing campaigns. Its key elements are leads breakdown,web traffic, lead to trial, organic search, website traffic, web users etc. If you are looking for a format to display your unique thoughts, then the professionally designed Dashboard To Track Online Brand Marketing Campaigns Maximizing Revenue Using Elements Pdf is the one for you. You can use it as a Google Slides template or a PowerPoint template. Incorporate impressive visuals, symbols, images, and other charts. Modify or reorganize the text boxes as you desire. Experiment with shade schemes and font pairings. Alter, share or cooperate with other people on your work. Download Dashboard To Track Online Brand Marketing Campaigns Maximizing Revenue Using Elements Pdf and find out how to give a successful presentation. Present a perfect display to your team and make your presentation unforgettable. This slide showcases dashboard that can help organization to track the results of online brand marketing campaigns. Its key elements are leads breakdown,web traffic, lead to trial, organic search, website traffic, web users etc.
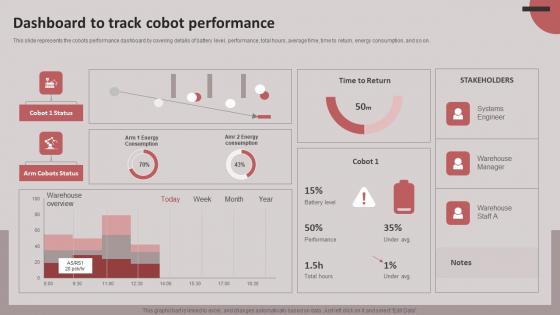
Dashboard To Track Cobot Performance Cobots For Improved Productivity Formats PDF
This slide represents the cobots performance dashboard by covering details of battery level, performance, total hours, average time, time to return, energy consumption, and so on. If you are looking for a format to display your unique thoughts, then the professionally designed Dashboard To Track Cobot Performance Cobots For Improved Productivity Formats PDF is the one for you. You can use it as a Google Slides template or a PowerPoint template. Incorporate impressive visuals, symbols, images, and other charts. Modify or reorganize the text boxes as you desire. Experiment with shade schemes and font pairings. Alter, share or cooperate with other people on your work. Download Dashboard To Track Cobot Performance Cobots For Improved Productivity Formats PDF and find out how to give a successful presentation. Present a perfect display to your team and make your presentation unforgettable. This slide represents the cobots performance dashboard by covering details of battery level, performance, total hours, average time, time to return, energy consumption, and so on.
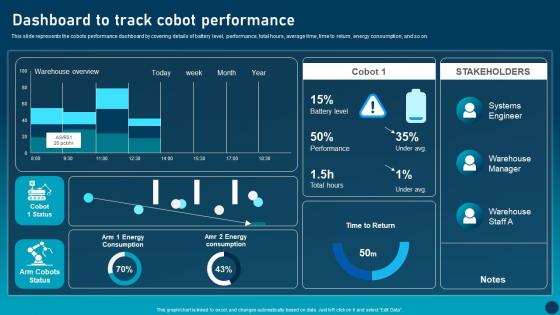
Dashboard To Track Cobot Transforming Industries With Collaborative Robotics Background Pdf
This slide represents the cobots performance dashboard by covering details of battery level, performance, total hours, average time, time to return, energy consumption, and so on. If you are looking for a format to display your unique thoughts, then the professionally designed Dashboard To Track Cobot Transforming Industries With Collaborative Robotics Background Pdf is the one for you. You can use it as a Google Slides template or a PowerPoint template. Incorporate impressive visuals, symbols, images, and other charts. Modify or reorganize the text boxes as you desire. Experiment with shade schemes and font pairings. Alter, share or cooperate with other people on your work. Download Dashboard To Track Cobot Transforming Industries With Collaborative Robotics Background Pdf and find out how to give a successful presentation. Present a perfect display to your team and make your presentation unforgettable. This slide represents the cobots performance dashboard by covering details of battery level, performance, total hours, average time, time to return, energy consumption, and so on.
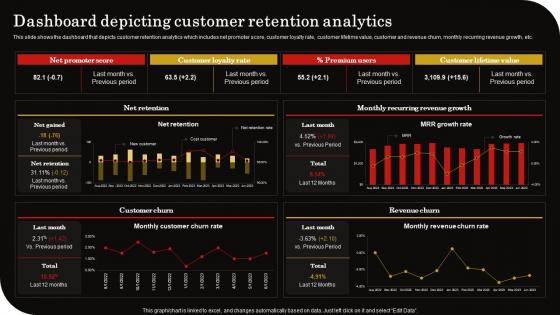
Dashboard Depicting Customer Retention Client Retention Strategy To Reduce Churn Rate Professional Pdf
This slide shows the dashboard that depicts customer retention analytics which includes net promoter score, customer loyalty rate, customer lifetime value, customer and revenue churn, monthly recurring revenue growth, etc. If you are looking for a format to display your unique thoughts, then the professionally designed Dashboard Depicting Customer Retention Client Retention Strategy To Reduce Churn Rate Professional Pdf is the one for you. You can use it as a Google Slides template or a PowerPoint template. Incorporate impressive visuals, symbols, images, and other charts. Modify or reorganize the text boxes as you desire. Experiment with shade schemes and font pairings. Alter, share or cooperate with other people on your work. Download Dashboard Depicting Customer Retention Client Retention Strategy To Reduce Churn Rate Professional Pdf and find out how to give a successful presentation. Present a perfect display to your team and make your presentation unforgettable. This slide shows the dashboard that depicts customer retention analytics which includes net promoter score, customer loyalty rate, customer lifetime value, customer and revenue churn, monthly recurring revenue growth, etc.
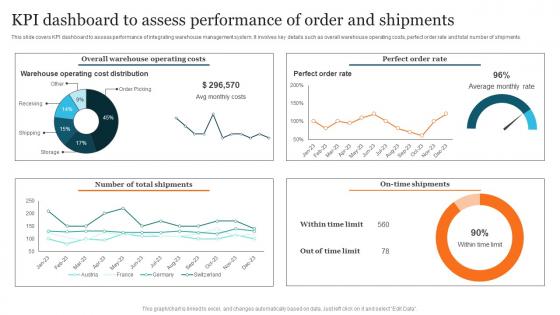
KPI Dashboard Assess Performance Advanced Supply Chain Improvement Strategies Brochure Pdf
This slide covers KPI dashboard to assess performance of integrating warehouse management system. It involves key details such as overall warehouse operating costs, perfect order rate and total number of shipments. If you are looking for a format to display your unique thoughts, then the professionally designed KPI Dashboard Assess Performance Advanced Supply Chain Improvement Strategies Brochure Pdf is the one for you. You can use it as a Google Slides template or a PowerPoint template. Incorporate impressive visuals, symbols, images, and other charts. Modify or reorganize the text boxes as you desire. Experiment with shade schemes and font pairings. Alter, share or cooperate with other people on your work. Download KPI Dashboard Assess Performance Advanced Supply Chain Improvement Strategies Brochure Pdf and find out how to give a successful presentation. Present a perfect display to your team and make your presentation unforgettable. This slide covers KPI dashboard to assess performance of integrating warehouse management system. It involves key details such as overall warehouse operating costs, perfect order rate and total number of shipments.
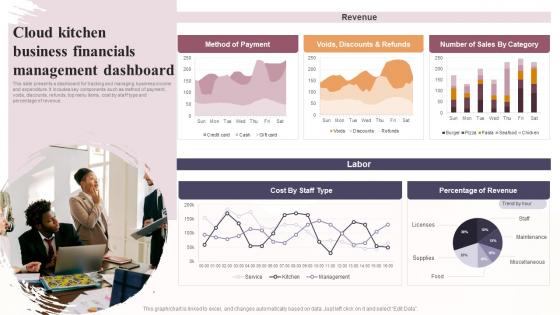
Cloud Kitchen Business Financials Management Dashboard Global Virtual Restaurant Mockup Pdf
This slide presents a dashboard for tracking and managing business income and expenditure. It includes key components such as method of payment, voids, discounts, refunds, top menu items, cost by staff type and percentage of revenue. If you are looking for a format to display your unique thoughts, then the professionally designed Cloud Kitchen Business Financials Management Dashboard Global Virtual Restaurant Mockup Pdf is the one for you. You can use it as a Google Slides template or a PowerPoint template. Incorporate impressive visuals, symbols, images, and other charts. Modify or reorganize the text boxes as you desire. Experiment with shade schemes and font pairings. Alter, share or cooperate with other people on your work. Download Cloud Kitchen Business Financials Management Dashboard Global Virtual Restaurant Mockup Pdf and find out how to give a successful presentation. Present a perfect display to your team and make your presentation unforgettable. This slide presents a dashboard for tracking and managing business income and expenditure. It includes key components such as method of payment, voids, discounts, refunds, top menu items, cost by staff type and percentage of revenue.
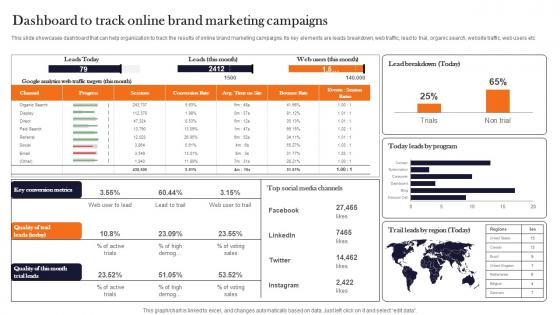
Dashboard To Track Online Brand Marketing Product Advertising And Positioning Graphics Pdf
This slide showcases dashboard that can help organization to track the results of online brand marketing campaigns. Its key elements are leads breakdown, web traffic, lead to trial, organic search, website traffic, web users etc. If you are looking for a format to display your unique thoughts, then the professionally designed Dashboard To Track Online Brand Marketing Product Advertising And Positioning Graphics Pdf is the one for you. You can use it as a Google Slides template or a PowerPoint template. Incorporate impressive visuals, symbols, images, and other charts. Modify or reorganize the text boxes as you desire. Experiment with shade schemes and font pairings. Alter, share or cooperate with other people on your work. Download Dashboard To Track Online Brand Marketing Product Advertising And Positioning Graphics Pdf and find out how to give a successful presentation. Present a perfect display to your team and make your presentation unforgettable. This slide showcases dashboard that can help organization to track the results of online brand marketing campaigns. Its key elements are leads breakdown, web traffic, lead to trial, organic search, website traffic, web users etc.
Facebook Marketing Plan Dashboard For Tracking Facebook Post Performance Strategy SS V
Facebook Marketing Techniques Dashboard For Tracking Facebook Post Strategy SS V
The following slide outlines dashboard through which advertisers can manage Facebook post performance and optimize their marketing strategy. Information covered in this slide is related to key metrics such as impressions per post, engagement rate, click-through rate CTR , likes, etc. If you are looking for a format to display your unique thoughts, then the professionally designed Facebook Marketing Techniques Dashboard For Tracking Facebook Post Strategy SS V is the one for you. You can use it as a Google Slides template or a PowerPoint template. Incorporate impressive visuals, symbols, images, and other charts. Modify or reorganize the text boxes as you desire. Experiment with shade schemes and font pairings. Alter, share or cooperate with other people on your work. Download Facebook Marketing Techniques Dashboard For Tracking Facebook Post Strategy SS V and find out how to give a successful presentation. Present a perfect display to your team and make your presentation unforgettable. The following slide outlines dashboard through which advertisers can manage Facebook post performance and optimize their marketing strategy. Information covered in this slide is related to key metrics such as impressions per post, engagement rate, click-through rate CTR , likes, etc.
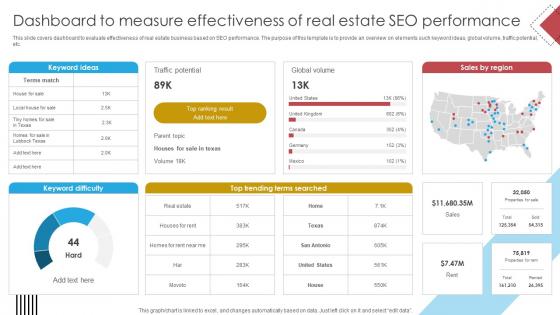
Blueprint For Effective Real Dashboard To Measure Effectiveness Of Real Estate Strategy SS V
This slide covers dashboard to evaluate effectiveness of real estate business based on SEO performance. The purpose of this template is to provide an overview on elements such keyword ideas, global volume, traffic potential, etc. If you are looking for a format to display your unique thoughts, then the professionally designed Blueprint For Effective Real Dashboard To Measure Effectiveness Of Real Estate Strategy SS V is the one for you. You can use it as a Google Slides template or a PowerPoint template. Incorporate impressive visuals, symbols, images, and other charts. Modify or reorganize the text boxes as you desire. Experiment with shade schemes and font pairings. Alter, share or cooperate with other people on your work. Download Blueprint For Effective Real Dashboard To Measure Effectiveness Of Real Estate Strategy SS V and find out how to give a successful presentation. Present a perfect display to your team and make your presentation unforgettable. This slide covers dashboard to evaluate effectiveness of real estate business based on SEO performance. The purpose of this template is to provide an overview on elements such keyword ideas, global volume, traffic potential, etc.
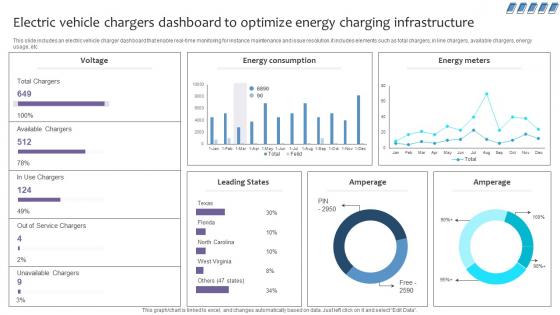
Empowering The Future Electric Vehicle Chargers Dashboard To Optimize Energy IoT SS V
This slide includes an electric vehicle charger dashboard that enable real-time monitoring for instance maintenance and issue resolution.it includes elements such as total chargers, in line chargers, available chargers, energy usage, etc. If you are looking for a format to display your unique thoughts, then the professionally designed Empowering The Future Electric Vehicle Chargers Dashboard To Optimize Energy IoT SS V is the one for you. You can use it as a Google Slides template or a PowerPoint template. Incorporate impressive visuals, symbols, images, and other charts. Modify or reorganize the text boxes as you desire. Experiment with shade schemes and font pairings. Alter, share or cooperate with other people on your work. Download Empowering The Future Electric Vehicle Chargers Dashboard To Optimize Energy IoT SS V and find out how to give a successful presentation. Present a perfect display to your team and make your presentation unforgettable. This slide includes an electric vehicle charger dashboard that enable real-time monitoring for instance maintenance and issue resolution.it includes elements such as total chargers, in line chargers, available chargers, energy usage, etc.

Dashboard Analytics Measuring Supply Chain Efficiency Optimizing Retail Operations With Digital DT SS V
This slide represents a supply chain management dashboard measuring the efficiency of supply chain operations after effective digital transformation of retail operations. It includes inventory to sales, inventory turnover, carrying cost of inventory, inventory accuracy, and percentage out of stock items.If you are looking for a format to display your unique thoughts, then the professionally designed Dashboard Analytics Measuring Supply Chain Efficiency Optimizing Retail Operations With Digital DT SS V is the one for you. You can use it as a Google Slides template or a PowerPoint template. Incorporate impressive visuals, symbols, images, and other charts. Modify or reorganize the text boxes as you desire. Experiment with shade schemes and font pairings. Alter, share or cooperate with other people on your work. Download Dashboard Analytics Measuring Supply Chain Efficiency Optimizing Retail Operations With Digital DT SS V and find out how to give a successful presentation. Present a perfect display to your team and make your presentation unforgettable. This slide represents a supply chain management dashboard measuring the efficiency of supply chain operations after effective digital transformation of retail operations. It includes inventory to sales, inventory turnover, carrying cost of inventory, inventory accuracy, and percentage out of stock items.
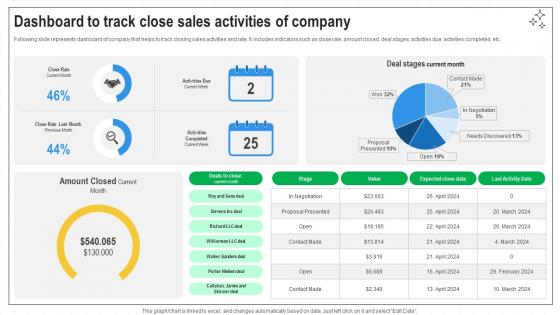
Closing Techniques To Seal Dashboard To Track Close Sales Activities Of Company SA SS V
Following slide represents dashboard of company that helps to track closing sales activities and rate. It includes indicators such as close rate, amount closed, deal stages, activities due, activities completed, etc. If you are looking for a format to display your unique thoughts, then the professionally designed Closing Techniques To Seal Dashboard To Track Close Sales Activities Of Company SA SS V is the one for you. You can use it as a Google Slides template or a PowerPoint template. Incorporate impressive visuals, symbols, images, and other charts. Modify or reorganize the text boxes as you desire. Experiment with shade schemes and font pairings. Alter, share or cooperate with other people on your work. Download Closing Techniques To Seal Dashboard To Track Close Sales Activities Of Company SA SS V and find out how to give a successful presentation. Present a perfect display to your team and make your presentation unforgettable. Following slide represents dashboard of company that helps to track closing sales activities and rate. It includes indicators such as close rate, amount closed, deal stages, activities due, activities completed, etc.
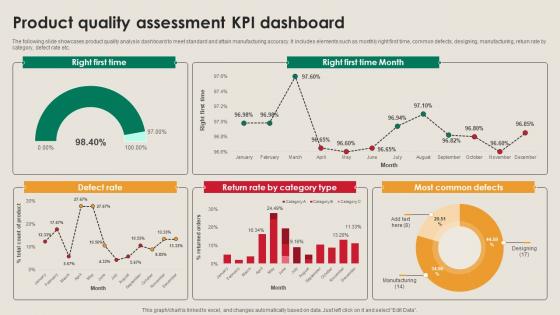
Product Quality Assessment KPI Dashboard Manufacturing Strategy Driving Industry 4 0
The following slide showcases product quality analysis dashboard to meet standard and attain manufacturing accuracy. It includes elements such as monthly right first time, common defects, designing, manufacturing, return rate by category, defect rate etc. If you are looking for a format to display your unique thoughts, then the professionally designed Product Quality Assessment KPI Dashboard Manufacturing Strategy Driving Industry 4 0 is the one for you. You can use it as a Google Slides template or a PowerPoint template. Incorporate impressive visuals, symbols, images, and other charts. Modify or reorganize the text boxes as you desire. Experiment with shade schemes and font pairings. Alter, share or cooperate with other people on your work. Download Product Quality Assessment KPI Dashboard Manufacturing Strategy Driving Industry 4 0 and find out how to give a successful presentation. Present a perfect display to your team and make your presentation unforgettable. The following slide showcases product quality analysis dashboard to meet standard and attain manufacturing accuracy. It includes elements such as monthly right first time, common defects, designing, manufacturing, return rate by category, defect rate etc.
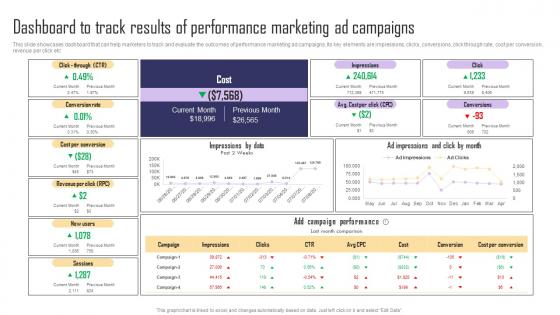
Dashboard To Track Results Of Performance Marketing Paid Internet Marketing Strategy Information Pdf
This slide showcases dashboard that can help marketers to track and evaluate the outcomes of performance marketing ad campaigns. Its key elements are impressions, clicks, conversions, click through rate, cost per conversion, revenue per click etc. Do you have an important presentation coming up Are you looking for something that will make your presentation stand out from the rest Look no further than Dashboard To Track Results Of Performance Marketing Paid Internet Marketing Strategy Information Pdf. With our professional designs, you can trust that your presentation will pop and make delivering it a smooth process. And with Slidegeeks, you can trust that your presentation will be unique and memorable. So why wait Grab Dashboard To Track Results Of Performance Marketing Paid Internet Marketing Strategy Information Pdf today and make your presentation stand out from the rest. This slide showcases dashboard that can help marketers to track and evaluate the outcomes of performance marketing ad campaigns. Its key elements are impressions, clicks, conversions, click through rate, cost per conversion, revenue per click etc.
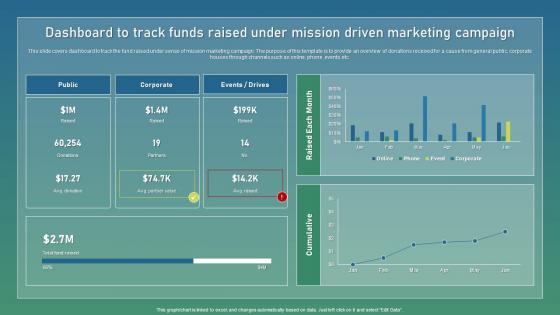
Dashboard To Track Funds Raised Strategic Guide For Sustainable Inspiration Pdf
This slide covers dashboard to track the fund raised under sense of mission marketing campaign. The purpose of this template is to provide an overview of donations received for a cause from general public, corporate houses through channels such as online, phone, events,etc. Find highly impressive Dashboard To Track Funds Raised Strategic Guide For Sustainable Inspiration Pdf on Slidegeeks to deliver a meaningful presentation. You can save an ample amount of time using these presentation templates. No need to worry to prepare everything from scratch because Slidegeeks experts have already done a huge research and work for you. You need to download Dashboard To Track Funds Raised Strategic Guide For Sustainable Inspiration Pdf for your upcoming presentation. All the presentation templates are 100 percent editable and you can change the color and personalize the content accordingly. Download now. This slide covers dashboard to track the fund raised under sense of mission marketing campaign. The purpose of this template is to provide an overview of donations received for a cause from general public, corporate houses through channels such as online, phone, events,etc.
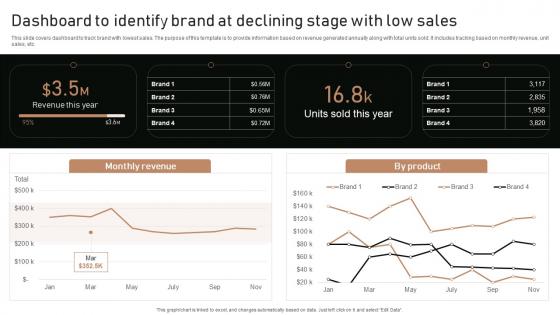
Execution Of Product Lifecycle Dashboard To Identify Brand At Declining Stage Ideas Pdf
This slide covers dashboard to track brand with lowest sales. The purpose of this template is to provide information based on revenue generated annually along with total units sold. It includes tracking based on monthly revenue, unit sales, etc. Get a simple yet stunning designed Execution Of Product Lifecycle Dashboard To Identify Brand At Declining Stage Ideas Pdf. It is the best one to establish the tone in your meetings. It is an excellent way to make your presentations highly effective. So, download this PPT today from Slidegeeks and see the positive impacts. Our easy-to-edit Execution Of Product Lifecycle Dashboard To Identify Brand At Declining Stage Ideas Pdf can be your go-to option for all upcoming conferences and meetings. So, what are you waiting for Grab this template today. This slide covers dashboard to track brand with lowest sales. The purpose of this template is to provide information based on revenue generated annually along with total units sold. It includes tracking based on monthly revenue, unit sales, etc.
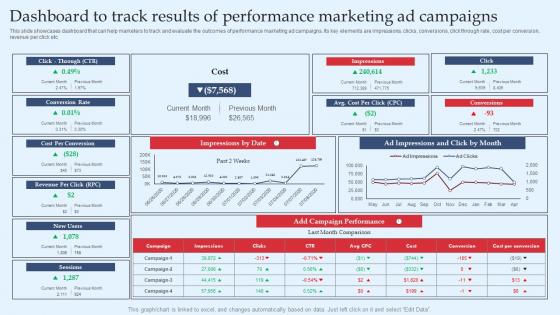
Strategic Performance Marketing Campaign Dashboard To Track Results Of Performance Inspiration Pdf
This slide showcases dashboard that can help marketers to track and evaluate the outcomes of performance marketing ad campaigns. Its key elements are impressions, clicks, conversions, click through rate, cost per conversion, revenue per click etc. Crafting an eye-catching presentation has never been more straightforward. Let your presentation shine with this tasteful yet straightforward Strategic Performance Marketing Campaign Dashboard To Track Results Of Performance Inspiration Pdf template. It offers a minimalistic and classy look that is great for making a statement. The colors have been employed intelligently to add a bit of playfulness while still remaining professional. Construct the ideal Strategic Performance Marketing Campaign Dashboard To Track Results Of Performance Inspiration Pdf that effortlessly grabs the attention of your audience. Begin now and be certain to wow your customers. This slide showcases dashboard that can help marketers to track and evaluate the outcomes of performance marketing ad campaigns. Its key elements are impressions, clicks, conversions, click through rate, cost per conversion, revenue per click etc.
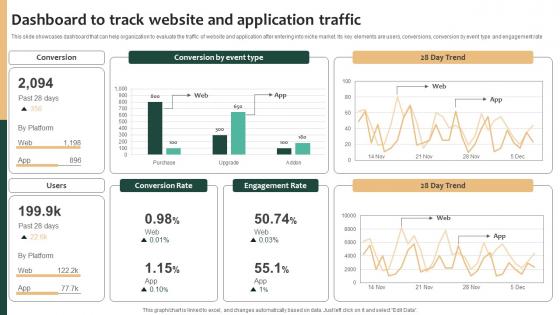
Tailored Product Approach Dashboard To Track Website And Application Traffic Structure Pdf
This slide showcases dashboard that can help organization to evaluate the traffic of website and application after entering into niche market. Its key elements are users, conversions, conversion by event type and engagement rate. Do you have to make sure that everyone on your team knows about any specific topic I yes, then you should give Tailored Product Approach Dashboard To Track Website And Application Traffic Structure Pdf a try. Our experts have put a lot of knowledge and effort into creating this impeccable Tailored Product Approach Dashboard To Track Website And Application Traffic Structure Pdf You can use this template for your upcoming presentations, as the slides are perfect to represent even the tiniest detail. You can download these templates from the Slidegeeks website and these are easy to edit. So grab these today This slide showcases dashboard that can help organization to evaluate the traffic of website and application after entering into niche market. Its key elements are users, conversions, conversion by event type and engagement rate
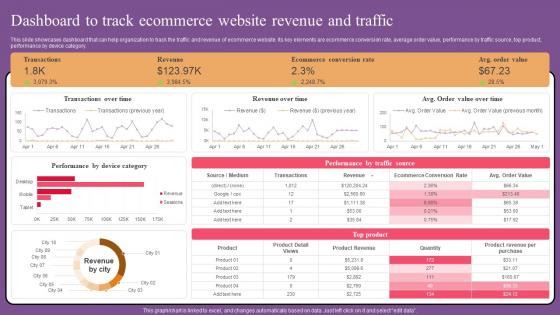
Dashboard Track Ecommerce Website Optimization To Improve Product Sale Professional Pdf
This slide showcases dashboard that can help organization to track the traffic and revenue of ecommerce website. Its key elements are ecommerce conversion rate, average order value, performance by traffic source, top product, performance by device category. Find highly impressive Dashboard Track Ecommerce Website Optimization To Improve Product Sale Professional Pdf on Slidegeeks to deliver a meaningful presentation. You can save an ample amount of time using these presentation templates. No need to worry to prepare everything from scratch because Slidegeeks experts have already done a huge research and work for you. You need to download Dashboard Track Ecommerce Website Optimization To Improve Product Sale Professional Pdf for your upcoming presentation. All the presentation templates are 100 percent editable and you can change the color and personalize the content accordingly. Download now This slide showcases dashboard that can help organization to track the traffic and revenue of ecommerce website. Its key elements are ecommerce conversion rate, average order value, performance by traffic source, top product, performance by device category.
Dashboard For Tracking Ambassador Techniques For Generating Brand Awareness Graphics Pdf
This slide covers the KPI dashboard for companies to evaluate the performance of ambassador marketing campaigns. It includes metrics such as the number of brand ambassadors, the total number of shares, clicks, CPS, revenue, commissions, etc. Do you have an important presentation coming up Are you looking for something that will make your presentation stand out from the rest Look no further than Dashboard For Tracking Ambassador Techniques For Generating Brand Awareness Graphics Pdf. With our professional designs, you can trust that your presentation will pop and make delivering it a smooth process. And with Slidegeeks, you can trust that your presentation will be unique and memorable. So why wait Grab Dashboard For Tracking Ambassador Techniques For Generating Brand Awareness Graphics Pdf today and make your presentation stand out from the rest This slide covers the KPI dashboard for companies to evaluate the performance of ambassador marketing campaigns. It includes metrics such as the number of brand ambassadors, the total number of shares, clicks, CPS, revenue, commissions, etc.
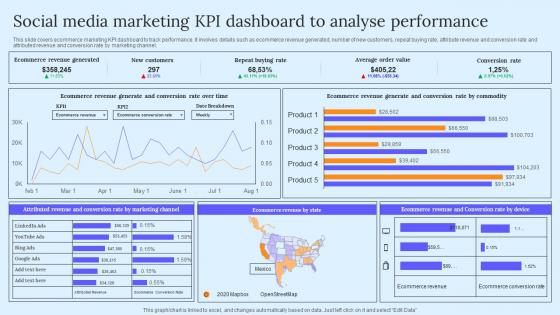
Social Media Marketing KPI Dashboard B2B Marketing Techniques To Attract Potential Pictures Pdf
This slide covers ecommerce marketing KPI dashboard to track performance. It involves details such as ecommerce revenue generated, number of new customers, repeat buying rate, attribute revenue and conversion rate and attributed revenue and conversion rate by marketing channel. Do you have an important presentation coming up Are you looking for something that will make your presentation stand out from the rest Look no further than Social Media Marketing KPI Dashboard B2B Marketing Techniques To Attract Potential Pictures Pdf. With our professional designs, you can trust that your presentation will pop and make delivering it a smooth process. And with Slidegeeks, you can trust that your presentation will be unique and memorable. So why wait Grab Social Media Marketing KPI Dashboard B2B Marketing Techniques To Attract Potential Pictures Pdf today and make your presentation stand out from the rest This slide covers ecommerce marketing KPI dashboard to track performance. It involves details such as ecommerce revenue generated, number of new customers, repeat buying rate, attribute revenue and conversion rate and attributed revenue and conversion rate by marketing channel.
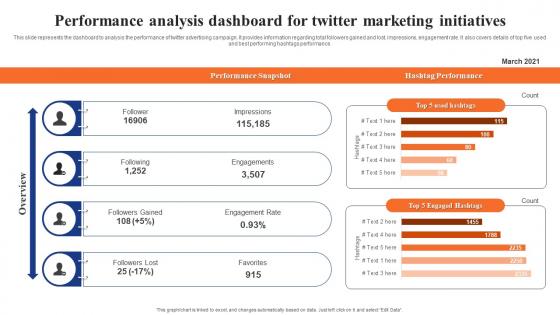
Digital Advertising Using Twitter Performance Analysis Dashboard For Twitter Marketing Topics Pdf
This slide represents the dashboard to analysis the performance of twitter advertising campaign. It provides information regarding total followers gained and lost, impressions, engagement rate. It also covers details of top five used and best performing hashtags performance. Crafting an eye catching presentation has never been more straightforward. Let your presentation shine with this tasteful yet straightforward Digital Advertising Using Twitter Performance Analysis Dashboard For Twitter Marketing Topics Pdf template. It offers a minimalistic and classy look that is great for making a statement. The colors have been employed intelligently to add a bit of playfulness while still remaining professional. Construct the ideal Digital Advertising Using Twitter Performance Analysis Dashboard For Twitter Marketing Topics Pdf that effortlessly grabs the attention of your audience Begin now and be certain to wow your customers This slide represents the dashboard to analysis the performance of twitter advertising campaign. It provides information regarding total followers gained and lost, impressions, engagement rate. It also covers details of top five used and best performing hashtags performance.
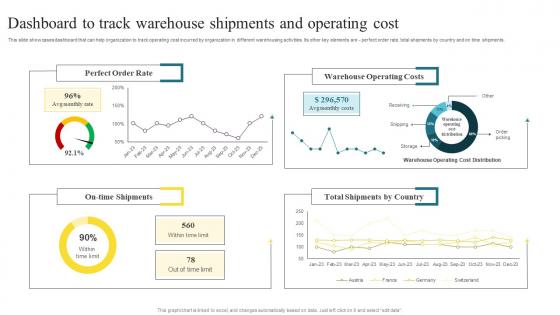
Dashboard To Track Warehouse Methods To Enhance Warehouse Space Utilization Topics Pdf
This slide showcases dashboard that can help organization to track operating cost incurred by organization in different warehousing activities. Its other key elements are perfect order rate, total shipments by country and on time shipments. Do you have to make sure that everyone on your team knows about any specific topic I yes, then you should give Dashboard To Track Warehouse Methods To Enhance Warehouse Space Utilization Topics Pdf a try. Our experts have put a lot of knowledge and effort into creating this impeccable Dashboard To Track Warehouse Methods To Enhance Warehouse Space Utilization Topics Pdf. You can use this template for your upcoming presentations, as the slides are perfect to represent even the tiniest detail. You can download these templates from the Slidegeeks website and these are easy to edit. So grab these today. This slide showcases dashboard that can help organization to track operating cost incurred by organization in different warehousing activities. Its other key elements are - perfect order rate, total shipments by country and on time shipments.
Dashboard For Tracking Ambassador Marketing Tracking Word Mouth Marketing Summary PDF
This slide covers the KPI dashboard for companies to evaluate the performance of ambassador marketing campaigns. It includes metrics such as the number of brand ambassadors, the total number of shares, clicks, CPS, revenue, commissions, etc. Do you have an important presentation coming up Are you looking for something that will make your presentation stand out from the rest Look no further than Dashboard For Tracking Ambassador Marketing Tracking Word Mouth Marketing Summary PDF. With our professional designs, you can trust that your presentation will pop and make delivering it a smooth process. And with Slidegeeks, you can trust that your presentation will be unique and memorable. So why wait Grab Dashboard For Tracking Ambassador Marketing Tracking Word Mouth Marketing Summary PDF today and make your presentation stand out from the rest This slide covers the KPI dashboard for companies to evaluate the performance of ambassador marketing campaigns. It includes metrics such as the number of brand ambassadors, the total number of shares, clicks, CPS, revenue, commissions, etc.
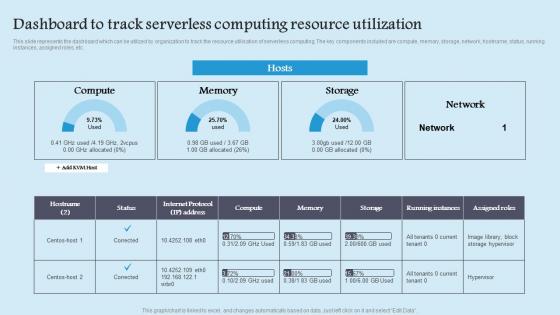
Dashboard To Track Serverless Role Serverless Computing Modern Technology Download Pdf
This slide represents the dashboard which can be utilized by organization to track the resource utilisation of serverless computing. The key components included are compute, memory, storage, network, hostname, status, running instances, assigned roles, etc. Here you can discover an assortment of the finest PowerPoint and Google Slides templates. With these templates, you can create presentations for a variety of purposes while simultaneously providing your audience with an eye catching visual experience. Download Dashboard To Track Serverless Role Serverless Computing Modern Technology Download Pdf to deliver an impeccable presentation. These templates will make your job of preparing presentations much quicker, yet still, maintain a high level of quality. Slidegeeks has experienced researchers who prepare these templates and write high quality content for you. Later on, you can personalize the content by editing the Dashboard To Track Serverless Role Serverless Computing Modern Technology Download Pdf. This slide represents the dashboard which can be utilized by organization to track the resource utilisation of serverless computing. The key components included are compute, memory, storage, network, hostname, status, running instances, assigned roles, etc.
Managing It Services Spending Tracking Dashboard Technological Innovation Playbook Designs Pdf
This slide provides information regarding the management of the digital services performance and IT spending tracking dashboard in terms of ROI, spend vs. budget, IT costs software, hardware, personnel and goals, IT spending in terms of revenues, etc. Do you have an important presentation coming up Are you looking for something that will make your presentation stand out from the rest Look no further than Managing It Services Spending Tracking Dashboard Technological Innovation Playbook Designs Pdf. With our professional designs, you can trust that your presentation will pop and make delivering it a smooth process. And with Slidegeeks, you can trust that your presentation will be unique and memorable. So why wait Grab Managing It Services Spending Tracking Dashboard Technological Innovation Playbook Designs Pdf today and make your presentation stand out from the rest This slide provides information regarding the management of the digital services performance and IT spending tracking dashboard in terms of ROI, spend vs. budget, IT costs software, hardware, personnel and goals, IT spending in terms of revenues, etc.
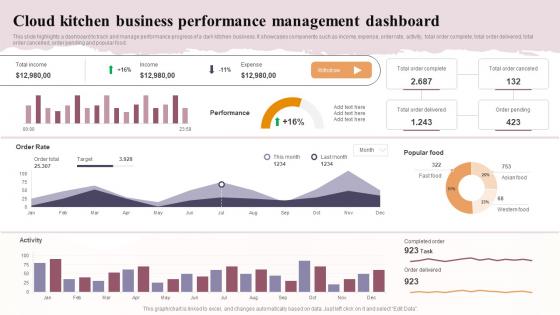
Cloud Kitchen Business Performance Management Dashboard Global Virtual Restaurant Structure Pdf
This slide highlights a dashboard to track and manage performance progress of a dark kitchen business. It showcases components such as income, expense, order rate, activity, total order complete, total order delivered, total order cancelled, order pending and popular food. Crafting an eye-catching presentation has never been more straightforward. Let your presentation shine with this tasteful yet straightforward Cloud Kitchen Business Performance Management Dashboard Global Virtual Restaurant Structure Pdf template. It offers a minimalistic and classy look that is great for making a statement. The colors have been employed intelligently to add a bit of playfulness while still remaining professional. Construct the ideal Cloud Kitchen Business Performance Management Dashboard Global Virtual Restaurant Structure Pdf that effortlessly grabs the attention of your audience. Begin now and be certain to wow your customers. This slide highlights a dashboard to track and manage performance progress of a dark kitchen business. It showcases components such as income, expense, order rate, activity, total order complete, total order delivered, total order cancelled, order pending and popular food.
Dashboard Tracking Ambassador Implementing Social Media Tactics For Boosting WOM Demonstration Pdf
This slide covers the KPI dashboard for companies to evaluate the performance of ambassador marketing campaigns. It includes metrics such as the number of brand ambassadors, the total number of shares, clicks, CPS, revenue, commissions, etc.Find highly impressive Dashboard Tracking Ambassador Implementing Social Media Tactics For Boosting WOM Demonstration Pdf on Slidegeeks to deliver a meaningful presentation. You can save an ample amount of time using these presentation templates. No need to worry to prepare everything from scratch because Slidegeeks experts have already done a huge research and work for you. You need to download Dashboard Tracking Ambassador Implementing Social Media Tactics For Boosting WOM Demonstration Pdf for your upcoming presentation. All the presentation templates are 100 percent editable and you can change the color and personalize the content accordingly. Download now This slide covers the KPI dashboard for companies to evaluate the performance of ambassador marketing campaigns. It includes metrics such as the number of brand ambassadors, the total number of shares, clicks, CPS, revenue, commissions, etc.

Power Management Dashboard With Energy Consumption AIOT Applications For Various Industries IoT SS V
The purpose of this slide is to showcase power management dashboard which covers various metrics. The metrics mentioned in slide are average power by device, energy consumption, voltage and frequency by various devices, etc. Do you have to make sure that everyone on your team knows about any specific topic I yes, then you should give Power Management Dashboard With Energy Consumption AIOT Applications For Various Industries IoT SS V a try. Our experts have put a lot of knowledge and effort into creating this impeccable Power Management Dashboard With Energy Consumption AIOT Applications For Various Industries IoT SS V. You can use this template for your upcoming presentations, as the slides are perfect to represent even the tiniest detail. You can download these templates from the Slidegeeks website and these are easy to edit. So grab these today The purpose of this slide is to showcase power management dashboard which covers various metrics. The metrics mentioned in slide are average power by device, energy consumption, voltage and frequency by various devices, etc.
How To Create Cost Effective Dashboard For Tracking Facebook Post Strategy SS V
The following slide outlines dashboard through which advertisers can manage Facebook post performance and optimize their marketing strategy. Information covered in this slide is related to key metrics such as impressions per post, engagement rate, click-through rate CTR, likes, etc. Do you have an important presentation coming up Are you looking for something that will make your presentation stand out from the rest Look no further than How To Create Cost Effective Dashboard For Tracking Facebook Post Strategy SS V. With our professional designs, you can trust that your presentation will pop and make delivering it a smooth process. And with Slidegeeks, you can trust that your presentation will be unique and memorable. So why wait Grab How To Create Cost Effective Dashboard For Tracking Facebook Post Strategy SS V today and make your presentation stand out from the rest The following slide outlines dashboard through which advertisers can manage Facebook post performance and optimize their marketing strategy. Information covered in this slide is related to key metrics such as impressions per post, engagement rate, click-through rate CTR, likes, etc.
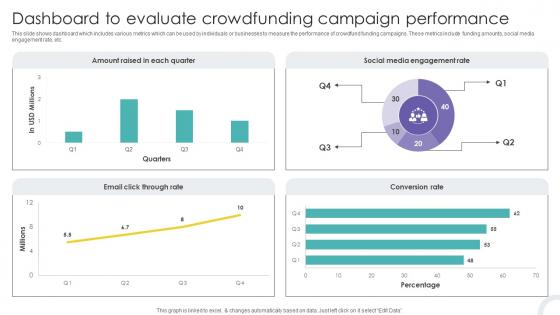
Dashboard To Evaluate Crowdfunding Campaign Crowdfunding Strategies To Raise Funds Fin SS V
This slide shows dashboard which includes various metrics which can be used by individuals or businesses to measure the performance of crowdfund funding campaigns. These metrics include funding amounts, social media engagement rate, etc. Find highly impressive Dashboard To Evaluate Crowdfunding Campaign Crowdfunding Strategies To Raise Funds Fin SS V on Slidegeeks to deliver a meaningful presentation. You can save an ample amount of time using these presentation templates. No need to worry to prepare everything from scratch because Slidegeeks experts have already done a huge research and work for you. You need to download Dashboard To Evaluate Crowdfunding Campaign Crowdfunding Strategies To Raise Funds Fin SS V for your upcoming presentation. All the presentation templates are 100 percent editable and you can change the color and personalize the content accordingly. Download now This slide shows dashboard which includes various metrics which can be used by individuals or businesses to measure the performance of crowdfund funding campaigns. These metrics include funding amounts, social media engagement rate, etc.
Cyber Phishing Attacks Tracking Dashboard Man In The Middle Phishing IT
This slide represents the dashboard to track cyber phishing attacks. The purpose of this slide is to provide a graphical representation of cyber attacks occurred in a specific time span. It also depicts the organizations health risk. Formulating a presentation can take up a lot of effort and time, so the content and message should always be the primary focus. The visuals of the PowerPoint can enhance the presenters message, so our Cyber Phishing Attacks Tracking Dashboard Man In The Middle Phishing IT was created to help save time. Instead of worrying about the design, the presenter can concentrate on the message while our designers work on creating the ideal templates for whatever situation is needed. Slidegeeks has experts for everything from amazing designs to valuable content, we have put everything into Cyber Phishing Attacks Tracking Dashboard Man In The Middle Phishing IT This slide represents the dashboard to track cyber phishing attacks. The purpose of this slide is to provide a graphical representation of cyber attacks occurred in a specific time span. It also depicts the organizations health risk.
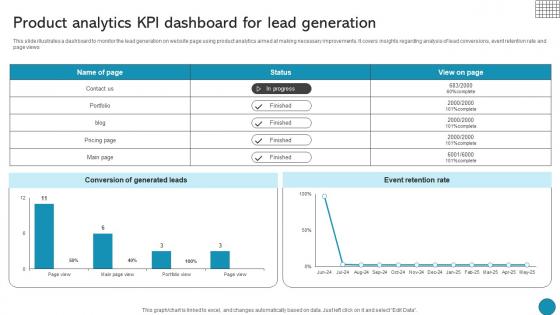
Product Analytics Kpi Dashboard For Lead Generation Driving Business Success Integrating Product
This slide illustrates a dashboard to monitor the lead generation on website page using product analytics aimed at making necessary improvements. It covers insights regarding analysis of lead conversions, event retention rate and page views Do you have to make sure that everyone on your team knows about any specific topic I yes, then you should give Product Analytics Kpi Dashboard For Lead Generation Driving Business Success Integrating Product a try. Our experts have put a lot of knowledge and effort into creating this impeccable Product Analytics Kpi Dashboard For Lead Generation Driving Business Success Integrating Product. You can use this template for your upcoming presentations, as the slides are perfect to represent even the tiniest detail. You can download these templates from the Slidegeeks website and these are easy to edit. So grab these today This slide illustrates a dashboard to monitor the lead generation on website page using product analytics aimed at making necessary improvements. It covers insights regarding analysis of lead conversions, event retention rate and page views
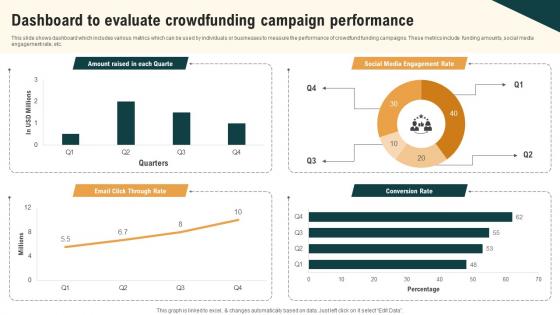
Dashboard To Evaluate Crowdfunding Campaign Real Estate Crowdfunding To Unlock Fin SS V
This slide shows dashboard which includes various metrics which can be used by individuals or businesses to measure the performance of crowdfund funding campaigns. These metrics include funding amounts, social media engagement rate, etc. Find highly impressive Dashboard To Evaluate Crowdfunding Campaign Real Estate Crowdfunding To Unlock Fin SS V on Slidegeeks to deliver a meaningful presentation. You can save an ample amount of time using these presentation templates. No need to worry to prepare everything from scratch because Slidegeeks experts have already done a huge research and work for you. You need to download Dashboard To Evaluate Crowdfunding Campaign Real Estate Crowdfunding To Unlock Fin SS V for your upcoming presentation. All the presentation templates are 100 percent editable and you can change the color and personalize the content accordingly. Download now This slide shows dashboard which includes various metrics which can be used by individuals or businesses to measure the performance of crowdfund funding campaigns. These metrics include funding amounts, social media engagement rate, etc.
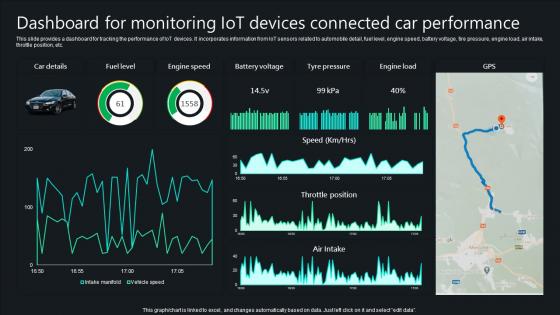
Unlocking Potential IoTs Application Dashboard For Monitoring IoT Devices Connected Car IoT SS V
This slide provides a dashboard for tracking the performance of IoT devices. It incorporates information from IoT sensors related to automobile detail, fuel level, engine speed, battery voltage, tire pressure, engine load, air intake, throttle position, etc. Crafting an eye-catching presentation has never been more straightforward. Let your presentation shine with this tasteful yet straightforward Unlocking Potential IoTs Application Dashboard For Monitoring IoT Devices Connected Car IoT SS V template. It offers a minimalistic and classy look that is great for making a statement. The colors have been employed intelligently to add a bit of playfulness while still remaining professional. Construct the ideal Unlocking Potential IoTs Application Dashboard For Monitoring IoT Devices Connected Car IoT SS V that effortlessly grabs the attention of your audience Begin now and be certain to wow your customers This slide provides a dashboard for tracking the performance of IoT devices. It incorporates information from IoT sensors related to automobile detail, fuel level, engine speed, battery voltage, tire pressure, engine load, air intake, throttle position, etc.
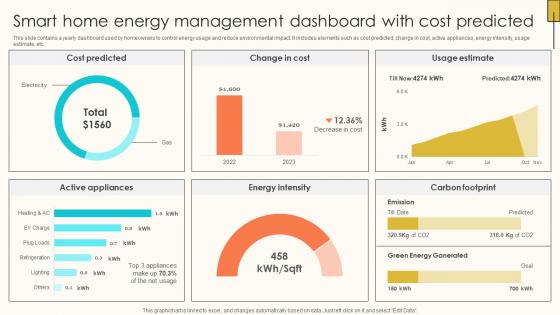
Smart Home Energy Management Dashboard Internet Of Things Solutions To Enhance Energy IoT SS V
This slide contains a yearly dashboard used by homeowners to control energy usage and reduce environmental impact. It includes elements such as cost predicted, change in cost, active appliances, energy intensity, usage estimate, etc. Explore a selection of the finest Smart Home Energy Management Dashboard Internet Of Things Solutions To Enhance Energy IoT SS V here. With a plethora of professionally designed and pre-made slide templates, you can quickly and easily find the right one for your upcoming presentation. You can use our Smart Home Energy Management Dashboard Internet Of Things Solutions To Enhance Energy IoT SS V to effectively convey your message to a wider audience. Slidegeeks has done a lot of research before preparing these presentation templates. The content can be personalized and the slides are highly editable. Grab templates today from Slidegeeks. This slide contains a yearly dashboard used by homeowners to control energy usage and reduce environmental impact. It includes elements such as cost predicted, change in cost, active appliances, energy intensity, usage estimate, etc.
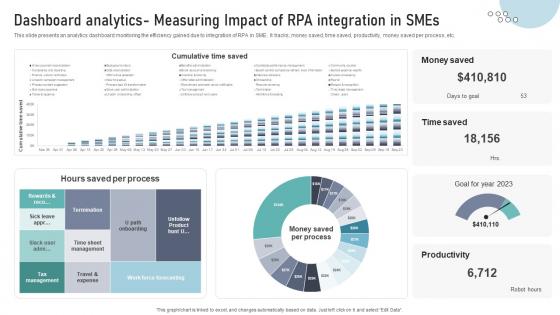
Dashboard Analytics Measuring Impact Of RPA Integration In SMEs DT SS V
This slide presents an analytics dashboard monitoring the efficiency gained due to integration of RPA in SME. It tracks, money saved, time saved, productivity, money saved per process, etc.Formulating a presentation can take up a lot of effort and time, so the content and message should always be the primary focus. The visuals of the PowerPoint can enhance the presenters message, so our Dashboard Analytics Measuring Impact Of RPA Integration In SMEs DT SS V was created to help save time. Instead of worrying about the design, the presenter can concentrate on the message while our designers work on creating the ideal templates for whatever situation is needed. Slidegeeks has experts for everything from amazing designs to valuable content, we have put everything into Dashboard Analytics Measuring Impact Of RPA Integration In SMEs DT SS V. This slide presents an analytics dashboard monitoring the efficiency gained due to integration of RPA in SME. It tracks, money saved, time saved, productivity, money saved per process, etc.
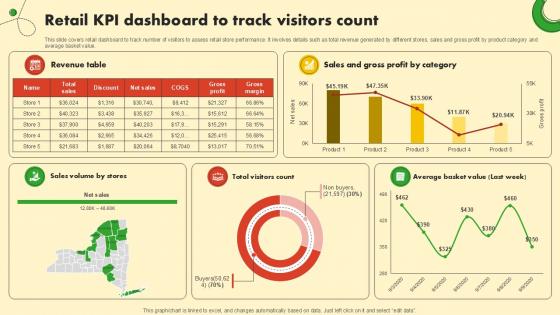
Retail KPI Dashboard To Track Food And Grocery Retail Ppt Slide
This slide covers retail dashboard to track number of visitors to assess retail store performance. It involves details such as total revenue generated by different stores, sales and gross profit by product category and average basket value. This Retail KPI Dashboard To Track Food And Grocery Retail Ppt Slide is perfect for any presentation, be it in front of clients or colleagues. It is a versatile and stylish solution for organizing your meetings. The Retail KPI Dashboard To Track Food And Grocery Retail Ppt Slide features a modern design for your presentation meetings. The adjustable and customizable slides provide unlimited possibilities for acing up your presentation. Slidegeeks has done all the homework before launching the product for you. So, do not wait, grab the presentation templates today This slide covers retail dashboard to track number of visitors to assess retail store performance. It involves details such as total revenue generated by different stores, sales and gross profit by product category and average basket value.
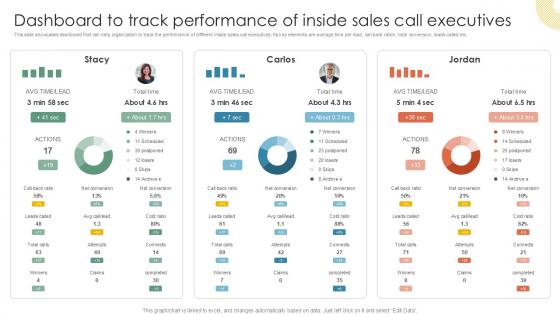
Dashboard To Track Performance Of Inside Vs Outside Sales PPT PowerPoint Strategy SS V
This slide showcases dashboard that can help organization to track the performance of different inside sales call executives. Its key elements are average time per lead, call back ration, total conversion, leads called etc. Do you have an important presentation coming up Are you looking for something that will make your presentation stand out from the rest Look no further than Dashboard To Track Performance Of Inside Vs Outside Sales PPT PowerPoint Strategy SS V. With our professional designs, you can trust that your presentation will pop and make delivering it a smooth process. And with Slidegeeks, you can trust that your presentation will be unique and memorable. So why wait Grab Dashboard To Track Performance Of Inside Vs Outside Sales PPT PowerPoint Strategy SS V today and make your presentation stand out from the rest This slide showcases dashboard that can help organization to track the performance of different inside sales call executives. Its key elements are average time per lead, call back ration, total conversion, leads called etc.
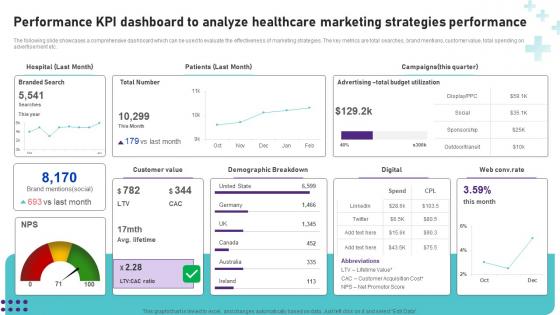
Performance KPI Dashboard To Analyze Healthcare Operational Areas Healthcare Rules PDF
Do you know about Slidesgeeks Performance KPI Dashboard To Analyze Healthcare Operational Areas Healthcare Rules PDF These are perfect for delivering any kind od presentation. Using it, create PowerPoint presentations that communicate your ideas and engage audiences. Save time and effort by using our pre-designed presentation templates that are perfect for a wide range of topic. Our vast selection of designs covers a range of styles, from creative to business, and are all highly customizable and easy to edit. Download as a PowerPoint template or use them as Google Slides themes. The following slide showcases a comprehensive dashboard which can be used to evaluate the effectiveness of marketing strategies. The key metrics are total searches, brand mentions, customer value, total spending on advertisement etc.
Learning And Improvement KPI Dashboard Ppt Powerpoint Presentation Complete Deck With Slides
This Learning And Improvement KPI Dashboard Ppt Powerpoint Presentation Complete Deck With Slides acts as backup support for your ideas, vision, thoughts, etc. Use it to present a thorough understanding of the topic. This PPT slideshow can be utilized for both in-house and outside presentations depending upon your needs and business demands. Entailing fourteen slides with a consistent design and theme, this template will make a solid use case. As it is intuitively designed, it suits every business vertical and industry. All you have to do is make a few tweaks in the content or any other component to design unique presentations. The biggest advantage of this complete deck is that it can be personalized multiple times once downloaded. The color, design, shapes, and other elements are free to modify to add personal touches. You can also insert your logo design in this PPT layout. Therefore a well-thought and crafted presentation can be delivered with ease and precision by downloading this Learning And Improvement KPI Dashboard Ppt Powerpoint Presentation Complete Deck With Slides PPT slideshow. Our Learning And Improvement KPI Dashboard Ppt Powerpoint Presentation Complete Deck With Slides are topically designed to provide an attractive backdrop to any subject. Use them to look like a presentation pro.
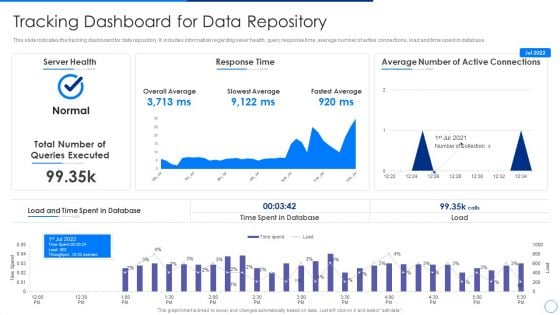
Scale Up Plan For Data Inventory Model Tracking Dashboard For Data Repository Themes PDF
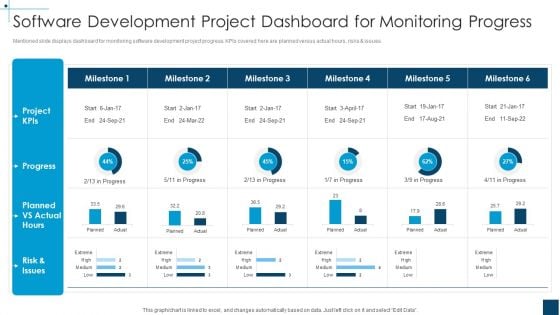
Devops Principles For Hybrid Cloud IT Software Development Project Dashboard For Monitoring Progress Themes PDF
Mentioned slide displays dashboard for monitoring software development project progress. KPIs covered here are planned versus actual hours, risks and issues.Deliver and pitch your topic in the best possible manner with this devops principles for hybrid cloud it software development project dashboard for monitoring progress themes pdf Use them to share invaluable insights on software development project dashboard for monitoring progress and impress your audience. This template can be altered and modified as per your expectations. So, grab it now.
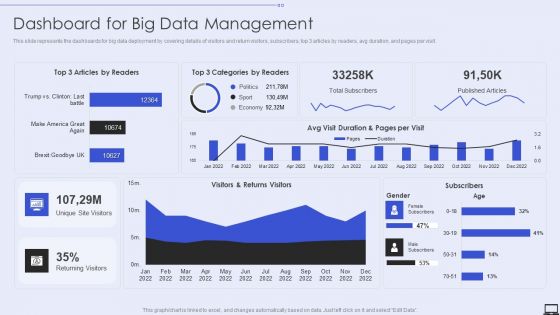
Dashboard For Big Data Management Ppt PowerPoint Presentation File Diagrams PDF
This slide represents the dashboards for big data deployment by covering details of visitors and return visitors, subscribers, top 3 articles by readers, avg duration, and pages per visit. Deliver an awe inspiring pitch with this creative Dashboard For Big Data Management Ppt PowerPoint Presentation File Diagrams PDF bundle. Topics like Dashboard, Big Data Management can be discussed with this completely editable template. It is available for immediate download depending on the needs and requirements of the user.
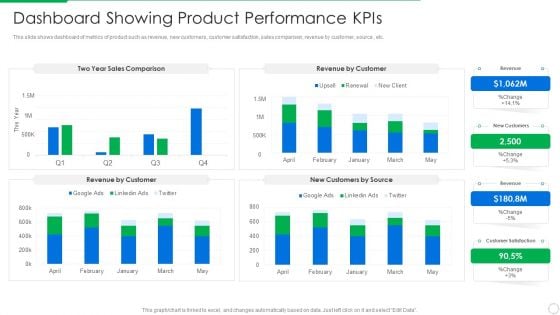
PLM Execution In Company Dashboard Showing Product Performance Kpis Diagrams PDF
This slide shows dashboard of metrics of product such as revenue, new customers, customer satisfaction, sales comparison, revenue by customer, source , etc. Deliver and pitch your topic in the best possible manner with this plm execution in company dashboard showing product performance kpis diagrams pdf . Use them to share invaluable insights on dashboard showing product performance kpis and impress your audience. This template can be altered and modified as per your expectations. So, grab it now.
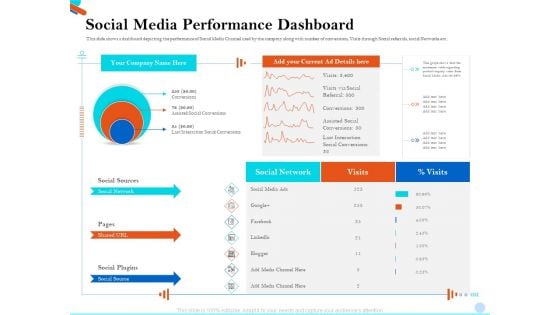
Pitch Presentation Raising Series C Funds Investment Company Social Media Performance Dashboard Themes PDF
This slide shows a dashboard depicting the performance of Social Media Channel used by the company along with number of conversions, Visits through Social referrals, social Networks etc. Deliver an awe inspiring pitch with this creative pitch presentation raising series c funds investment company social media performance dashboard themes pdf bundle. Topics like social media performance dashboard can be discussed with this completely editable template. It is available for immediate download depending on the needs and requirements of the user.
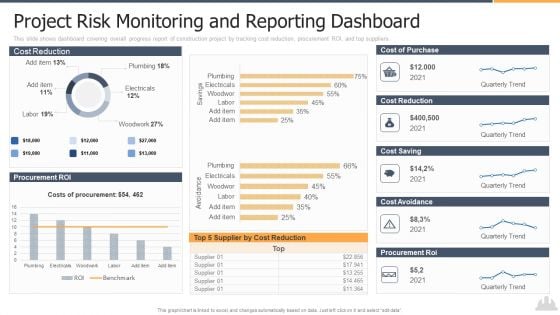
Building Projects Risk Landscape Project Risk Monitoring And Reporting Dashboard Themes PDF
This slide shows dashboard covering overall progress report of construction project by tracking cost reduction, procurement ROI, and top suppliers. Deliver and pitch your topic in the best possible manner with this building projects risk landscape project risk monitoring and reporting dashboard themes pdf. Use them to share invaluable insights on project risk monitoring and reporting dashboard and impress your audience. This template can be altered and modified as per your expectations. So, grab it now.

How To Administer Accounts To Increase Sales Revenue Managing Account Dashboard Themes PDF
The dashboard will provide overall scenario of all accounts and track various accounts activities based on average contract value, average cycle length, etc. Deliver an awe inspiring pitch with this creative how to administer accounts to increase sales revenue managing account dashboard themes pdf bundle. Topics like managing account dashboard can be discussed with this completely editable template. It is available for immediate download depending on the needs and requirements of the user.
Employee Training Playbook Determine Workforce Training Performance Tracking Dashboard Themes PDF
This slide provides information regarding workforce training performance tracking dashboard with training cost, number of participants, hours of training, etc. Deliver and pitch your topic in the best possible manner with this employee training playbook determine workforce training performance tracking dashboard themes pdf. Use them to share invaluable insights on determine workforce training performance tracking dashboard and impress your audience. This template can be altered and modified as per your expectations. So, grab it now.
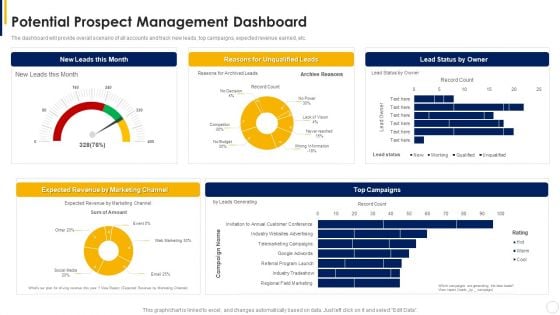
Manual To Develop Strawman Proposal Potential Prospect Management Dashboard Themes PDF
The dashboard will provide overall scenario of all accounts and track new leads, top campaigns, expected revenue earned, etc. Deliver an awe inspiring pitch with this creative Manual To Develop Strawman Proposal Potential Prospect Management Dashboard Themes PDF bundle. Topics like Expected Revenue, Marketing Channel, Management Dashboard can be discussed with this completely editable template. It is available for immediate download depending on the needs and requirements of the user.
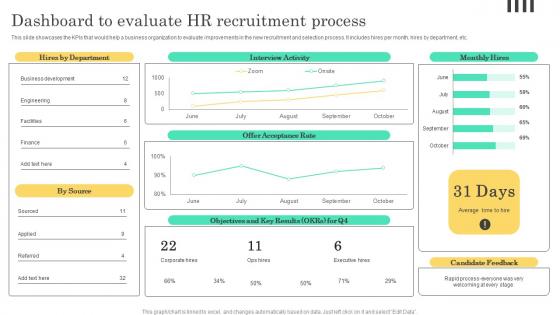
Dashboard To Evaluate HR Recruitment Implementable Hiring And Selection Themes Pdf
This slide showcases the KPIs that would help a business organization to evaluate improvements in the new recruitment and selection process. It includes hires per month, hires by department, etc. Get a simple yet stunning designed Dashboard To Evaluate HR Recruitment Implementable Hiring And Selection Themes Pdf. It is the best one to establish the tone in your meetings. It is an excellent way to make your presentations highly effective. So, download this PPT today from Slidegeeks and see the positive impacts. Our easy to edit Dashboard To Evaluate HR Recruitment Implementable Hiring And Selection Themes Pdf can be your go to option for all upcoming conferences and meetings. So, what are you waiting for Grab this template today. This slide showcases the KPIs that would help a business organization to evaluate improvements in the new recruitment and selection process. It includes hires per month, hires by department, etc.
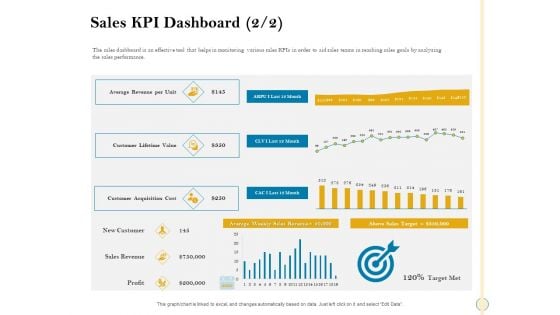
Sales Optimization Best Practices To Close More Deals Sales KPI Dashboard Revenue Diagrams PDF
The sales dashboard is an effective tool that helps in monitoring various sales KPIs in order to aid sales teams in reaching sales goals by analyzing the sales performance. Deliver an awe inspiring pitch with this creative sales optimization best practices to close more deals sales kpi dashboard revenue diagrams pdf bundle. Topics like sales kpi dashboard can be discussed with this completely editable template. It is available for immediate download depending on the needs and requirements of the user.
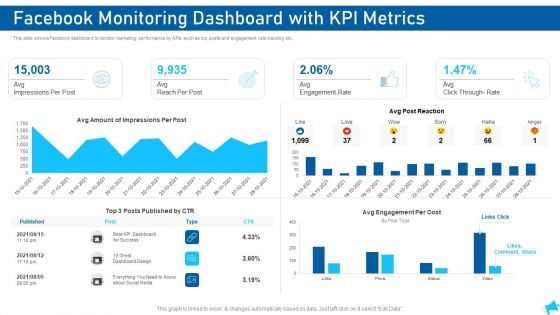
Social Media Marketing Facebook Monitoring Dashboard With KPI Metrics Diagrams PDF
This slide shows Facebook dashboard to monitor marketing performance by KPIs such as top posts and engagement rate tracking etc. Deliver an awe inspiring pitch with this creative social media marketing facebook monitoring dashboard with kpi metrics diagrams pdf bundle. Topics like design, cost, social media, dashboard can be discussed with this completely editable template. It is available for immediate download depending on the needs and requirements of the user.
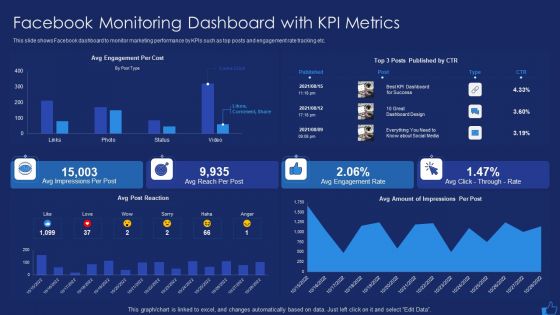
Facebook Advertising Plan For Demand Generation Facebook Monitoring Dashboard With KPI Metrics Diagrams PDF
This slide shows Facebook dashboard to monitor marketing performance by KPIs such as top posts and engagement rate tracking etc. Deliver an awe inspiring pitch with this creative facebook advertising plan for demand generation facebook monitoring dashboard with kpi metrics diagrams pdf bundle. Topics like facebook monitoring dashboard with kpi metrics can be discussed with this completely editable template. It is available for immediate download depending on the needs and requirements of the user.
Inculcating Supplier Operation Improvement Plan Inventory Turnover Tracking Dashboard Diagrams PDF
This slide displays inventory turnover tracking dashboard. It includes information about achievable and target inventory, it also shows various reasons for product or package return. Deliver an awe inspiring pitch with this creative inculcating supplier operation improvement plan inventory turnover tracking dashboard diagrams pdf bundle. Topics like inventory turnover tracking dashboard can be discussed with this completely editable template. It is available for immediate download depending on the needs and requirements of the user.
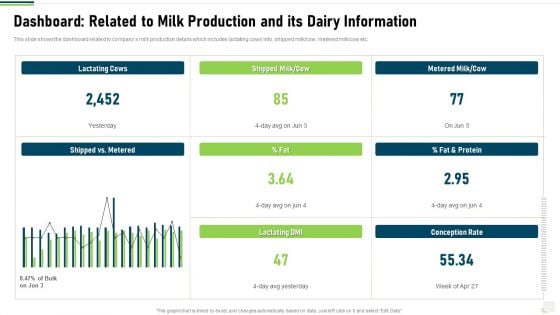
Dashboard Related To Milk Production And Its Dairy Information Diagrams PDF
This slide shows the dashboard related to companys milk production details which includes lactating cows info, shipped milk or cow, metered milk or cow etc. Deliver and pitch your topic in the best possible manner with this dashboard related to milk production and its dairy information diagrams pdf. Use them to share invaluable insights on dashboard related to milk production and its dairy information and impress your audience. This template can be altered and modified as per your expectations. So, grab it now.
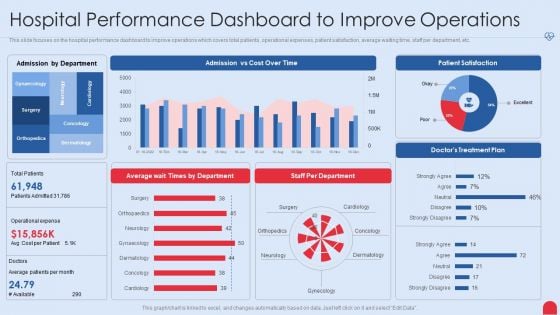
Enhancing Hospital Software System Hospital Performance Dashboard To Improve Operations Diagrams PDF
This slide focuses on the hospital performance dashboard to improve operations which covers total patients, operational expenses, patient satisfaction, average waiting time, staff per department, etc. Deliver an awe inspiring pitch with this creative enhancing hospital software system hospital performance dashboard to improve operations diagrams pdf bundle. Topics like hospital performance dashboard to improve operations can be discussed with this completely editable template. It is available for immediate download depending on the needs and requirements of the user.
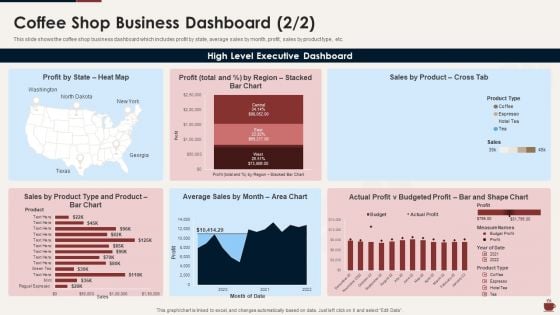
Master Plan For Opening Bistro Coffee Shop Business Dashboard Diagrams PDF
This slide shows the coffee shop business dashboard which includes profit by state, average sales by month, profit, sales by product type, etc. Deliver an awe inspiring pitch with this creative master plan for opening bistro coffee shop business dashboard diagrams pdf bundle. Topics like coffee shop business dashboard can be discussed with this completely editable template. It is available for immediate download depending on the needs and requirements of the user.
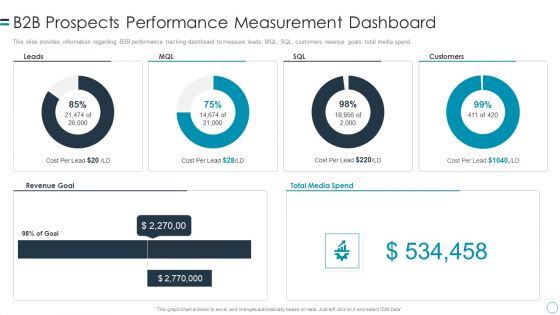
B2B Customers Journey Playbook B2b Prospects Performance Measurement Dashboard Diagrams PDF
This slide provides information regarding B2B performance tracking dashboard to measure leads, MQL, SQL, customers, revenue goals, total media spend. Deliver an awe inspiring pitch with this creative b2b customers journey playbook b2b prospects performance measurement dashboard diagrams pdf bundle. Topics like b2b prospects performance measurement dashboard can be discussed with this completely editable template. It is available for immediate download depending on the needs and requirements of the user.
Strategic Guide To Launch New Product In Market Product Management Activities Tracking Dashboard Diagrams PDF
This slide provides information regarding essential product management activities tracking dashboard in terms of project budget, workload, overdue tasks, etc. Deliver and pitch your topic in the best possible manner with this strategic guide to launch new product in market product management activities tracking dashboard diagrams pdf Use them to share invaluable insights on product management activities tracking dashboard and impress your audience. This template can be altered and modified as per your expectations. So, grab it now.
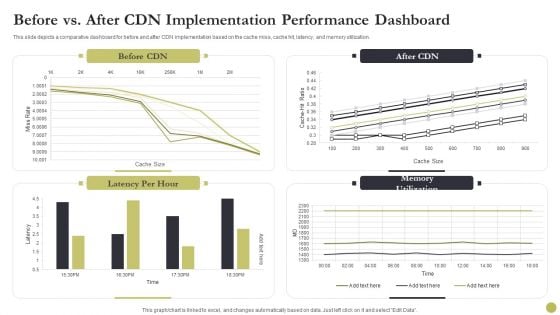
Content Delivery Network Edge Server Before Vs After CDN Implementation Performance Dashboard Diagrams PDF
This slide depicts a comparative dashboard for before and after CDN implementation based on the cache miss, cache hit, latency, and memory utilization. Deliver an awe inspiring pitch with this creative Content Delivery Network Edge Server Before Vs After CDN Implementation Performance Dashboard Diagrams PDF bundle. Topics like After Cdn Implementation, Performance Dashboard can be discussed with this completely editable template. It is available for immediate download depending on the needs and requirements of the user.
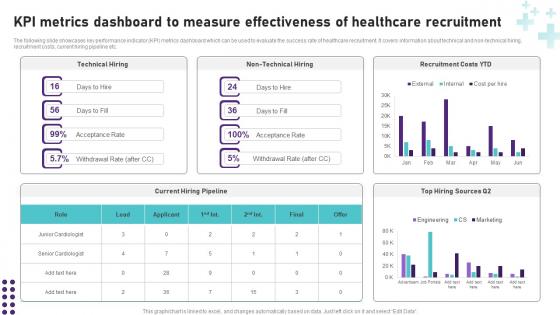
KPI Metrics Dashboard To Measure Healthcare Operational Areas Healthcare Brochure PDF
Retrieve professionally designed KPI Metrics Dashboard To Measure Healthcare Operational Areas Healthcare Brochure PDF to effectively convey your message and captivate your listeners. Save time by selecting pre-made slideshows that are appropriate for various topics, from business to educational purposes. These themes come in many different styles, from creative to corporate, and all of them are easily adjustable and can be edited quickly. Access them as PowerPoint templates or as Google Slides themes. You do not have to go on a hunt for the perfect presentation because Slidegeeks got you covered from everywhere. The following slide showcases key performance indicator KPI metrics dashboard which can be used to evaluate the success rate of healthcare recruitment. It covers information about technical and non-technical hiring, recruitment costs, current hiring pipeline etc.
Data Breach Prevention Status Tracking Dashboard Data Breach Prevention Information Pdf
This slide represents the critical cyber security performance indicators for the organization. The key components include application health, encryption status, license consumption, windows defender, etc. Crafting an eye-catching presentation has never been more straightforward. Let your presentation shine with this tasteful yet straightforward Data Breach Prevention Status Tracking Dashboard Data Breach Prevention Information Pdf template. It offers a minimalistic and classy look that is great for making a statement. The colors have been employed intelligently to add a bit of playfulness while still remaining professional. Construct the ideal Data Breach Prevention Status Tracking Dashboard Data Breach Prevention Information Pdf that effortlessly grabs the attention of your audience Begin now and be certain to wow your customers This slide represents the critical cyber security performance indicators for the organization. The key components include application health, encryption status, license consumption, windows defender, etc.
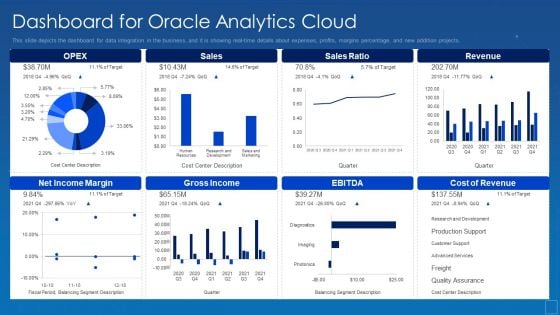
Oracle Cloud Data Analytics Administration IT Dashboard For Oracle Analytics Cloud Sample PDF
This slide depicts the dashboard for data integration in the business, and it is showing real-time details about expenses, profits, margins percentage, and new addition projects. Deliver an awe inspiring pitch with this creative oracle cloud data analytics administration it dashboard for oracle analytics cloud sample pdf bundle. Topics like dashboard for oracle analytics cloud can be discussed with this completely editable template. It is available for immediate download depending on the needs and requirements of the user.
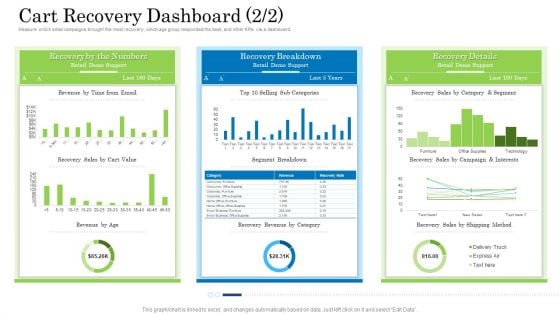
Customer Behavioral Data And Analytics Cart Recovery Dashboard Value Inspiration PDF
Measure which email campaigns brought the most recovery, which age group responded the best, and other KPIs via a dashboard. Deliver and pitch your topic in the best possible manner with this customer behavioral data and analytics cart recovery dashboard value inspiration pdf. Use them to share invaluable insights on cart recovery dashboard and impress your audience. This template can be altered and modified as per your expectations. So, grab it now.
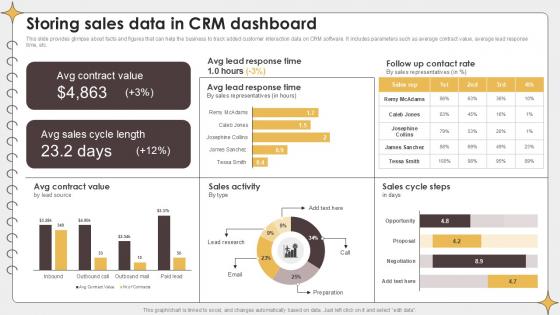
Storing Sales Data In CRM Dashboard Planning Outreach Campaigns PPT Slide
This slide provides glimpse about facts and figures that can help the business to track added customer interaction data on CRM software. It includes parameters such as average contract value, average lead response time, etc. This Storing Sales Data In CRM Dashboard Planning Outreach Campaigns PPT Slide is perfect for any presentation, be it in front of clients or colleagues. It is a versatile and stylish solution for organizing your meetings. The Storing Sales Data In CRM Dashboard Planning Outreach Campaigns PPT Slide features a modern design for your presentation meetings. The adjustable and customizable slides provide unlimited possibilities for acing up your presentation. Slidegeeks has done all the homework before launching the product for you. So, do not wait, grab the presentation templates today This slide provides glimpse about facts and figures that can help the business to track added customer interaction data on CRM software. It includes parameters such as average contract value, average lead response time, etc.
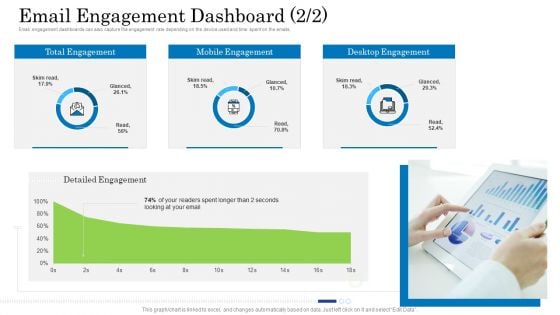
Customer Behavioral Data And Analytics Email Engagement Dashboard Email Structure PDF
Email engagement dashboards can also capture the engagement rate depending on the device used and time spent on the emails. Deliver and pitch your topic in the best possible manner with this customer behavioral data and analytics email engagement dashboard email structure pdf. Use them to share invaluable insights on email engagement dashboard and impress your audience. This template can be altered and modified as per your expectations. So, grab it now.
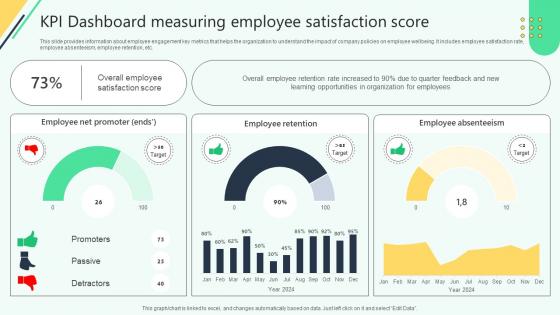
Kpi Dashboard Measuring Employee Satisfaction Score Analysing Hr Data For Effective Decision Making
This slide provides information about employee engagement key metrics that helps the organization to understand the impact of company policies on employee wellbeing. It includes employee satisfaction rate, employee absenteeism, employee retention, etc. Create an editable Kpi Dashboard Measuring Employee Satisfaction Score Analysing Hr Data For Effective Decision Making that communicates your idea and engages your audience. Whether you are presenting a business or an educational presentation, pre-designed presentation templates help save time. Kpi Dashboard Measuring Employee Satisfaction Score Analysing Hr Data For Effective Decision Making is highly customizable and very easy to edit, covering many different styles from creative to business presentations. Slidegeeks has creative team members who have crafted amazing templates. So, go and get them without any delay. This slide provides information about employee engagement key metrics that helps the organization to understand the impact of company policies on employee wellbeing. It includes employee satisfaction rate, employee absenteeism, employee retention, etc.
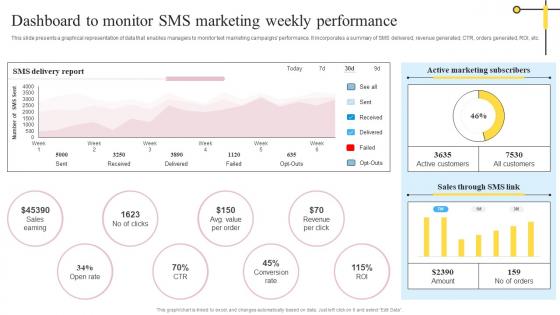
Dashboard To Monitor SMS Marketing Weekly Definitive Guide On Mass Advertising Inspiration Pdf
This slide presents a graphical representation of data that enables managers to monitor text marketing campaigns performance. It incorporates a summary of SMS delivered, revenue generated, CTR, orders generated, ROI, etc. Get a simple yet stunning designed Dashboard To Monitor SMS Marketing Weekly Definitive Guide On Mass Advertising Inspiration Pdf. It is the best one to establish the tone in your meetings. It is an excellent way to make your presentations highly effective. So, download this PPT today from Slidegeeks and see the positive impacts. Our easy-to-edit Dashboard To Monitor SMS Marketing Weekly Definitive Guide On Mass Advertising Inspiration Pdf can be your go-to option for all upcoming conferences and meetings. So, what are you waiting for Grab this template today. This slide presents a graphical representation of data that enables managers to monitor text marketing campaigns performance. It incorporates a summary of SMS delivered, revenue generated, CTR, orders generated, ROI, etc.
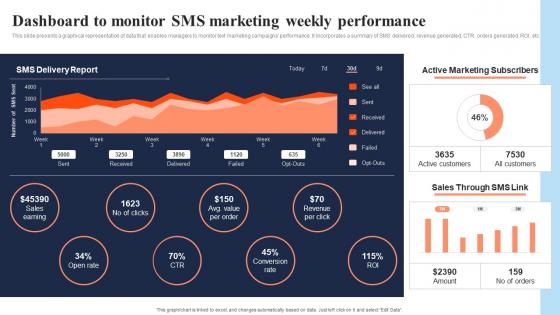
Dashboard To Monitor SMS Marketing Weekly Performance In Depth Overview Of Mass Rules Pdf
This slide presents a graphical representation of data that enables managers to monitor text marketing campaigns performance. It incorporates a summary of SMS delivered, revenue generated, CTR, orders generated, ROI, etc. Get a simple yet stunning designed Dashboard To Monitor SMS Marketing Weekly Performance In Depth Overview Of Mass Rules Pdf It is the best one to establish the tone in your meetings. It is an excellent way to make your presentations highly effective. So, download this PPT today from Slidegeeks and see the positive impacts. Our easy-to-edit Dashboard To Monitor SMS Marketing Weekly Performance In Depth Overview Of Mass Rules Pdf can be your go-to option for all upcoming conferences and meetings. So, what are you waiting for Grab this template today. This slide presents a graphical representation of data that enables managers to monitor text marketing campaigns performance. It incorporates a summary of SMS delivered, revenue generated, CTR, orders generated, ROI, etc.
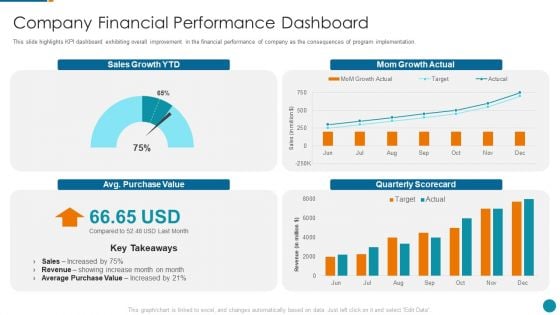
Strategic Procedure To Improve Employee Efficiency Company Financial Performance Dashboard Infographics PDF
This slide highlights KPI dashboard exhibiting overall improvement in the financial performance of company as the consequences of program implementation. Deliver and pitch your topic in the best possible manner with this strategic procedure to improve employee efficiency company financial performance dashboard infographics pdf Use them to share invaluable insights on company financial performance dashboard and impress your audience. This template can be altered and modified as per your expectations. So, grab it now.
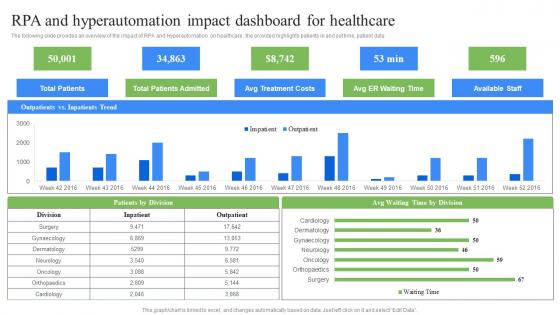
RPA And Hyperautomation Impact Dashboard RPA Influence On Industries Brochure Pdf
The following slide provides an overview of the impact of RPA and Hyperautomation on healthcare, the provided highlights patients in and out time, patient data. Here you can discover an assortment of the finest PowerPoint and Google Slides templates. With these templates, you can create presentations for a variety of purposes while simultaneously providing your audience with an eye-catching visual experience. Download RPA And Hyperautomation Impact Dashboard RPA Influence On Industries Brochure Pdf to deliver an impeccable presentation. These templates will make your job of preparing presentations much quicker, yet still, maintain a high level of quality. Slidegeeks has experienced researchers who prepare these templates and write high-quality content for you. Later on, you can personalize the content by editing the RPA And Hyperautomation Impact Dashboard RPA Influence On Industries Brochure Pdf. The following slide provides an overview of the impact of RPA and Hyperautomation on healthcare, the provided highlights patients in and out time, patient data.

Product Sales Order Accomplishment Planning Dashboard With Customer Account Details Diagrams PDF
The following slide illustrates the dashboard for order fulfillment planning which includes order status, delivery methods and customer accounts.Presenting Product Sales Order Accomplishment Planning Dashboard With Customer Account Details Diagrams PDF to dispense important information. This template comprises five stages. It also presents valuable insights into the topics including Product Sales, Order Accomplishment, Planning Dashboard This is a completely customizable PowerPoint theme that can be put to use immediately. So, download it and address the topic impactfully.
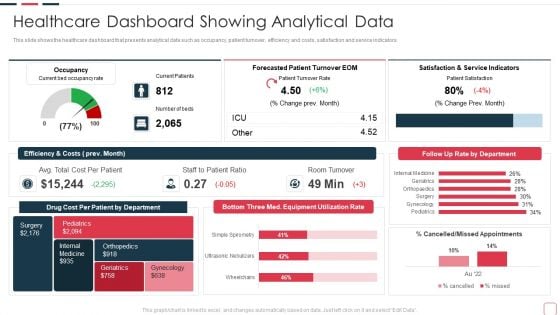
Price Benefit Internet Things Digital Twins Execution After Covid Healthcare Dashboard Designs PDF
This slide shows the healthcare dashboard that presents analytical data such as occupancy, patient turnover, efficiency and costs, satisfaction and service indicators. Deliver an awe inspiring pitch with this creative price benefit internet things digital twins execution after covid healthcare dashboard designs pdf bundle. Topics like healthcare dashboard showing analytical data can be discussed with this completely editable template. It is available for immediate download depending on the needs and requirements of the user.
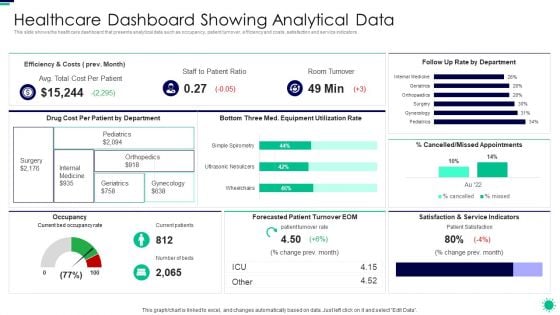
Purpose Digital Twin Internet Things Reducing Costs After COVID Era Healthcare Dashboard Showing Inspiration PDF
This slide shows the healthcare dashboard that presents analytical data such as occupancy, patient turnover, efficiency and costs, satisfaction and service indicators. Deliver an awe inspiring pitch with this creative purpose digital twin internet things reducing costs after covid era healthcare dashboard showing inspiration pdf bundle. Topics like healthcare dashboard showing analytical data can be discussed with this completely editable template. It is available for immediate download depending on the needs and requirements of the user.
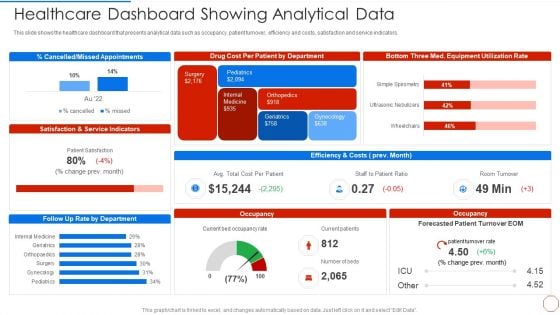
Minimizing Operational Cost Through Iot Virtual Twins Implementation Healthcare Dashboard Showing Sample PDF
This slide shows the healthcare dashboard that presents analytical data such as occupancy, patient turnover, efficiency and costs, satisfaction and service indicators. Deliver an awe inspiring pitch with this creative minimizing operational cost through iot virtual twins implementation healthcare dashboard showing sample pdf bundle. Topics like healthcare dashboard showing analytical data can be discussed with this completely editable template. It is available for immediate download depending on the needs and requirements of the user.
Developing Organization Primary Data Storage Action Plan Tracking Dashboard For Data Repository Background PDF
This slide indicates the tracking dashboard for data repository. It includes information regarding sever health, query response time, average number of active connections, load and time spent in database. Deliver an awe inspiring pitch with this creative developing organization primary data storage action plan tracking dashboard for data repository background pdf bundle. Topics like tracking dashboard for data repository can be discussed with this completely editable template. It is available for immediate download depending on the needs and requirements of the user.
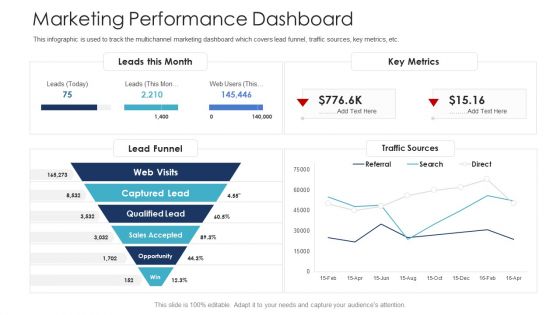
B2C Marketing Initiatives Strategies For Business Marketing Performance Dashboard Ppt Ideas Example Topics PDF
This infographic is used to track the multichannel marketing dashboard which covers lead funnel, traffic sources, key metrics, etc. Deliver an awe inspiring pitch with this creative B2C marketing initiatives strategies for business marketing performance dashboard ppt ideas example topics pdf bundle. Topics like marketing performance dashboard can be discussed with this completely editable template. It is available for immediate download depending on the needs and requirements of the user.
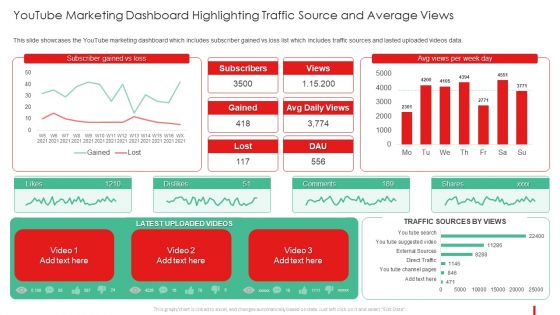
Promotion Guide To Advertise Brand On Youtube Youtube Marketing Dashboard Sample PDF
This slide showcases the YouTube marketing dashboard which includes subscriber gained vs loss list which includes traffic sources and lasted uploaded videos data.Deliver and pitch your topic in the best possible manner with this Promotion Guide To Advertise Brand On Youtube Youtube Marketing Dashboard Sample PDF Use them to share invaluable insights on Youtube Marketing Dashboard Highlighting Traffic Source And Average Views and impress your audience. This template can be altered and modified as per your expectations. So, grab it now.

 Home
Home