Dashboard Icon
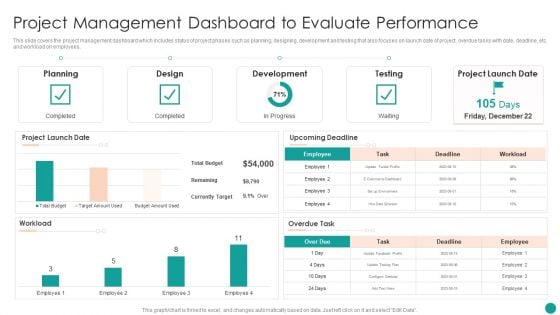
Time Management Techniques For Successful Project Project Management Dashboard To Evaluate Mockup PDF
This slide covers the project management dashboard which includes status of project phases such as planning, designing, development and testing that also focuses on launch date of project, overdue tasks with date, deadline, etc. and workload on employees.Deliver an awe inspiring pitch with this creative Time Management Techniques For Successful Project Project Management Dashboard To Evaluate Mockup PDF bundle. Topics like Development, Project Launch, Upcoming Deadline can be discussed with this completely editable template. It is available for immediate download depending on the needs and requirements of the user.
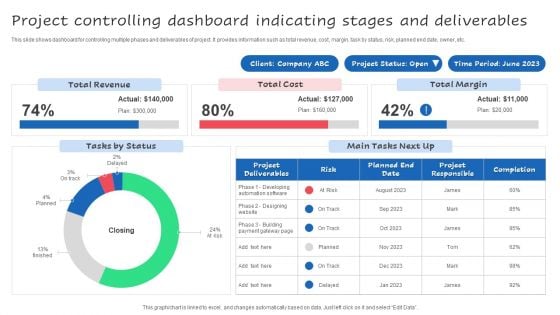
Project Controlling Dashboard Indicating Stages And Deliverables Ppt Styles Guide PDF
This slide shows dashboard for controlling multiple phases and deliverables of project. It provides information such as total revenue, cost, margin, task by status, risk, planned end date, owner, etc. Pitch your topic with ease and precision using this Project Controlling Dashboard Indicating Stages And Deliverables Ppt Styles Guide PDF. This layout presents information on Total Revenue, Total Margin, Total Cost. It is also available for immediate download and adjustment. So, changes can be made in the color, design, graphics or any other component to create a unique layout.
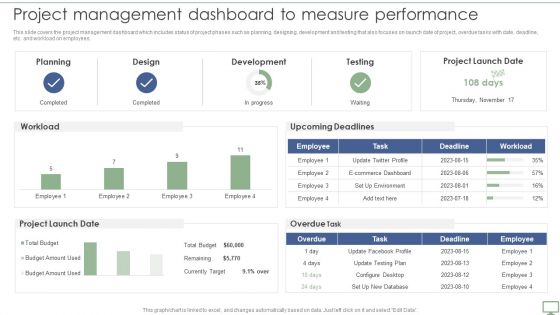
Procedure To Establish Project Administration Program Project Management Dashboard To Measure Performance Template PDF
This slide covers the project management dashboard which includes status of project phases such as planning, designing, development and testing that also focuses on launch date of project, overdue tasks with date, deadline, etc. and workload on employees. From laying roadmaps to briefing everything in detail, our templates are perfect for you. You can set the stage with your presentation slides. All you have to do is download these easy to edit and customizable templates. Procedure To Establish Project Administration Program Project Management Dashboard To Measure Performance Template PDF will help you deliver an outstanding performance that everyone would remember and praise you for. Do download this presentation today.

Patient Health And Risk Key Performance Indicator Dashboard Ppt Infographic Template Summary PDF
The following slide highlights the patient health and safety key performance indicator dashboard illustrating admission by department, admission by cost, patient satisfaction, total patients, operations cost, patient density, total staff, waiting time, treatment satisfaction and treatment confidence. Pitch your topic with ease and precision using this Patient Health And Risk Key Performance Indicator Dashboard Ppt Infographic Template Summary PDF. This layout presents information on Admission By Department, Admission Vs Cost, Patient Satisfaction. It is also available for immediate download and adjustment. So, changes can be made in the color, design, graphics or any other component to create a unique layout.
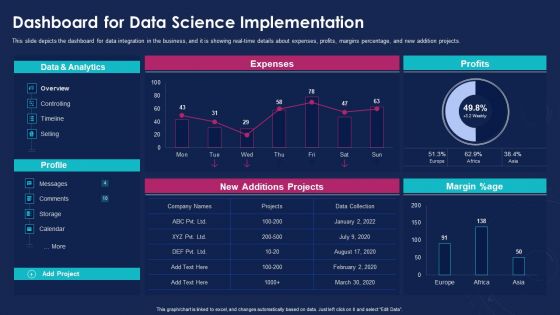
Data Analytics IT Dashboard For Data Science Implementation Ppt Portfolio Pictures PDF
This slide depicts the dashboard for data integration in the business, and it is showing real-time details about expenses, profits, margins percentage, and new addition projects. Deliver and pitch your topic in the best possible manner with this data analytics it dashboard for data science implementation ppt portfolio pictures pdf. Use them to share invaluable insights on data and analytics, margin percentage, profits, expenses, new additions projects and impress your audience. This template can be altered and modified as per your expectations. So, grab it now.
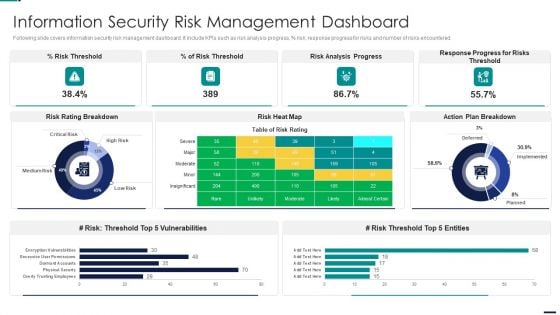
Risk Management Model For Data Security Information Security Risk Management Dashboard Pictures PDF
Following slide covers information security risk management dashboard. It include KPIs such as risk analysis progress, percent risk, response progress for risks and number of risks encountered. Deliver an awe inspiring pitch with this creative Risk Management Model For Data Security Information Security Risk Management Dashboard Pictures PDF bundle. Topics like Risk Threshold, Risk Analysis Progress, Response Progress For Risks Threshold, Action Plan Breakdown can be discussed with this completely editable template. It is available for immediate download depending on the needs and requirements of the user.
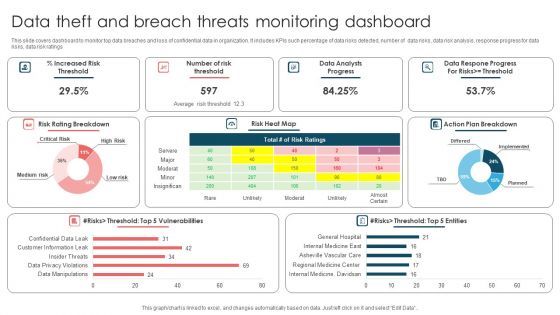
Data Theft And Breach Threats Monitoring Dashboard Ppt Outline Designs PDF
This slide covers dashboard to monitor top data breaches and loss of confidential data in organization. It includes KPIs such percentage of data risks detected, number of data risks, data risk analysis, response progress for data risks, data risk ratings. Showcasing this set of slides titled Data Theft And Breach Threats Monitoring Dashboard Ppt Outline Designs PDF. The topics addressed in these templates are Number Risk Threshold, Data Analysts Progress, Action Plan Breakdown. All the content presented in this PPT design is completely editable. Download it and make adjustments in color, background, font etc. as per your unique business setting.
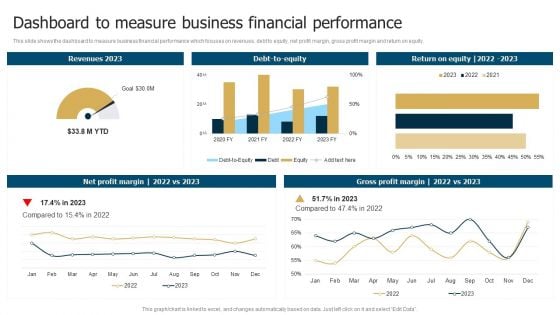
Business Restructuring Process Dashboard To Measure Business Financial Performance Rules PDF
This slide shows the dashboard to measure business financial performance which focuses on revenues, debt to equity, net profit margin, gross profit margin and return on equity. If you are looking for a format to display your unique thoughts, then the professionally designed Business Restructuring Process Dashboard To Measure Business Financial Performance Rules PDF is the one for you. You can use it as a Google Slides template or a PowerPoint template. Incorporate impressive visuals, symbols, images, and other charts. Modify or reorganize the text boxes as you desire. Experiment with shade schemes and font pairings. Alter, share or cooperate with other people on your work. Download Business Restructuring Process Dashboard To Measure Business Financial Performance Rules PDF and find out how to give a successful presentation. Present a perfect display to your team and make your presentation unforgettable.
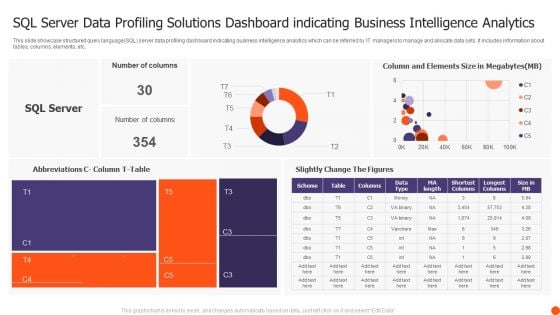
SQL Server Data Profiling Solutions Dashboard Indicating Business Intelligence Analytics Structure PDF
This slide showcase structured query language SQL server data profiling dashboard indicating business intelligence analytics which can be referred by IT managers to manage and allocate data sets. It includes information about tables, columns, elements, etc. Showcasing this set of slides titled SQL Server Data Profiling Solutions Dashboard Indicating Business Intelligence Analytics Structure PDF. The topics addressed in these templates are Number Columns, Slightly Change Figures, SQL Server. All the content presented in this PPT design is completely editable. Download it and make adjustments in color, background, font etc. as per your unique business setting.

Iot And Digital Twin To Reduce Costs Post Covid Healthcare Dashboard Showing Analytical Data Elements PDF
This slide shows the healthcare dashboard that presents analytical data such as occupancy, patient turnover, efficiency and costs, satisfaction and service indicators. Deliver and pitch your topic in the best possible manner with this iot and digital twin to reduce costs post covid healthcare dashboard showing analytical data elements pdf. Use them to share invaluable insights on occupancy, patient turnover, efficiency and costs, satisfaction and service indicators and impress your audience. This template can be altered and modified as per your expectations. So, grab it now.
Cognitive Analytics Strategy And Techniques Tracking Customer Data Insights Dashboard Demonstration PDF
This slide provides information regarding customer data insights dashboard in terms of average churn risk, segments, high earner, highly engaged customers, etc. Take your projects to the next level with our ultimate collection of Cognitive Analytics Strategy And Techniques Tracking Customer Data Insights Dashboard Demonstration PDF. Slidegeeks has designed a range of layouts that are perfect for representing task or activity duration, keeping track of all your deadlines at a glance. Tailor these designs to your exact needs and give them a truly corporate look with your own brand colors they will make your projects stand out from the rest.
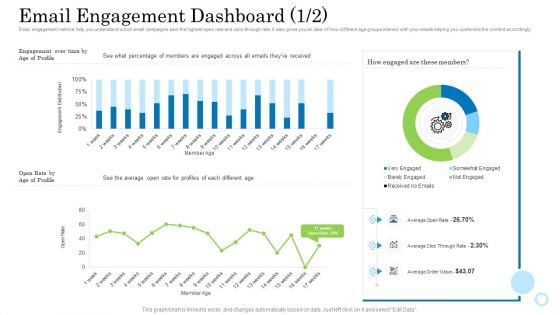
Customer Behavioral Data And Analytics Email Engagement Dashboard Rate Designs PDF
Email engagement metrics help you understand which email campaigns saw the highest open rate and click-through rate. It also gives you an idea of how different age groups interact with your emails helping you customize the content accordingly. Deliver an awe inspiring pitch with this creative customer behavioral data and analytics email engagement dashboard rate designs pdf bundle. Topics like email engagement dashboard can be discussed with this completely editable template. It is available for immediate download depending on the needs and requirements of the user.
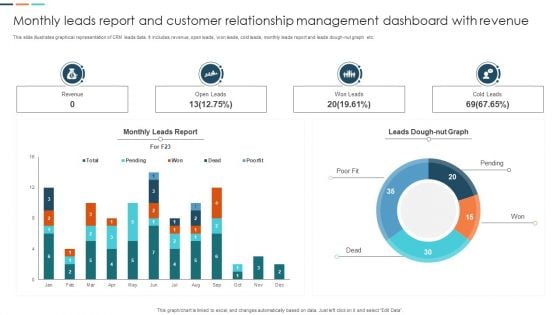
Monthly Leads Report And Customer Relationship Management Dashboard With Revenue Information PDF
This slide illustrates graphical representation of CRM leads data. It includes revenue, open leads, won leads, cold leads, monthly leads report and leads dough nut graph etc. Pitch your topic with ease and precision using this Monthly Leads Report And Customer Relationship Management Dashboard With Revenue Information PDF. This layout presents information on Monthly Leads Report, Customer Relationship Management, Dashboard With Revenue. It is also available for immediate download and adjustment. So, changes can be made in the color, design, graphics or any other component to create a unique layout.
Sales L2RM System Tracking Key Metrics Dashboard Ppt Professional Format Ideas PDF
This slide represents the dashboard for tracking the key performance indicators of sales lead to revenue management. It includes key metrics such as leads by campaign, ratings, lead generation rate, top accounts by revenue and top owners by number of accounts. Showcasing this set of slides titled Sales L2RM System Tracking Key Metrics Dashboard Ppt Professional Format Ideas PDF. The topics addressed in these templates are Leads By Campaign, Leads By Rating, Leads Generation Rate. All the content presented in this PPT design is completely editable. Download it and make adjustments in color, background, font etc. as per your unique business setting.

Logistics KPI Status Dashboard With Monthly KPI Ppt Infographic Template Layout PDF
The following slide highlights the transportation status dashboard with monthly KPI illustrating order status with customer, order date and delivery date. It shows financial performance for four quarters as well as todays order, inventory and monthly KPI with Inventory, shipping cost for past 30 days. Pitch your topic with ease and precision using this Logistics KPI Status Dashboard With Monthly KPI Ppt Infographic Template Layout PDF. This layout presents information on Order Status, Today Order, Inventory, Monthly KPI. It is also available for immediate download and adjustment. So, changes can be made in the color, design, graphics or any other component to create a unique layout.
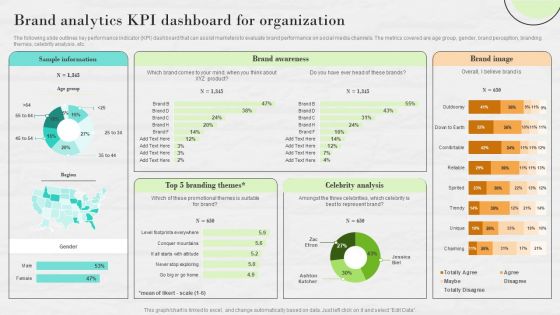
Market Research To Determine Business Opportunities Brand Analytics KPI Dashboard For Organization Inspiration PDF
The following slide outlines key performance indicator KPI dashboard that can assist marketers to evaluate brand performance on social media channels. The metrics covered are age group, gender, brand perception, branding themes, celebrity analysis, etc. There are so many reasons you need a Market Research To Determine Business Opportunities Brand Analytics KPI Dashboard For Organization Inspiration PDF. The first reason is you cannot spend time making everything from scratch, Thus, Slidegeeks has made presentation templates for you too. You can easily download these templates from our website easily.
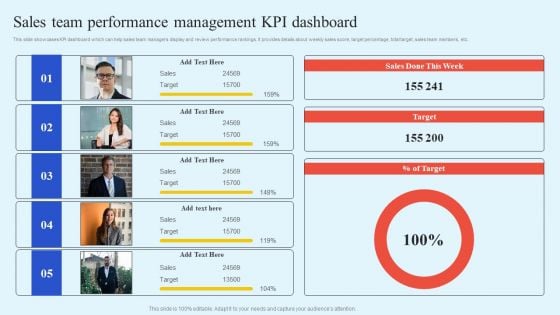
How Leaders Can Improve Team Effectiveness Sales Team Performance Management KPI Dashboard Infographics PDF
This slide showcases KPI dashboard which can help sales team managers display and review performance rankings. It provides details about weekly sales score, target percentage, total target, sales team members, etc. Unleash your creativity with our How Leaders Can Improve Team Effectiveness Sales Team Performance Management KPI Dashboard Infographics PDF single-slide PPT template. Whether you are a seasoned presenter or a newbie, our editable and visually-stunning template will make your presentations shine. This template is versatile and easy to use. Make your presentations unforgettable with our premium template and leave a lasting impression on your audience.
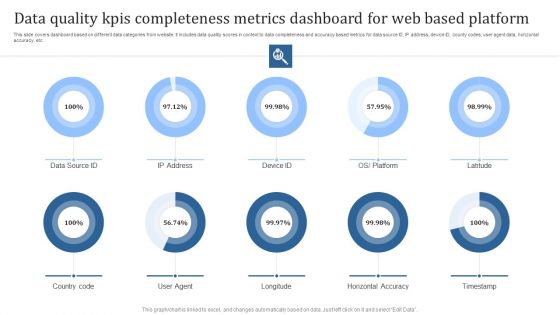
Data Quality Kpis Completeness Metrics Dashboard For Web Based Platform Graphics PDF
This slide covers dashboard based on different data categories from website. It includes data quality scores in context to data completeness and accuracy based metrics for data source ID, IP address, device ID, county codes, user agent data, horizontal accuracy, etc. Pitch your topic with ease and precision using this Data Quality Kpis Completeness Metrics Dashboard For Web Based Platform Graphics PDF. This layout presents information on Country Code, User Agent, Longitude. It is also available for immediate download and adjustment. So, changes can be made in the color, design, graphics or any other component to create a unique layout.
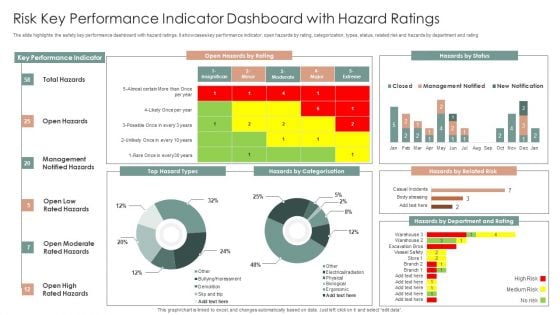
Risk Key Performance Indicator Dashboard With Hazard Ratings Ppt Layouts Slideshow PDF
The slide highlights the safety key performance dashboard with hazard ratings. It showcases key performance indicator, open hazards by rating, categorization, types, status, related risk and hazards by department and rating. Showcasing this set of slides titled Risk Key Performance Indicator Dashboard With Hazard Ratings Ppt Layouts Slideshow PDF. The topics addressed in these templates are Key Performance Indicator, Open Hazards, Hazards By Status. All the content presented in this PPT design is completely editable. Download it and make adjustments in color, background, font etc. as per your unique business setting.
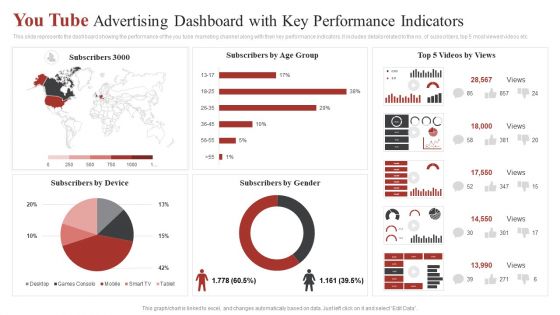
You Tube Advertising Dashboard With Key Performance Indicators Ppt Outline Graphics Example PDF
This slide represents the dashboard showing the performance of the you tube marketing channel along with their key performance indicators. It includes details related to the no. of subscribers, top 5 most viewed videos etc. Showcasing this set of slides titled You Tube Advertising Dashboard With Key Performance Indicators Ppt Outline Graphics Example PDF. The topics addressed in these templates are Subscribers Gender, Subscribers Age Group, Top 5 Videos. All the content presented in this PPT design is completely editable. Download it and make adjustments in color, background, font etc. as per your unique business setting.
Multiple Project Progress Tracking Report Dashboard With Key Performance Indicators Brochure PDF
This slide shows the dashboard representing status of various projects and tracking their performance with the help of key performance indicators which are as follows schedule, budget, resources, risk and issues and quality of projects.Pitch your topic with ease and precision using this Multiple Project Progress Tracking Report Dashboard With Key Performance Indicators Brochure PDF. This layout presents information on Risks Issues, Quality Open Defects, Techno Blogger. It is also available for immediate download and adjustment. So, changes can be made in the color, design, graphics or any other component to create a unique layout.
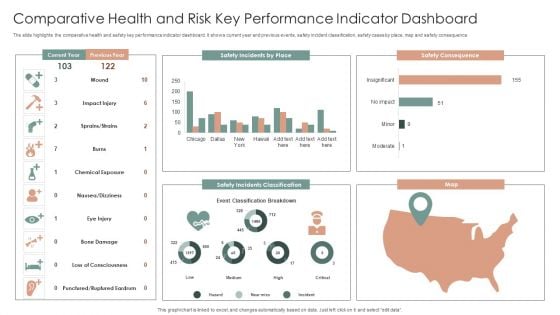
Comparative Health And Risk Key Performance Indicator Dashboard Ppt Portfolio Slide PDF
The slide highlights the comparative health and safety key performance indicator dashboard. It shows current year and previous events, safety incident classification, safety cases by place, map and safety consequence. Showcasing this set of slides titled Comparative Health And Risk Key Performance Indicator Dashboard Ppt Portfolio Slide PDF. The topics addressed in these templates are Safety Consequence, Safety Incidents Classification, Map. All the content presented in this PPT design is completely editable. Download it and make adjustments in color, background, font etc. as per your unique business setting.
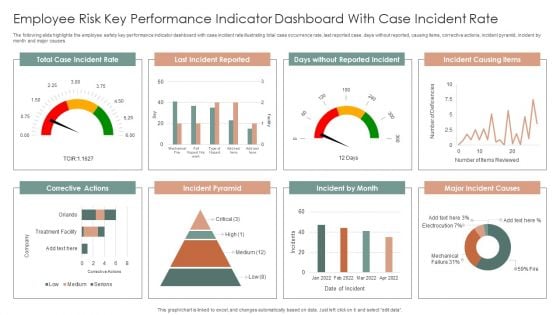
Employee Risk Key Performance Indicator Dashboard With Case Incident Rate Ppt Professional Information PDF
The following slide highlights the employee safety key performance indicator dashboard with case incident rate illustrating total case occurrence rate, last reported case, days without reported, causing items, corrective actions, incident pyramid, incident by month and major causes. Pitch your topic with ease and precision using this Employee Risk Key Performance Indicator Dashboard With Case Incident Rate Ppt Professional Information PDF. This layout presents information on Total Case, Incident Rate, Last Incident Reported, Incident Causing Items. It is also available for immediate download and adjustment. So, changes can be made in the color, design, graphics or any other component to create a unique layout.
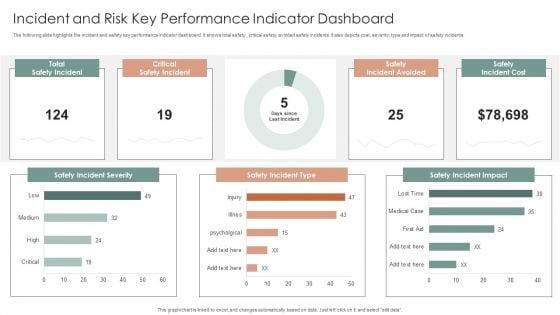
Incident And Risk Key Performance Indicator Dashboard Ppt Gallery Mockup PDF
The following slide highlights the incident and safety key performance indicator dashboard. It shows total safety, critical safety, avoided safety incidents. It also depicts cost, severity, type and impact of safety incidents. Showcasing this set of slides titled Incident And Risk Key Performance Indicator Dashboard Ppt Gallery Mockup PDF. The topics addressed in these templates are Safety Incident Severity, Safety Incident Type, Safety Incident Impact. All the content presented in this PPT design is completely editable. Download it and make adjustments in color, background, font etc. as per your unique business setting.
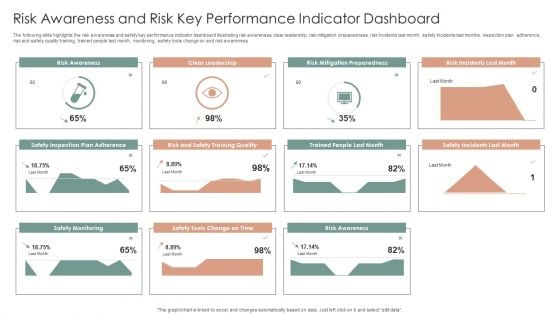
Risk Awareness And Risk Key Performance Indicator Dashboard Ppt Inspiration Ideas PDF
The following slide highlights the risk awareness and safety key performance indicator dashboard illustrating risk awareness, clear leadership, risk mitigation preparedness, risk incidents last month, safety incidents last months, inspection plan adherence, risk and safety quality training, trained people last month, monitoring, safety tools change on and risk awareness. Showcasing this set of slides titled Risk Awareness And Risk Key Performance Indicator Dashboard Ppt Inspiration Ideas PDF. The topics addressed in these templates are Safety Incident Avoided, Safety Incidents, Safety Incident, Accumulated Total. All the content presented in this PPT design is completely editable. Download it and make adjustments in color, background, font etc. as per your unique business setting.
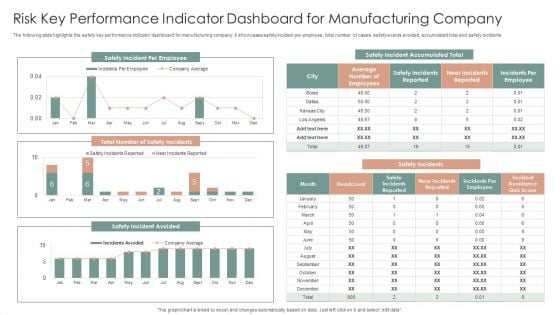
Risk Key Performance Indicator Dashboard For Manufacturing Company Ppt Gallery Graphics Design PDF
The following slide highlights the safety key performance indicator dashboard for manufacturing company. It showcases safety incident per employee, total number of cases, safety events avoided, accumulated total and safety incidents. Pitch your topic with ease and precision using this Risk Key Performance Indicator Dashboard For Manufacturing Company Ppt Gallery Graphics Design PDF. This layout presents information on Safety Incidents, Safety Incident Avoided, Safety Incident Accumulated. It is also available for immediate download and adjustment. So, changes can be made in the color, design, graphics or any other component to create a unique layout.
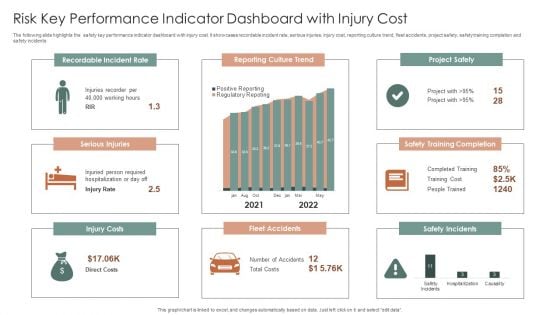
Risk Key Performance Indicator Dashboard With Injury Cost Ppt Summary Brochure PDF
The following slide highlights the safety key performance indicator dashboard with injury cost. It showcases recordable incident rate, serious injuries, injury cost, reporting culture trend, fleet accidents, project safety, safety training completion and safety incidents. Pitch your topic with ease and precision using this Risk Key Performance Indicator Dashboard With Injury Cost Ppt Summary Brochure PDF. This layout presents information on Recordable Incident Rate, Reporting Culture Trend, Project Safety. It is also available for immediate download and adjustment. So, changes can be made in the color, design, graphics or any other component to create a unique layout.
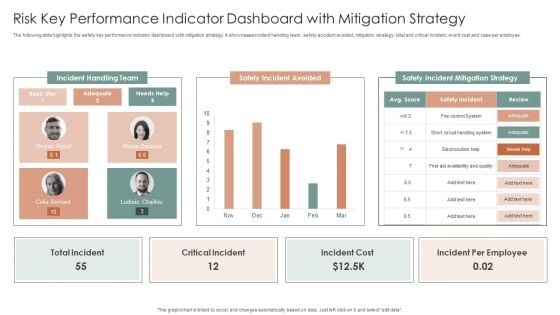
Risk Key Performance Indicator Dashboard With Mitigation Strategy Ppt Inspiration Design Templates PDF
The following slide highlights the safety key performance indicator dashboard with mitigation strategy. It showcases incident handling team, safety accident avoided, mitigation strategy, total and critical incident, event cost and case per employee. Showcasing this set of slides titled Risk Key Performance Indicator Dashboard With Mitigation Strategy Ppt Inspiration Design Templates PDF. The topics addressed in these templates are Incident Handling Team, Safety Incident Avoided, Safety Incident. All the content presented in this PPT design is completely editable. Download it and make adjustments in color, background, font etc. as per your unique business setting.
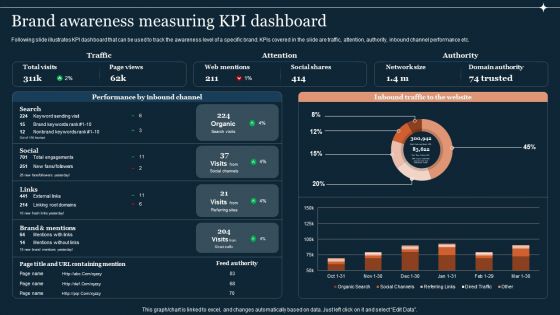
Guide To Develop And Estimate Brand Value Brand Awareness Measuring Kpi Dashboard Infographics PDF
Following slide illustrates KPI dashboard that can be used to track the awareness level of a specific brand. KPIs covered in the slide are traffic, attention, authority, inbound channel performance etc.From laying roadmaps to briefing everything in detail, our templates are perfect for you. You can set the stage with your presentation slides. All you have to do is download these easy-to-edit and customizable templates. Guide To Develop And Estimate Brand Value Brand Awareness Measuring Kpi Dashboard Infographics PDF will help you deliver an outstanding performance that everyone would remember and praise you for. Do download this presentation today.
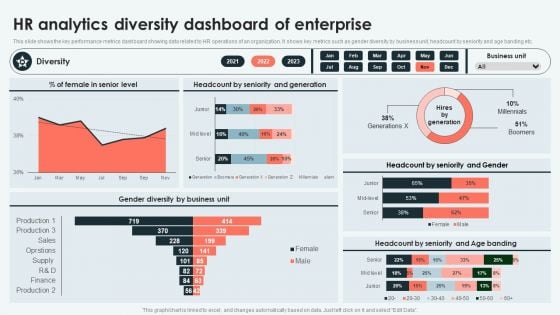
Analyzing And Deploying HR Analytics Diversity Dashboard Of Enterprise Inspiration PDF
This slide shows the key performance metrics dashboard showing data related to HR operations of an organization. It shows key metrics such as gender diversity by business unit, headcount by seniority and age banding etc. Want to ace your presentation in front of a live audience Our Analyzing And Deploying HR Analytics Diversity Dashboard Of Enterprise Inspiration PDF can help you do that by engaging all the users towards you. Slidegeeks experts have put their efforts and expertise into creating these impeccable powerpoint presentations so that you can communicate your ideas clearly. Moreover, all the templates are customizable, and easy-to-edit and downloadable. Use these for both personal and commercial use.
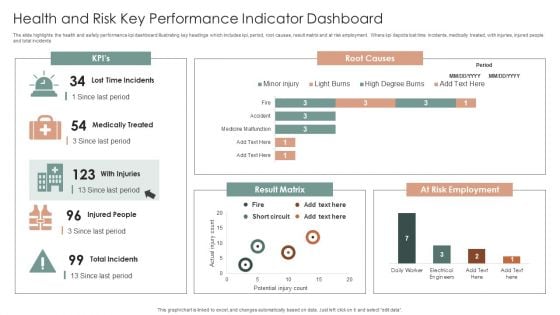
Health And Risk Key Performance Indicator Dashboard Ppt Layouts Graphics Design PDF
The slide highlights the health and safety performance kpi dashboard illustrating key headings which includes kpi, period, root causes, result matrix and at risk employment. Where kpi depicts lost time incidents, medically treated, with injuries, injured people and total incidents. Showcasing this set of slides titled Health And Risk Key Performance Indicator Dashboard Ppt Layouts Graphics Design PDF. The topics addressed in these templates are Root Causes, Result Matrix, At Risk Employment. All the content presented in this PPT design is completely editable. Download it and make adjustments in color, background, font etc. as per your unique business setting.
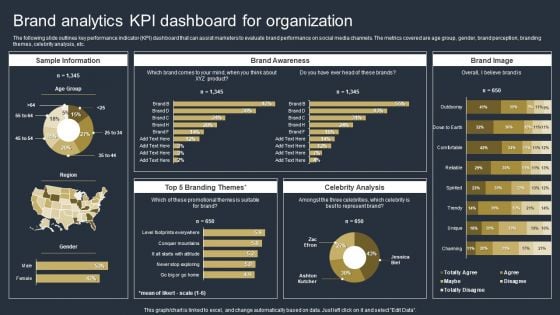
Comprehensive Market Research Guide Brand Analytics Kpi Dashboard For Organization Brochure PDF
The following slide outlines key performance indicator KPI dashboard that can assist marketers to evaluate brand performance on social media channels. The metrics covered are age group, gender, brand perception, branding themes, celebrity analysis, etc. From laying roadmaps to briefing everything in detail, our templates are perfect for you. You can set the stage with your presentation slides. All you have to do is download these easy-to-edit and customizable templates. Comprehensive Market Research Guide Brand Analytics Kpi Dashboard For Organization Brochure PDF will help you deliver an outstanding performance that everyone would remember and praise you for. Do download this presentation today.
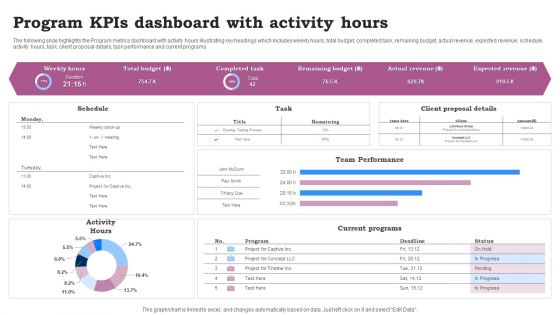
Program Kpis Dashboard With Activity Hours Ppt Infographics Clipart Images PDF
The following slide highlights the Program metrics dashboard with activity hours illustrating key headings which includes weekly hours, total budget, completed task, remaining budget, actual revenue, expected revenue, schedule, activity hours, task, client proposal details, task performance and current programs. Pitch your topic with ease and precision using this Program Kpis Dashboard With Activity Hours Ppt Infographics Clipart Images PDF. This layout presents information on Team Performance, Current Programs, Activity Hours. It is also available for immediate download and adjustment. So, changes can be made in the color, design, graphics or any other component to create a unique layout.
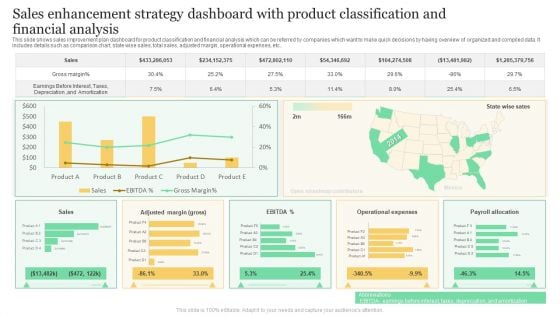
Sales Enhancement Strategy Dashboard With Product Classification And Financial Analysis Formats PDF
This slide shows sales improvement plan dashboard for product classification and financial analysis which can be referred by companies which want to make quick decisions by having overview of organized and compiled data. It includes details such as comparison chart, state wise sales, total sales, adjusted margin, operational expenses, etc. Showcasing this set of slides titled Sales Enhancement Strategy Dashboard With Product Classification And Financial Analysis Formats PDF. The topics addressed in these templates are Gross Margin, Sales, Operational Expenses. All the content presented in this PPT design is completely editable. Download it and make adjustments in color, background, font etc. as per your unique business setting.
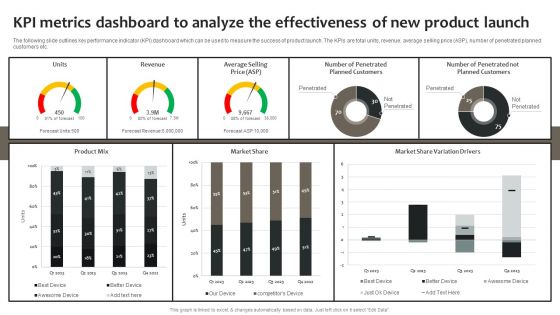
Effective Online And Offline Promotional Kpi Metrics Dashboard To Analyze The Effectiveness Of New Portrait PDF
The following slide outlines key performance indicator KPI dashboard which can be used to measure the success of product launch. The KPIs are total units, revenue, average selling price ASP, number of penetrated planned customers etc. From laying roadmaps to briefing everything in detail, our templates are perfect for you. You can set the stage with your presentation slides. All you have to do is download these easy-to-edit and customizable templates. Effective Online And Offline Promotional Kpi Metrics Dashboard To Analyze The Effectiveness Of New Portrait PDF will help you deliver an outstanding performance that everyone would remember and praise you for. Do download this presentation today.
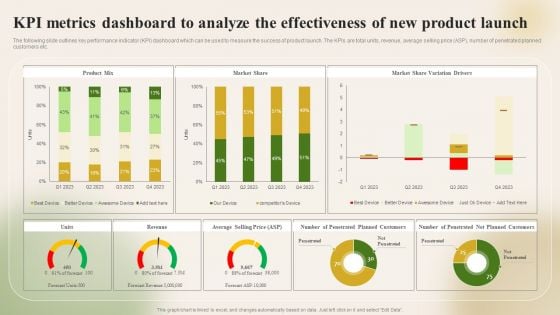
KPI Metrics Dashboard To Analyze The Effectiveness Of New Introducing New Food Pictures PDF
The following slide outlines key performance indicator KPI dashboard which can be used to measure the success of product launch. The KPIs are total units, revenue, average selling price ASP, number of penetrated planned customers etc. Make sure to capture your audiences attention in your business displays with our gratis customizable KPI Metrics Dashboard To Analyze The Effectiveness Of New Introducing New Food Pictures PDF. These are great for business strategies, office conferences, capital raising or task suggestions. If you desire to acquire more customers for your tech business and ensure they stay satisfied, create your own sales presentation with these plain slides.
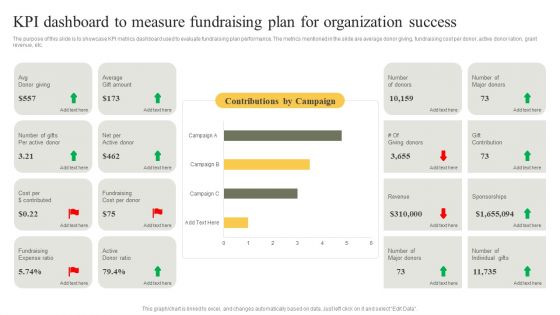
KPI Dashboard To Measure Fundraising Plan For Organization Success Infographics PDF
The purpose of this slide is to showcase KPI metrics dashboard used to evaluate fundraising plan performance. The metrics mentioned in the slide are average donor giving, fundraising cost per donor, active donor ration, grant revenue, etc. Showcasing this set of slides titled KPI Dashboard To Measure Fundraising Plan For Organization Success Infographics PDF. The topics addressed in these templates are Fundraising Cost, Average, Ratio. All the content presented in this PPT design is completely editable. Download it and make adjustments in color, background, font etc. as per your unique business setting.
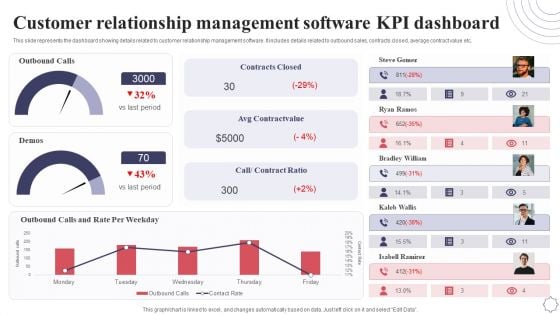
Customer Relationship Management Software KPI Dashboard Application Deployment Project Plan Infographics PDF
This slide represents the dashboard showing details related to customer relationship management software. It includes details related to outbound sales, contracts closed, average contract value etc. From laying roadmaps to briefing everything in detail, our templates are perfect for you. You can set the stage with your presentation slides. All you have to do is download these easy to edit and customizable templates. Customer Relationship Management Software KPI Dashboard Application Deployment Project Plan Infographics PDF will help you deliver an outstanding performance that everyone would remember and praise you for. Do download this presentation today.
Google Keyword Assessment KPI Dashboard For Tracking Improvement In Website Traffic Infographics PDF
Following slide demonstrates keyword analysis dashboard which can be used by business to track website traffic performance. It includes metrics such as average keyword position, keyword ranking distribution, keyword ranking, keyword in top 3, top 10, top 20 and top 100. Showcasing this set of slides titled Google Keyword Assessment KPI Dashboard For Tracking Improvement In Website Traffic Infographics PDF. The topics addressed in these templates are Keyword Ranking, Keyword Ranking Distribution, Average Keyword Position. All the content presented in this PPT design is completely editable. Download it and make adjustments in color, background, font etc. as per your unique business setting.
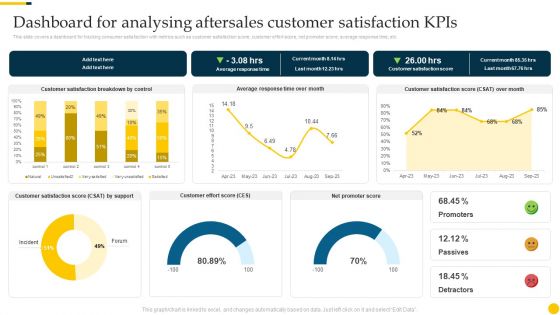
Increasing Customer Dashboard For Analysing Aftersales Customer Satisfaction Kpis Elements PDF
This slide covers a dashboard for tracking consumer satisfaction with metrics such as customer satisfaction score, customer effort score, net promoter score, average response time, etc. The Increasing Customer Dashboard For Analysing Aftersales Customer Satisfaction Kpis Elements PDF is a compilation of the most recent design trends as a series of slides. It is suitable for any subject or industry presentation, containing attractive visuals and photo spots for businesses to clearly express their messages. This template contains a variety of slides for the user to input data, such as structures to contrast two elements, bullet points, and slides for written information. Slidegeeks is prepared to create an impression.
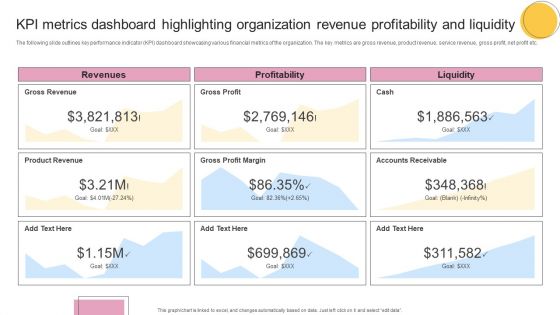
KPI Metrics Dashboard Highlighting Organization Revenue Profitability And Liquidity Formats PDF
The following slide outlines key performance indicator KPI dashboard showcasing various financial metrics of the organization. The key metrics are gross revenue, product revenue, service revenue, gross profit, net profit etc. From laying roadmaps to briefing everything in detail, our templates are perfect for you. You can set the stage with your presentation slides. All you have to do is download these easy to edit and customizable templates. KPI Metrics Dashboard Highlighting Organization Revenue Profitability And Liquidity Formats PDF will help you deliver an outstanding performance that everyone would remember and praise you for. Do download this presentation today.
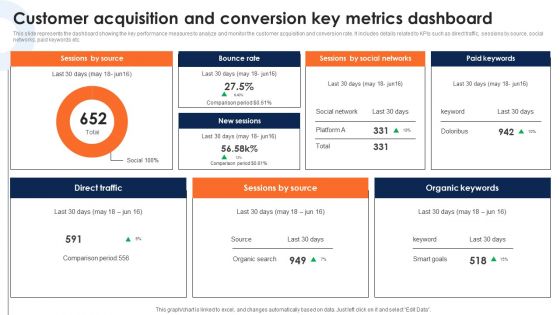
Customer Acquisition And Conversion Key Metrics Dashboard Deploying Ecommerce Order Management Sample PDF
This slide represents the dashboard showing the key performance measures to analyze and monitor the customer acquisition and conversion rate. It includes details related to KPIs such as direct traffic, sessions by source, social networks, paid keywords etc.From laying roadmaps to briefing everything in detail, our templates are perfect for you. You can set the stage with your presentation slides. All you have to do is download these easy-to-edit and customizable templates. Customer Acquisition And Conversion Key Metrics Dashboard Deploying Ecommerce Order Management Sample PDF will help you deliver an outstanding performance that everyone would remember and praise you for. Do download this presentation today.
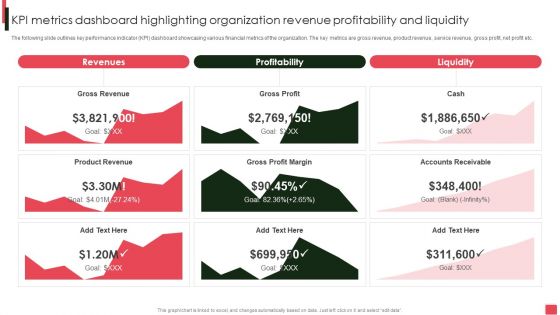
Overview Of Organizational Kpi Metrics Dashboard Highlighting Organization Revenue Brochure PDF
The following slide outlines key performance indicator KPI dashboard showcasing various financial metrics of the organization. The key metrics are gross revenue, product revenue, service revenue, gross profit, net profit etc. If your project calls for a presentation, then Slidegeeks is your go-to partner because we have professionally designed, easy-to-edit templates that are perfect for any presentation. After downloading, you can easily edit Overview Of Organizational Kpi Metrics Dashboard Highlighting Organization Revenue Brochure PDF and make the changes accordingly. You can rearrange slides or fill them with different images. Check out all the handy templates.
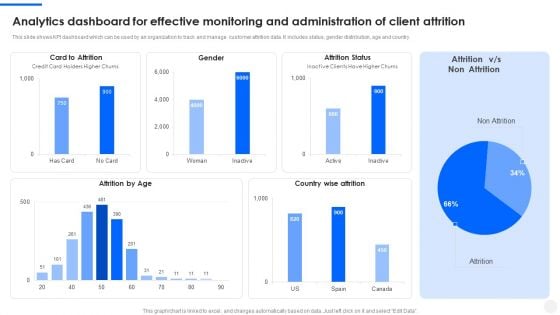
Analytics Dashboard For Effective Monitoring And Administration Of Client Attrition Portrait PDF
This slide shows KPI dashboard which can be used by an organization to track and manage customer attrition data. It includes status, gender distribution, age and country. Showcasing this set of slides titled Analytics Dashboard For Effective Monitoring And Administration Of Client Attrition Portrait PDF. The topics addressed in these templates are Attrition Status, Card To Attrition, Country Wise Attrition. All the content presented in this PPT design is completely editable. Download it and make adjustments in color, background, font etc. as per your unique business setting.
Social Media Marketing Strategies To Generate Lead Dashboard For Tracking Social Media Kpis Summary PDF
This slide shows dashboard for tracking social media key performance indicators KPIs. It provides details about average social engagement, reactions, comments, shares, clicks, thumbnail, platform, post message, etc. Want to ace your presentation in front of a live audience Our Social Media Marketing Strategies To Generate Lead Dashboard For Tracking Social Media Kpis Summary PDF can help you do that by engaging all the users towards you. Slidegeeks experts have put their efforts and expertise into creating these impeccable powerpoint presentations so that you can communicate your ideas clearly. Moreover, all the templates are customizable, and easy to edit and downloadable. Use these for both personal and commercial use.
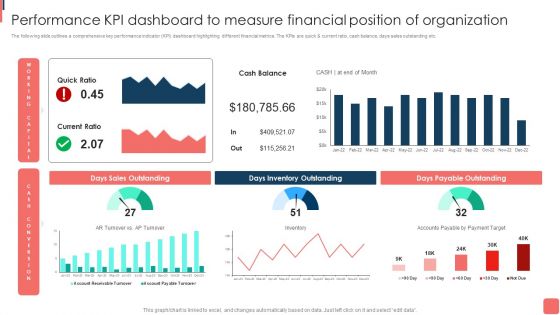
Effective Financial Planning Assessment Techniques Performance Kpi Dashboard To Measure Financial Graphics PDF
The following slide outlines a comprehensive key performance indicator KPI dashboard highlighting different financial metrics. The KPIs are quick and current ratio, cash balance, days sales outstanding etc. The best PPT templates are a great way to save time, energy, and resources. Slidegeeks have 100 precent editable powerpoint slides making them incredibly versatile. With these quality presentation templates, you can create a captivating and memorable presentation by combining visually appealing slides and effectively communicating your message. Download Effective Financial Planning Assessment Techniques Performance Kpi Dashboard To Measure Financial Graphics PDF from Slidegeeks and deliver a wonderful presentation.
Online Customer Interaction Dashboard For Tracking Customer Service Team Performance Infographics PDF
This slide covers the KPI dashboard for analyzing the performance of client support department. It includes metrics such as first call resolution, unresolved calls, average response rate, the best day to call, average time to solve issues, etc. Deliver and pitch your topic in the best possible manner with this Online Customer Interaction Dashboard For Tracking Customer Service Team Performance Infographics PDF. Use them to share invaluable insights on Response Time, Issue Solving, Call Resolution and impress your audience. This template can be altered and modified as per your expectations. So, grab it now.
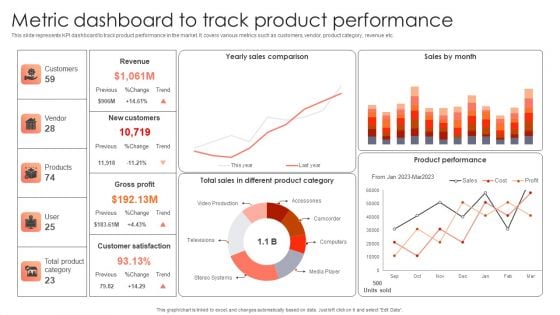
Management Plan For Product Life Cycle Metric Dashboard To Track Product Performance Infographics PDF
This slide represents KPI dashboard to track product performance in the market. It covers various metrics such as customers, vendor, product category, revenue etc. Slidegeeks has constructed Management Plan For Product Life Cycle Metric Dashboard To Track Product Performance Infographics PDF after conducting extensive research and examination. These presentation templates are constantly being generated and modified based on user preferences and critiques from editors. Here, you will find the most attractive templates for a range of purposes while taking into account ratings and remarks from users regarding the content. This is an excellent jumping-off point to explore our content and will give new users an insight into our top-notch PowerPoint Templates.
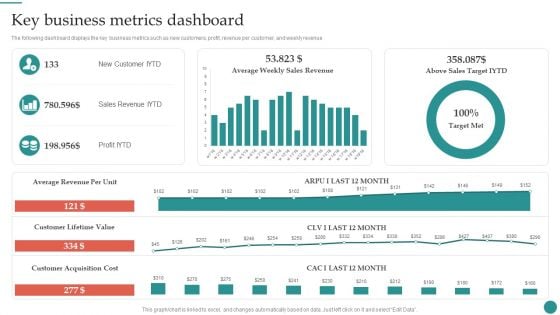
Key Business Metrics Dashboard Company Process Administration And Optimization Playbook Infographics PDF
The following dashboard displays the key business metrics such as new customers, profit, revenue per customer, and weekly revenue. Slidegeeks is here to make your presentations a breeze with Key Business Metrics Dashboard Company Process Administration And Optimization Playbook Infographics PDF With our easy-to-use and customizable templates, you can focus on delivering your ideas rather than worrying about formatting. With a variety of designs to choose from, you are sure to find one that suits your needs. And with animations and unique photos, illustrations, and fonts, you can make your presentation pop. So whether you are giving a sales pitch or presenting to the board, make sure to check out Slidegeeks first.
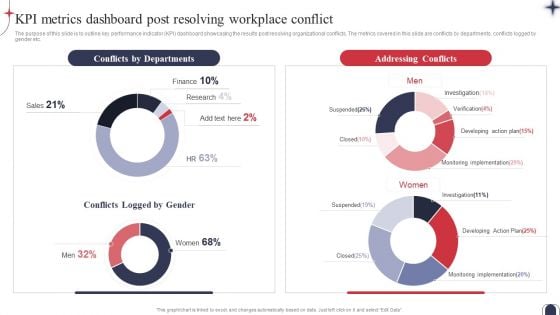
Workplace Conflict Resolution KPI Metrics Dashboard Post Resolving Workplace Designs PDF
The purpose of this slide is to outline key performance indicator KPI dashboard showcasing the results post resolving organizational conflicts. The metrics covered in this slide are conflicts by departments, conflicts logged by gender etc. The best PPT templates are a great way to save time, energy, and resources. Slidegeeks have 100 percent editable powerpoint slides making them incredibly versatile. With these quality presentation templates, you can create a captivating and memorable presentation by combining visually appealing slides and effectively communicating your message. Download Workplace Conflict Resolution KPI Metrics Dashboard Post Resolving Workplace Designs PDF from Slidegeeks and deliver a wonderful presentation.
Intelligence Amplification IA IT Augmented Intelligence Information Tracking Dashboard Topics PDF
This slide depicts the information tracking dashboard by augmented intelligence model covering the data analysis. Data analysis includes image analysis, storage size, new users on the cloud platform, etc. Want to ace your presentation in front of a live audience Our Intelligence Amplification IA IT Augmented Intelligence Information Tracking Dashboard Topics PDF can help you do that by engaging all the users towards you.. Slidegeeks experts have put their efforts and expertise into creating these impeccable powerpoint presentations so that you can communicate your ideas clearly. Moreover, all the templates are customizable, and easy-to-edit and downloadable. Use these for both personal and commercial use.
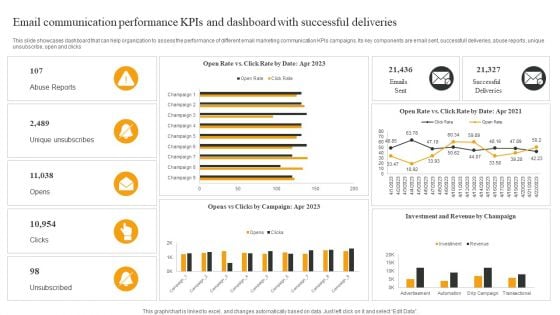
Email Communication Performance Kpis And Dashboard With Successful Deliveries Elements PDF
This slide showcases dashboard that can help organization to assess the performance of different email marketing communication KPIs campaigns. Its key components are email sent, successfull deliveries, abuse reports, unique unsubscribe, open and clicks. Showcasing this set of slides titled Email Communication Performance Kpis And Dashboard With Successful Deliveries Elements PDF. The topics addressed in these templates are Abuse Reports, Unique Unsubscribes, Opens. All the content presented in this PPT design is completely editable. Download it and make adjustments in color, background, font etc. as per your unique business setting.
Dashboard For Risk Communication Strategies Planning And Key Metrics Tracking Brochure PDF Ideas PDF
This slide shows dashboard for planning risk communication and tracking key metrics which includes heat map of risk, classification, objectives, effectiveness, critical risks, etc. Showcasing this set of slides titled Dashboard For Risk Communication Strategies Planning And Key Metrics Tracking Brochure PDF Ideas PDF. The topics addressed in these templates are Risk Heat Map, Tactical Objectives, Controls Effectiveness. All the content presented in this PPT design is completely editable. Download it and make adjustments in color, background, font etc. as per your unique business setting.
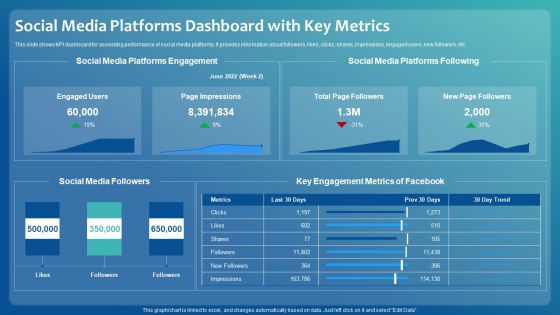
Improving Digital Community Engagement Strategy Social Media Platforms Dashboard With Key Metrics Professional PDF
This slide shows KPI dashboard for assessing performance of social media platforms. It provides information about followers, likes, clicks, shares, impressions, engaged users, new followers, etc. Deliver and pitch your topic in the best possible manner with this Improving Digital Community Engagement Strategy Social Media Platforms Dashboard With Key Metrics Professional PDF. Use them to share invaluable insights on Social Media Platforms Engagement, Key Engagement Metrics and impress your audience. This template can be altered and modified as per your expectations. So, grab it now.
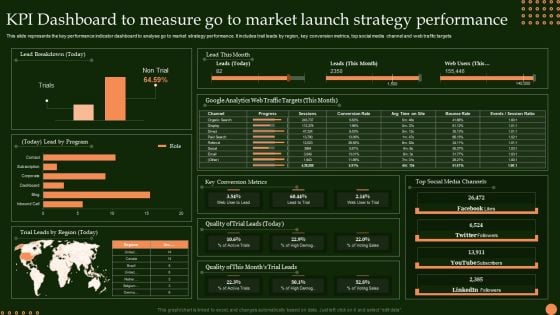
KPI Dashboard To Measure Go To Market Launch Strategy Performance Sample PDF
This slide represents the key performance indicator dashboard to analyse go to market strategy performance. It includes trail leads by region, key conversion metrics, top social media channel and web traffic targets Pitch your topic with ease and precision using this KPI Dashboard To Measure Go To Market Launch Strategy Performance Sample PDF. This layout presents information on Lead Breakdown, Lead By Program, Trial Leads Region. It is also available for immediate download and adjustment. So, changes can be made in the color, design, graphics or any other component to create a unique layout.
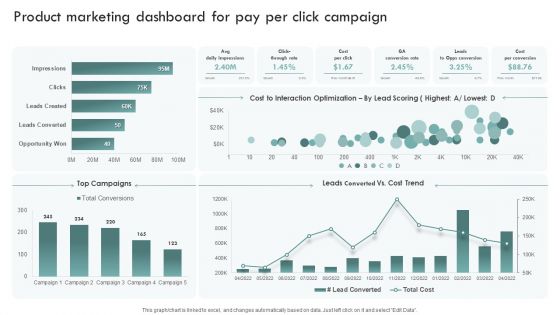
Brand Awareness Plan Product Marketing Dashboard For Pay Per Click Campaign Template PDF
This graph or chart is linked to excel, and changes automatically based on data. Just left click on it and select Edit Data. Get a simple yet stunning designed Brand Awareness Plan Product Marketing Dashboard For Pay Per Click Campaign Template PDF. It is the best one to establish the tone in your meetings. It is an excellent way to make your presentations highly effective. So, download this PPT today from Slidegeeks and see the positive impacts. Our easy-to-edit Brand Awareness Plan Product Marketing Dashboard For Pay Per Click Campaign Template PDF can be your go-to option for all upcoming conferences and meetings. So, what are you waiting for Grab this template today.

Info Security Compliance Dashboard Of Information Security Ppt PowerPoint Presentation File Graphics Download PDF
This slide depicts the cyber security compliance report on how data and hardware are monitored in different categories such as standard, regulation, and asset type control. Deliver an awe inspiring pitch with this creative info security compliance dashboard of information security ppt powerpoint presentation file graphics download pdf bundle. Topics like compliance dashboard, asset type control, control issues by standard, control issues by regulation can be discussed with this completely editable template. It is available for immediate download depending on the needs and requirements of the user.
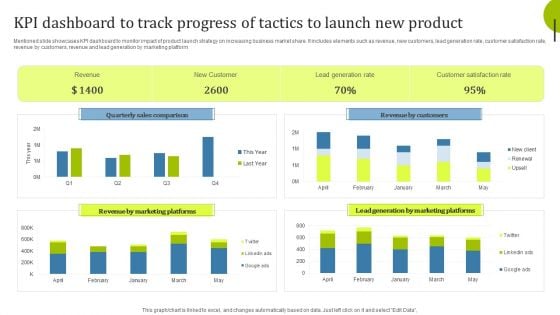
Kpi Dashboard To Track Progress Of Tactics To Launch New Product Infographics PDF
Mentioned slide showcases KPI dashboard to monitor impact of product launch strategy on increasing business market share. It includes elements such as revenue, new customers, lead generation rate, customer satisfaction rate, revenue by customers, revenue and lead generation by marketing platform. Showcasing this set of slides titled Kpi Dashboard To Track Progress Of Tactics To Launch New Product Infographics PDF. The topics addressed in these templates are Quarterly Sales Comparison, Revenue Marketing, Revenue Customers. All the content presented in this PPT design is completely editable. Download it and make adjustments in color, background, font etc. as per your unique business setting.
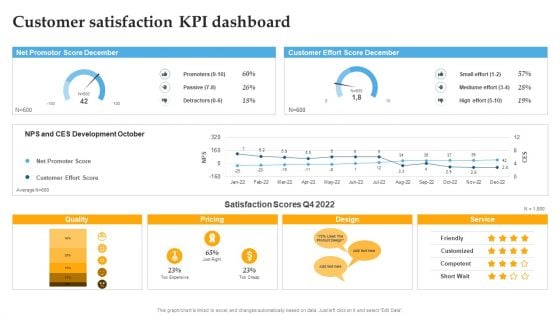
Customer Satisfaction Kpi Dashboard Comprehensive Personal Brand Building Guide For Social Media Influencers Sample PDF
Are you searching for a atisfaction Kpi Dashboard Comprehensive Personal Brand Building Guide For Social Media Influencers Sample PDF that is uncluttered, straightforward, and original Its easy to edit, and you can change the colors to suit your personal or business branding. For a presentation that expresses how much effort you have put in, this template is ideal With all of its features, including tables, diagrams, statistics, and lists, its perfect for a business plan presentation. Make your ideas more appealing with these professional slides. Download atisfaction Kpi Dashboard Comprehensive Personal Brand Building Guide For Social Media Influencers Sample PDF from Slidegeeks today.
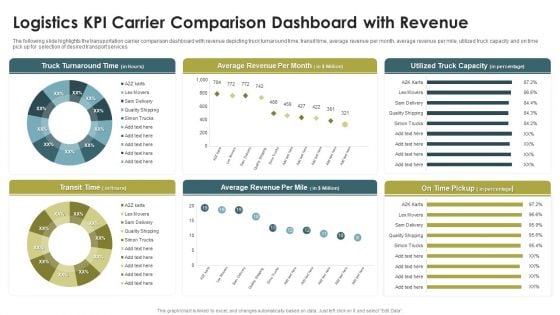
Logistics KPI Carrier Comparison Dashboard With Revenue Ppt Infographics Portfolio PDF
The following slide highlights the transportation carrier comparison dashboard with revenue depicting truck turnaround time, transit time, average revenue per month, average revenue per mile, utilized truck capacity and on time pick up for selection of desired transport services. Pitch your topic with ease and precision using this Logistics KPI Carrier Comparison Dashboard With Revenue Ppt Infographics Portfolio PDF. This layout presents information on Truck Turnaround Time, Average Revenue, Per Month, Transit Time. It is also available for immediate download and adjustment. So, changes can be made in the color, design, graphics or any other component to create a unique layout.

 Home
Home