Dashboard Stock Market
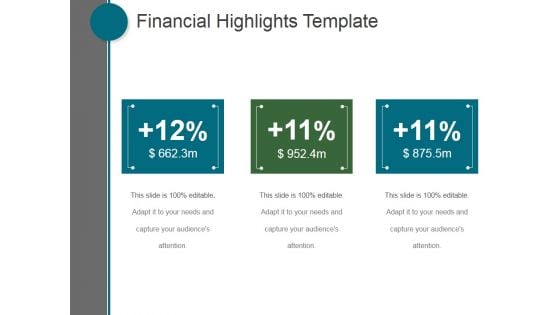
Financial Highlights Template Ppt PowerPoint Presentation Influencers
This is a financial highlights template ppt powerpoint presentation influencers. This is a three stage process. The stages in this process are business, marketing, management, finance, strategy.
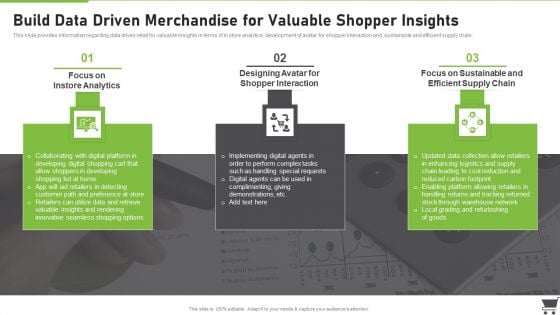
Merchandise Playbook Build Data Driven Merchandise For Valuable Shopper Insights Professional PDF
This is a Merchandise Playbook Build Data Driven Merchandise For Valuable Shopper Insights Professional PDF template with various stages. Focus and dispense information on three stages using this creative set, that comes with editable features. It contains large content boxes to add your information on topics like Focus Instore Analytics, Designing Avatar Shopper, Interaction Focus Sustainable. You can also showcase facts, figures, and other relevant content using this PPT layout. Grab it now.
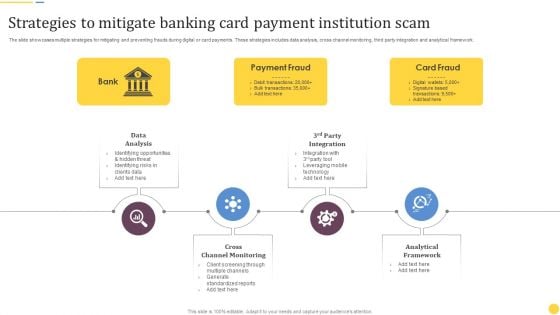
Strategies To Mitigate Banking Card Payment Institution Scam Background PDF
The slide showcases multiple strategies for mitigating and preventing frauds during digital or card payments. These strategies includes data analysis, cross channel monitoring, third party integration and analytical framework. Persuade your audience using this Strategies To Mitigate Banking Card Payment Institution Scam Background PDF. This PPT design covers four stages, thus making it a great tool to use. It also caters to a variety of topics including Bank, Payment Fraud, Card Fraud, Data Analysis. Download this PPT design now to present a convincing pitch that not only emphasizes the topic but also showcases your presentation skills
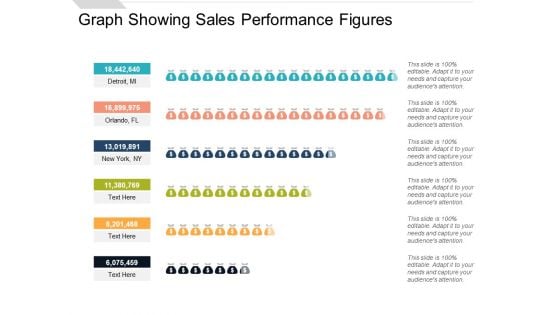
Graph Showing Sales Performance Figures Ppt PowerPoint Presentation Infographics Topics
Presenting this set of slides with name graph showing sales performance figures ppt powerpoint presentation infographics topics. This is a six stage process. The stages in this process are people graph, sales performance, population data demographics. This is a completely editable PowerPoint presentation and is available for immediate download. Download now and impress your audience.
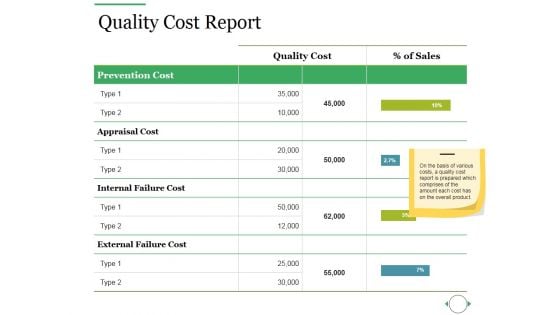
Quality Cost Report Ppt PowerPoint Presentation Outline Layout
This is a quality cost report ppt powerpoint presentation outline layout. This is a five stage process. The stages in this process are business, finance, marketing, strategy, analysis.
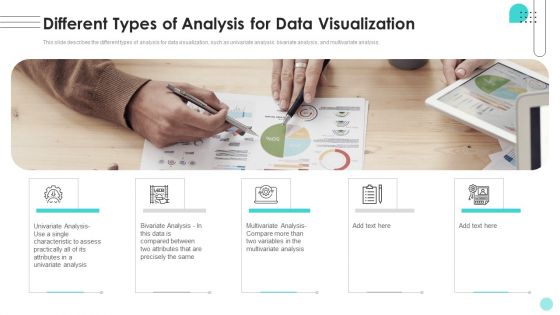
Branches For Visualization Research And Development Different Types Of Analysis Clipart PDF
This slide describes the different types of analysis for data visualization, such as univariate analysis, bivariate analysis, and multivariate analysis. Present like a pro with Branches For Visualization Research And Development Different Types Of Analysis Clipart PDF Create beautiful presentations together with your team, using our easy-to-use presentation slides. Share your ideas in real-time and make changes on the fly by downloading our templates. So whether youre in the office, on the go, or in a remote location, you can stay in sync with your team and present your ideas with confidence. With Slidegeeks presentation got a whole lot easier. Grab these presentations today.
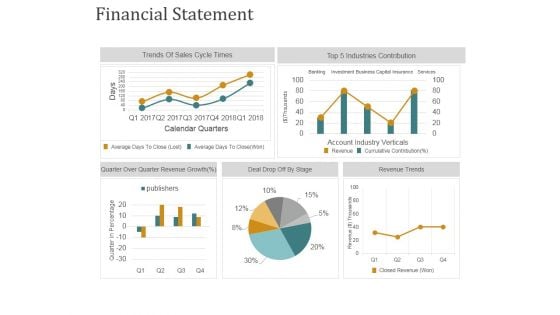
Financial Statement Ppt PowerPoint Presentation Outline File Formats
This is a financial statement ppt powerpoint presentation outline file formats. This is a five stage process. The stages in this process are trends of sales cycle times, quarter over quarter revenue growth, revenue trends, deal drop off by stage.

Financial Industry Data Ppt PowerPoint Presentation Outline Samples
This is a financial industry data ppt powerpoint presentation outline samples. This is a seven stage process. The stages in this process are financial industry data.
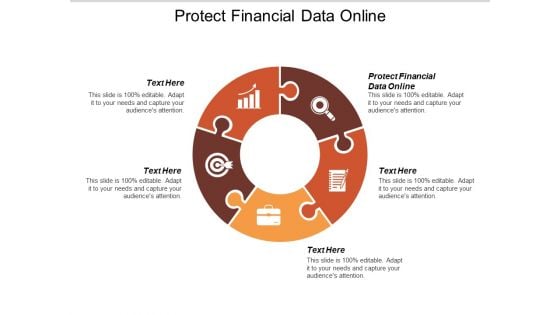
Protect Financial Data Online Ppt PowerPoint Presentation Ideas Graphics
This is a protect financial data online ppt powerpoint presentation ideas graphics. This is a five stage process. The stages in this process are protect financial data online.
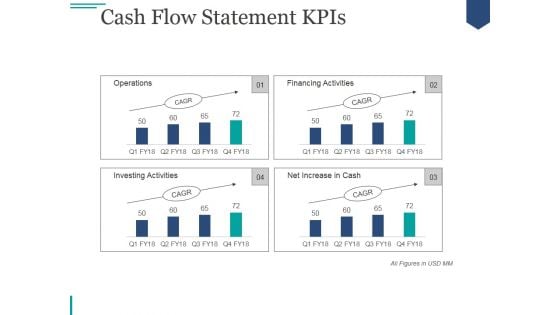
Cash Flow Statement Kpis Ppt PowerPoint Presentation Deck
This is a cash flow statement kpis ppt powerpoint presentation deck. This is a four stage process. The stages in this process are operations, financing activities, investing activities, net increase in cash.

Customer Service Kpis Template 2 Ppt PowerPoint Presentation Show Structure
This is a customer service kpis template 2 ppt powerpoint presentation show structure. This is a four stage process. The stages in this process are tickets by week, tickets by group, tickets by time of the day, tickets by medium.
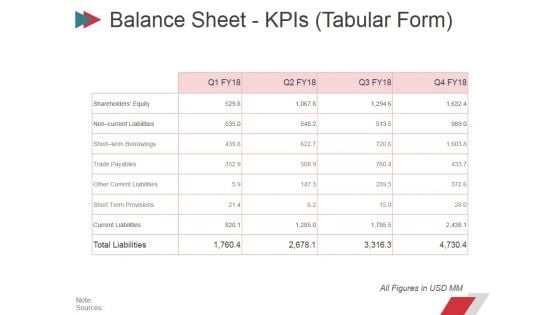
Balance Sheet Kpis Tabular Form Ppt PowerPoint Presentation Professional Display
This is a balance sheet kpis tabular form ppt powerpoint presentation professional display. This is a four stage process. The stages in this process are current assets, current liabilities, total assets, total liabilities.
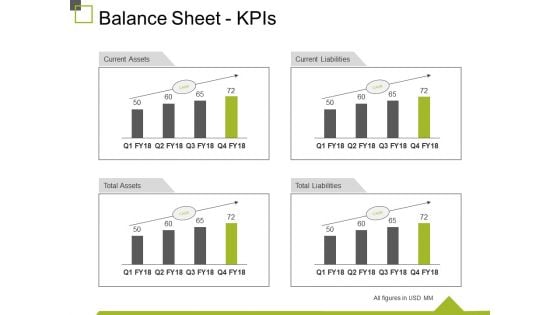
Balance Sheet Kpis Ppt PowerPoint Presentation Visual Aids Inspiration
This is a balance sheet kpis ppt powerpoint presentation visual aids inspiration. This is a four stage process. The stages in this process are current assets, current liabilities, total liabilities, total assets, business.
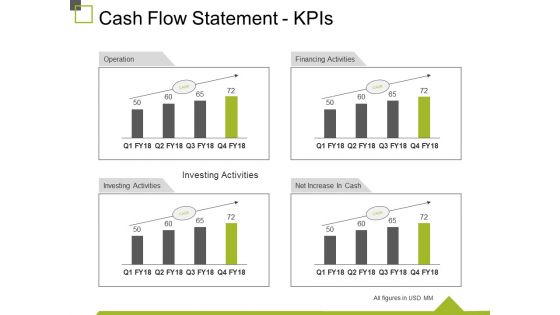
Cash Flow Statement Kpis Ppt PowerPoint Presentation Ideas Graphics
This is a cash flow statement kpis ppt powerpoint presentation ideas graphics. This is a four stage process. The stages in this process are operation, financing activities, net increase in cash, investing activities, business.
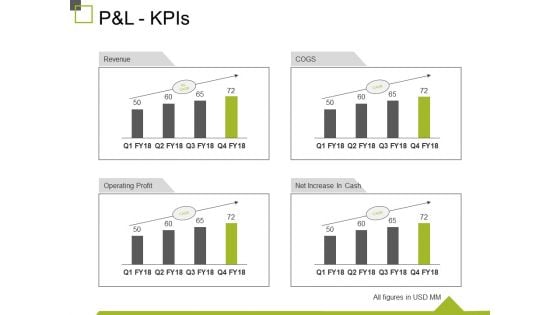
P And L Kpis Ppt PowerPoint Presentation Show Design Inspiration
This is a p and l kpis ppt powerpoint presentation show design inspiration. This is a four stage process. The stages in this process are revenue, operating profit, cogs, net increase in cash, business.
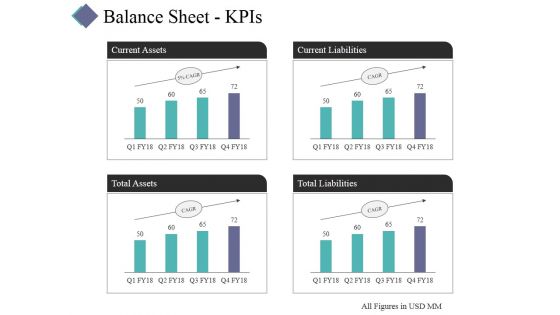
Balance Sheet Kpis Template 2 Ppt PowerPoint Presentation Ideas Show
This is a balance sheet kpis template 2 ppt powerpoint presentation ideas show. This is a four stage process. The stages in this process are current assets, total assets, total liabilities, current liabilities.
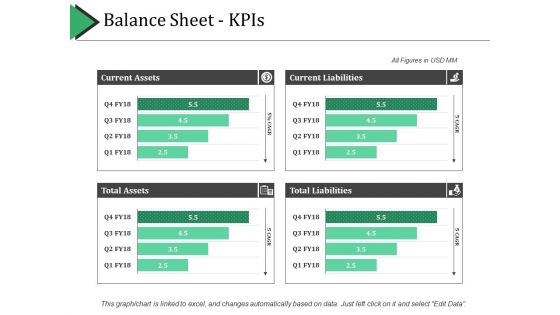
Balance Sheet Kpis Template 1 Ppt PowerPoint Presentation Pictures Grid
This is a balance sheet kpis template 1 ppt powerpoint presentation pictures grid. This is a four stage process. The stages in this process are current assets, current liabilities, total assets, total liabilities.
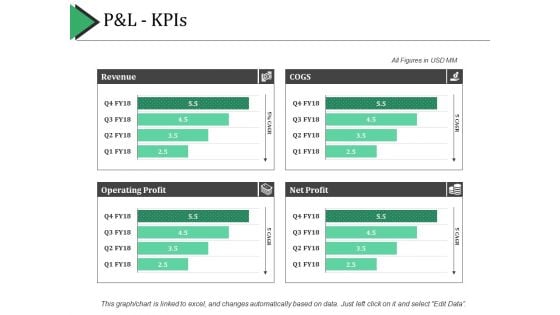
P And L Kpis Ppt PowerPoint Presentation Show Example Introduction
This is a p and l kpis ppt powerpoint presentation show example introduction. This is a four stage process. The stages in this process are revenue, cogs, net profit, operating profit.
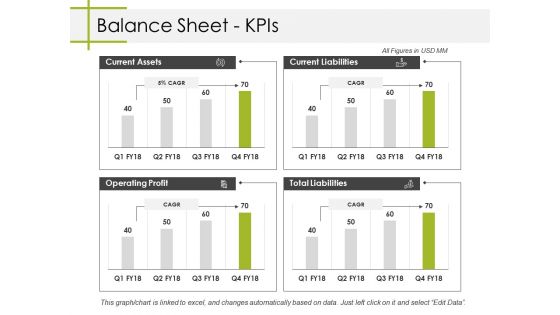
Balance Sheet Kpis Ppt PowerPoint Presentation Summary Designs Download
This is a balance sheet kpis ppt powerpoint presentation summary designs download. This is a four stage process. The stages in this process are current assets, current liabilities, total liabilities, operating profit, business.
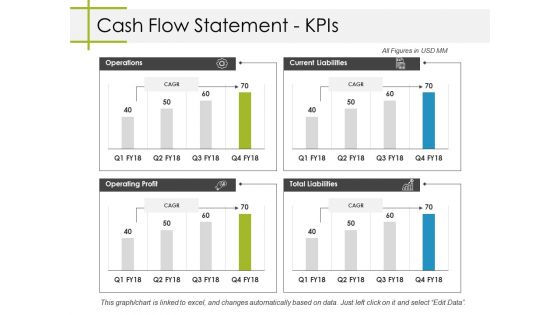
Cash Flow Statement Kpis Ppt PowerPoint Presentation Styles Themes
This is a cash flow statement kpis ppt powerpoint presentation styles themes. This is a four stage process. The stages in this process are business, operations, operating profit, total liabilities, current liabilities.
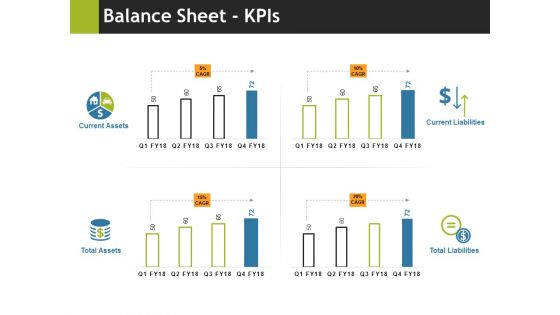
Balance Sheet Kpis Ppt PowerPoint Presentation Slides Download
This is a balance sheet kpis ppt powerpoint presentation slides download. This is a four stage process. The stages in this process are current assets, total assets, current liabilities, total liabilities, business.
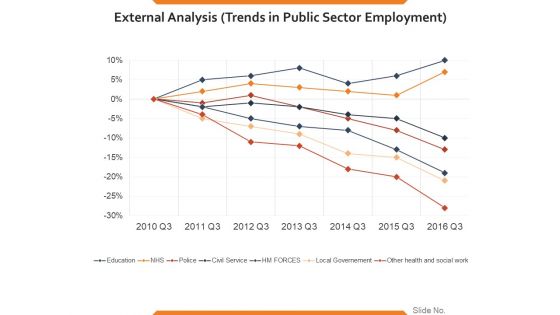
External Analysis Trends In Public Sector Employment Ppt PowerPoint Presentation Slides Templates
This is a external analysis trends in public sector employment ppt powerpoint presentation slides templates. This is a seven stage process. The stages in this process are percentage, growth, business, marketing, strategy.
Future Trends In Multi Channel Retailing Ppt Powerpoint Presentation Styles Icon
This is a future trends in multi channel retailing ppt powerpoint presentation styles icon. This is a four stage process. The stages in this process are finance, marketing, management, investment, analysis.
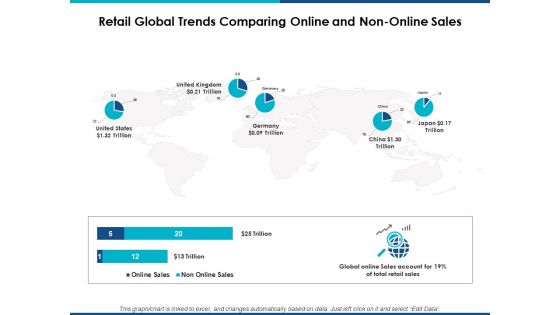
Retail Global Trends Comparing Online And Non Online Sales Ppt Powerpoint Presentation Tips
This is a retail global trends comparing online and non online sales ppt powerpoint presentation tips. This is a five stage process. The stages in this process are finance, marketing, management, investment, analysis.
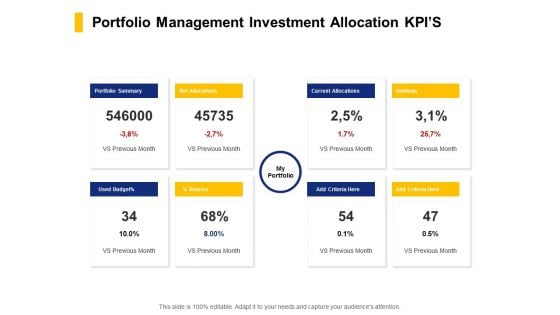
Portfolio Management Investment Allocation KPIS Ppt PowerPoint Presentation Styles Grid
Presenting this set of slides with name portfolio management investment allocation kpis ppt powerpoint presentation styles grid. This is a eight stage process. The stages in this process are portfolio summary, current allocations, net allocations. This is a completely editable PowerPoint presentation and is available for immediate download. Download now and impress your audience.
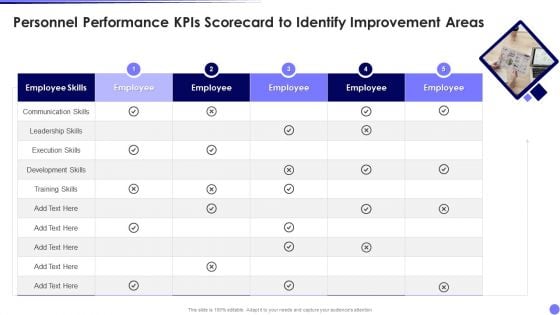
Personnel Performance Kpis Scorecard To Identify Improvement Areas Diagrams PDF
Persuade your audience using this Personnel Performance Kpis Scorecard To Identify Improvement Areas Diagrams PDF. This PPT design covers five stages, thus making it a great tool to use. It also caters to a variety of topics including Employee Skills, Communication Skills, Leadership Skills. Download this PPT design now to present a convincing pitch that not only emphasizes the topic but also showcases your presentation skills.
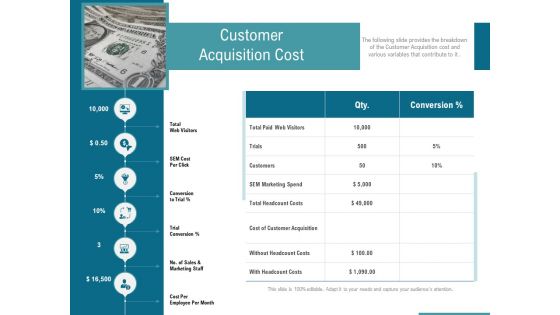
Corporate Execution And Financial Liability Report Customer Acquisition Cost Topics PDF
Presenting this set of slides with name corporate execution and financial liability report customer acquisition cost topics pdf. This is a six stage process. The stages in this process are sales, marketing, cost, conversion, acquisition. This is a completely editable PowerPoint presentation and is available for immediate download. Download now and impress your audience.
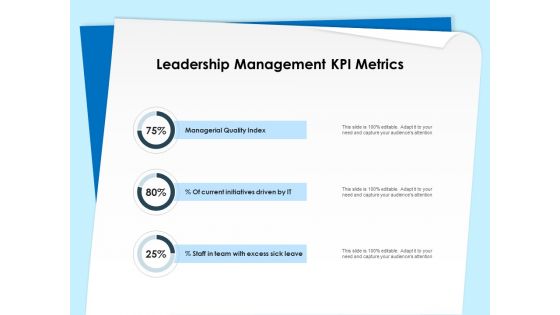
Executive Leadership Programs Leadership Management KPI Metrics Ppt PowerPoint Presentation Infographics Format Ideas PDF
Presenting this set of slides with name executive leadership programs leadership management kpi metrics ppt powerpoint presentation infographics format ideas pdf. This is a three stage process. The stages in this process are managerial quality index, current initiatives driven it, staff team excess sick leave. This is a completely editable PowerPoint presentation and is available for immediate download. Download now and impress your audience.
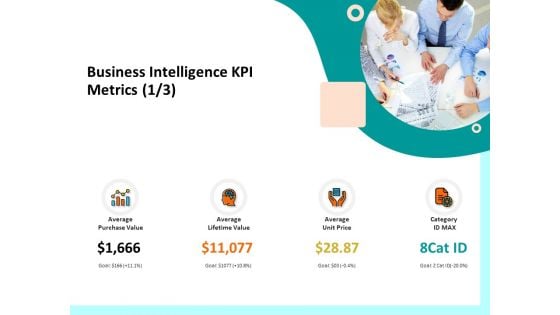
Firm Productivity Administration Business Intelligence KPI Metrics Average Ppt PowerPoint Presentation Infographics Guidelines PDF
Presenting this set of slides with name firm productivity administration business intelligence kpi metrics average ppt powerpoint presentation infographics guidelines pdf. This is a four stage process. The stages in this process are average purchase value, average lifetime value, average unit price, category id max. This is a completely editable PowerPoint presentation and is available for immediate download. Download now and impress your audience.
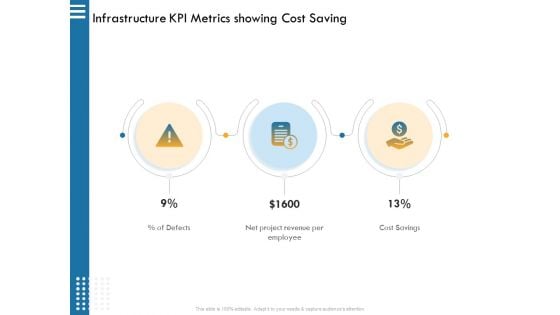
IT Infrastructure Governance Infrastructure KPI Metrics Showing Cost Saving Ppt Infographic Template Graphic Images PDF
This is a it infrastructure governance infrastructure kpi metrics showing cost saving ppt infographic template graphic images pdf. template with various stages. Focus and dispense information on three stages using this creative set, that comes with editable features. It contains large content boxes to add your information on topics like defects, net project revenue per employee, cost savings. You can also showcase facts, figures, and other relevant content using this PPT layout. Grab it now
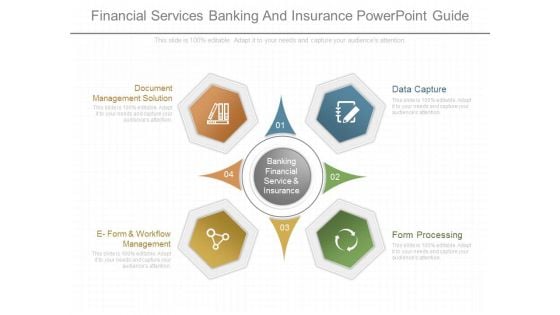
Financial Services Banking And Insurance Powerpoint Guide
This is a financial services banking and insurance powerpoint guide. This is a four stage process. The stages in this process are banking financial service and insurance, data capture, form processing, e form and workflow management, document management solution.
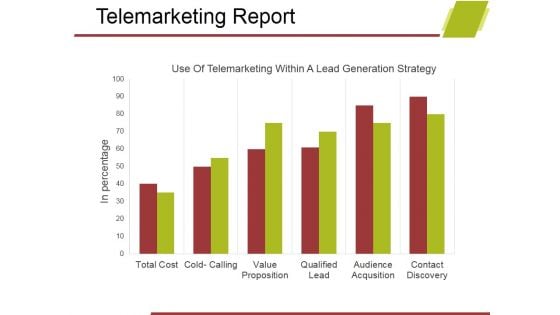
Telemarketing Report Template 1 Ppt PowerPoint Presentation Show Design Ideas
This is a telemarketing report template 1 ppt powerpoint presentation show design ideas. This is a six stage process. The stages in this process are business, bar graph, marketing, analysis, growth, strategy.
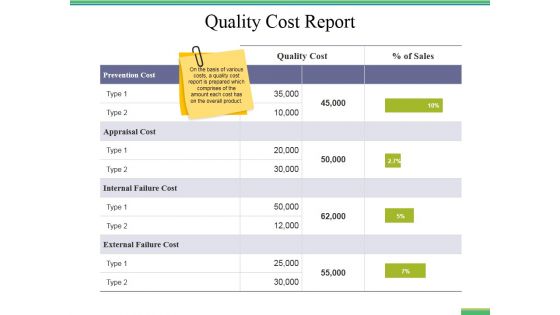
Quality Cost Report Ppt PowerPoint Presentation Styles Infographic Template
This is a quality cost report ppt powerpoint presentation styles infographic template. This is a five stage process. The stages in this process are business, finance, marketing, strategy, bar graph, analysis.
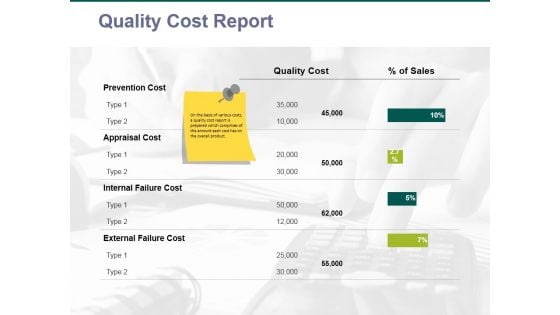
quality cost report ppt powerpoint presentation inspiration images
This is a quality cost report ppt powerpoint presentation inspiration images. This is a five stage process. The stages in this process are business, finance, marketing, analysis, quality cost.
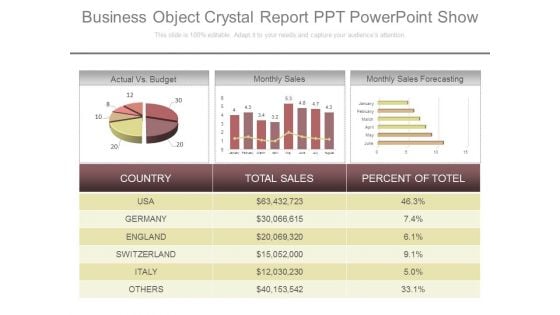
Business Object Crystal Report Ppt Powerpoint Show
This is a business object crystal report ppt powerpoint show. This is a three stage process. The stages in this process are actual vs budget, monthly sales, monthly sales forecasting, country, total sales, percent of total, usa, germany, england, switzerland, italy, others.
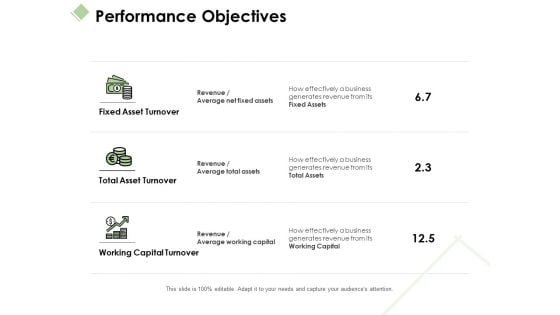
Performance Objectives Ppt PowerPoint Presentation Infographics Themes
Presenting this set of slides with name performance objectives ppt powerpoint presentation infographics themes. This is a three stage process. The stages in this process are fixed asset turnover, total asset turnover, working capital turnover. This is a completely editable PowerPoint presentation and is available for immediate download. Download now and impress your audience.
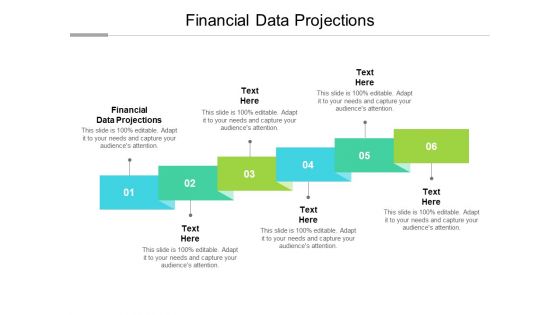
Financial Data Projections Ppt PowerPoint Presentation Gallery Master Slide Cpb
Presenting this set of slides with name financial data projections ppt powerpoint presentation gallery master slide cpb. This is an editable Powerpoint six stages graphic that deals with topics like financial data projections to help convey your message better graphically. This product is a premium product available for immediate download and is 100 percent editable in Powerpoint. Download this now and use it in your presentations to impress your audience.
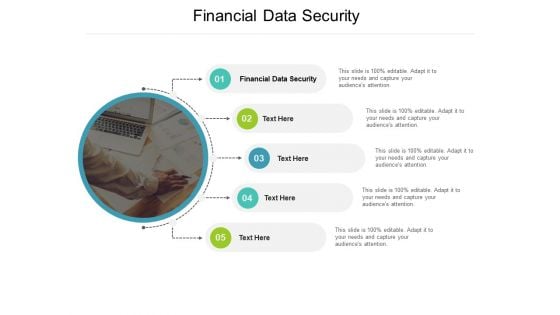
Financial Data Security Ppt PowerPoint Presentation Model Master Slide Cpb
Presenting this set of slides with name financial data security ppt powerpoint presentation model master slide cpb. This is an editable Powerpoint five stages graphic that deals with topics like financial data security to help convey your message better graphically. This product is a premium product available for immediate download and is 100 percent editable in Powerpoint. Download this now and use it in your presentations to impress your audience.
Data Modelling For Financial Performance Management Vector Icon Designs PDF
Persuade your audience using this data modelling for financial performance management vector icon designs pdf. This PPT design covers three stages, thus making it a great tool to use. It also caters to a variety of topics including data modelling for financial performance management vector icon. Download this PPT design now to present a convincing pitch that not only emphasizes the topic but also showcases your presentation skills.
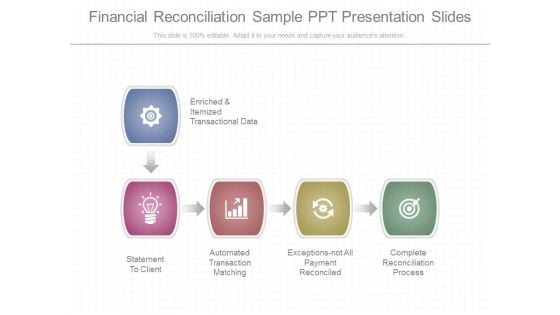
Financial Reconciliation Sample Ppt Presentation Slides
This is a financial reconciliation sample ppt presentation slides. This is a five stage process. The stages in this process are enriched and itemized transactional data, statement to client, automated transaction matching, exceptions not all payment reconciled, complete reconciliation process.\n\n\n\n\n\n\n\n\n\n\n\n\n\n\n\n\n\n
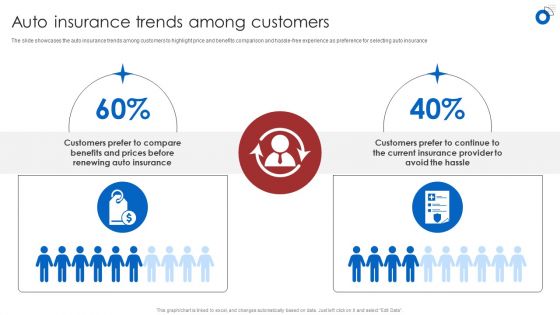
Insurance Business Financial Analysis Auto Insurance Trends Among Customers Structure PDF
The slide showcases the auto insurance trends among customers to highlight price and benefits comparison and hassle-free experience as preference for selecting auto insurance. Find a pre-designed and impeccable Insurance Business Financial Analysis Auto Insurance Trends Among Customers Structure PDF. The templates can ace your presentation without additional effort. You can download these easy-to-edit presentation templates to make your presentation stand out from others. So, what are you waiting for Download the template from Slidegeeks today and give a unique touch to your presentation.
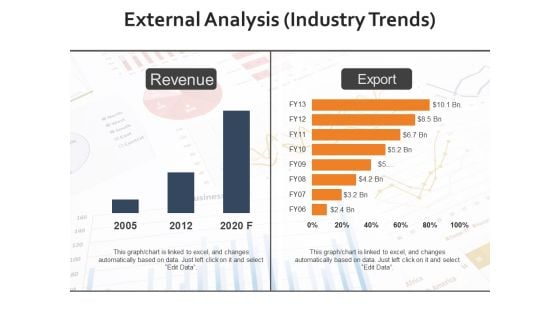
External Analysis Industry Trends Ppt PowerPoint Presentation Infographic Template Visuals
This is a external analysis industry trends ppt powerpoint presentation infographic template visuals. This is a two stage process. The stages in this process are export, revenue, percentage, years, business, analysis.
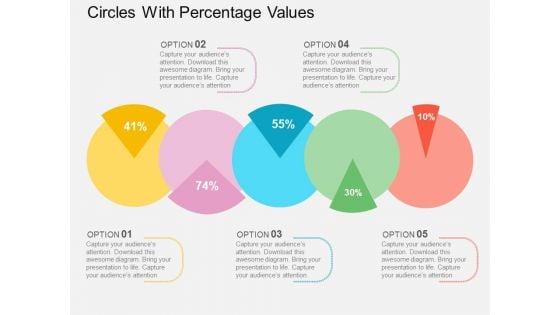
Circles With Percentage Values Powerpoint Templates
This PowerPoint template displays circles with percentage values. This business diagram is suitable for financial data analysis. Use this business diagram slide to highlight the key issues of your presentation.
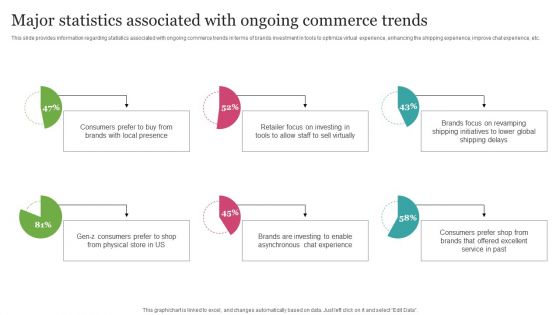
Major Statistics Associated With Ongoing Commerce Trends Guidelines PDF
This slide provides information regarding statistics associated with ongoing commerce trends in terms of brands investment in tools to optimize virtual experience, enhancing the shipping experience, improve chat experience, etc. Slidegeeks has constructed Major Statistics Associated With Ongoing Commerce Trends Guidelines PDF after conducting extensive research and examination. These presentation templates are constantly being generated and modified based on user preferences and critiques from editors. Here, you will find the most attractive templates for a range of purposes while taking into account ratings and remarks from users regarding the content. This is an excellent jumping-off point to explore our content and will give new users an insight into our top-notch PowerPoint Templates.

Financial Institution Scam And Mitigation Strategies In Financial Industry Introduction PDF
The slide shows the varieties of banking frauds and their methods for prevention. The crimes includes wire fraud, credential stealing, account takeover, money laundering and accounting frauds. Its solutions are AI, biometric, consortium data, high standardization and machine learning. Persuade your audience using this Financial Institution Scam And Mitigation Strategies In Financial Industry Introduction PDF. This PPT design covers two stages, thus making it a great tool to use. It also caters to a variety of topics including Frauds, Mitigation Strategies, Artificial Intelligence. Download this PPT design now to present a convincing pitch that not only emphasizes the topic but also showcases your presentation skills
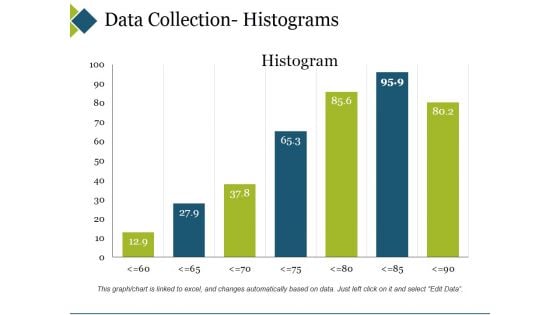
Data Collection Histograms Ppt PowerPoint Presentation Show Topics
This is a data collection histograms ppt powerpoint presentation show topics. This is a seven stage process. The stages in this process are business, marketing, histogram, finance, graph.
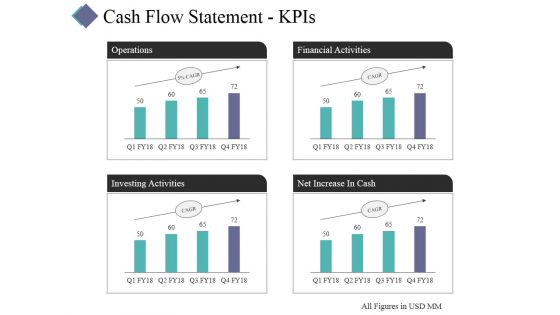
Cash Flow Statement Kpis Template 2 Ppt PowerPoint Presentation Layouts Visuals
This is a cash flow statement kpis template 2 ppt powerpoint presentation layouts visuals. This is a four stage process. The stages in this process are operations, financial activities, investing activities, net increase in cash.
Business Financial Trend Vector Icon Ppt PowerPoint Presentation Visual Aids Infographics
Presenting this set of slides with name business financial trend vector icon ppt powerpoint presentation visual aids infographics. This is a two stage process. The stages in this process are financial strategy, business financial trend, business strategy. This is a completely editable PowerPoint presentation and is available for immediate download. Download now and impress your audience.
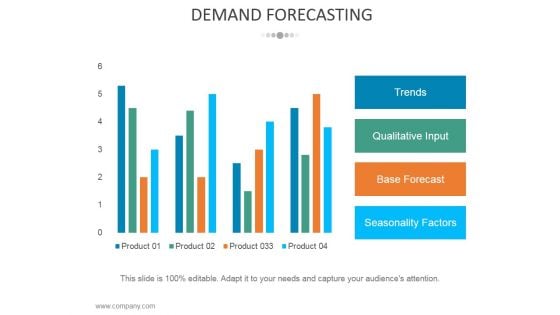
Demand Forecasting Template 1 Ppt PowerPoint Presentation Styles Gridlines
This is a demand forecasting template 1 ppt powerpoint presentation styles gridlines. This is a four stage process. The stages in this process are trends, qualitative input, base forecast, seasonality factors.
Website Performance Review Template 2 Ppt PowerPoint Presentation Icon Design Ideas
This is a website performance review template 2 ppt powerpoint presentation icon design ideas. This is a four stage process. The stages in this process are column two, revenue trends, traffic sources.
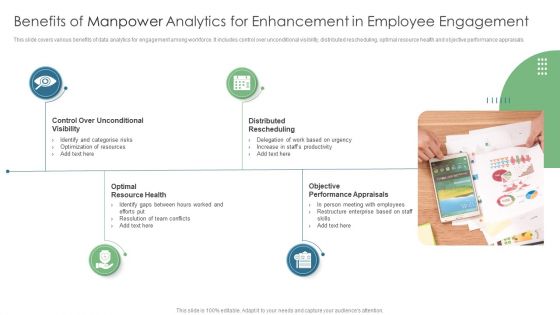
Benefits Of Manpower Analytics For Enhancement In Employee Engagement Guidelines PDF
This slide covers various benefits of data analytics for engagement among workforce. It includes control over unconditional visibility, distributed rescheduling, optimal resource health and objective performance appraisals. Persuade your audience using this Benefits Of Manpower Analytics For Enhancement In Employee Engagement Guidelines PDF. This PPT design covers four stages, thus making it a great tool to use. It also caters to a variety of topics including Control Over, Unconditional Visibility, Distributed Rescheduling, Objective Performance Appraisals. Download this PPT design now to present a convincing pitch that not only emphasizes the topic but also showcases your presentation skills.
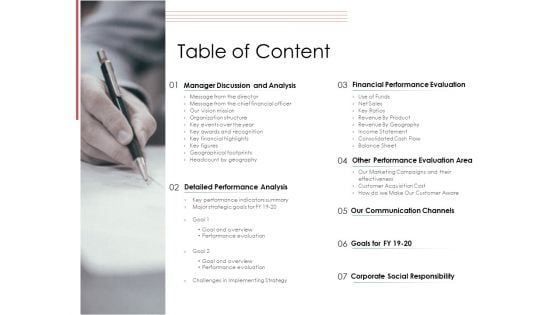
Financial PAR Table Of Content Ppt Infographic Template Show PDF
Presenting financial par table of content ppt infographic template show pdf to provide visual cues and insights. Share and navigate important information on seven stages that need your due attention. This template can be used to pitch topics like financial, performance, evaluation, social, responsibility. In addtion, this PPT design contains high resolution images, graphics, etc, that are easily editable and available for immediate download.
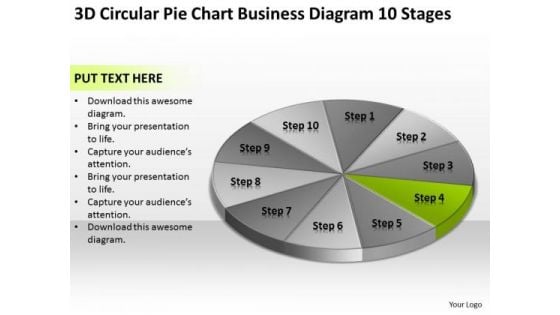
Pie Chart Business Diagram 10 Stages Ppt Plan Example PowerPoint Templates
We present our pie chart business diagram 10 stages ppt plan example PowerPoint templates.Download our Flow Charts PowerPoint Templates because Our PowerPoint Templates and Slides ensures Effective communication. They help you put across your views with precision and clarity. Download our Process and Flows PowerPoint Templates because It is Aesthetically crafted by artistic young minds. Our PowerPoint Templates and Slides are designed to display your dexterity. Download our Marketing PowerPoint Templates because You are an avid believer in ethical practices. Highlight the benefits that accrue with our PowerPoint Templates and Slides. Download and present our Business PowerPoint Templates because Our PowerPoint Templates and Slides ensures Effective communication. They help you put across your views with precision and clarity. Present our Shapes PowerPoint Templates because Our PowerPoint Templates and Slides will let your team Walk through your plans. See their energy levels rise as you show them the way.Use these PowerPoint slides for presentations relating to Graph, icon, market, isolated, statistics, percent, economics, ten, economy, display, business, render, success, presentation,diagram, circle, data, analyst, analysis, bank, report, calculation, accounting, trend, illustration, three, piece, pie, circular, chart, money, dimensional, clipart,accountant, growth, colorful, competition, account, stats, profit, part, information, background, improvement, financial. The prominent colors used in the PowerPoint template are White, Green, Black. Convey your message in an exact manner. Enable accuracy with our Pie Chart Business Diagram 10 Stages Ppt Plan Example PowerPoint Templates.
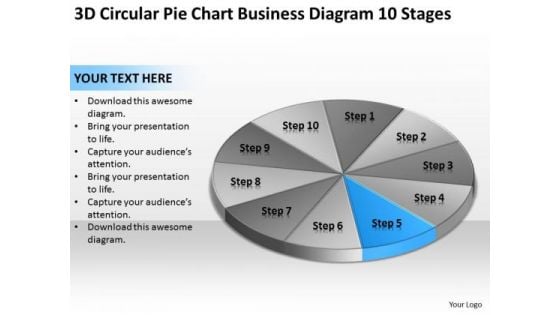
Pie Chart Business Diagram 10 Stages Ppt Templates For Plans PowerPoint Slides
We present our pie chart business diagram 10 stages ppt templates for plans PowerPoint Slides.Download our Business PowerPoint Templates because Our PowerPoint Templates and Slides come in all colours, shades and hues. They help highlight every nuance of your views. Use our Marketing PowerPoint Templates because Our PowerPoint Templates and Slides will provide you the cutting edge. Slice through the doubts in the minds of your listeners. Use our Process and Flows PowerPoint Templates because Your ideas provide food for thought. Our PowerPoint Templates and Slides will help you create a dish to tickle the most discerning palate. Present our Future PowerPoint Templates because Our PowerPoint Templates and Slides are conceived by a dedicated team. Use them and give form to your wondrous ideas. Download and present our Success PowerPoint Templates because Watching this your Audience will Grab their eyeballs, they wont even blink.Use these PowerPoint slides for presentations relating to Graph, icon, market, isolated, statistics, percent, economics, ten, economy, display, business, render, success, presentation,diagram, circle, data, analyst, analysis, bank, report, calculation, accounting, trend, illustration, three, piece, pie, circular, chart, money, dimensional, clipart,accountant, growth, colorful, competition, account, stats, profit, part, information, background, improvement, financial. The prominent colors used in the PowerPoint template are Blue, Gray, White. With our Pie Chart Business Diagram 10 Stages Ppt Templates For Plans PowerPoint Slides fear is never a factor. Do not allow adversity to effect you.
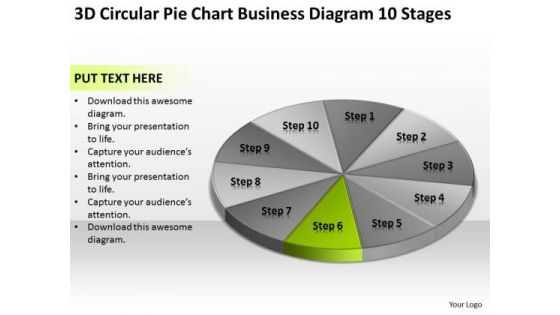
Pie Chart Business Diagram 10 Stages Creating Small Plan PowerPoint Slides
We present our pie chart business diagram 10 stages creating small plan PowerPoint Slides.Present our Flow Charts PowerPoint Templates because Our PowerPoint Templates and Slides will provide you a launch platform. Give a lift off to your ideas and send them into orbit. Present our Process and Flows PowerPoint Templates because Our PowerPoint Templates and Slides will give good value for money. They also have respect for the value of your time. Present our Marketing PowerPoint Templates because Our PowerPoint Templates and Slides will fulfill your every need. Use them and effectively satisfy the desires of your audience. Use our Business PowerPoint Templates because It will mark the footprints of your journey. Illustrate how they will lead you to your desired destination. Download our Shapes PowerPoint Templates because They will bring a lot to the table. Their alluring flavours will make your audience salivate.Use these PowerPoint slides for presentations relating to Graph, icon, market, isolated, statistics, percent, economics, ten, economy, display, business, render, success, presentation,diagram, circle, data, analyst, analysis, bank, report, calculation, accounting, trend, illustration, three, piece, pie, circular, chart, money, dimensional, clipart,accountant, growth, colorful, competition, account, stats, profit, part, information, background, improvement, financial. The prominent colors used in the PowerPoint template are Gray, Green, Black. Go to any extent with our Pie Chart Business Diagram 10 Stages Creating Small Plan PowerPoint Slides. Whatever the distance they will cover it with you.
Financial Services Industry Trends Ppt PowerPoint Presentation Styles Show Cpb Pdf
Presenting this set of slides with name financial services industry trends ppt powerpoint presentation styles show cpb pdf. This is an editable Powerpoint four stages graphic that deals with topics like financial services industry trends to help convey your message better graphically. This product is a premium product available for immediate download and is 100 percent editable in Powerpoint. Download this now and use it in your presentations to impress your audience.

Person Assessing Financial Trends For Business Ppt PowerPoint Presentation Show Layout PDF
Persuade your audience using this person assessing financial trends for business ppt powerpoint presentation show layout pdf. This PPT design covers one stages, thus making it a great tool to use. It also caters to a variety of topics including person assessing financial trends for business. Download this PPT design now to present a convincing pitch that not only emphasizes the topic but also showcases your presentation skills.
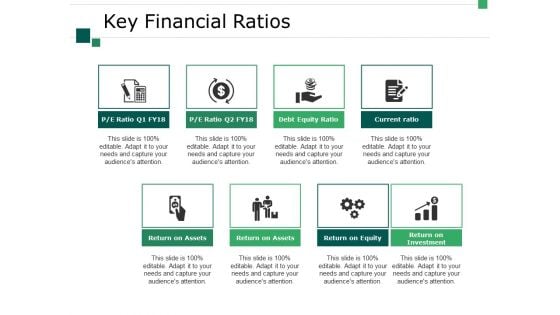
Key Financial Ratios Ppt PowerPoint Presentation Outline Slide
This is a key financial ratios ppt powerpoint presentation outline slide. This is a eight stage process. The stages in this process are return on assets, return on equity, return on investment, current ratio, debt equity ratio.
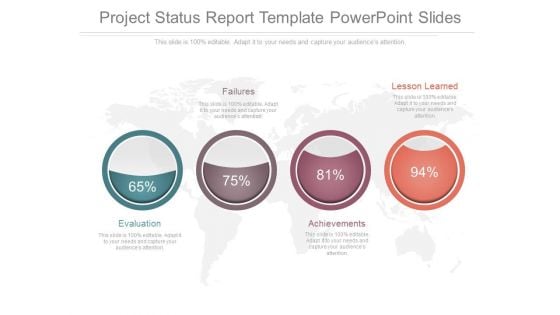
Project Status Report Template Powerpoint Slides
This is a project status report template powerpoint slides. This is a four stage process. The stages in this process are failures, lesson learned, evaluation, achievements.
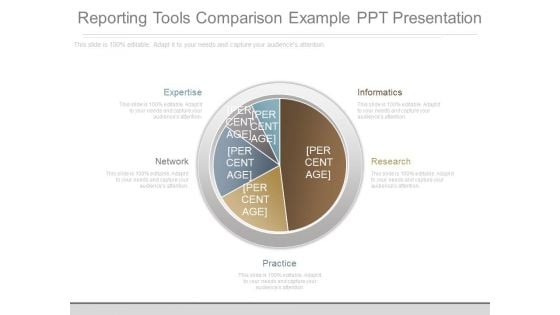
Reporting Tools Comparison Example Ppt Presentation
This is a reporting tools comparison example ppt presentation. This is a five stage process. The stages in this process are expertise, informatics, research, network, practice.


 Continue with Email

 Home
Home


