Dashboards Construction
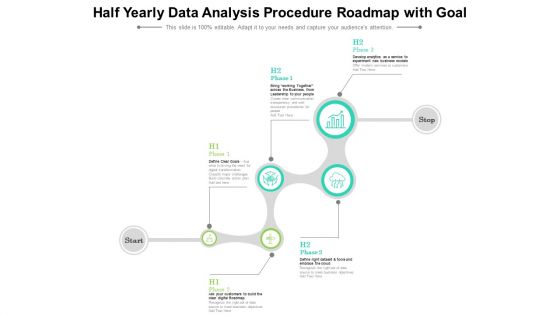
Half Yearly Data Analysis Procedure Roadmap With Goal Summary
Introducing our half yearly data analysis procedure roadmap with goal summary. This PPT presentation is Google Slides compatible, therefore, you can share it easily with the collaborators for measuring the progress. Also, the presentation is available in both standard screen and widescreen aspect ratios. So edit the template design by modifying the font size, font type, color, and shapes as per your requirements. As this PPT design is fully editable it can be presented in PDF, JPG and PNG formats.
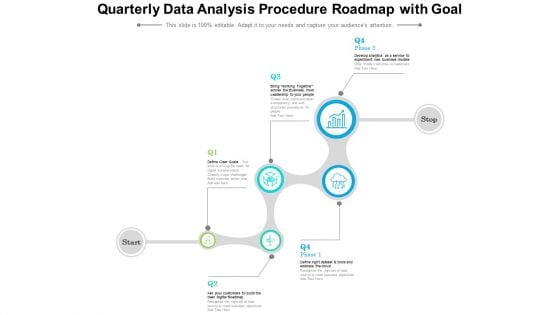
Quarterly Data Analysis Procedure Roadmap With Goal Summary
Introducing our quarterly data analysis procedure roadmap with goal summary. This PPT presentation is Google Slides compatible, therefore, you can share it easily with the collaborators for measuring the progress. Also, the presentation is available in both standard screen and widescreen aspect ratios. So edit the template design by modifying the font size, font type, color, and shapes as per your requirements. As this PPT design is fully editable it can be presented in PDF, JPG and PNG formats.
Half Yearly Strategy Roadmap For Data Analysis Icons
Introducing our half yearly strategy roadmap for data analysis icons. This PPT presentation is Google Slides compatible, therefore, you can share it easily with the collaborators for measuring the progress. Also, the presentation is available in both standard screen and widescreen aspect ratios. So edit the template design by modifying the font size, font type, color, and shapes as per your requirements. As this PPT design is fully editable it can be presented in PDF, JPG and PNG formats.
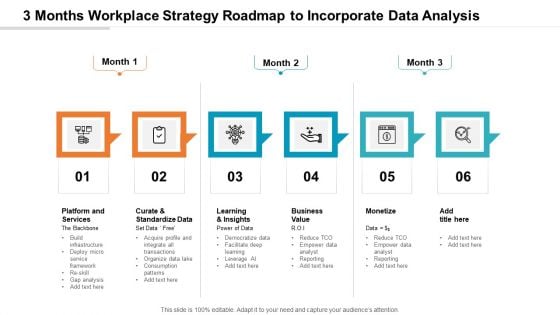
3 Months Workplace Strategy Roadmap To Incorporate Data Analysis Slides
Presenting our jaw-dropping 3 months workplace strategy roadmap to incorporate data analysis slides. You can alternate the color, font size, font type, and shapes of this PPT layout according to your strategic process. This PPT presentation is compatible with Google Slides and is available in both standard screen and widescreen aspect ratios. You can also download this well-researched PowerPoint template design in different formats like PDF, JPG, and PNG. So utilize this visually-appealing design by clicking the download button given below.
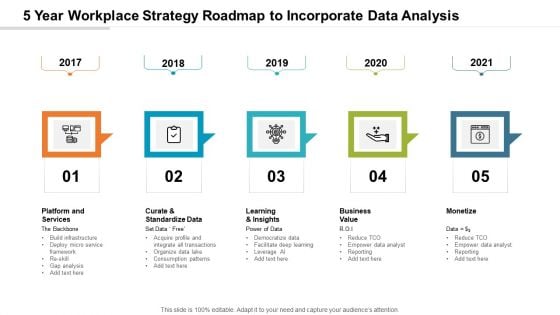
5 Year Workplace Strategy Roadmap To Incorporate Data Analysis Slides
Presenting our jaw-dropping 5 year workplace strategy roadmap to incorporate data analysis slides. You can alternate the color, font size, font type, and shapes of this PPT layout according to your strategic process. This PPT presentation is compatible with Google Slides and is available in both standard screen and widescreen aspect ratios. You can also download this well-researched PowerPoint template design in different formats like PDF, JPG, and PNG. So utilize this visually-appealing design by clicking the download button given below.
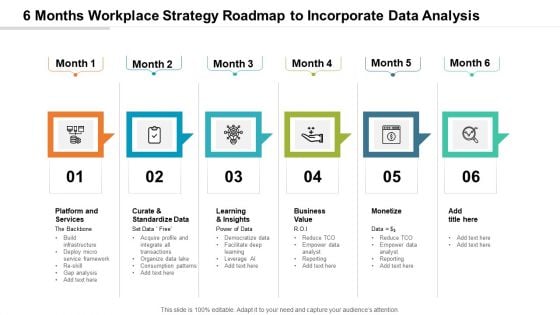
6 Months Workplace Strategy Roadmap To Incorporate Data Analysis Structure
Presenting our jaw-dropping 6 months workplace strategy roadmap to incorporate data analysis structure. You can alternate the color, font size, font type, and shapes of this PPT layout according to your strategic process. This PPT presentation is compatible with Google Slides and is available in both standard screen and widescreen aspect ratios. You can also download this well-researched PowerPoint template design in different formats like PDF, JPG, and PNG. So utilize this visually-appealing design by clicking the download button given below.
Key Questions For Customer Data Analysis Icons PDF
This slide list the win loss questions that must be asked for improving organizations messaging, positioning, packaging, pricing, and sales practices. Persuade your audience using this key questions for customer data analysis icons pdf. This PPT design covers five stages, thus making it a great tool to use. It also caters to a variety of topics including sales, practices, messaging, positioning. Download this PPT design now to present a convincing pitch that not only emphasizes the topic but also showcases your presentation skills.
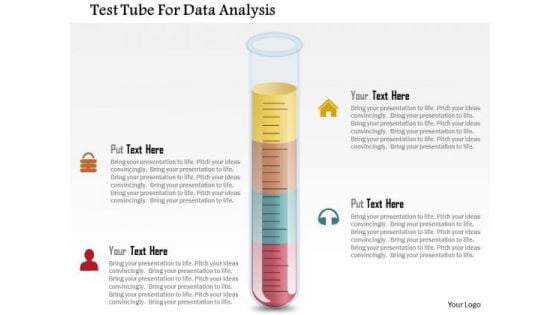
Business Diagram Test Tube For Data Analysis Presentation Template
Graphic of test tube with lock and headphone icons have been used to design this Power Point template. You may use this diagram for data analysis and research. Present your views using our innovative slide and be assured of leaving a lasting impression.

Business Data Analysis Meet Our Team Demonstration PDF
Presenting business data analysis meet our team demonstration pdf to provide visual cues and insights. Share and navigate important information on four stages that need your due attention. This template can be used to pitch topics like meet our team. In addtion, this PPT design contains high resolution images, graphics, etc, that are easily editable and available for immediate download.
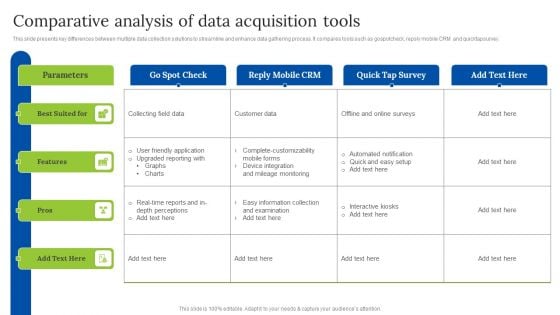
Comparative Analysis Of Data Acquisition Tools Guidelines PDF
Pitch your topic with ease and precision using this Comparative Analysis Of Data Acquisition Tools Guidelines PDF. This layout presents information on Complete Customizability, Mobile Forms, Device Integration. It is also available for immediate download and adjustment. So, changes can be made in the color, design, graphics or any other component to create a unique layout.

Effective Data Arrangement For Data Accessibility And Processing Readiness Ppt PowerPoint Presentation Complete Deck With Slides
This complete deck covers various topics and highlights important concepts. It has PPT slides which cater to your business needs. This complete deck presentation emphasizes effective data arrangement for data accessibility and processing readiness ppt powerpoint presentation complete deck with slides and has templates with professional background images and relevant content. This deck consists of total of sixty slides. Our designers have created customizable templates, keeping your convenience in mind. You can edit the colour, text and font size with ease. Not just this, you can also add or delete the content if needed. Get access to this fully editable complete presentation by clicking the download button below.
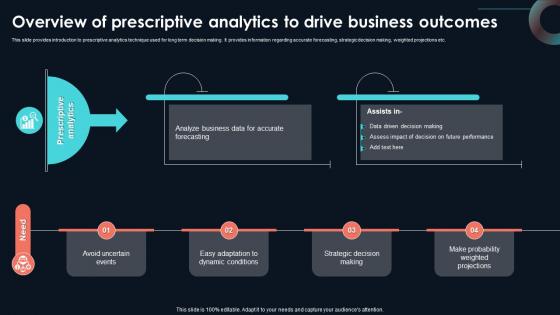
Overview Of Prescriptive Analytics To Drive Developing Strategic Insights Using Big Data Analytics SS V
This slide provides introduction to prescriptive analytics technique used for long term decision making. It provides information regarding accurate forecasting, strategic decision making, weighted projections etc. Coming up with a presentation necessitates that the majority of the effort goes into the content and the message you intend to convey. The visuals of a PowerPoint presentation can only be effective if it supplements and supports the story that is being told. Keeping this in mind our experts created Overview Of Prescriptive Analytics To Drive Developing Strategic Insights Using Big Data Analytics SS V to reduce the time that goes into designing the presentation. This way, you can concentrate on the message while our designers take care of providing you with the right template for the situation. This slide provides introduction to prescriptive analytics technique used for long term decision making. It provides information regarding accurate forecasting, strategic decision making, weighted projections etc.

Overview Of Descriptive Analytics In Developing Strategic Insights Using Big Data Analytics SS V
This slide provides introduction of descriptive analytics used in business for analyzing performance efficiency. It includes elements such as decision making, sales performance, growth opportunities, valuable insights etc. Formulating a presentation can take up a lot of effort and time, so the content and message should always be the primary focus. The visuals of the PowerPoint can enhance the presenters message, so our Overview Of Descriptive Analytics In Developing Strategic Insights Using Big Data Analytics SS V was created to help save time. Instead of worrying about the design, the presenter can concentrate on the message while our designers work on creating the ideal templates for whatever situation is needed. Slidegeeks has experts for everything from amazing designs to valuable content, we have put everything into Overview Of Descriptive Analytics In Developing Strategic Insights Using Big Data Analytics SS V This slide provides introduction of descriptive analytics used in business for analyzing performance efficiency. It includes elements such as decision making, sales performance, growth opportunities, valuable insights etc.
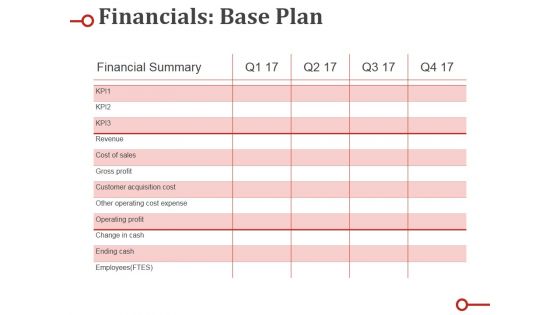
Financials Base Plan Ppt PowerPoint Presentation Portfolio Background Designs
This is a financials base plan ppt powerpoint presentation portfolio background designs. This is a four stage process. The stages in this process are revenue, cost of sales, gross profit, customer acquisition cost, other operating cost expense.
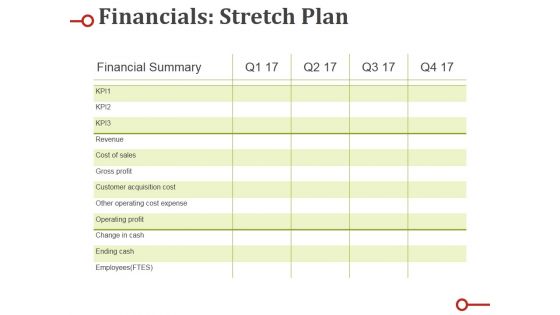
Financials Stretch Plan Ppt PowerPoint Presentation Show Designs Download
This is a financials stretch plan ppt powerpoint presentation show designs download. This is a four stage process. The stages in this process are revenue, cost of sales, gross profit, customer acquisition cost, other operating cost expense.
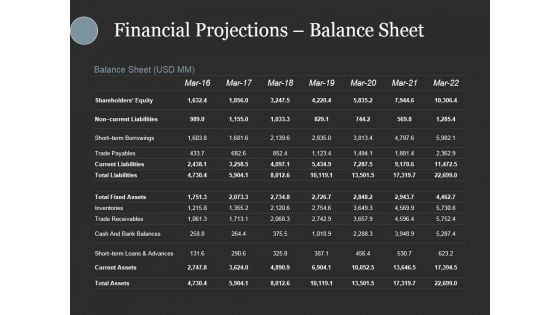
Financial Projections Balance Sheet Ppt PowerPoint Presentation Gallery Design Inspiration
This is a financial projections balance sheet ppt powerpoint presentation gallery design inspiration. This is a seven stage process. The stages in this process are shareholders equity, non current liabilities, short term borrowings, trade payables, current liabilities.
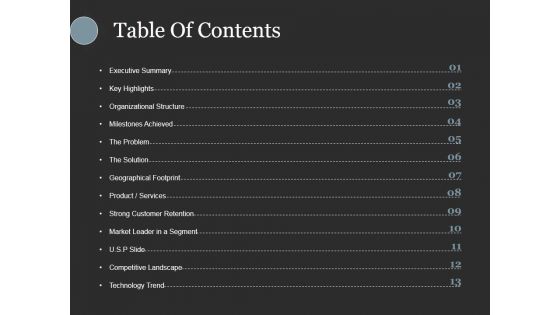
Table Of Contents Ppt PowerPoint Presentation Show Graphics Design
This is a table of contents ppt powerpoint presentation show graphics design. This is a thirteen stage process. The stages in this process are executive summary, key highlights, organizational structure, milestones achieved, the problem.

Strategic Plan Performance Requirements Ppt PowerPoint Presentation Slides Graphics Design
This is a strategic plan performance requirements ppt powerpoint presentation slides graphics design. This is a four stage process. The stages in this process are function action, performance requirements, must, wish, ideal.
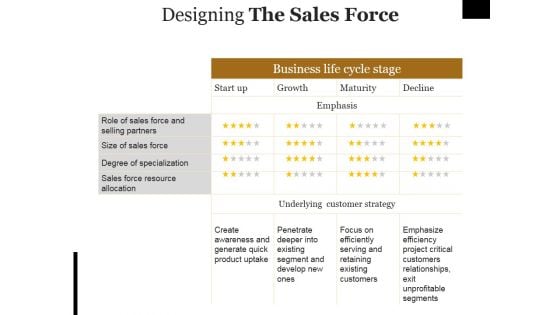
Designing The Sales Force Ppt PowerPoint Presentation Pictures Format
This is a designing the sales force ppt powerpoint presentation pictures format. This is a four stage process. The stages in this process are start up, growth, maturity, decline, emphasis.
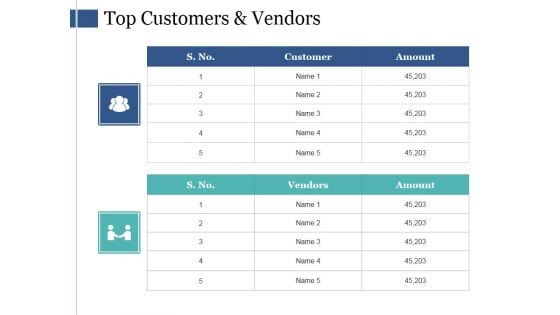
Top Customers And Vendors Ppt PowerPoint Presentation Ideas Designs
This is a top customers and vendors ppt powerpoint presentation ideas designs. This is a two stage process. The stages in this process are customer, vendors, amount, shape, icons.
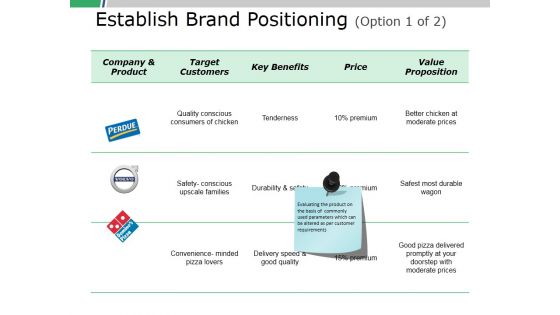
Establish Brand Positioning Template Ppt PowerPoint Presentation Show Designs
This is a establish brand positioning template ppt powerpoint presentation show designs. This is a three stage process. The stages in this process are company and product, target customers, key benefits, price, value proposition.
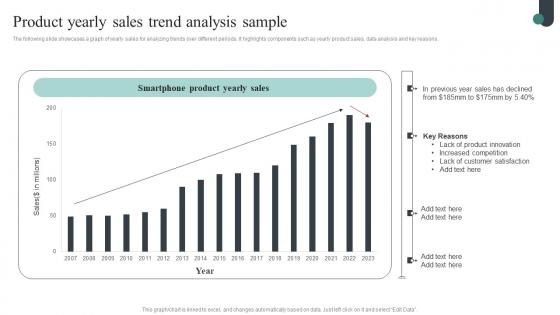
Competitive Intelligence Guide To Determine Market Product Yearly Sales Trend Download Pdf
The following slide showcases a graph of yearly sales for analyzing trends over different periods. It highlights components such as yearly product sales, data analysis and key reasons. This modern and well-arranged Competitive Intelligence Guide To Determine Market Product Yearly Sales Trend Download Pdf provides lots of creative possibilities. It is very simple to customize and edit with the Powerpoint Software. Just drag and drop your pictures into the shapes. All facets of this template can be edited with Powerpoint no extra software is necessary. Add your own material, put your images in the places assigned for them, adjust the colors, and then you can show your slides to the world, with an animated slide included. The following slide showcases a graph of yearly sales for analyzing trends over different periods. It highlights components such as yearly product sales, data analysis and key reasons.
Enterprise Data Governance In Supply Chain Icon Designs PDF
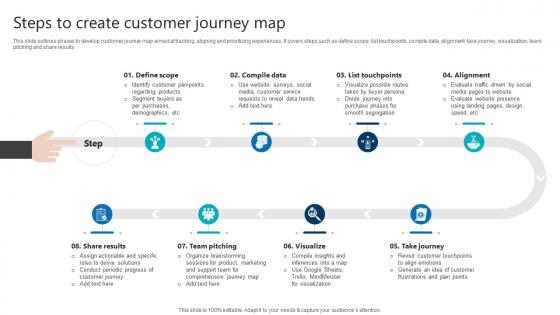
Steps To Create Customer Journey Map Product Analytics Implementation Data Analytics V
This slide outlines phases to develop customer journey map aimed at tracking, aligning and prioritizing experiences. It covers steps such as define scope, list touchpoints, compile data, alignment, take journey, visualization, team pitching and share results Welcome to our selection of the Steps To Create Customer Journey Map Product Analytics Implementation Data Analytics V. These are designed to help you showcase your creativity and bring your sphere to life. Planning and Innovation are essential for any business that is just starting out. This collection contains the designs that you need for your everyday presentations. All of our PowerPoints are 100 percent editable, so you can customize them to suit your needs. This multi-purpose template can be used in various situations. Grab these presentation templates today. This slide outlines phases to develop customer journey map aimed at tracking, aligning and prioritizing experiences. It covers steps such as define scope, list touchpoints, compile data, alignment, take journey, visualization, team pitching and share results
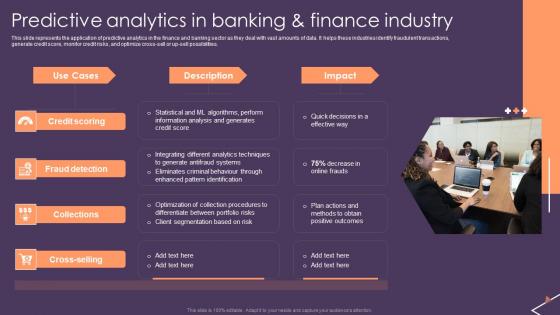
Predictive Analytics For Empowering Predictive Analytics In Banking And Finance Industry Slides Pdf
This slide represents the application of predictive analytics in the finance and banking sector as they deal with vast amounts of data. It helps these industries identify fraudulent transactions, generate credit score, monitor credit risks, and optimize cross-sell or up-sell possibilities. This modern and well-arranged Predictive Analytics For Empowering Predictive Analytics In Banking And Finance Industry Slides Pdf provides lots of creative possibilities. It is very simple to customize and edit with the Powerpoint Software. Just drag and drop your pictures into the shapes. All facets of this template can be edited with Powerpoint no extra software is necessary. Add your own material, put your images in the places assigned for them, adjust the colors, and then you can show your slides to the world, with an animated slide included. This slide represents the application of predictive analytics in the finance and banking sector as they deal with vast amounts of data. It helps these industries identify fraudulent transactions, generate credit score, monitor credit risks, and optimize cross-sell or up-sell possibilities.
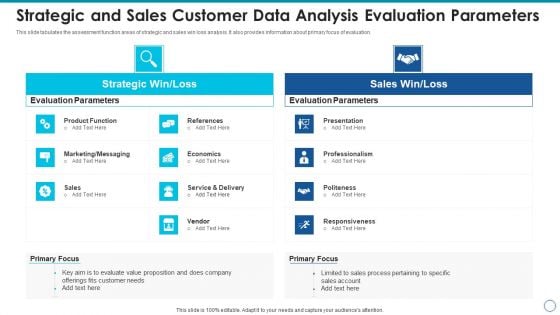
Strategic And Sales Customer Data Analysis Evaluation Parameters Inspiration PDF
This slide tabulates the assessment function areas of strategic and sales win loss analysis. It also provides information about primary focus of evaluation. Persuade your audience using this strategic and sales customer data analysis evaluation parameters inspiration pdf. This PPT design covers two stages, thus making it a great tool to use. It also caters to a variety of topics including evaluation parameters, strategic win loss, sales win loss. Download this PPT design now to present a convincing pitch that not only emphasizes the topic but also showcases your presentation skills.
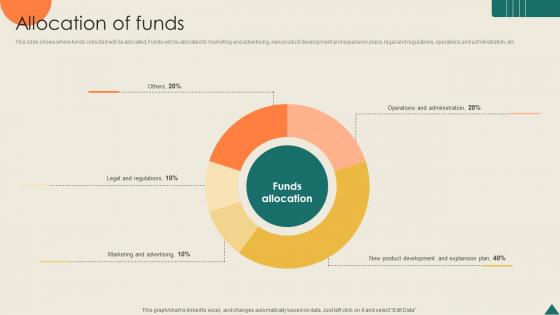
Allocation Of Funds Financial Analytics Platform Investor Elevator Pitch Deck
This slide shows where funds collected will be allocated. Funds will be allocated to marketing and advertising, new product development and expansion plans, legal and regulations, operations and administration, etc. The Allocation Of Funds Financial Analytics Platform Investor Elevator Pitch Deck is a compilation of the most recent design trends as a series of slides. It is suitable for any subject or industry presentation, containing attractive visuals and photo spots for businesses to clearly express their messages. This template contains a variety of slides for the user to input data, such as structures to contrast two elements, bullet points, and slides for written information. Slidegeeks is prepared to create an impression. This slide shows where funds collected will be allocated. Funds will be allocated to marketing and advertising, new product development and expansion plans, legal and regulations, operations and administration, etc.
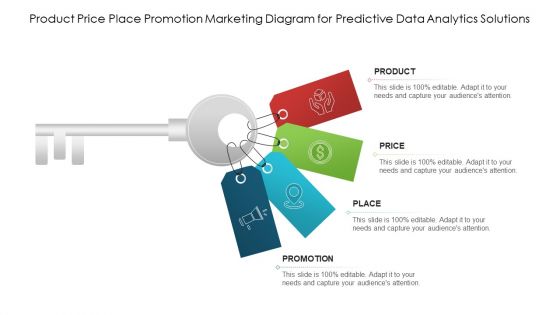
Product Price Place Promotion Marketing Diagram For Predictive Data Analytics Solutions Designs PDF
Presenting product price place promotion marketing diagram for predictive data analytics solutions designs pdf to dispense important information. This template comprises four stages. It also presents valuable insights into the topics including price, product, promotion. This is a completely customizable PowerPoint theme that can be put to use immediately. So, download it and address the topic impactfully.
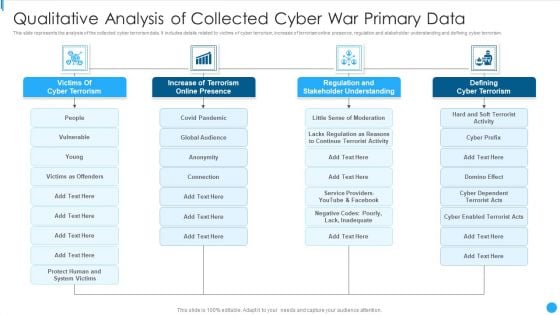
Qualitative Analysis Of Collected Cyber War Primary Data Ideas PDF
This slide represents the analysis of the collected cyber terrorism data. It includes details related to victims of cyber terrorism, increase of terrorism online presence, regulation and stakeholder understanding and defining cyber terrorism.Showcasing this set of slides titled Qualitative Analysis Of Collected Cyber War Primary Data Ideas PDF The topics addressed in these templates are Increase Terrorism, Stakeholder Understanding, Defining Terrorism All the content presented in this PPT design is completely editable. Download it and make adjustments in color, background, font etc. as per your unique business setting.
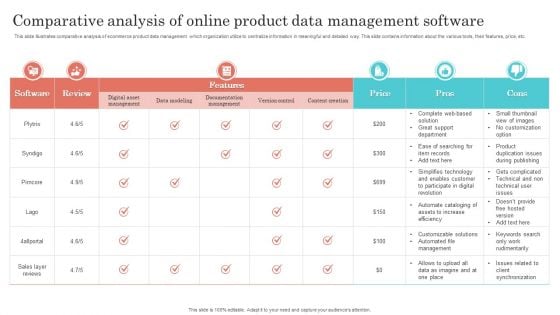
Comparative Analysis Of Online Product Data Management Software Introduction PDF
This slide illustrates comparative analysis of ecommerce product data management which organization utilize to centralize information in meaningful and detailed way. This slide contains information about the various tools, their features, price, etc. Pitch your topic with ease and precision using this Comparative Analysis Of Online Product Data Management Software Introduction PDF. This layout presents information on Digital Asset Management, Documentation Management, Price. It is also available for immediate download and adjustment. So, changes can be made in the color, design, graphics or any other component to create a unique layout.
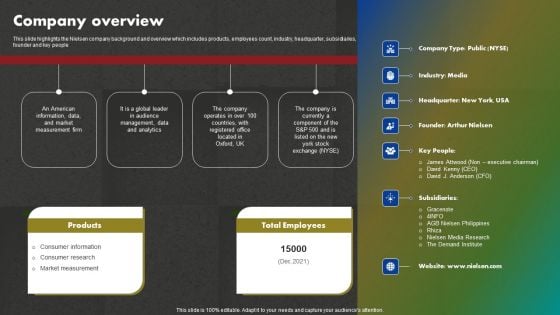
Data And Customer Analysis Company Outline Company Overview Template PDF
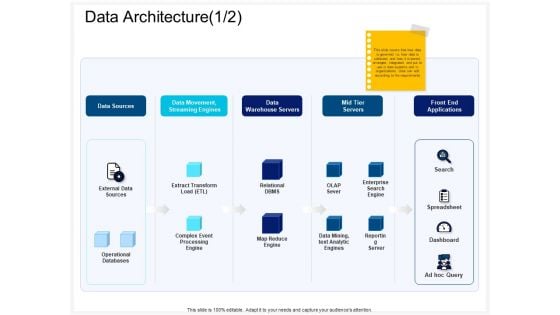
Enterprise Problem Solving And Intellect Data Architecture Data Ppt PowerPoint Presentation Ideas Template PDF
Presenting this set of slides with name enterprise problem solving and intellect data architecture data ppt powerpoint presentation ideas template pdf. This is a five stage process. The stages in this process are data sources, data movement, streaming engines, data warehouse servers, mid tier servers, front end applications, operational databases. This is a completely editable PowerPoint presentation and is available for immediate download. Download now and impress your audience.

Real Estate Fund Performance Ppt PowerPoint Presentation Infographics Graphics Example Cpb
Presenting this set of slides with name real estate fund performance ppt powerpoint presentation infographics graphics example cpb. This is an editable Powerpoint five stages graphic that deals with topics like real estate fund performance to help convey your message better graphically. This product is a premium product available for immediate download and is 100 percent editable in Powerpoint. Download this now and use it in your presentations to impress your audience.
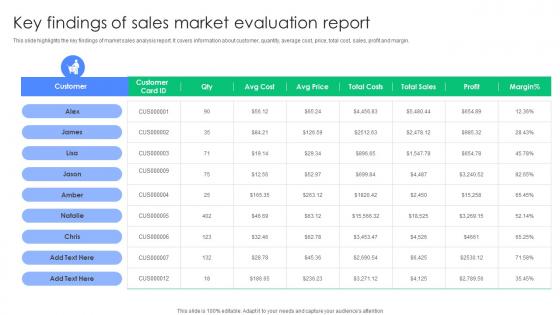
Key Findings Of Sales Market Evaluation Report Microsoft Pdf
This slide highlights the key findings of market sales analysis report. It covers information about customer, quantity, average cost, price, total cost, sales, profit and margin. Pitch your topic with ease and precision using this Key Findings Of Sales Market Evaluation Report Microsoft Pdf. This layout presents information on Customer, Sales Market, Evaluation Report. It is also available for immediate download and adjustment. So, changes can be made in the color, design, graphics or any other component to create a unique layout. This slide highlights the key findings of market sales analysis report. It covers information about customer, quantity, average cost, price, total cost, sales, profit and margin.
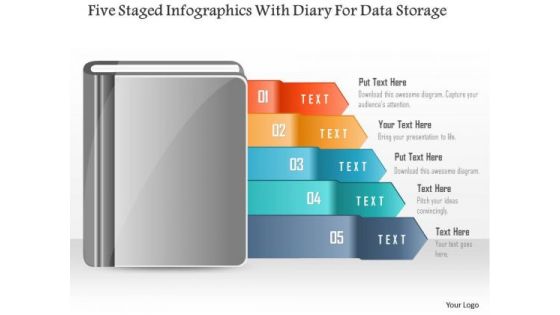
Five Staged Infographics With Diary For Data Storage PowerPoint Template
Five staged info graphic with diary has been used to design this power point template. This PPT contains the concept of data flow. Use this PPT diagram to represent the marketing and business data in any presentation.
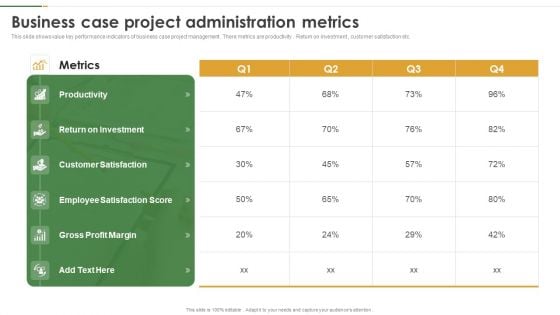
Business Case Project Administration Metrics Template PDF
This slide shows value key performance indicators of business case project management . There metrics are productivity . Return on investment , customer satisfaction etc. Showcasing this set of slides titled Business Case Project Administration Metrics Template PDF. The topics addressed in these templates are Productivity, Metrics, Return On Investment. All the content presented in this PPT design is completely editable. Download it and make adjustments in color, background, font etc. as per your unique business setting.
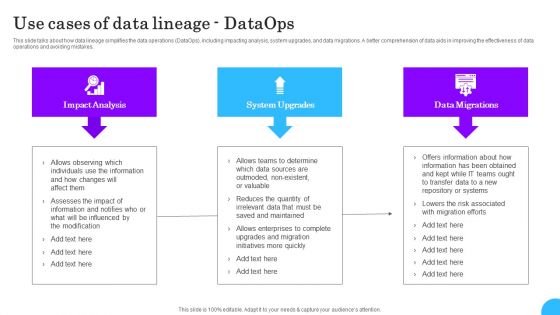
Comprehensive Analysis Of Different Data Lineage Classification Use Cases Of Data Lineage Dataops Download PDF
This slide talks about how data lineage simplifies the data operations DataOps, including impacting analysis, system upgrades, and data migrations. A better comprehension of data aids in improving the effectiveness of data operations and avoiding mistakes. Formulating a presentation can take up a lot of effort and time, so the content and message should always be the primary focus. The visuals of the PowerPoint can enhance the presenters message, so our Comprehensive Analysis Of Different Data Lineage Classification Use Cases Of Data Lineage Dataops Download PDF was created to help save time. Instead of worrying about the design, the presenter can concentrate on the message while our designers work on creating the ideal templates for whatever situation is needed. Slidegeeks has experts for everything from amazing designs to valuable content, we have put everything into Comprehensive Analysis Of Different Data Lineage Classification Use Cases Of Data Lineage Dataops Download PDF
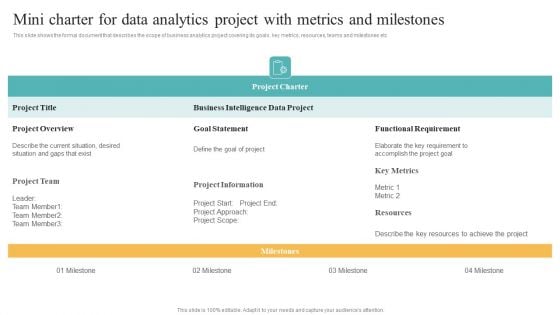
Mini Charter For Data Analytics Project With Metrics And Milestones Brochure PDF
This slide shows the formal document that describes the scope of business analytics project covering its goals, key metrics, resources, teams and milestones etc Find a pre designed and impeccable Mini Charter For Data Analytics Project With Metrics And Milestones Brochure PDF. The templates can ace your presentation without additional effort. You can download these easy to edit presentation templates to make your presentation stand out from others. So, what are you waiting for Download the template from Slidegeeks today and give a unique touch to your presentation.
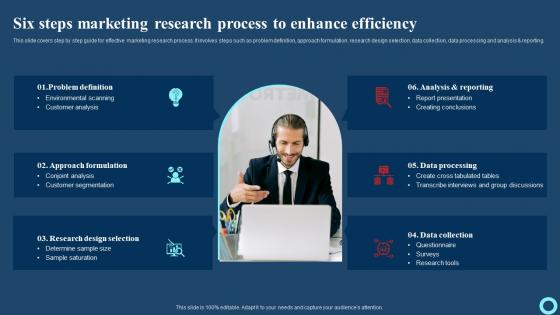
Six Steps Marketing Research Process To Enhance Efficiency Effective Strategies To Enhance Guidelines Pdf
This slide covers step by step guide for effective marketing research process. It involves steps such as problem definition, approach formulation, research design selection, data collection, data processing and analysis and reporting. Are you searching for a Six Steps Marketing Research Process To Enhance Efficiency Effective Strategies To Enhance Guidelines Pdf that is uncluttered, straightforward, and original It is easy to edit, and you can change the colors to suit your personal or business branding. For a presentation that expresses how much effort you have put in, this template is ideal With all of its features, including tables, diagrams, statistics, and lists, it is perfect for a business plan presentation. Make your ideas more appealing with these professional slides. Download Six Steps Marketing Research Process To Enhance Efficiency Effective Strategies To Enhance Guidelines Pdf from Slidegeeks today. This slide covers step by step guide for effective marketing research process. It involves steps such as problem definition, approach formulation, research design selection, data collection, data processing and analysis and reporting.
Data Analytics Icons Slide Checklist Management Ppt PowerPoint Presentation Slides Design Templates
Presenting this set of slides with name data analytics icons slide checklist management ppt powerpoint presentation slides design templates. The topics discussed in these slides are business, management, planning, strategy, marketing. This is a completely editable PowerPoint presentation and is available for immediate download. Download now and impress your audience.
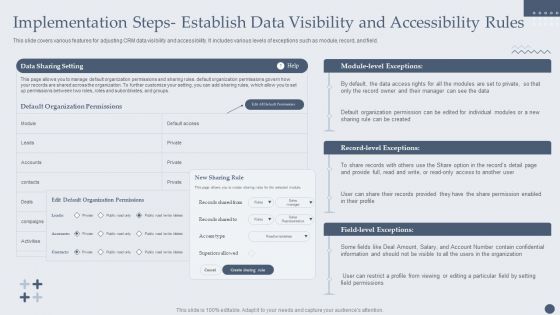
Implementation Steps Establish Data Visibility And Accessibility Rules Designs PDF
This slide covers various features for adjusting CRM data visibility and accessibility. It includes various levels of exceptions such as module, record, and field. Deliver an awe inspiring pitch with this creative Implementation Steps Establish Data Visibility And Accessibility Rules Designs PDF bundle. Topics like Organization Permissions, Default Organization, Module Level can be discussed with this completely editable template. It is available for immediate download depending on the needs and requirements of the user.
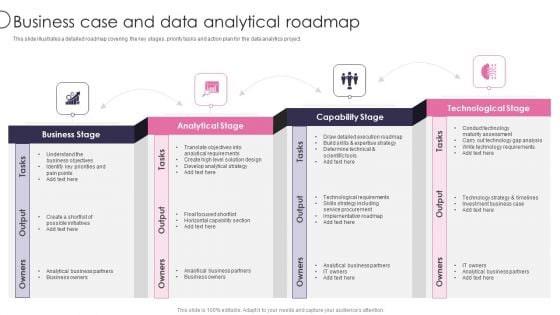
Information Transformation Process Toolkit Business Case And Data Analytical Roadmap Microsoft PDF
This slide illustrates a detailed roadmap covering the key stages, priority tasks and action plan for the data analytics project. Presenting Information Transformation Process Toolkit Business Case And Data Analytical Roadmap Microsoft PDF to provide visual cues and insights. Share and navigate important information on four stages that need your due attention. This template can be used to pitch topics like Capability Stage, Analytical Stage, Business Stage, Technological Stage. In addtion, this PPT design contains high resolution images, graphics, etc, that are easily editable and available for immediate download.
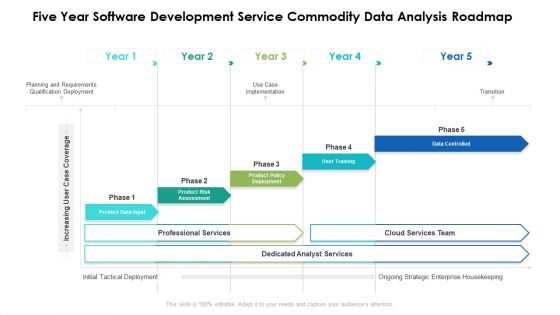
Five Year Software Development Service Commodity Data Analysis Roadmap Clipart
Presenting our innovatively structured five year software development service commodity data analysis roadmap clipart Template. Showcase your roadmap process in different formats like PDF, PNG, and JPG by clicking the download button below. This PPT design is available in both Standard Screen and Widescreen aspect ratios. It can also be easily personalized and presented with modified font size, font type, color, and shapes to measure your progress in a clear way.
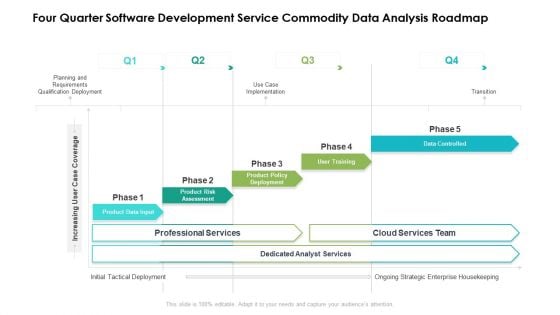
Four Quarter Software Development Service Commodity Data Analysis Roadmap Brochure
Presenting our innovatively structured four quarter software development service commodity data analysis roadmap brochure Template. Showcase your roadmap process in different formats like PDF, PNG, and JPG by clicking the download button below. This PPT design is available in both Standard Screen and Widescreen aspect ratios. It can also be easily personalized and presented with modified font size, font type, color, and shapes to measure your progress in a clear way.
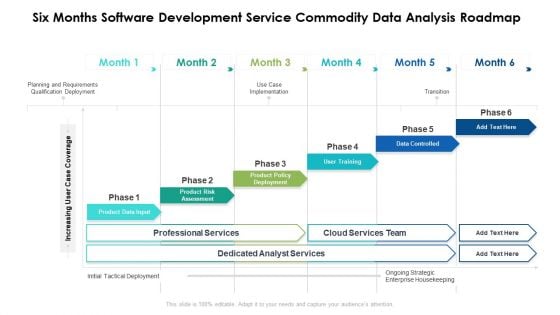
Six Months Software Development Service Commodity Data Analysis Roadmap Introduction
Presenting our innovatively structured six months software development service commodity data analysis roadmap introduction Template. Showcase your roadmap process in different formats like PDF, PNG, and JPG by clicking the download button below. This PPT design is available in both Standard Screen and Widescreen aspect ratios. It can also be easily personalized and presented with modified font size, font type, color, and shapes to measure your progress in a clear way.
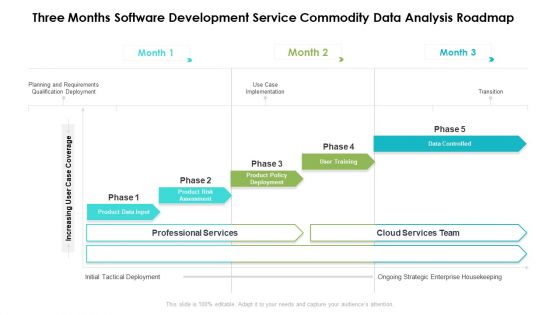
Three Months Software Development Service Commodity Data Analysis Roadmap Clipart
Presenting our innovatively structured three months software development service commodity data analysis roadmap clipart Template. Showcase your roadmap process in different formats like PDF, PNG, and JPG by clicking the download button below. This PPT design is available in both Standard Screen and Widescreen aspect ratios. It can also be easily personalized and presented with modified font size, font type, color, and shapes to measure your progress in a clear way.
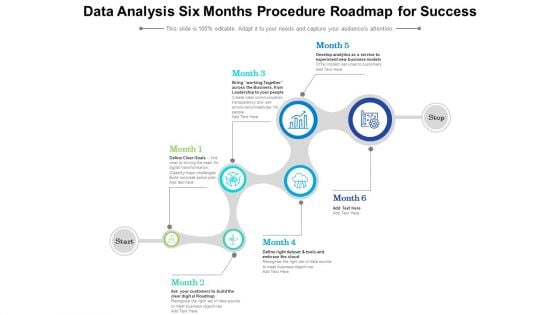
Data Analysis Six Months Procedure Roadmap For Success Ideas
Presenting our innovatively structured data analysis six months procedure roadmap for success ideas Template. Showcase your roadmap process in different formats like PDF, PNG, and JPG by clicking the download button below. This PPT design is available in both Standard Screen and Widescreen aspect ratios. It can also be easily personalized and presented with modified font size, font type, color, and shapes to measure your progress in a clear way.
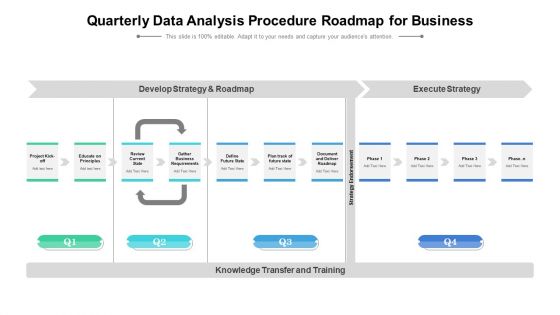
Quarterly Data Analysis Procedure Roadmap For Business Elements
Presenting our innovatively structured quarterly data analysis procedure roadmap for business elements Template. Showcase your roadmap process in different formats like PDF, PNG, and JPG by clicking the download button below. This PPT design is available in both Standard Screen and Widescreen aspect ratios. It can also be easily personalized and presented with modified font size, font type, color, and shapes to measure your progress in a clear way.
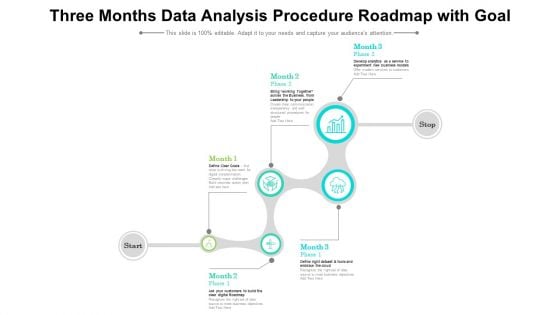
Three Months Data Analysis Procedure Roadmap With Goal Formats
Presenting our innovatively structured three months data analysis procedure roadmap with goal formats Template. Showcase your roadmap process in different formats like PDF, PNG, and JPG by clicking the download button below. This PPT design is available in both Standard Screen and Widescreen aspect ratios. It can also be easily personalized and presented with modified font size, font type, color, and shapes to measure your progress in a clear way.

Quarterly Strategy Roadmap For Data Analysis Integration To Business Themes
Presenting our innovatively-structured quarterly strategy roadmap for data analysis integration to business themes Template. Showcase your roadmap process in different formats like PDF, PNG, and JPG by clicking the download button below. This PPT design is available in both Standard Screen and Widescreen aspect ratios. It can also be easily personalized and presented with modified font size, font type, color, and shapes to measure your progress in a clear way.
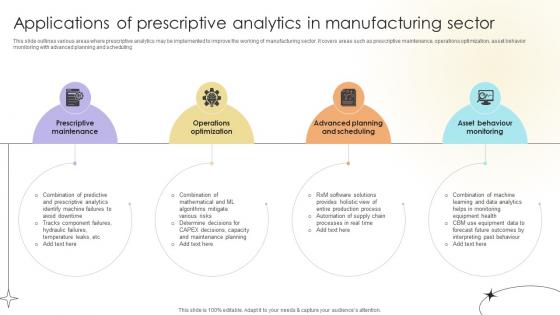
Applications Of Prescriptive Analytics In Manufacturing Sector Data Analytics SS V
This slide outlines various areas where prescriptive analytics may be implemented to improve the working of manufacturing sector. It covers areas such as prescriptive maintenance, operations optimization, asset behavior monitoring with advanced planning and scheduling.Do you have an important presentation coming up Are you looking for something that will make your presentation stand out from the rest Look no further than Applications Of Prescriptive Analytics In Manufacturing Sector Data Analytics SS V. With our professional designs, you can trust that your presentation will pop and make delivering it a smooth process. And with Slidegeeks, you can trust that your presentation will be unique and memorable. So why wait Grab Applications Of Prescriptive Analytics In Manufacturing Sector Data Analytics SS V today and make your presentation stand out from the rest This slide outlines various areas where prescriptive analytics may be implemented to improve the working of manufacturing sector. It covers areas such as prescriptive maintenance, operations optimization, asset behavior monitoring with advanced planning and scheduling.

Email Marketing Project Monthly Status Report PPT Sample SS
The slide presents an email marketing report. It shows status of revenue, impressions, clicks, likes, conversations, growths, followers, etc. Find a pre-designed and impeccable Email Marketing Project Monthly Status Report PPT Sample SS. The templates can ace your presentation without additional effort. You can download these easy-to-edit presentation templates to make your presentation stand out from others. So, what are you waiting for Download the template from Slidegeeks today and give a unique touch to your presentation. The slide presents an email marketing report. It shows status of revenue, impressions, clicks, likes, conversations, growths, followers, etc.
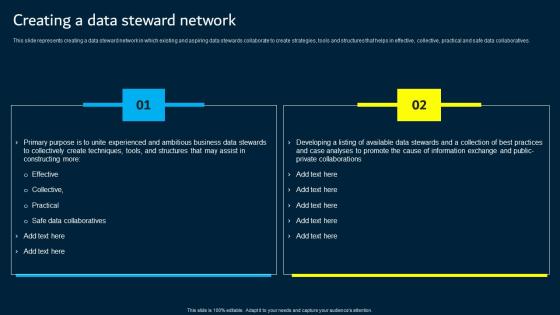
Creating A Data Steward Network Data Custodianship Themes Pdf
This slide represents creating a data steward network in which existing and aspiring data stewards collaborate to create strategies, tools and structures that helps in effective, collective, practical and safe data collaboratives. The Creating A Data Steward Network Data Custodianship Themes Pdf is a compilation of the most recent design trends as a series of slides. It is suitable for any subject or industry presentation, containing attractive visuals and photo spots for businesses to clearly express their messages. This template contains a variety of slides for the user to input data, such as structures to contrast two elements, bullet points, and slides for written information. Slidegeeks is prepared to create an impression. This slide represents creating a data steward network in which existing and aspiring data stewards collaborate to create strategies, tools and structures that helps in effective, collective, practical and safe data collaboratives.
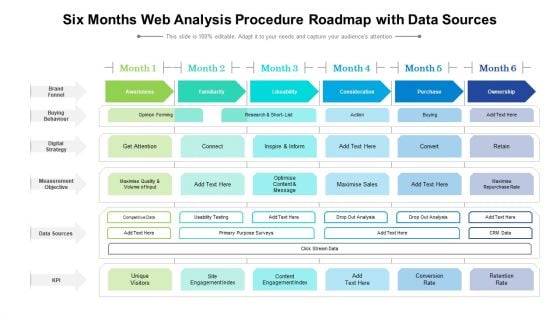
Six Months Web Analysis Procedure Roadmap With Data Sources Diagrams
Presenting our jaw dropping six months web analysis procedure roadmap with data sources diagrams. You can alternate the color, font size, font type, and shapes of this PPT layout according to your strategic process. This PPT presentation is compatible with Google Slides and is available in both standard screen and widescreen aspect ratios. You can also download this well researched PowerPoint template design in different formats like PDF, JPG, and PNG. So utilize this visually appealing design by clicking the download button given below.
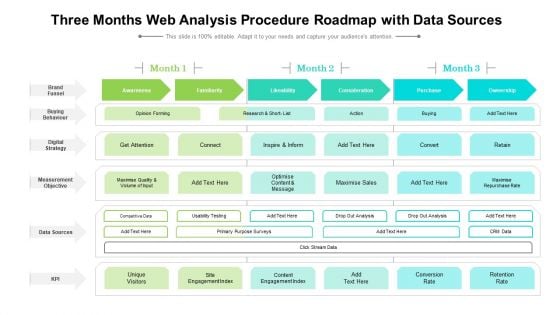
Three Months Web Analysis Procedure Roadmap With Data Sources Guidelines
Presenting our jaw dropping three months web analysis procedure roadmap with data sources guidelines. You can alternate the color, font size, font type, and shapes of this PPT layout according to your strategic process. This PPT presentation is compatible with Google Slides and is available in both standard screen and widescreen aspect ratios. You can also download this well researched PowerPoint template design in different formats like PDF, JPG, and PNG. So utilize this visually appealing design by clicking the download button given below.
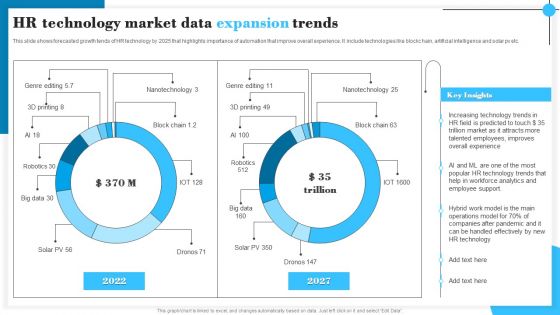
HR Technology Market Data Expansion Trends Information PDF
This slide shows forecasted growth tends of HR technology by 2025 that highlights importance of automation that improve overall experience. It include technologies like blockc hain, artificial intelligence and solar pv etc. Pitch your topic with ease and precision using this HR Technology Market Data Expansion Trends Information PDF. This layout presents information on Increasing Technology, Talented Employees, Employee Support. It is also available for immediate download and adjustment. So, changes can be made in the color, design, graphics or any other component to create a unique layout.
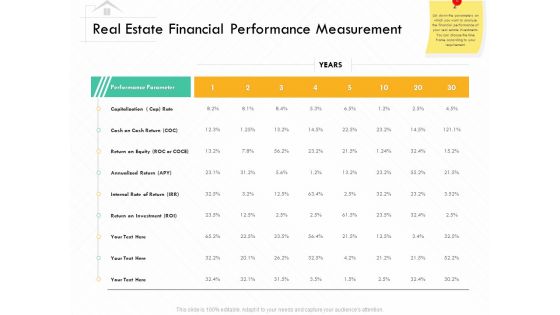
Selling Home Property Real Estate Financial Performance Measurement Ppt Infographics Themes PDF
Deliver and pitch your topic in the best possible manner with this selling home property real estate financial performance measurement ppt infographics themes pdf. Use them to share invaluable insights on performance, equity, investment, cash return and impress your audience. This template can be altered and modified as per your expectations. So, grab it now.
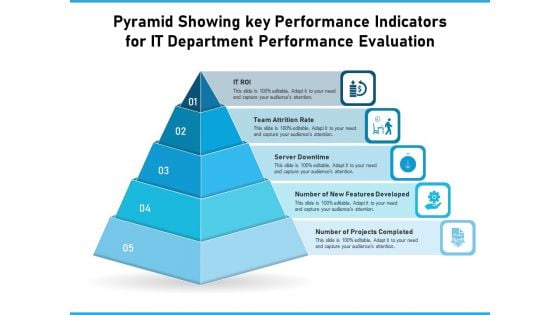
Pyramid Showing Key Performance Indicators For IT Department Performance Evaluation Ppt PowerPoint Presentation Show Graphics Design PDF
Persuade your audience using this pyramid showing key performance indicators for it department performance evaluation ppt powerpoint presentation show graphics design pdf. This PPT design covers five stages, thus making it a great tool to use. It also caters to a variety of topics including it roi, team attrition rate, server downtime, number of new features developed, number of projects completed. Download this PPT design now to present a convincing pitch that not only emphasizes the topic but also showcases your presentation skills.
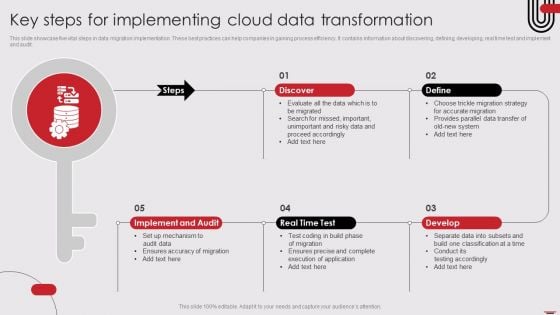
Key Steps For Implementing Cloud Data Transformation Designs PDF
This slide showcase five vital steps in data migration implementation. These best practices can help companies in gaining process efficiency. It contains information about discovering, defining, developing, real time test and implement and audit. Pitch your topic with ease and precision using this Key Steps For Implementing Cloud Data Transformation Designs PDF. This layout presents information on Discover, Define, Develop. It is also available for immediate download and adjustment. So, changes can be made in the color, design, graphics or any other component to create a unique layout.
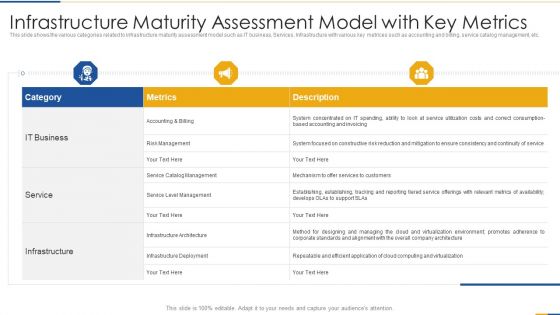
Infrastructure Maturity Assessment Model With Key Metrics Inspiration PDF
Deliver and pitch your topic in the best possible manner with this infrastructure maturity assessment model with key metrics inspiration pdf. Use them to share invaluable insights on accounting and billing, infrastructure architecture, infrastructure deployment and impress your audience. This template can be altered and modified as per your expectations. So, grab it now.


 Continue with Email

 Home
Home


