Dashboards Construction
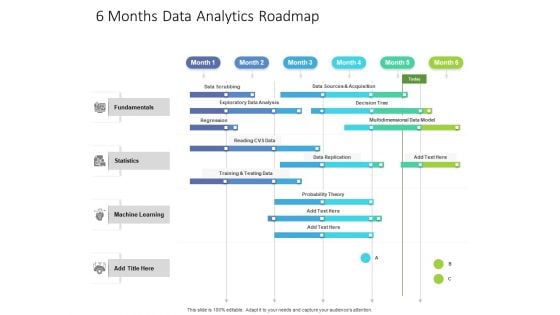
6 Months Data Analytics Roadmap Diagrams
Presenting our innovatively-structured 6 months data analytics roadmap diagrams Template. Showcase your roadmap process in different formats like PDF, PNG, and JPG by clicking the download button below. This PPT design is available in both Standard Screen and Widescreen aspect ratios. It can also be easily personalized and presented with modified font size, font type, color, and shapes to measure your progress in a clear way.
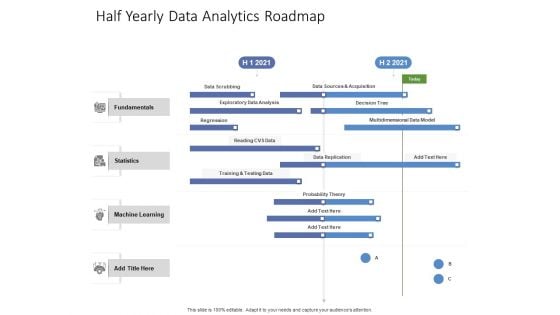
Half Yearly Data Analytics Roadmap Ideas
Presenting our innovatively-structured half yearly data analytics roadmap ideas Template. Showcase your roadmap process in different formats like PDF, PNG, and JPG by clicking the download button below. This PPT design is available in both Standard Screen and Widescreen aspect ratios. It can also be easily personalized and presented with modified font size, font type, color, and shapes to measure your progress in a clear way.
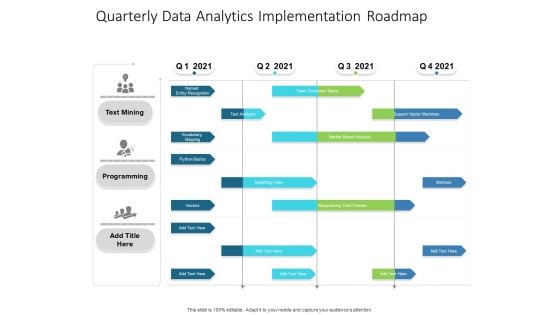
Quarterly Data Analytics Implementation Roadmap Pictures
Presenting our innovatively-structured quarterly data analytics implementation roadmap pictures Template. Showcase your roadmap process in different formats like PDF, PNG, and JPG by clicking the download button below. This PPT design is available in both Standard Screen and Widescreen aspect ratios. It can also be easily personalized and presented with modified font size, font type, color, and shapes to measure your progress in a clear way.
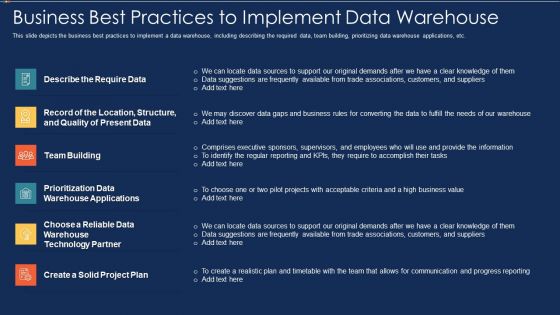
Data Warehousing IT Business Best Practices To Implement Data Warehouse Ppt Ideas Sample PDF
This slide depicts the business best practices to implement a data warehouse, including describing the required data, team building, prioritizing data warehouse applications, etc. Presenting data warehousing it business best practices to implement data warehouse ppt ideas sample pdf to provide visual cues and insights. Share and navigate important information on six stages that need your due attention. This template can be used to pitch topics like plan, team building, prioritization data warehouse applications, technology partner. In addtion, this PPT design contains high resolution images, graphics, etc, that are easily editable and available for immediate download.
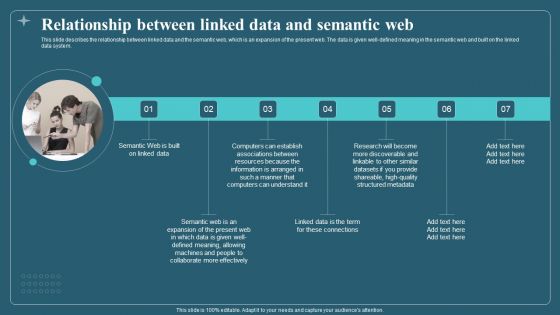
Associated Data IT Relationship Between Linked Data And Semantic Web Download PDF
This slide describes the relationship between linked data and the semantic web, which is an expansion of the present web. The data is given well-defined meaning in the semantic web and built on the linked data system. Presenting Associated Data IT Relationship Between Linked Data And Semantic Web Download PDF to provide visual cues and insights. Share and navigate important information on seven stages that need your due attention. This template can be used to pitch topics like Information, Resources, Linked Data. In addtion, this PPT design contains high resolution images, graphics, etc, that are easily editable and available for immediate download.
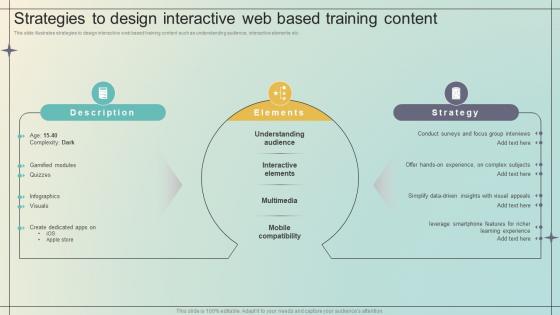
Immersive Training For Practical Strategies To Design Interactive Web Based Training Content DTE SS V
This slide illustrates strategies to design interactive web based training content such as understanding audience, interactive elements etc. The Immersive Training For Practical Strategies To Design Interactive Web Based Training Content DTE SS V is a compilation of the most recent design trends as a series of slides. It is suitable for any subject or industry presentation, containing attractive visuals and photo spots for businesses to clearly express their messages. This template contains a variety of slides for the user to input data, such as structures to contrast two elements, bullet points, and slides for written information. Slidegeeks is prepared to create an impression. This slide illustrates strategies to design interactive web based training content such as understanding audience, interactive elements etc.
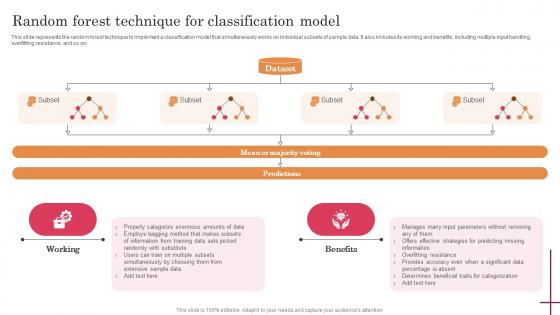
Random Forest Technique For Classification Predictive Analytics For Improved Guidelines Pdf
This slide represents the random forest technique to implement a classification model that simultaneously works on individual subsets of sample data. It also includes its working and benefits, including multiple input handling, overfitting resistance, and so on. Find a pre-designed and impeccable Random Forest Technique For Classification Predictive Analytics For Improved Guidelines Pdf. The templates can ace your presentation without additional effort. You can download these easy-to-edit presentation templates to make your presentation stand out from others. So, what are you waiting for Download the template from Slidegeeks today and give a unique touch to your presentation. This slide represents the random forest technique to implement a classification model that simultaneously works on individual subsets of sample data. It also includes its working and benefits, including multiple input handling, overfitting resistance, and so on.
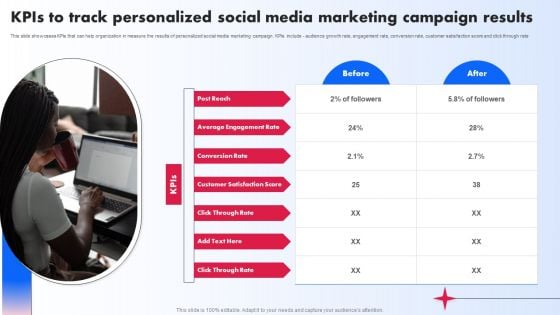
Kpis To Track Personalized Social Media Marketing Campaign Results Ppt PowerPoint Presentation Diagram Images PDF
This slide showcases KPIs that can help organization in measure the results of personalized social media marketing campaign. KPIs include audience growth rate, engagement rate, conversion rate, customer satisfaction score and click through rate. The Kpis To Track Personalized Social Media Marketing Campaign Results Ppt PowerPoint Presentation Diagram Images PDF is a compilation of the most recent design trends as a series of slides. It is suitable for any subject or industry presentation, containing attractive visuals and photo spots for businesses to clearly express their messages. This template contains a variety of slides for the user to input data, such as structures to contrast two elements, bullet points, and slides for written information. Slidegeeks is prepared to create an impression.
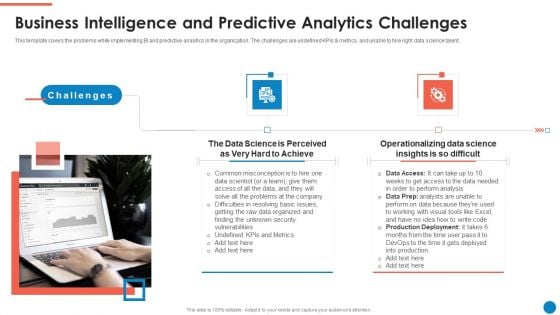
Data And Analytics Playbook Business Intelligence And Predictive Analytics Challenges Template PDF
This template covers the problems while implementing BI and predictive analytics in the organization. The challenges are undefined KPIs and metrics, and unable to hire right data science talent. Presenting Data And Analytics Playbook Business Intelligence And Predictive Analytics Challenges Template PDF to provide visual cues and insights. Share and navigate important information on two stages that need your due attention. This template can be used to pitch topics like Challenges, Data Science, Operationalizing Data Science. In addtion, this PPT design contains high resolution images, graphics, etc, that are easily editable and available for immediate download.
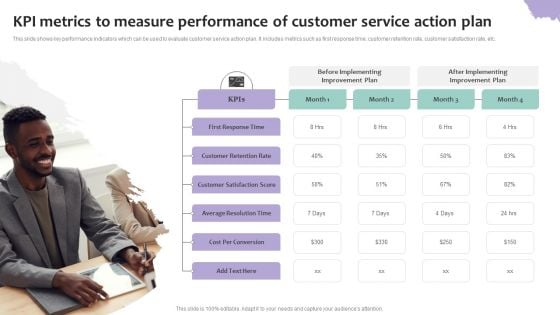
KPI Metrics To Measure Performance Of Customer Service Action Plan Diagrams PDF
This slide shows key performance indicators which can be used to evaluate customer service action plan. It includes metrics such as first response time, customer retention rate, customer satisfaction rate, etc. Persuade your audience using this KPI Metrics To Measure Performance Of Customer Service Action Plan Diagrams PDF. This PPT design covers four stages, thus making it a great tool to use. It also caters to a variety of topics including Before Implementing, Improvement Plan, After Implementing, First Response Time . Download this PPT design now to present a convincing pitch that not only emphasizes the topic but also showcases your presentation skills.
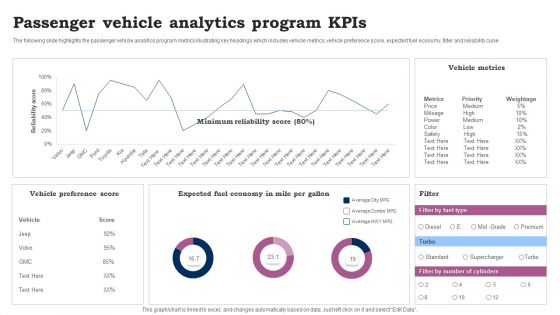
Passenger Vehicle Analytics Program Kpis Ppt Pictures Demonstration PDF
The following slide highlights the passenger vehicle analytics program metrics illustrating key headings which includes vehicle metrics, vehicle preference score, expected fuel economy, filter and reliability curve. Showcasing this set of slides titled Passenger Vehicle Analytics Program Kpis Ppt Pictures Demonstration PDF. The topics addressed in these templates are Vehicle Preference Score, Vehicle Metrics, Expected Fuel Economy. All the content presented in this PPT design is completely editable. Download it and make adjustments in color, background, font etc. as per your unique business setting.
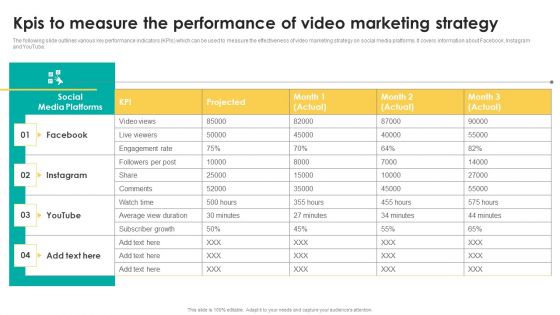
Kpis To Measure The Performance Of Video Marketing Strategy Microsoft PDF
The following slide outlines various key performance indicators KPIs which can be used to measure the effectiveness of video marketing strategy on social media platforms. It covers information about Facebook, Instagram and YouTube. Slidegeeks is here to make your presentations a breeze with Kpis To Measure The Performance Of Video Marketing Strategy Microsoft PDF With our easy to use and customizable templates, you can focus on delivering your ideas rather than worrying about formatting. With a variety of designs to choose from, you are sure to find one that suits your needs. And with animations and unique photos, illustrations, and fonts, you can make your presentation pop. So whether you are giving a sales pitch or presenting to the board, make sure to check out Slidegeeks first.
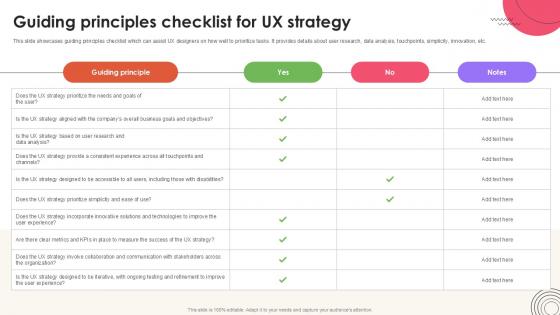
Guiding Principles Checklist User Experience Design Ppt PowerPoint Strategy SS V
This slide showcases guiding principles checklist which can assist UX designers on how well to prioritize tasks. It provides details about user research, data analysis, touchpoints, simplicity, innovation, etc.If your project calls for a presentation, then Slidegeeks is your go-to partner because we have professionally designed, easy-to-edit templates that are perfect for any presentation. After downloading, you can easily edit Guiding Principles Checklist User Experience Design Ppt PowerPoint Strategy SS V and make the changes accordingly. You can rearrange slides or fill them with different images. Check out all the handy templates This slide showcases guiding principles checklist which can assist UX designers on how well to prioritize tasks. It provides details about user research, data analysis, touchpoints, simplicity, innovation, etc.
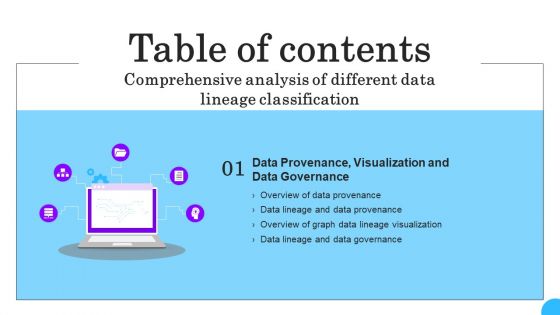
Comprehensive Analysis Of Different Data Lineage Classification Table Of Contents Template PDF
If your project calls for a presentation, then Slidegeeks is your go to partner because we have professionally designed, easy to edit templates that are perfect for any presentation. After downloading, you can easily edit Comprehensive Analysis Of Different Data Lineage Classification Table Of Contents Template PDF and make the changes accordingly. You can rearrange slides or fill them with different images. Check out all the handy templates
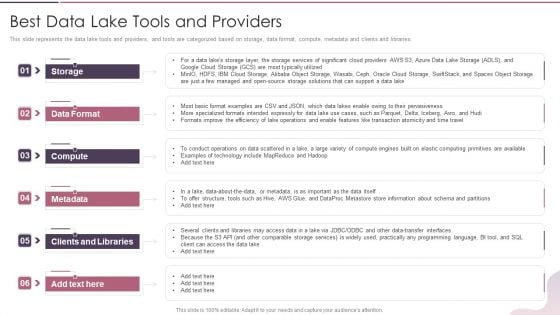
Data Lake Development With Azure Cloud Software Best Data Lake Tools And Providers Inspiration PDF
This slide represents the data lake tools and providers, and tools are categorized based on storage, data format, compute, metadata and clients and libraries. Presenting Data Lake Development With Azure Cloud Software Best Data Lake Tools And Providers Inspiration PDF to provide visual cues and insights. Share and navigate important information on six stages that need your due attention. This template can be used to pitch topics like Data Format, Metadata, Technology. In addtion, this PPT design contains high resolution images, graphics, etc, that are easily editable and available for immediate download.
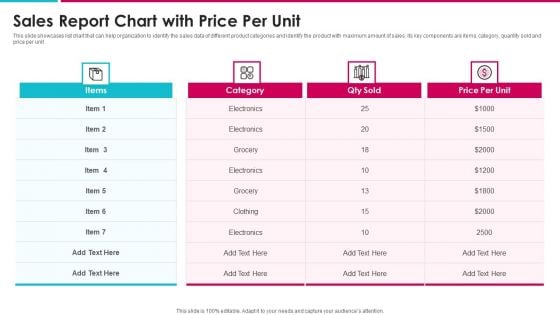
Sales Report Chart With Price Per Unit Information PDF
This slide showcases list chart that can help organization to identify the sales data of different product categories and identify the product with maximum amount of sales. Its key components are items, category, quantity sold and price per unit Showcasing this set of slides titled sales report chart with price per unit information pdf. The topics addressed in these templates are sales report chart with price per unit. All the content presented in this PPT design is completely editable. Download it and make adjustments in color, background, font etc. as per your unique business setting.
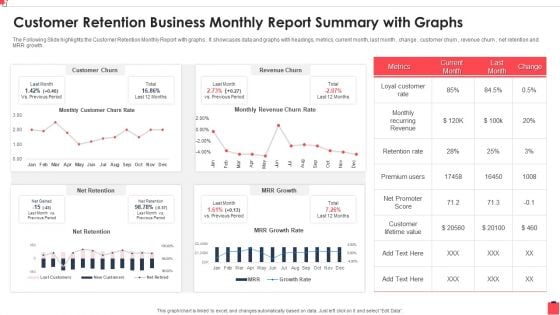
Customer Retention Business Monthly Report Summary With Graphs Guidelines PDF
The Following Slide highlights the Customer Retention Monthly Report with graphs . It showcases data and graphs with headings, metrics, current month, last month , change , customer churn , revenue churn , net retention and MRR growth. Showcasing this set of slides titled Customer Retention Business Monthly Report Summary With Graphs Guidelines PDF The topics addressed in these templates are Recurring Revenue, Customer Churn, Promoter Score All the content presented in this PPT design is completely editable. Download it and make adjustments in color, background, font etc. as per your unique business setting.
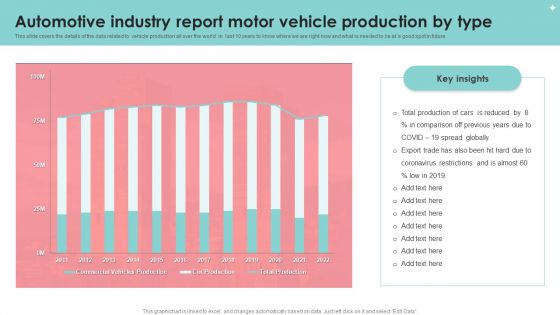
Automotive Industry Report Motor Vehicle Production By Type Portrait PDF
This slide covers the details of the data related to vehicle production all over the world in last 10 years to know where we are right now and what is needed to be at a good spot in future. Pitch your topic with ease and precision using this Automotive Industry Report Motor Vehicle Production By Type Portrait PDF. This layout presents information on Automotive Industry Report, Motor Vehicle Production. It is also available for immediate download and adjustment. So, changes can be made in the color, design, graphics or any other component to create a unique layout.
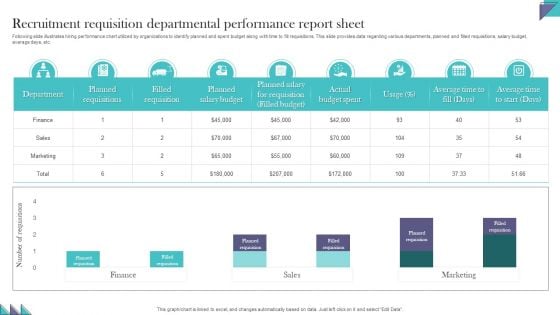
Recruitment Requisition Departmental Performance Report Sheet Demonstration PDF
Following slide illustrates hiring performance chart utilized by organizations to identify planned and spent budget along with time to fill requisitions. This slide provides data regarding various departments, planned and filled requisitions, salary budget, average days, etc. Pitch your topic with ease and precision using this Recruitment Requisition Departmental Performance Report Sheet Demonstration PDF. This layout presents information on Recruitment Requisition, Departmental Performance, Report Sheet. It is also available for immediate download and adjustment. So, changes can be made in the color, design, graphics or any other component to create a unique layout.
Seven Steps Of Data Analysis Process With Icons Ppt PowerPoint Presentation Gallery Good PDF
Persuade your audience using this seven steps of data analysis process with icons ppt powerpoint presentation gallery good pdf. This PPT design covers seven stages, thus making it a great tool to use. It also caters to a variety of topics including implementation of results, data analysis, data accumulation. Download this PPT design now to present a convincing pitch that not only emphasizes the topic but also showcases your presentation skills.

Demand Planning Process With Data Analysis Ppt Gallery Graphics Pictures PDF
Persuade your audience using this demand planning process with data analysis ppt gallery graphics pictures pdf.This PPT design covers four stages, thus making it a great tool to use. It also caters to a variety of topics including preparing data for analysis, managing spikes to analyse data errors. Download this PPT design now to present a convincing pitch that not only emphasizes the topic but also showcases your presentation skills.
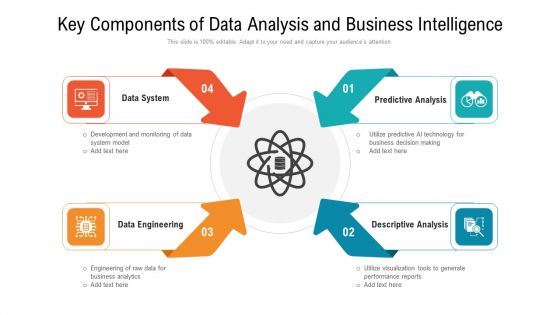
Key Components Of Data Analysis And Business Intelligence Ppt PowerPoint Presentation Pictures Graphics PDF
Persuade your audience using this key components of data analysis and business intelligence ppt powerpoint presentation pictures graphics pdf. This PPT design covers four stages, thus making it a great tool to use. It also caters to a variety of topics including data system, data engineering, predictive analysis. Download this PPT design now to present a convincing pitch that not only emphasizes the topic but also showcases your presentation skills.
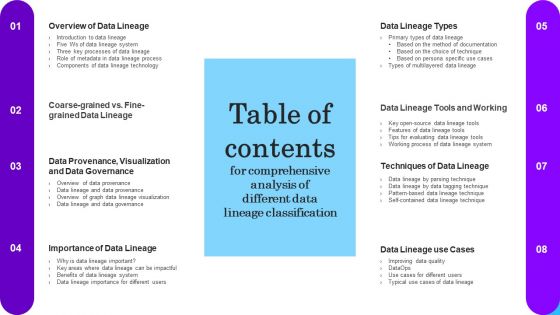
Table Of Contents For Comprehensive Analysis Of Different Data Lineage Classification Elements PDF
Welcome to our selection of the Table Of Contents For Comprehensive Analysis Of Different Data Lineage Classification Elements PDF. These are designed to help you showcase your creativity and bring your sphere to life. Planning and Innovation are essential for any business that is just starting out. This collection contains the designs that you need for your everyday presentations. All of our PowerPoints are 100 percent editable, so you can customize them to suit your needs. This multi purpose template can be used in various situations. Grab these presentation templates today
Evolution Of Comparative Market Analysis In Retail Services Information Pdf
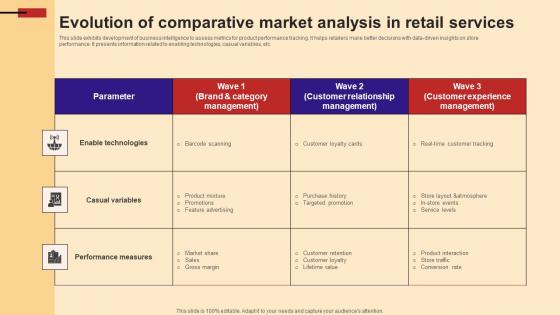
This slide exhibits development of business intelligence to assess metrics for product performance tracking. It helps retailers make better decisions with data driven insights on store performance. It presents information related to enabling technologies, casual variables, etc.Showcasing this set of slides titled Evolution Of Comparative Market Analysis In Retail Services Information Pdf The topics addressed in these templates are Enable Technologies, Performance Measures, Casual Variables All the content presented in this PPT design is completely editable. Download it and make adjustments in color, background, font etc. as per your unique business setting. This slide exhibits development of business intelligence to assess metrics for product performance tracking. It helps retailers make better decisions with data driven insights on store performance. It presents information related to enabling technologies, casual variables, etc.
Marketing Success Metrics Introduction To Marketing Analytics For Strategic Download PDF
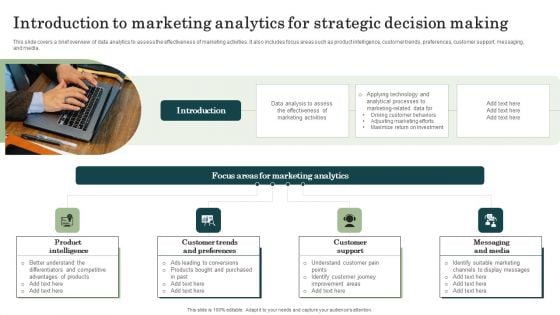
This slide covers a brief overview of data analytics to assess the effectiveness of marketing activities. It also includes focus areas such as product intelligence, customer trends, preferences, customer support, messaging, and media. This Marketing Success Metrics Introduction To Marketing Analytics For Strategic Download PDF from Slidegeeks makes it easy to present information on your topic with precision. It provides customization options, so you can make changes to the colors, design, graphics, or any other component to create a unique layout. It is also available for immediate download, so you can begin using it right away. Slidegeeks has done good research to ensure that you have everything you need to make your presentation stand out. Make a name out there for a brilliant performance.
Technology Trend Ppt PowerPoint Presentation Infographics Designs
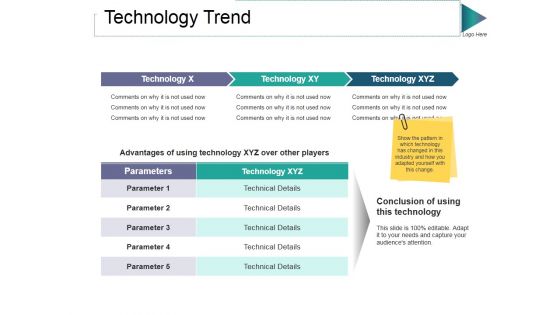
This is a technology trend ppt powerpoint presentation infographics designs. This is a three stage process. The stages in this process are technology, parameters, technical details.
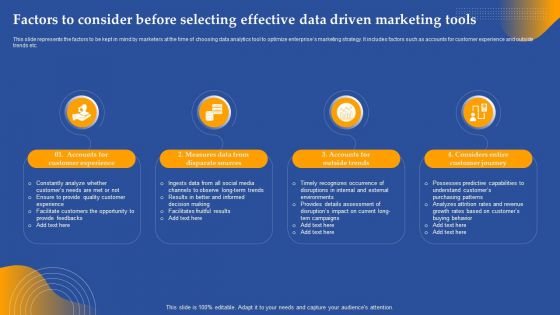
Factors To Consider Before Selecting Effective Data Driven Marketing Tools Ppt Styles Model PDF
This slide represents the factors to be kept in mind by marketers at the time of choosing data analytics tool to optimize enterprises marketing strategy. It includes factors such as accounts for customer experience and outside trends etc. Formulating a presentation can take up a lot of effort and time, so the content and message should always be the primary focus. The visuals of the PowerPoint can enhance the presenters message, so our Factors To Consider Before Selecting Effective Data Driven Marketing Tools Ppt Styles Model PDF was created to help save time. Instead of worrying about the design, the presenter can concentrate on the message while our designers work on creating the ideal templates for whatever situation is needed. Slidegeeks has experts for everything from amazing designs to valuable content, we have put everything into Factors To Consider Before Selecting Effective Data Driven Marketing Tools Ppt Styles Model PDF.
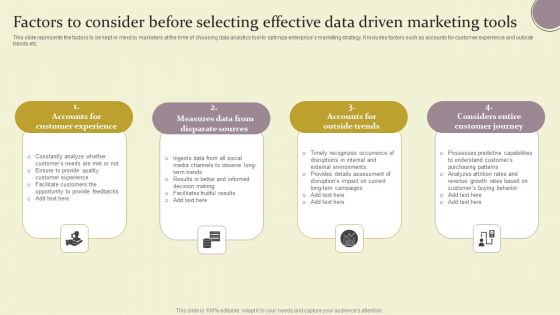
Factors To Consider Before Selecting Effective Data Driven Marketing Tools Ppt Layouts Slide Download PDF
This slide represents the factors to be kept in mind by marketers at the time of choosing data analytics tool to optimize enterprises marketing strategy. It includes factors such as accounts for customer experience and outside trends etc. Formulating a presentation can take up a lot of effort and time, so the content and message should always be the primary focus. The visuals of the PowerPoint can enhance the presenters message, so our Factors To Consider Before Selecting Effective Data Driven Marketing Tools Ppt Layouts Slide Download PDF was created to help save time. Instead of worrying about the design, the presenter can concentrate on the message while our designers work on creating the ideal templates for whatever situation is needed. Slidegeeks has experts for everything from amazing designs to valuable content, we have put everything into Factors To Consider Before Selecting Effective Data Driven Marketing Tools Ppt Layouts Slide Download PDF.
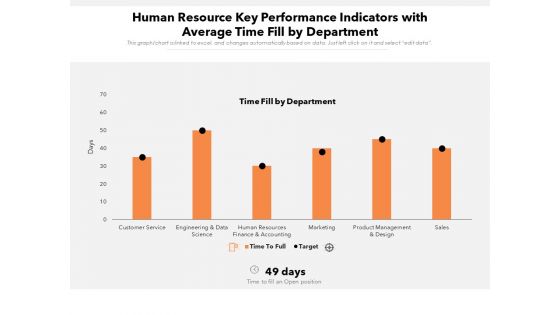
Human Resource Key Performance Indicators With Average Time Fill By Department Ppt PowerPoint Presentation Gallery Example Introduction PDF
Showcasing this set of slides titled human resource key performance indicators with average time fill by department ppt powerpoint presentation gallery example introduction pdf. The topics addressed in these templates are sales, service, finance. All the content presented in this PPT design is completely editable. Download it and make adjustments in color, background, font etc. as per your unique business setting.

Successful Implementation Of Data Management In Your Organization Slides PDF
This slide covers the implementation of data management services in the clients organization from defining the strategy to embed analytics into decision making.Presenting Successful Implementation Of Data Management In Your Organization Slides PDF to provide visual cues and insights. Share and navigate important information on seven stages that need your due attention. This template can be used to pitch topics like Analytics Strategy, Analytical Process, Embed Analytics. In addtion, this PPT design contains high resolution images, graphics, etc, that are easily editable and available for immediate download.
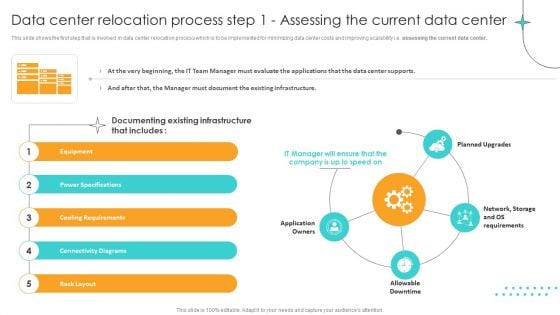
Data Center Relocation Process Step 1 Assessing The Current Data Center Background PDF
This slide shows the first step that is involved in data center relocation process which is to be implemented for minimizing data center costs and improving scalability i.e. assessing the current data center. Welcome to our selection of the Data Center Relocation Process Step 1 Assessing The Current Data Center Background PDF. These are designed to help you showcase your creativity and bring your sphere to life. Planning and Innovation are essential for any business that is just starting out. This collection contains the designs that you need for your everyday presentations. All of our PowerPoints are 100 percent editable, so you can customize them to suit your needs. This multi purpose template can be used in various situations. Grab these presentation templates today.
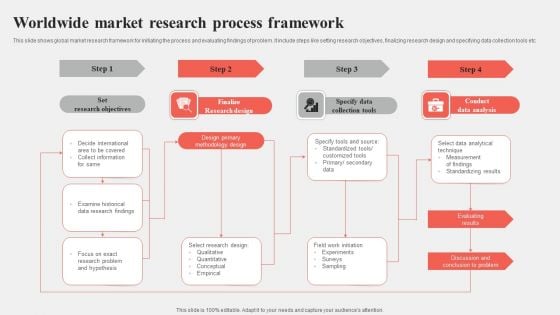
Worldwide Market Research Process Framework Diagrams PDF
This slide shows global market research framework for initiating the process and evaluating findings of problem. It include steps like setting research objectives, finalizing research design and specifying data collection tools etc Persuade your audience using this Worldwide Market Research Process Framework Diagrams PDF. This PPT design covers four stages, thus making it a great tool to use. It also caters to a variety of topics including Research Design, Collection Tools, Data Analysis. Download this PPT design now to present a convincing pitch that not only emphasizes the topic but also showcases your presentation skills.
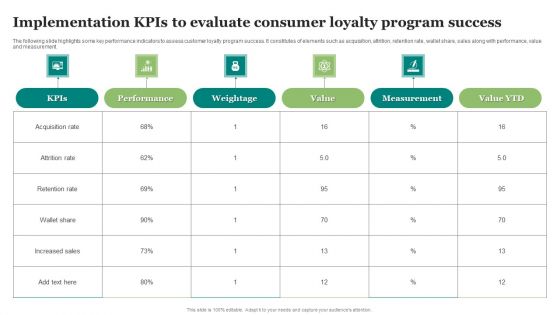
Implementation Kpis To Evaluate Consumer Loyalty Program Success Clipart PDF
The following slide highlights some key performance indicators to assess customer loyalty program success. It constitutes of elements such as acquisition, attrition, retention rate, wallet share, sales along with performance, value and measurement. Showcasing this set of slides titled Implementation Kpis To Evaluate Consumer Loyalty Program Success Clipart PDF. The topics addressed in these templates are Evaluate Consumer, Loyalty Program Success. All the content presented in this PPT design is completely editable. Download it and make adjustments in color, background, font etc. as per your unique business setting.
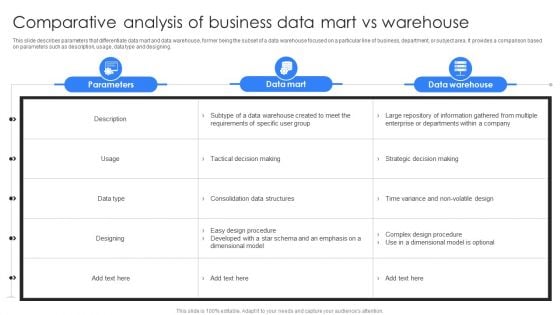
Comparative Analysis Of Business Data Mart Vs Warehouse Ppt Infographics Visual Aids PDF
This slide describes parameters that differentiate data mart and data warehouse, former being the subset of a data warehouse focused on a particular line of business, department, or subject area. it provides a comparison based on parameters such as description, usage, data type and designing. Showcasing this set of slides titled Comparative Analysis Of Business Data Mart Vs Warehouse Ppt Infographics Visual Aids PDF. The topics addressed in these templates are Parameters, Data Mart, Data Warehouse. All the content presented in this PPT design is completely editable. Download it and make adjustments in color, background, font etc. as per your unique business setting.
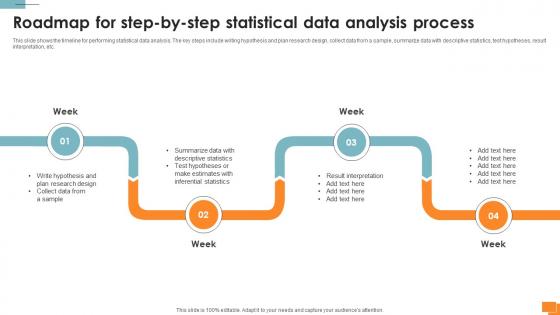
Statistical Tools For Evidence Roadmap For Step By Step Statistical Data Analysis Process
This slide shows the timeline for performing statistical data analysis. The key steps include writing hypothesis and plan research design, collect data from a sample, summarize data with descriptive statistics, test hypotheses, result interpretation, etc. This Statistical Tools For Evidence Roadmap For Step By Step Statistical Data Analysis Process from Slidegeeks makes it easy to present information on your topic with precision. It provides customization options, so you can make changes to the colors, design, graphics, or any other component to create a unique layout. It is also available for immediate download, so you can begin using it right away. Slidegeeks has done good research to ensure that you have everything you need to make your presentation stand out. Make a name out there for a brilliant performance. This slide shows the timeline for performing statistical data analysis. The key steps include writing hypothesis and plan research design, collect data from a sample, summarize data with descriptive statistics, test hypotheses, result interpretation, etc.
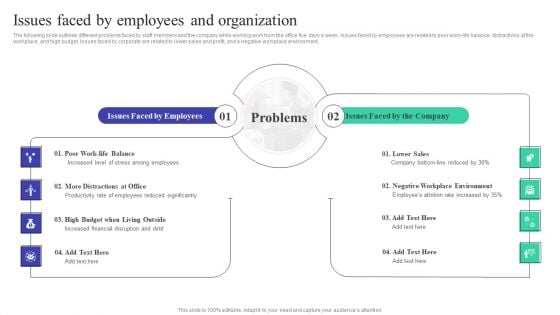
Implementing Adaptive Work Arrangements Issues Faced By Employees And Organization Infographics PDF
The following slide outlines different problems faced by staff members and the company while working work from the office five days a week. Issues faced by employees are related to poor work-life balance, distractions at the workplace, and high budget. Issues faced by corporate are related to lower sales and profit, and a negative workplace environment. From laying roadmaps to briefing everything in detail, our templates are perfect for you. You can set the stage with your presentation slides. All you have to do is download these easy to edit and customizable templates. Implementing Adaptive Work Arrangements Issues Faced By Employees And Organization Infographics PDF will help you deliver an outstanding performance that everyone would remember and praise you for. Do download this presentation today.
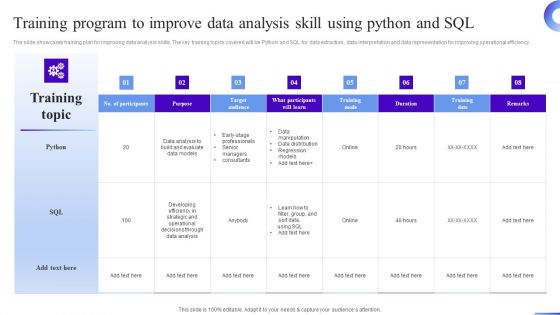
Business Development Program Training Program To Improve Data Analysis Skill Using Microsoft PDF
The slide showcases training plan for improving data analysis skills. The key training topics covered will be Python and SQL for data extraction, data interpretation and data representation for improving operational efficiency. Take your projects to the next level with our ultimate collection of Business Development Program Training Program To Improve Data Analysis Skill Using Microsoft PDF. Slidegeeks has designed a range of layouts that are perfect for representing task or activity duration, keeping track of all your deadlines at a glance. Tailor these designs to your exact needs and give them a truly corporate look with your own brand colors theyll make your projects stand out from the rest.
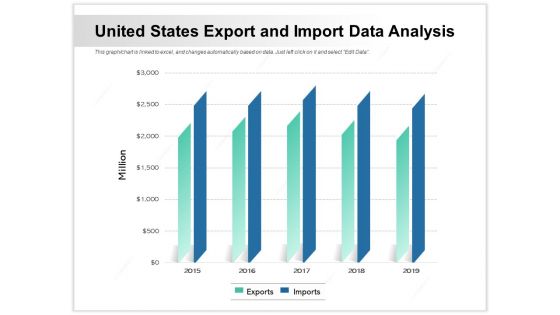
United States Export And Import Data Analysis Ppt PowerPoint Presentation Pictures Clipart Images PDF
Showcasing this set of slides titled united states export and import data analysis ppt powerpoint presentation pictures clipart images pdf. The topics addressed in these templates are united states export and import data analysis. All the content presented in this PPT design is completely editable. Download it and make adjustments in color, background, font etc. as per your unique business setting.
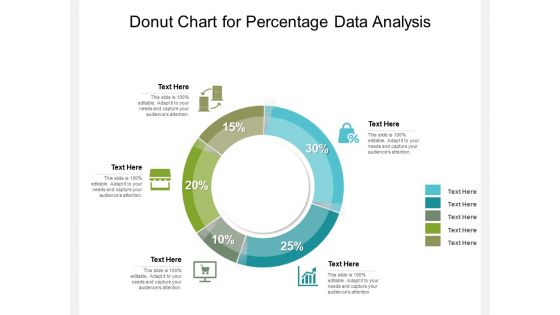
Donut Chart For Percentage Data Analysis Ppt PowerPoint Presentation Gallery Slides PDF
Showcasing this set of slides titled donut chart for percentage data analysis ppt powerpoint presentation gallery slides pdf. The topics addressed in these templates are donut chart for percentage data analysis. All the content presented in this PPT design is completely editable. Download it and make adjustments in color, background, font etc. as per your unique business setting.
Statistical Data Analysis Chart Vector Icon Ppt PowerPoint Presentation Styles Guide PDF
Showcasing this set of slides titled statistical data analysis chart vector icon ppt powerpoint presentation styles guide pdf. The topics addressed in these templates are statistical data analysis chart vector icon. All the content presented in this PPT design is completely editable. Download it and make adjustments in color, background, font etc. as per your unique business setting.
Pie Chart For Business Data Analysis Vector Icon Ppt PowerPoint Presentation Show Good PDF
Showcasing this set of slides titled pie chart for business data analysis vector icon ppt powerpoint presentation show good pdf. The topics addressed in these templates are pie chart for business data analysis vector icon. All the content presented in this PPT design is completely editable. Download it and make adjustments in color, background, font etc. as per your unique business setting.
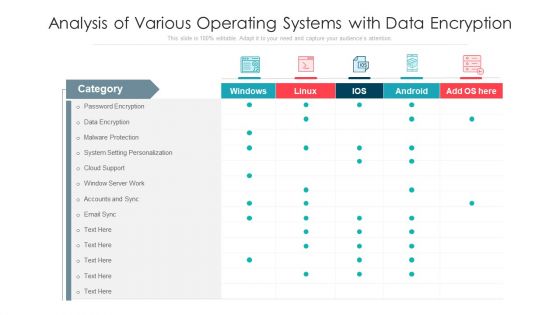
Analysis Of Various Operating Systems With Data Encryption Ppt PowerPoint Presentation Inspiration Structure PDF
Showcasing this set of slides titled analysis of various operating systems with data encryption ppt powerpoint presentation inspiration structure pdf. The topics addressed in these templates are analysis of various operating systems with data encryption. All the content presented in this PPT design is completely editable. Download it and make adjustments in color, background, font etc. as per your unique business setting.
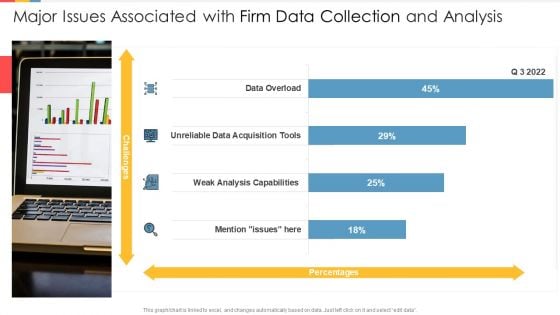
Major Issues Associated With Firm Data Collection And Analysis Demonstration PDF
Showcasing this set of slides titled major issues associated with firm data collection and analysis demonstration pdf. The topics addressed in these templates are major issues associated with firm data collection and analysis. All the content presented in this PPT design is completely editable. Download it and make adjustments in color, background, font etc. as per your unique business setting.
Quantitative Data Analysis Icon For Product Sales Evaluation Ppt Visual Aids Deck PDF
Showcasing this set of slides titled Quantitative Data Analysis Icon For Product Sales Evaluation Ppt Visual Aids Deck PDF. The topics addressed in these templates are Quantitative Data, Analysis Icon, Product Sales Evaluation. All the content presented in this PPT design is completely editable. Download it and make adjustments in color, background, font etc. as per your unique business setting.

Data Analytics IT Prerequisites For Data Science Before Implementing In The Organization Information PDF
This slide represents the prerequisites for data science that include knowledge of machine learning, modeling, statistic, database, and programming languages. Presenting data analytics it prerequisites for data science before implementing in the organization information pdf to provide visual cues and insights. Share and navigate important information on five stages that need your due attention. This template can be used to pitch topics like machine learning, statistic, modeling, programming, databases. In addtion, this PPT design contains high resolution images, graphics, etc, that are easily editable and available for immediate download.
Big Real Time Data Streaming Use Cases Ppt Icon Maker Pdf
This slide depicts big real-time data streaming use cases and features. It includes various applications such as media streaming, real time analytics, e-commerce purchases, credit card fraud detection and personalized customer experience. Showcasing this set of slides titled Big Real Time Data Streaming Use Cases Ppt Icon Maker Pdf. The topics addressed in these templates are Real Time Analytics, E Commerce Purchases, Credit Card Fraud. All the content presented in this PPT design is completely editable. Download it and make adjustments in color, background, font etc. as per your unique business setting. This slide depicts big real-time data streaming use cases and features. It includes various applications such as media streaming, real time analytics, e-commerce purchases, credit card fraud detection and personalized customer experience.

Precedent Transactions Analysis Process Identify Understanding Investment Banking Framework Fin SS V
This slide shows detailed information about the precedent transaction analysis technique which can be used to determine value of company by using similar transactions. It includes steps such as identify, gather detailed data, etc. Explore a selection of the finest Precedent Transactions Analysis Process Identify Understanding Investment Banking Framework Fin SS V here. With a plethora of professionally designed and pre-made slide templates, you can quickly and easily find the right one for your upcoming presentation. You can use our Precedent Transactions Analysis Process Identify Understanding Investment Banking Framework Fin SS V to effectively convey your message to a wider audience. Slidegeeks has done a lot of research before preparing these presentation templates. The content can be personalized and the slides are highly editable. Grab templates today from Slidegeeks. This slide shows detailed information about the precedent transaction analysis technique which can be used to determine value of company by using similar transactions. It includes steps such as identify, gather detailed data, etc.
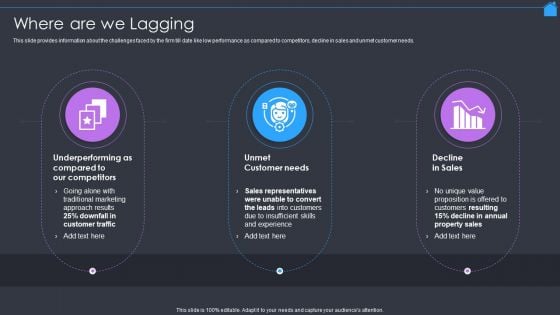
Marketing Strategy To Enhance Real Estate Sales Where Are We Lagging Infographics PDF
This slide provides information about the challenges faced by the firm till date like low performance as compared to competitors, decline in sales and unmet customer needs. This is a Marketing Strategy To Enhance Real Estate Sales Where Are We Lagging Infographics PDF template with various stages. Focus and dispense information on three stages using this creative set, that comes with editable features. It contains large content boxes to add your information on topics like Unmet Customer Needs, Decline In Sales, Traditional Marketing. You can also showcase facts, figures, and other relevant content using this PPT layout. Grab it now.
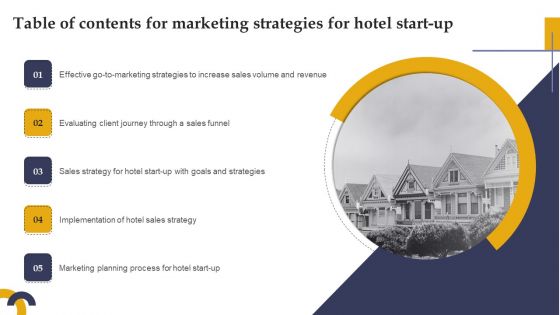
Table Of Contents For Marketing Strategies For Hotel Start Up Pictures PDF
The Table Of Contents For Marketing Strategies For Hotel Start Up Pictures PDF is a compilation of the most recent design trends as a series of slides. It is suitable for any subject or industry presentation, containing attractive visuals and photo spots for businesses to clearly express their messages. This template contains a variety of slides for the user to input data, such as structures to contrast two elements, bullet points, and slides for written information. Slidegeeks is prepared to create an impression.
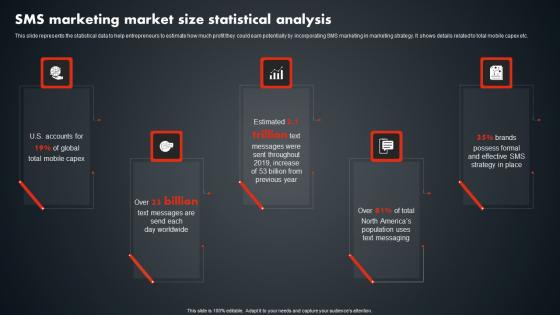
SMS Marketing Market Size Statistical Analysis SMS Promotional Tactics Themes PDF
This slide represents the statistical data to help entrepreneurs to estimate how much profit they could earn potentially by incorporating SMS marketing in marketing strategy. It shows details related to total mobile capex etc. Get a simple yet stunning designed SMS Marketing Market Size Statistical Analysis SMS Promotional Tactics Themes PDF. It is the best one to establish the tone in your meetings. It is an excellent way to make your presentations highly effective. So, download this PPT today from Slidegeeks and see the positive impacts. Our easy-to-edit SMS Marketing Market Size Statistical Analysis SMS Promotional Tactics Themes PDF can be your go-to option for all upcoming conferences and meetings. So, what are you waiting for Grab this template today. This slide represents the statistical data to help entrepreneurs to estimate how much profit they could earn potentially by incorporating SMS marketing in marketing strategy. It shows details related to total mobile capex etc.
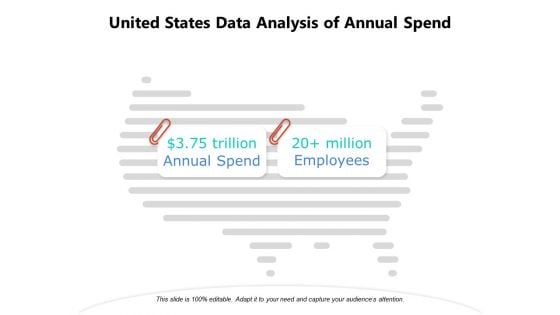
United States Data Analysis Of Annual Spend Ppt PowerPoint Presentation Summary Information PDF
Persuade your audience using this united states data analysis of annual spend ppt powerpoint presentation summary information pdf. This PPT design covers two stages, thus making it a great tool to use. It also caters to a variety of topics including annual spend, employees, data analysis. Download this PPT design now to present a convincing pitch that not only emphasizes the topic but also showcases your presentation skills.
Bulb With Gears And Chart For Research Data Analysis Icon Ppt PowerPoint Presentation File Inspiration PDF
Persuade your audience using this bulb with gears and chart for research data analysis icon ppt powerpoint presentation file inspiration pdf. This PPT design covers one stages, thus making it a great tool to use. It also caters to a variety of topics including bulb with gears and chart for research data analysis icon. Download this PPT design now to present a convincing pitch that not only emphasizes the topic but also showcases your presentation skills.
Quantitative Data Analysis Icon For IT Project Ppt Gallery Master Slide PDF
Persuade your audience using this Quantitative Data Analysis Icon For IT Project Ppt Gallery Master Slide PDF. This PPT design covers one stages, thus making it a great tool to use. It also caters to a variety of topics including Quantitative Data, Analysis Icon, IT Project. Download this PPT design now to present a convincing pitch that not only emphasizes the topic but also showcases your presentation skills.
Demographic Statistics Icon Depicting Data Analysis And User Profile Brochure PDF
Persuade your audience using this Demographic Statistics Icon Depicting Data Analysis And User Profile Brochure PDF. This PPT design covers three stages, thus making it a great tool to use. It also caters to a variety of topics including Demographic Statistics, Icon Depicting, Data Analysis. Download this PPT design now to present a convincing pitch that not only emphasizes the topic but also showcases your presentation skills.
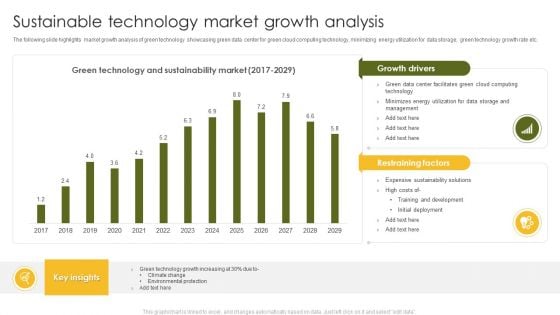
Sustainable Technology Market Growth Analysis Ppt Outline Slide Download PDF
The following slide highlights market growth analysis of green technology showcasing green data center for green cloud computing technology, minimizing energy utilization for data storage, green technology growth rate etc. Showcasing this set of slides titled Sustainable Technology Market Growth Analysis Ppt Outline Slide Download PDF. The topics addressed in these templates are Climate Change, Environmental Protection, Green Technology. All the content presented in this PPT design is completely editable. Download it and make adjustments in color, background, font etc. as per your unique business setting.
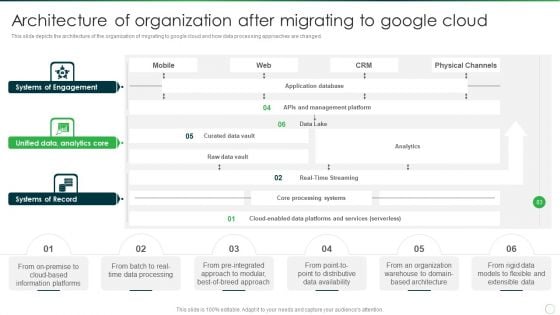
Google Cloud Computing System Architecture Of Organization After Migrating To Google Cloud Brochure PDF
This slide depicts the architecture of the organization of migrating to google cloud and how data processing approaches are changed. Deliver an awe inspiring pitch with this creative Google Cloud Computing System Architecture Of Organization After Migrating To Google Cloud Brochure PDF bundle. Topics like Analytics Core, Systems Of Engagement, Systems Of Record can be discussed with this completely editable template. It is available for immediate download depending on the needs and requirements of the user.

Trends In Business Management Template Ppt Design
This is a trends in business management template ppt design. This is a three stage process. The stages in this process are business strategy focus on growth, corporate strategy, preventing cyber attacks.
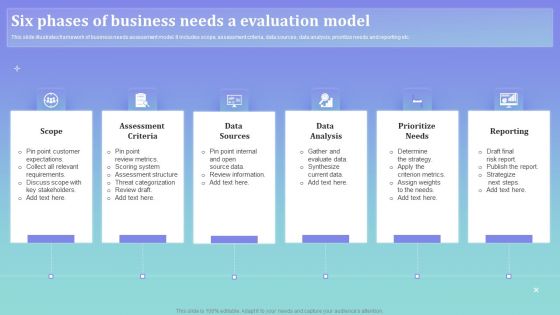
Six Phases Of Business Needs A Evaluation Model Ppt PowerPoint Presentation Gallery Portrait PDF
This slide illustrates framework of business needs assessment model. It includes scope, assessment criteria, data sources, data analysis, prioritize needs and reporting etc. Persuade your audience using this Six Phases Of Business Needs A Evaluation Model Ppt PowerPoint Presentation Gallery Portrait PDF. This PPT design covers six stages, thus making it a great tool to use. It also caters to a variety of topics including Assessment Criteria, Data Sources, Data Analysis. Download this PPT design now to present a convincing pitch that not only emphasizes the topic but also showcases your presentation skills.
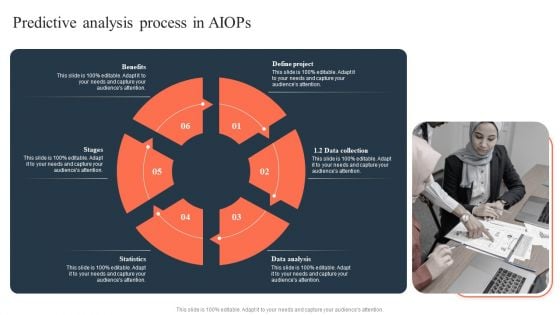
Ml And Big Data In Information Technology Processes Predictive Analysis Process In Aiops Download PDF
Slidegeeks is here to make your presentations a breeze with Ml And Big Data In Information Technology Processes Predictive Analysis Process In Aiops Download PDF With our easy to use and customizable templates, you can focus on delivering your ideas rather than worrying about formatting. With a variety of designs to choose from, you are sure to find one that suits your needs. And with animations and unique photos, illustrations, and fonts, you can make your presentation pop. So whether you are giving a sales pitch or presenting to the board, make sure to check out Slidegeeks first.
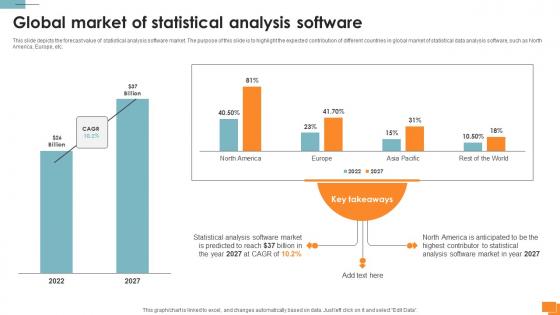
Statistical Tools For Evidence Global Market Of Statistical Analysis Software
This slide depicts the forecast value of statistical analysis software market. The purpose of this slide is to highlight the expected contribution of different countries in global market of statistical data analysis software, such as North America, Europe, etc. This modern and well-arranged Statistical Tools For Evidence Global Market Of Statistical Analysis Software provides lots of creative possibilities. It is very simple to customize and edit with the Powerpoint Software. Just drag and drop your pictures into the shapes. All facets of this template can be edited with Powerpoint, no extra software is necessary. Add your own material, put your images in the places assigned for them, adjust the colors, and then you can show your slides to the world, with an animated slide included. This slide depicts the forecast value of statistical analysis software market. The purpose of this slide is to highlight the expected contribution of different countries in global market of statistical data analysis software, such as North America, Europe, etc.


 Continue with Email

 Home
Home


