Dashboards Construction
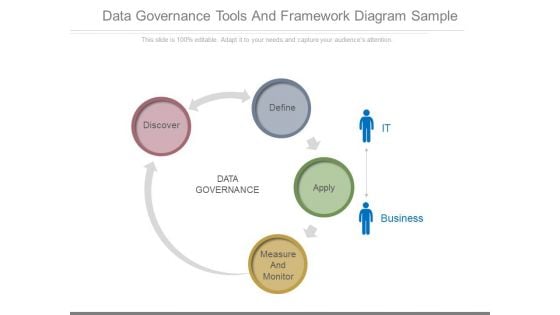
Data Governance Tools And Framework Diagram Sample
This is a data governance tools and framework diagram sample. This is a four stage process. The stages in this process are discover, define, apply, measure and monitor, data governance, it, business.
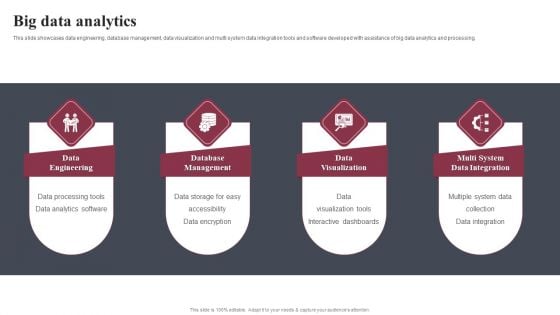
Business Software Development Company Profile Big Data Analytics Professional PDF
This slide showcases data engineering, database management, data visualization and multi system data integration tools and software developed with assistance of big data analytics and processing. Presenting Business Software Development Company Profile Big Data Analytics Professional PDF to provide visual cues and insights. Share and navigate important information on four stages that need your due attention. This template can be used to pitch topics like Data Engineering, Database Management, Data Visualization. In addtion, this PPT design contains high resolution images, graphics, etc, that are easily editable and available for immediate download.
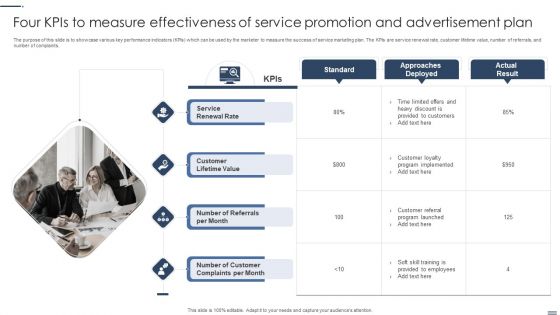
Four Kpis To Measure Effectiveness Of Service Promotion And Advertisement Plan Information PDF
The purpose of this slide is to showcase various key performance indicators KPIs which can be used by the marketer to measure the success of service marketing plan. The KPIs are service renewal rate, customer lifetime value, number of referrals, and number of complaints.Persuade your audience using this Four Kpis To Measure Effectiveness Of Service Promotion And Advertisement Plan Information PDF. This PPT design covers four stages, thus making it a great tool to use. It also caters to a variety of topics including Service, Program, Provided Employees. Download this PPT design now to present a convincing pitch that not only emphasizes the topic but also showcases your presentation skills.
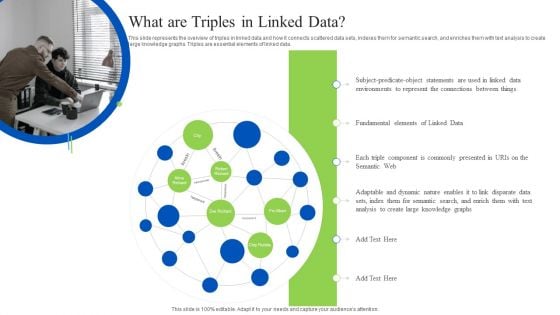
Linked Data Visualization What Are Triples In Linked Data Ppt Model Topics PDF
This slide represents the overview of triples in linked data and how it connects scattered data sets, indexes them for semantic search, and enriches them with text analysis to create large knowledge graphs. Triples are essential elements of linked data. Retrieve professionally designed Linked Data Visualization What Are Triples In Linked Data Ppt Model Topics PDF to effectively convey your message and captivate your listeners. Save time by selecting pre-made slideshows that are appropriate for various topics, from business to educational purposes. These themes come in many different styles, from creative to corporate, and all of them are easily adjustable and can be edited quickly. Access them as PowerPoint templates or as Google Slides themes. You dont have to go on a hunt for the perfect presentation because Slidegeeks got you covered from everywhere.
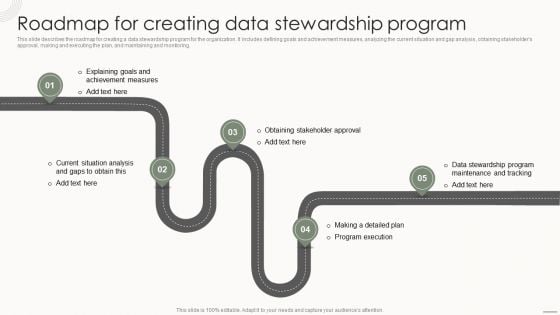
Data Governance IT Roadmap For Creating Data Stewardship Program Demonstration PDF
This slide describes the roadmap for creating a data stewardship program for the organization. It includes defining goals and achievement measures, analyzing the current situation and gap analysis, obtaining stakeholders approval, making and executing the plan, and maintaining and monitoring. This Data Governance IT Roadmap For Creating Data Stewardship Program Demonstration PDF is perfect for any presentation, be it in front of clients or colleagues. It is a versatile and stylish solution for organizing your meetings. The Data Governance IT Roadmap For Creating Data Stewardship Program Demonstration PDF features a modern design for your presentation meetings. The adjustable and customizable slides provide unlimited possibilities for acing up your presentation. Slidegeeks has done all the homework before launching the product for you. So, do not wait, grab the presentation templates today.
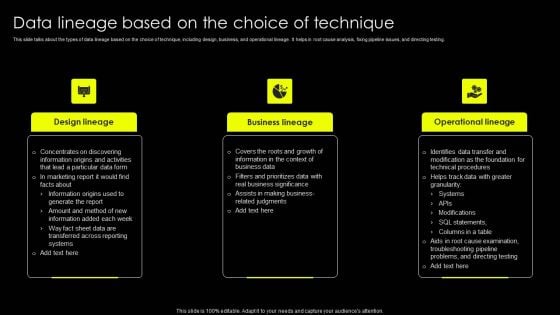
Data Lineage Implementation Data Lineage Based On The Choice Of Technique Clipart PDF
This slide talks about the types of data lineage based on the choice of technique, including design, business, and operational lineage. It helps in root cause analysis, fixing pipeline issues, and directing testing. Find highly impressive Data Lineage Implementation Data Lineage Based On The Choice Of Technique Clipart PDF on Slidegeeks to deliver a meaningful presentation. You can save an ample amount of time using these presentation templates. No need to worry to prepare everything from scratch because Slidegeeks experts have already done a huge research and work for you. You need to download Data Lineage Implementation Data Lineage Based On The Choice Of Technique Clipart PDF for your upcoming presentation. All the presentation templates are 100 percent editable and you can change the color and personalize the content accordingly. Download now.
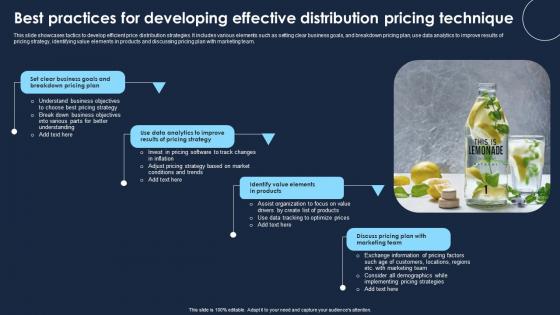
Best Practices For Developing Effective Distribution Pricing Technique Professional Pdf
This slide showcases tactics to develop efficient price distribution strategies. It includes various elements such as setting clear business goals, and breakdown pricing plan, use data analytics to improve results of pricing strategy, identifying value elements in products and discussing pricing plan with marketing team. Showcasing this set of slides titled Best Practices For Developing Effective Distribution Pricing Technique Professional Pdf The topics addressed in these templates are Clear Business, Goals And Breakdown, Pricing Plan All the content presented in this PPT design is completely editable. Download it and make adjustments in color, background, font etc. as per your unique business setting. This slide showcases tactics to develop efficient price distribution strategies. It includes various elements such as setting clear business goals, and breakdown pricing plan, use data analytics to improve results of pricing strategy, identifying value elements in products and discussing pricing plan with marketing team.

Key Facts UI UX Enhancement Solution Investor Funding Elevator Pitch Deck
The following slide showcases various factors that presents how company is becoming a leading mobile app analytics platform in market. It highlights SDK installed, data points collected and issues identified. If your project calls for a presentation, then Slidegeeks is your go-to partner because we have professionally designed, easy-to-edit templates that are perfect for any presentation. After downloading, you can easily edit Key Facts UI UX Enhancement Solution Investor Funding Elevator Pitch Deck and make the changes accordingly. You can rearrange slides or fill them with different images. Check out all the handy templates The following slide showcases various factors that presents how company is becoming a leading mobile app analytics platform in market. It highlights SDK installed, data points collected and issues identified.
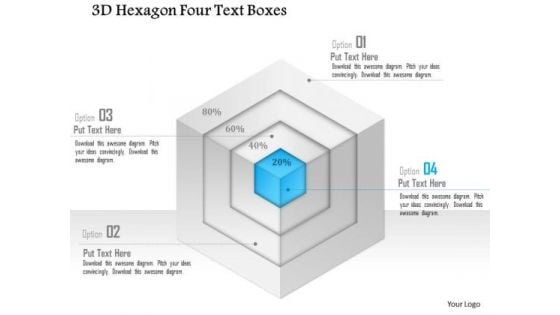
Business Diagram 3d Hexagon Four Text Boxes PowerPoint Template
Graphic of 3d hexagon diagram and text boxes are used to craft this power point template slide. This PPT slide contains the concept of data representation. Use this PPT for your business and marketing data flow related presentations.
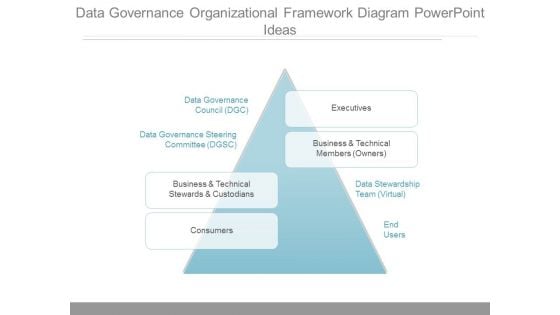
Data Governance Organizational Framework Diagram Powerpoint Ideas
This is a data governance organizational framework diagram powerpoint ideas. This is a one stage process. The stages in this process are data governance council dgc, data governance steering committee dgsc, business and technical stewards and custodians, consumers, executives, business and technical members owners, data stewardship team virtual, end users.
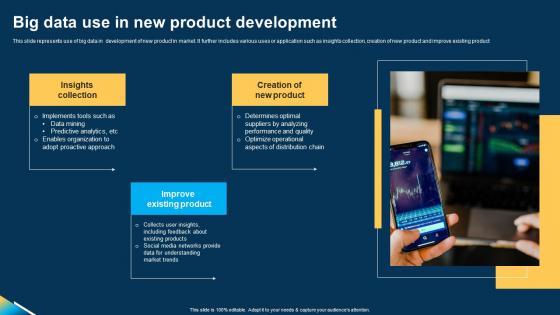
Big Data Use In New Product Development Ppt Model Grid pdf
This slide represents use of big data in development of new product in market. It further includes various uses or application such as insights collection, creation of new product and improve existing product. Pitch your topic with ease and precision using this Big Data Use In New Product Development Ppt Model Grid pdf. This layout presents information on Insights Collection, Creation New Product, Improve Existing Product. It is also available for immediate download and adjustment. So, changes can be made in the color, design, graphics or any other component to create a unique layout. This slide represents use of big data in development of new product in market. It further includes various uses or application such as insights collection, creation of new product and improve existing product.
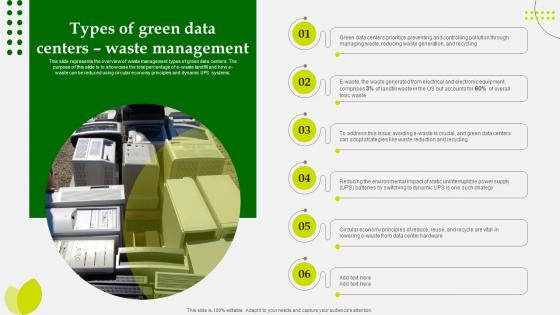
Green Computing Types Of Green Data Centers Waste Management
This slide represents the overview of waste management types of green data centers. The purpose of this slide is to showcase the total percentage of e-waste landfill and how e-waste can be reduced using circular economy principles and dynamic UPS systems. If you are looking for a format to display your unique thoughts, then the professionally designed Green Computing Types Of Green Data Centers Waste Management is the one for you. You can use it as a Google Slides template or a PowerPoint template. Incorporate impressive visuals, symbols, images, and other charts. Modify or reorganize the text boxes as you desire. Experiment with shade schemes and font pairings. Alter, share or cooperate with other people on your work. Download Green Computing Types Of Green Data Centers Waste Management and find out how to give a successful presentation. Present a perfect display to your team and make your presentation unforgettable. This slide represents the overview of waste management types of green data centers. The purpose of this slide is to showcase the total percentage of e-waste landfill and how e-waste can be reduced using circular economy principles and dynamic UPS systems.
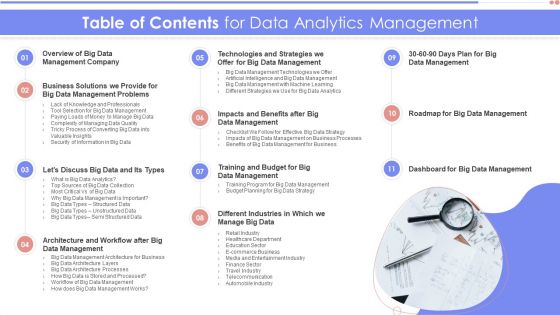
Table Of Contents For Data Analytics Management Sample PDF
Presenting Table Of Contents For Data Analytics Management Sample PDF to provide visual cues and insights. Share and navigate important information on one stage that need your due attention. This template can be used to pitch topics like Management Company, Management Problems, Data Management. In addtion, this PPT design contains high resolution images, graphics, etc, that are easily editable and available for immediate download.
Business Diagram Infographics Design With Five Options Presentation Template
Five staged info graphics has been used to craft this power point template diagram. This PPT diagram contains the concept of data flow and data technology. Use this PPT for business and data related presentations.
Employee Competency Matrix Data And Analytics Ppt Show Graphics PDF
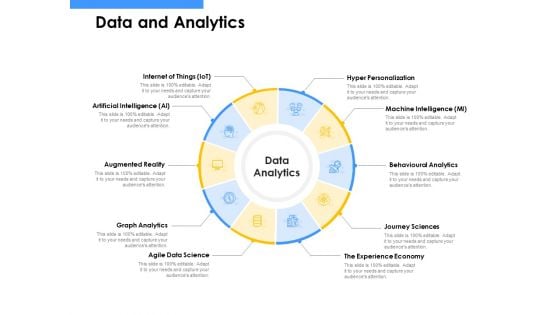
Presenting employee competency matrix data and analytics ppt show graphics pdf to provide visual cues and insights. Share and navigate important information on ten stages that need your due attention. This template can be used to pitch topics like hyper personalization, machine intelligence, behavioural analytics, journey sciences, the experience economy, agile data science, internet of things. In addition, this PPT design contains high-resolution images, graphics, etc, that are easily editable and available for immediate download.
Data Analytics Team Cost Structure One Pager Sample Example Document
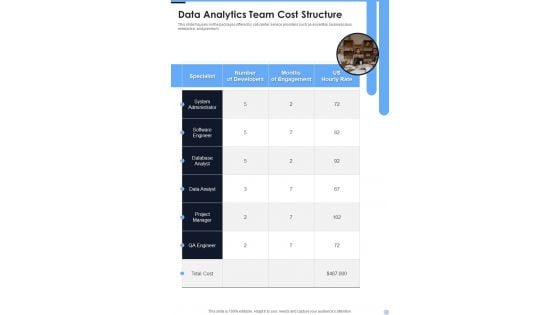
Presenting you an exemplary Data Analytics Team Cost Structure One Pager Sample Example Document. Our one-pager comprises all the must-have essentials of an inclusive document. You can edit it with ease, as its layout is completely editable. With such freedom, you can tweak its design and other elements to your requirements. Download this Data Analytics Team Cost Structure One Pager Sample Example Document brilliant piece now.
Statistical Data Supporting Use Of Instagram For Social Media Online Venue Advertising Plan Strategy SS V
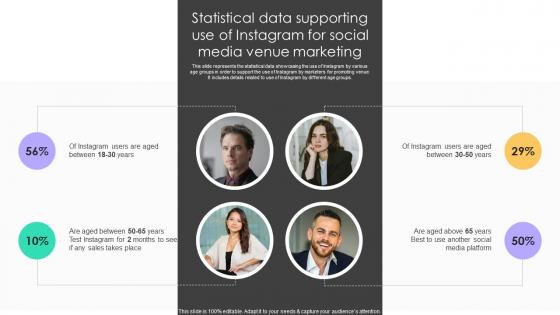
This slide represents the statistical data showcasing the use of Instagram by various age groups in order to support the use of Instagram by marketers for promoting venue. It includes details related to use of Instagram by different age groups. Do you have an important presentation coming up Are you looking for something that will make your presentation stand out from the rest Look no further than Statistical Data Supporting Use Of Instagram For Social Media Online Venue Advertising Plan Strategy SS V. With our professional designs, you can trust that your presentation will pop and make delivering it a smooth process. And with Slidegeeks, you can trust that your presentation will be unique and memorable. So why wait Grab Statistical Data Supporting Use Of Instagram For Social Media Online Venue Advertising Plan Strategy SS V today and make your presentation stand out from the rest. This slide represents the statistical data showcasing the use of Instagram by various age groups in order to support the use of Instagram by marketers for promoting venue. It includes details related to use of Instagram by different age groups.

Applications Of Data Masking Internet Of Things Security Technology Topics Pdf
This slide represents the various applications of data masking technology that helps to protect sensitive data by providing a functional alternative for networks. The various categories include encryption, scrambling, nulling out, substitution, shuffling, etc. Showcasing this set of slides titled Applications Of Data Masking Internet Of Things Security Technology Topics Pdf The topics addressed in these templates are Encryption, Scrambling, Substitution, Shuffling All the content presented in this PPT design is completely editable. Download it and make adjustments in color, background, font etc. as per your unique business setting. This slide represents the various applications of data masking technology that helps to protect sensitive data by providing a functional alternative for networks. The various categories include encryption, scrambling, nulling out, substitution, shuffling, etc.
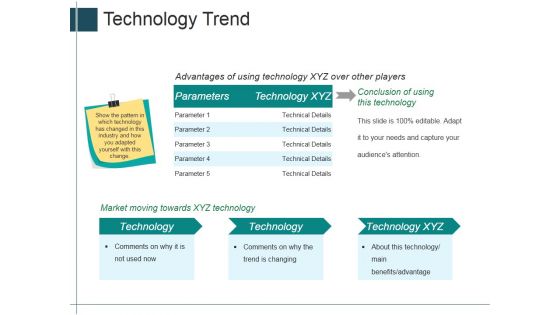
Technology Trend Ppt PowerPoint Presentation Layouts Designs Download
This is a technology trend ppt powerpoint presentation layouts designs download. This is a three stage process. The stages in this process are parameters, technology, technical details.
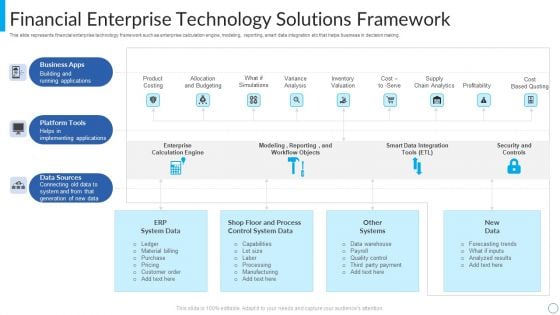
Financial Enterprise Technology Solutions Framework Diagrams PDF
This slide represents financial enterprise technology framework such as enterprise calculation engine, modeling, reporting, smart data integration etc that helps business in decision making. Showcasing this set of slides titled Financial Enterprise Technology Solutions Framework Diagrams PDF. The topics addressed in these templates are Business Apps, Platform Tools, Data Sources. All the content presented in this PPT design is completely editable. Download it and make adjustments in color, background, font etc. as per your unique business setting.
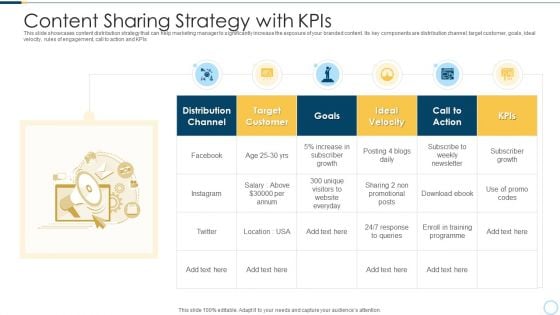
Content Sharing Strategy With Kpis Introduction PDF
This slide showcases content distribution strategy that can help marketing manager to significantly increase the exposure of your branded content. Its key components are distribution channel, target customer, goals, ideal velocity, rules of engagement, call to action and KPIs Pitch your topic with ease and precision using this content sharing strategy with kpis introduction pdf. This layout presents information on distribution channel, target customer, goals, ideal velocity, call to action. It is also available for immediate download and adjustment. So, changes can be made in the color, design, graphics or any other component to create a unique layout.
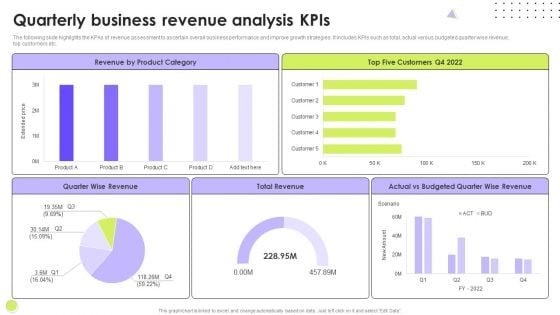
Quarterly Business Revenue Analysis Kpis Slides PDF
The following slide highlights the KPAs of revenue assessment to ascertain overall business performance and improve growth strategies. It includes KPIs such as total, actual versus budgeted quarter wise revenue, top customers etc. Showcasing this set of slides titled Quarterly Business Revenue Analysis Kpis Slides PDF. The topics addressed in these templates are Quarter Wise Revenue, Customers, Budgeted Quarter. All the content presented in this PPT design is completely editable. Download it and make adjustments in color, background, font etc. as per your unique business setting.
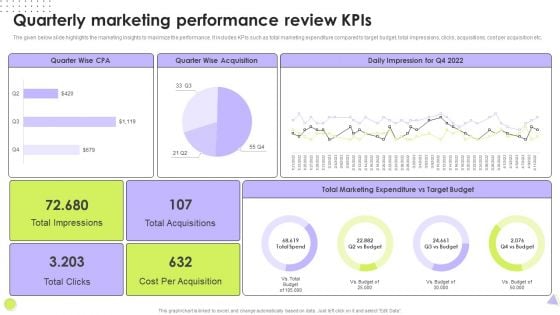
Quarterly Marketing Performance Review Kpis Background PDF
The given below slide highlights the marketing insights to maximize the performance. It includes KPIs such as total marketing expenditure compared to target budget, total impressions, clicks, acquisitions, cost per acquisition etc. Showcasing this set of slides titled Quarterly Marketing Performance Review Kpis Background PDF. The topics addressed in these templates are Total Acquisitions, Cost Per Acquisition, Marketing Expenditure. All the content presented in this PPT design is completely editable. Download it and make adjustments in color, background, font etc. as per your unique business setting.
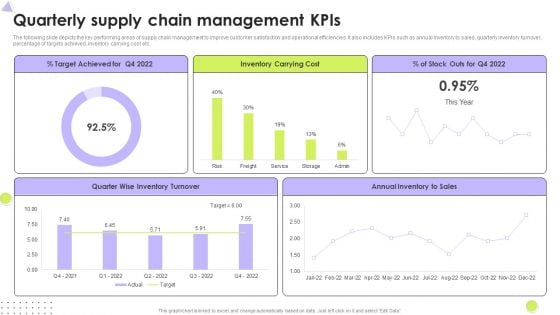
Quarterly Supply Chain Management Kpis Mockup PDF
The following slide depicts the key performing areas of supply chain management to improve customer satisfaction and operational efficiencies. It also includes KPIs such as annual inventory to sales, quarterly inventory turnover, percentage of targets achieved, inventory carrying cost etc. Pitch your topic with ease and precision using this Quarterly Supply Chain Management Kpis Mockup PDF. This layout presents information on Inventory Turnover, Inventory Carrying Cost, Target Achieved. It is also available for immediate download and adjustment. So, changes can be made in the color, design, graphics or any other component to create a unique layout.
Best Practices To Plan Crowdsourcing Data Project Icons Pdf
This slide highlights Best practices to plan crowdsourcing project. It includes various phases such as set goals, choose target participants, encourage participation, give rewards, disclose financial compensation, monitor and track performance. Pitch your topic with ease and precision using this Best Practices To Plan Crowdsourcing Data Project Icons Pdf This layout presents information on Set Clear Goals, Choose Target Participants, Financial Compensation It is also available for immediate download and adjustment. So, changes can be made in the color, design, graphics or any other component to create a unique layout. This slide highlights Best practices to plan crowdsourcing project. It includes various phases such as set goals, choose target participants, encourage participation, give rewards, disclose financial compensation, monitor and track performance.

Authorization In Application Security For Data Privacy Application Security Testing
This slide discusses the overview of authorization in application security for authorized access of resource. Slidegeeks is here to make your presentations a breeze with Authorization In Application Security For Data Privacy Application Security Testing With our easy-to-use and customizable templates, you can focus on delivering your ideas rather than worrying about formatting. With a variety of designs to choose from, you are sure to find one that suits your needs. And with animations and unique photos, illustrations, and fonts, you can make your presentation pop. So whether you are giving a sales pitch or presenting to the board, make sure to check out Slidegeeks first This slide discusses the overview of authorization in application security for authorized access of resource.
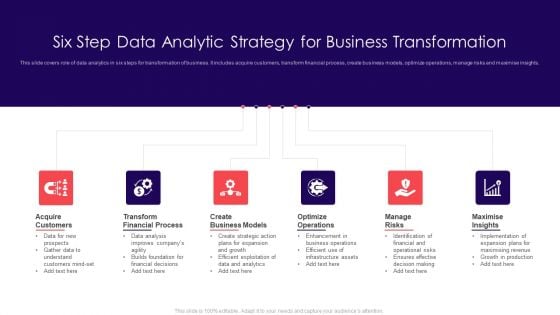
Six Step Data Analytic Strategy For Business Transformation Download PDF
This slide covers role of data analytics in six steps for transformation of business. It includes acquire customers, transform financial process, create business models, optimize operations, manage risks and maximise insights. Persuade your audience using this Six Step Data Analytic Strategy For Business Transformation Download PDF. This PPT design covers six stages, thus making it a great tool to use. It also caters to a variety of topics including Transform Financial Process, Acquire Customers, Create Business Models. Download this PPT design now to present a convincing pitch that not only emphasizes the topic but also showcases your presentation skills.
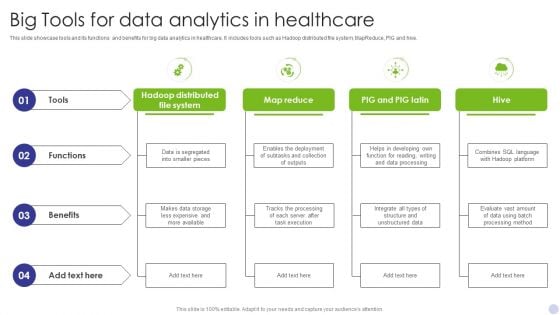
Big Tools For Data Analytics In Healthcare Background PDF
This slide showcase tools and its functions and benefits for big data analytics in healthcare. It includes tools such as Hadoop distributed file system, MapReduce, PIG and hive. Persuade your audience using this Big Tools For Data Analytics In Healthcare Background PDF. This PPT design covers Four stages, thus making it a great tool to use. It also caters to a variety of topics including Hadoop Distributed, File System, Map Reduce. Download this PPT design now to present a convincing pitch that not only emphasizes the topic but also showcases your presentation skills.
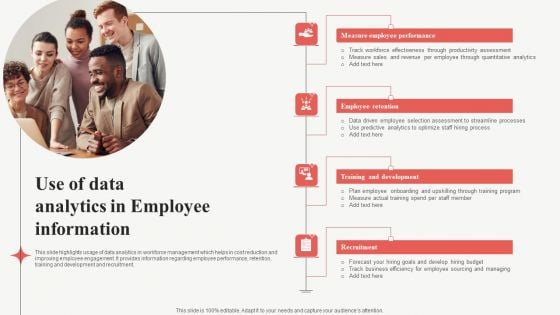
Use Of Data Analytics In Employee Information Graphics PDF
This slide highlights usage of data analytics in workforce management which helps in cost reduction and improving employee engagement. It provides information regarding employee performance, retention, training and development and recruitment. Persuade your audience using this Use Of Data Analytics In Employee Information Graphics PDF. This PPT design covers four stages, thus making it a great tool to use. It also caters to a variety of topics including Training And Development, Employee Retention, Measure Employee Performance. Download this PPT design now to present a convincing pitch that not only emphasizes the topic but also showcases your presentation skills.
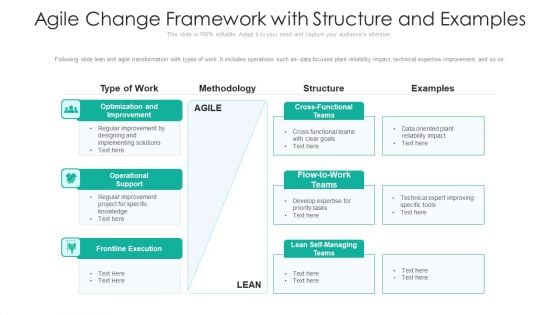
Agile Change Framework With Structure And Examples Graphics PDF
Following slide lean and agile transformation with types of work. It includes operations such as- data focused plant reliability impact, technical expertise improvement and so on. Showcasing this set of slides titled agile change framework with structure and examples graphics pdf. The topics addressed in these templates are optimization and improvement, operational support, frontline execution. All the content presented in this PPT design is completely editable. Download it and make adjustments in color, background, font etc. as per your unique business setting.
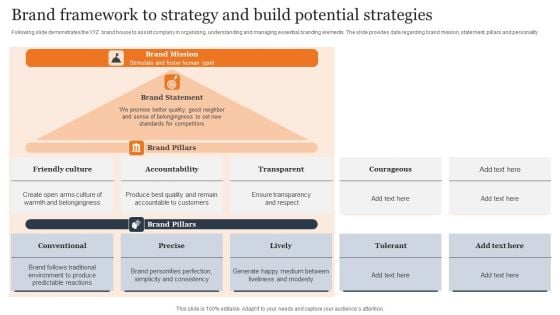
Brand Framework To Strategy And Build Potential Strategies Guidelines PDF
Following slide demonstrates the XYZ brand house to assist company in organizing, understanding and managing essential branding elements. The slide provides data regarding brand mission, statement, pillars and personality. Showcasing this set of slides titled Brand Framework To Strategy And Build Potential Strategies Guidelines PDF. The topics addressed in these templates are Transparent, Accountability, Conventional. All the content presented in this PPT design is completely editable. Download it and make adjustments in color, background, font etc. as per your unique business setting.
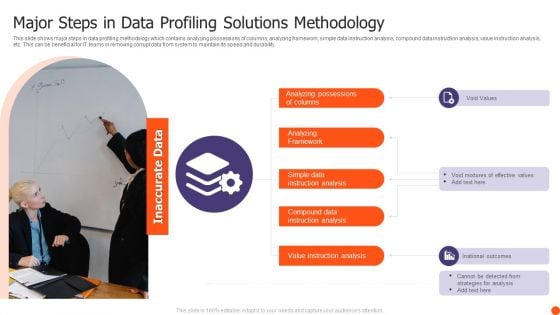
Major Steps In Data Profiling Solutions Methodology Ppt Ideas Information PDF
This slide shows major steps in data profiling methodology which contains analyzing possessions of columns, analyzing framework, simple data instruction analysis, compound data instruction analysis, value instruction analysis, etc. This can be beneficial for IT teams in removing corrupt data from system to maintain its speed and durability. Persuade your audience using this Major Steps In Data Profiling Solutions Methodology Ppt Ideas Information PDF. This PPT design covers two stages, thus making it a great tool to use. It also caters to a variety of topics including Inaccurate Data, Analyzing Framework, Value Instruction Analysis. Download this PPT design now to present a convincing pitch that not only emphasizes the topic but also showcases your presentation skills.
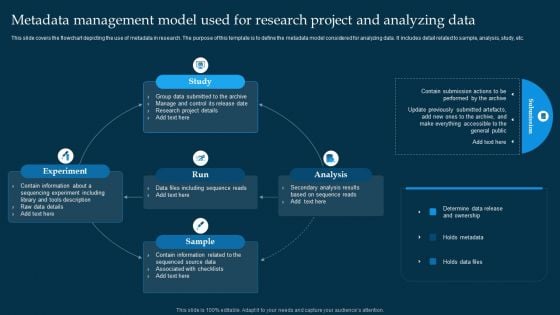
Metadata Management Model Used For Research Project And Analyzing Data Designs PDF
This slide covers the flowchart depicting the use of metadata in research. The purpose of this template is to define the metadata model considered for analyzing data. It includes detail related to sample, analysis, study, etc. Presenting Metadata Management Model Used For Research Project And Analyzing Data Designs PDF to dispense important information. This template comprises five stages. It also presents valuable insights into the topics including Study, Analysis, Sample, Run, Experiment. This is a completely customizable PowerPoint theme that can be put to use immediately. So, download it and address the topic impactfully.
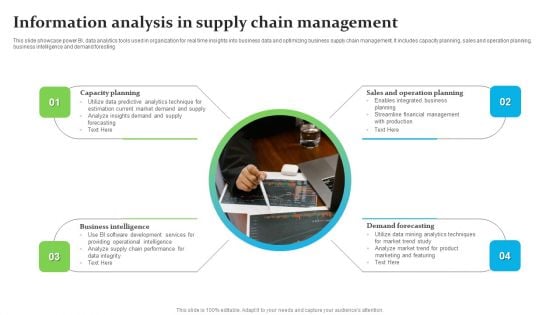
Information Analysis In Supply Chain Management Ppt Professional Clipart Images PDF
This slide showcase power BI, data analytics tools used in organization for real time insights into business data and optimizing business supply chain management. It includes capacity planning, sales and operation planning, business intelligence and demand foresting. Persuade your audience using this Information Analysis In Supply Chain Management Ppt Professional Clipart Images PDF. This PPT design covers four stages, thus making it a great tool to use. It also caters to a variety of topics including Capacity Planning, Demand Forecasting, Business Intelligence. Download this PPT design now to present a convincing pitch that not only emphasizes the topic but also showcases your presentation skills.
Revenue Management Model With Kpis Icons PDF
This Slide exhibits five levers of revenue management for optimizing financial results. It starts with brand portfolio pricing and ends at trade terms management. Pitch your topic with ease and precision using this revenue management model with kpis icons pdf. This layout presents information on promotion management, brand portfolio pricing, trade terms management. It is also available for immediate download and adjustment. So, changes can be made in the color, design, graphics or any other component to create a unique layout.
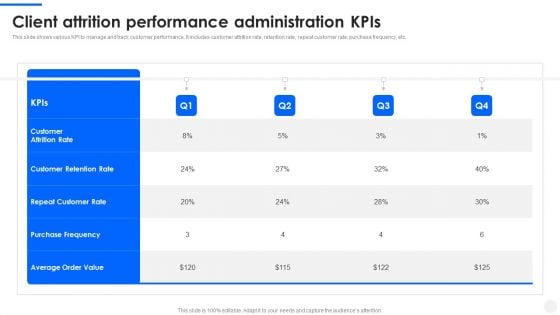
Client Attrition Performance Administration Kpis Topics PDF
This slide shows various KPI to manage and track customer performance. It includes customer attrition rate, retention rate, repeat customer rate, purchase frequency, etc. Pitch your topic with ease and precision using this Client Attrition Performance Administration Kpis Topics PDF. This layout presents information on Customer Retention Rate, Repeat Customer Rate, Purchase Frequency. It is also available for immediate download and adjustment. So, changes can be made in the color, design, graphics or any other component to create a unique layout.

Customizing The Salon Experience Financial Highlights And Marketing Mix Of Salon Business Strategy SS V
This slide presents key monetary results of the organization with a detailed description of services provided by the organization. It includes information about company revenue, net income, per session cost, gross profit margin, resource allocation, cost of services, cost of goods sold. The Customizing The Salon Experience Financial Highlights And Marketing Mix Of Salon Business Strategy SS V is a compilation of the most recent design trends as a series of slides. It is suitable for any subject or industry presentation, containing attractive visuals and photo spots for businesses to clearly express their messages. This template contains a variety of slides for the user to input data, such as structures to contrast two elements, bullet points, and slides for written information. Slidegeeks is prepared to create an impression. This slide presents key monetary results of the organization with a detailed description of services provided by the organization. It includes information about company revenue, net income, per session cost, gross profit margin, resource allocation, cost of services, cost of goods sold.

Predictive Analytics In The Age Of Big Data Roadmap For Predictive Analytics Model Development Ideas PDF
This slide represents the roadmap for predictive analytics model development, including the steps to be performed in the process, such as highlighting and formulating a problem, data preparation, information exploration, transforming and choosing, making, validating, and so on. Find a pre designed and impeccable Predictive Analytics In The Age Of Big Data Roadmap For Predictive Analytics Model Development Ideas PDF. The templates can ace your presentation without additional effort. You can download these easy to edit presentation templates to make your presentation stand out from others. So, what are you waiting for Download the template from Slidegeeks today and give a unique touch to your presentation.
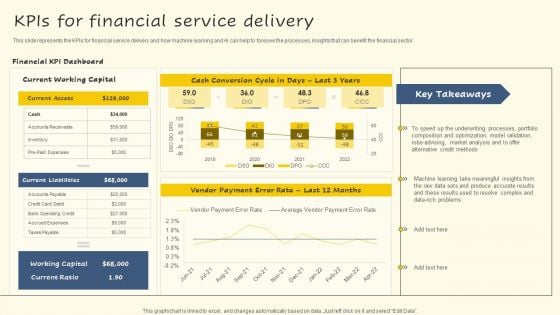
Kpis For Financial Service Delivery Background PDF
This slide represents the KPIs for financial service delivery and how machine learning and AI can help to foresee the processes, insights that can benefit the financial sector. If you are looking for a format to display your unique thoughts, then the professionally designed Kpis For Financial Service Delivery Background PDF is the one for you. You can use it as a Google Slides template or a PowerPoint template. Incorporate impressive visuals, symbols, images, and other charts. Modify or reorganize the text boxes as you desire. Experiment with shade schemes and font pairings. Alter, share or cooperate with other people on your work. Download Kpis For Financial Service Delivery Background PDF and find out how to give a successful presentation. Present a perfect display to your team and make your presentation unforgettable.

3 Months Roadmap For SAP Analytics Online Data Storage Guidelines
Presenting our jaw-dropping 3 months roadmap for sap analytics online data storage guidelines. You can alternate the color, font size, font type, and shapes of this PPT layout according to your strategic process. This PPT presentation is compatible with Google Slides and is available in both standard screen and widescreen aspect ratios. You can also download this well-researched PowerPoint template design in different formats like PDF, JPG, and PNG. So utilize this visually-appealing design by clicking the download button given below.
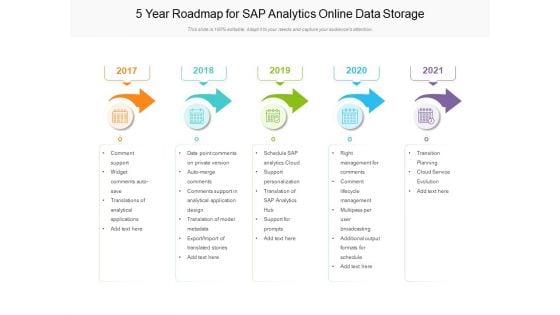
5 Year Roadmap For SAP Analytics Online Data Storage Professional
Presenting our jaw-dropping 5 year roadmap for sap analytics online data storage professional. You can alternate the color, font size, font type, and shapes of this PPT layout according to your strategic process. This PPT presentation is compatible with Google Slides and is available in both standard screen and widescreen aspect ratios. You can also download this well-researched PowerPoint template design in different formats like PDF, JPG, and PNG. So utilize this visually-appealing design by clicking the download button given below.
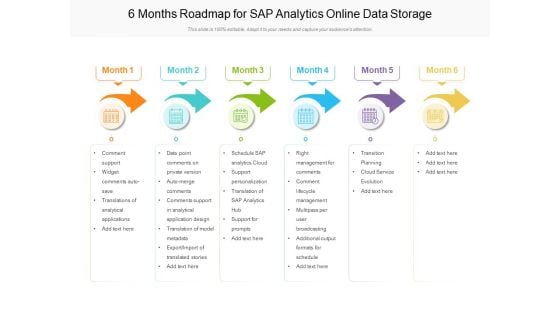
6 Months Roadmap For SAP Analytics Online Data Storage Information
Presenting our jaw-dropping 6 months roadmap for sap analytics online data storage information. You can alternate the color, font size, font type, and shapes of this PPT layout according to your strategic process. This PPT presentation is compatible with Google Slides and is available in both standard screen and widescreen aspect ratios. You can also download this well-researched PowerPoint template design in different formats like PDF, JPG, and PNG. So utilize this visually-appealing design by clicking the download button given below.
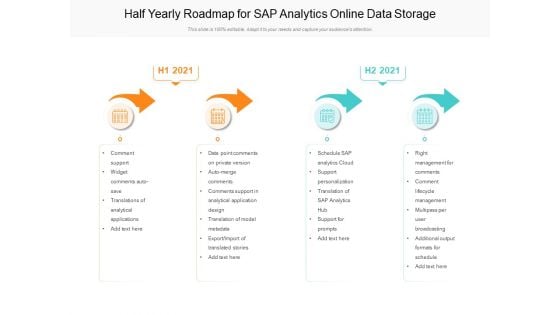
Half Yearly Roadmap For SAP Analytics Online Data Storage Pictures
Presenting our jaw-dropping half yearly roadmap for sap analytics online data storage pictures. You can alternate the color, font size, font type, and shapes of this PPT layout according to your strategic process. This PPT presentation is compatible with Google Slides and is available in both standard screen and widescreen aspect ratios. You can also download this well-researched PowerPoint template design in different formats like PDF, JPG, and PNG. So utilize this visually-appealing design by clicking the download button given below.
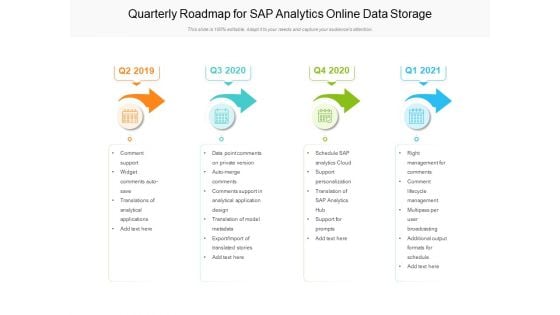
Quarterly Roadmap For SAP Analytics Online Data Storage Guidelines
Presenting our jaw-dropping quarterly roadmap for sap analytics online data storage guidelines. You can alternate the color, font size, font type, and shapes of this PPT layout according to your strategic process. This PPT presentation is compatible with Google Slides and is available in both standard screen and widescreen aspect ratios. You can also download this well-researched PowerPoint template design in different formats like PDF, JPG, and PNG. So utilize this visually-appealing design by clicking the download button given below.
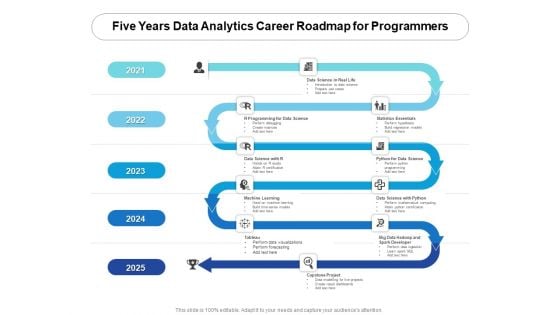
Five Years Data Analytics Career Roadmap For Programmers Pictures
Introducing our five years data analytics career roadmap for programmers pictures. This PPT presentation is Google Slides compatible, therefore, you can share it easily with the collaborators for measuring the progress. Also, the presentation is available in both standard screen and widescreen aspect ratios. So edit the template design by modifying the font size, font type, color, and shapes as per your requirements. As this PPT design is fully editable it can be presented in PDF, JPG and PNG formats.
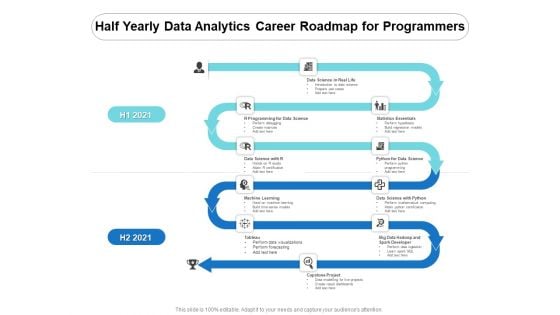
Half Yearly Data Analytics Career Roadmap For Programmers Demonstration
Introducing our half yearly data analytics career roadmap for programmers demonstration. This PPT presentation is Google Slides compatible, therefore, you can share it easily with the collaborators for measuring the progress. Also, the presentation is available in both standard screen and widescreen aspect ratios. So edit the template design by modifying the font size, font type, color, and shapes as per your requirements. As this PPT design is fully editable it can be presented in PDF, JPG and PNG formats.
Quarterly Data Analytics Career Roadmap For Programmers Icons
Introducing our quarterly data analytics career roadmap for programmers icons. This PPT presentation is Google Slides compatible, therefore, you can share it easily with the collaborators for measuring the progress. Also, the presentation is available in both standard screen and widescreen aspect ratios. So edit the template design by modifying the font size, font type, color, and shapes as per your requirements. As this PPT design is fully editable it can be presented in PDF, JPG and PNG formats.

Quarterly Data Analytics Career Roadmap With Live Industry Projects Template
Presenting our jaw-dropping quarterly data analytics career roadmap with live industry projects template. You can alternate the color, font size, font type, and shapes of this PPT layout according to your strategic process. This PPT presentation is compatible with Google Slides and is available in both standard screen and widescreen aspect ratios. You can also download this well-researched PowerPoint template design in different formats like PDF, JPG, and PNG. So utilize this visually-appealing design by clicking the download button given below.

Six Months Data Analytics Career Roadmap For Programmers Demonstration
Introducing our six months data analytics career roadmap for programmers demonstration. This PPT presentation is Google Slides compatible, therefore, you can share it easily with the collaborators for measuring the progress. Also, the presentation is available in both standard screen and widescreen aspect ratios. So edit the template design by modifying the font size, font type, color, and shapes as per your requirements. As this PPT design is fully editable it can be presented in PDF, JPG and PNG formats.
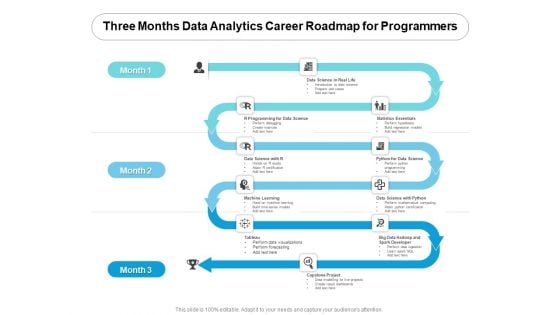
Three Months Data Analytics Career Roadmap For Programmers Rules
Introducing our three months data analytics career roadmap for programmers rules. This PPT presentation is Google Slides compatible, therefore, you can share it easily with the collaborators for measuring the progress. Also, the presentation is available in both standard screen and widescreen aspect ratios. So edit the template design by modifying the font size, font type, color, and shapes as per your requirements. As this PPT design is fully editable it can be presented in PDF, JPG and PNG formats.
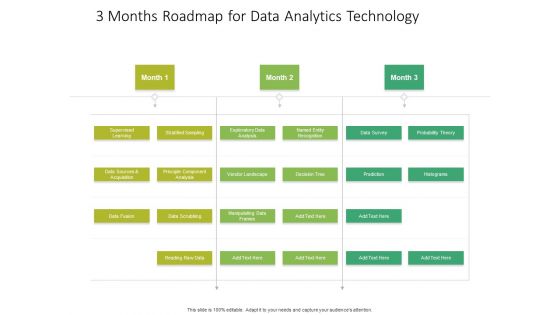
3 Months Roadmap For Data Analytics Technology Infographics
Presenting our jaw-dropping 3 months roadmap for data analytics technology infographics. You can alternate the color, font size, font type, and shapes of this PPT layout according to your strategic process. This PPT presentation is compatible with Google Slides and is available in both standard screen and widescreen aspect ratios. You can also download this well-researched PowerPoint template design in different formats like PDF, JPG, and PNG. So utilize this visually-appealing design by clicking the download button given below.
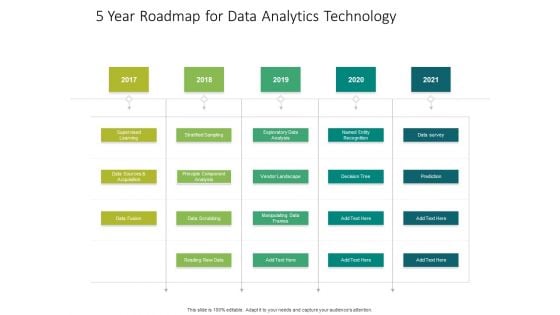
5 Year Roadmap For Data Analytics Technology Microsoft
Presenting our jaw-dropping 5 year roadmap for data analytics technology microsoft. You can alternate the color, font size, font type, and shapes of this PPT layout according to your strategic process. This PPT presentation is compatible with Google Slides and is available in both standard screen and widescreen aspect ratios. You can also download this well-researched PowerPoint template design in different formats like PDF, JPG, and PNG. So utilize this visually-appealing design by clicking the download button given below.
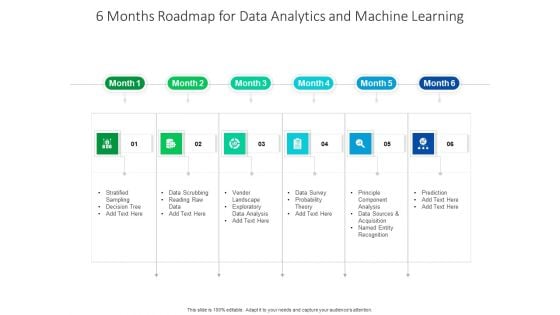
6 Months Roadmap For Data Analytics And Machine Learning Rules
Introducing our 6 months roadmap for data analytics and machine learning rules. This PPT presentation is Google Slides compatible, therefore, you can share it easily with the collaborators for measuring the progress. Also, the presentation is available in both standard screen and widescreen aspect ratios. So edit the template design by modifying the font size, font type, color, and shapes as per your requirements. As this PPT design is fully editable it can be presented in PDF, JPG and PNG formats.
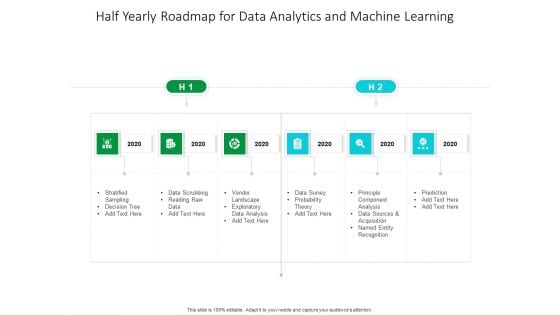
Half Yearly Roadmap For Data Analytics And Machine Learning Diagrams
Introducing our half yearly roadmap for data analytics and machine learning diagrams. This PPT presentation is Google Slides compatible, therefore, you can share it easily with the collaborators for measuring the progress. Also, the presentation is available in both standard screen and widescreen aspect ratios. So edit the template design by modifying the font size, font type, color, and shapes as per your requirements. As this PPT design is fully editable it can be presented in PDF, JPG and PNG formats.
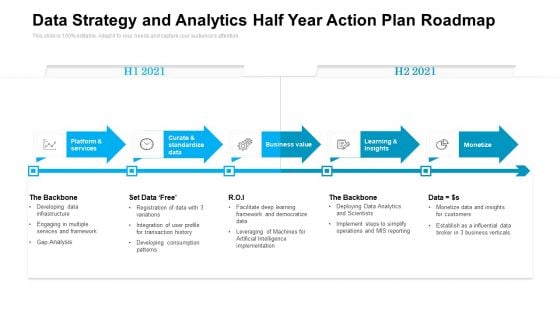
Data Strategy And Analytics Half Year Action Plan Roadmap Clipart
Introducing our data strategy and analytics half year action plan roadmap clipart. This PPT presentation is Google Slides compatible, therefore, you can share it easily with the collaborators for measuring the progress. Also, the presentation is available in both standard screen and widescreen aspect ratios. So edit the template design by modifying the font size, font type, color, and shapes as per your requirements. As this PPT design is fully editable it can be presented in PDF, JPG and PNG formats.
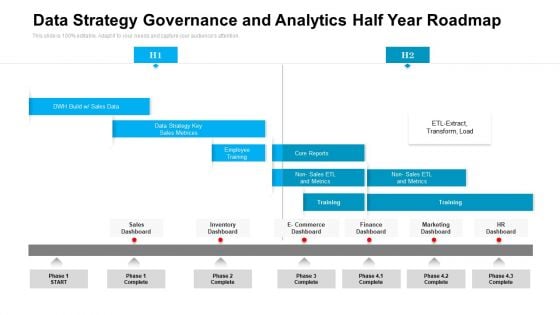
Data Strategy Governance And Analytics Half Year Roadmap Portrait
Introducing our data strategy governance and analytics half year roadmap portrait. This PPT presentation is Google Slides compatible, therefore, you can share it easily with the collaborators for measuring the progress. Also, the presentation is available in both standard screen and widescreen aspect ratios. So edit the template design by modifying the font size, font type, color, and shapes as per your requirements. As this PPT design is fully editable it can be presented in PDF, JPG and PNG formats.
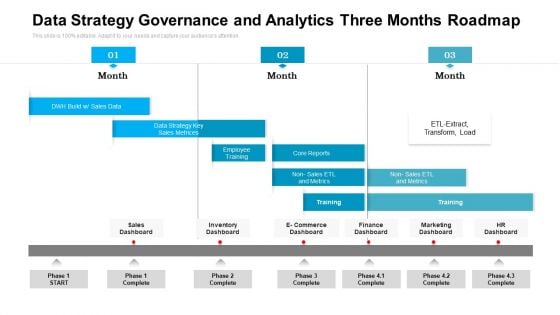
Data Strategy Governance And Analytics Three Months Roadmap Microsoft
Presenting our jaw dropping data strategy governance and analytics three months roadmap microsoft. You can alternate the color, font size, font type, and shapes of this PPT layout according to your strategic process. This PPT presentation is compatible with Google Slides and is available in both standard screen and widescreen aspect ratios. You can also download this well researched PowerPoint template design in different formats like PDF, JPG, and PNG. So utilize this visually appealing design by clicking the download button given below.
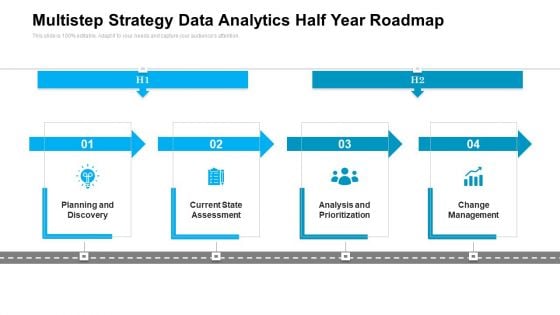
Multistep Strategy Data Analytics Half Year Roadmap Summary
Introducing our multistep strategy data analytics half year roadmap summary. This PPT presentation is Google Slides compatible, therefore, you can share it easily with the collaborators for measuring the progress. Also, the presentation is available in both standard screen and widescreen aspect ratios. So edit the template design by modifying the font size, font type, color, and shapes as per your requirements. As this PPT design is fully editable it can be presented in PDF, JPG and PNG formats.
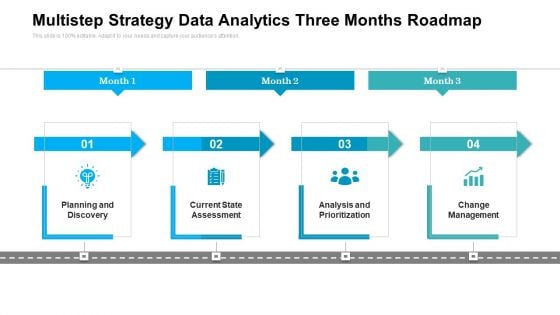
Multistep Strategy Data Analytics Three Months Roadmap Mockup
Presenting our jaw dropping multistep strategy data analytics three months roadmap mockup. You can alternate the color, font size, font type, and shapes of this PPT layout according to your strategic process. This PPT presentation is compatible with Google Slides and is available in both standard screen and widescreen aspect ratios. You can also download this well researched PowerPoint template design in different formats like PDF, JPG, and PNG. So utilize this visually appealing design by clicking the download button given below.
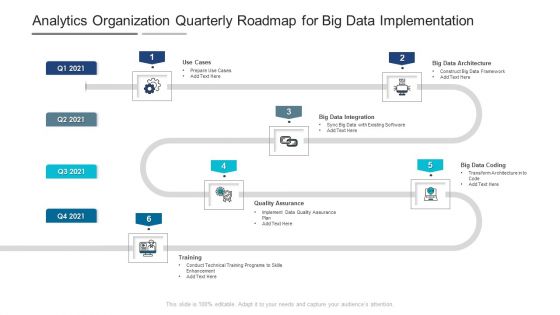
Analytics Organization Quarterly Roadmap For Big Data Implementation Portrait
Introducing our analytics organization quarterly roadmap for big data implementation portrait. This PPT presentation is Google Slides compatible, therefore, you can share it easily with the collaborators for measuring the progress. Also, the presentation is available in both standard screen and widescreen aspect ratios. So edit the template design by modifying the font size, font type, color, and shapes as per your requirements. As this PPT design is fully editable it can be presented in PDF, JPG and PNG formats.


 Continue with Email

 Home
Home


