Dashboards Construction
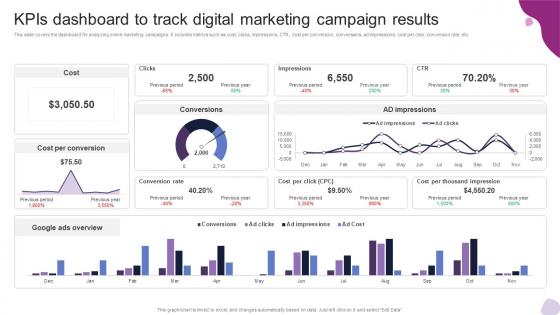
Kpis Dashboard To Track Digital Marketing Campaign Powerful Marketing Techniques Strategy SS V
This slide covers the dashboard for analyzing online marketing campaigns. It includes metrics such as cost, clicks, impressions, CTR, cost per conversion, conversions, ad impressions, cost per click, conversion rate, etc. Take your projects to the next level with our ultimate collection of Kpis Dashboard To Track Digital Marketing Campaign Powerful Marketing Techniques Strategy SS V. Slidegeeks has designed a range of layouts that are perfect for representing task or activity duration, keeping track of all your deadlines at a glance. Tailor these designs to your exact needs and give them a truly corporate look with your own brand colors they will make your projects stand out from the rest This slide covers the dashboard for analyzing online marketing campaigns. It includes metrics such as cost, clicks, impressions, CTR, cost per conversion, conversions, ad impressions, cost per click, conversion rate, etc.
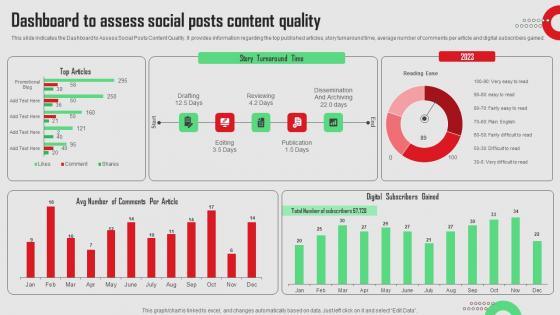
Dashboard To Assess Social Posts Content Quality Social Media Platforms Performance Designs Pdf
This slide indicates the Dashboard to Assess Social Posts Content Quality. It provides information regarding the top published articles, story turnaround time, average number of comments per article and digital subscribers gained.Want to ace your presentation in front of a live audience Our Dashboard To Assess Social Posts Content Quality Social Media Platforms Performance Designs Pdf can help you do that by engaging all the users towards you.. Slidegeeks experts have put their efforts and expertise into creating these impeccable powerpoint presentations so that you can communicate your ideas clearly. Moreover, all the templates are customizable, and easy-to-edit and downloadable. Use these for both personal and commercial use. This slide indicates the Dashboard to Assess Social Posts Content Quality. It provides information regarding the top published articles, story turnaround time, average number of comments per article and digital subscribers gained.
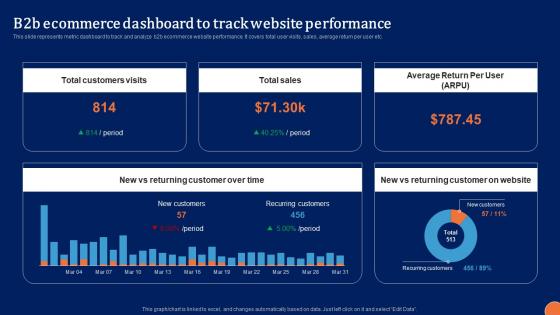
B2B Ecommerce Dashboard Digital Platform Administration For B2B Ecommerce Designs Pdf
This slide represents metric dashboard to track and analyze b2b ecommerce website performance. It covers total user visits, sales, average return per user etc. Want to ace your presentation in front of a live audience Our B2B Ecommerce Dashboard Digital Platform Administration For B2B Ecommerce Designs Pdf can help you do that by engaging all the users towards you. Slidegeeks experts have put their efforts and expertise into creating these impeccable powerpoint presentations so that you can communicate your ideas clearly. Moreover, all the templates are customizable, and easy to edit and downloadable. Use these for both personal and commercial use. This slide represents metric dashboard to track and analyze b2b ecommerce website performance. It covers total user visits, sales, average return per user etc.
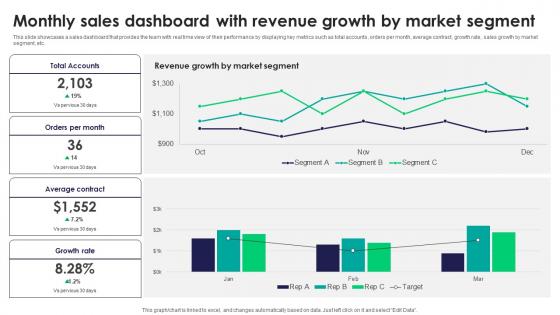
Monthly Sales Dashboard With Revenue Growth By Tactics For Improving Field Sales Team SA SS V
This slide showcases a sales dashboard that provides the team with real time view of their performance by displaying key metrics such as total accounts, orders per month, average contract, growth rate, sales growth by market segment, etc. The Monthly Sales Dashboard With Revenue Growth By Tactics For Improving Field Sales Team SA SS V is a compilation of the most recent design trends as a series of slides. It is suitable for any subject or industry presentation, containing attractive visuals and photo spots for businesses to clearly express their messages. This template contains a variety of slides for the user to input data, such as structures to contrast two elements, bullet points, and slides for written information. Slidegeeks is prepared to create an impression. This slide showcases a sales dashboard that provides the team with real time view of their performance by displaying key metrics such as total accounts, orders per month, average contract, growth rate, sales growth by market segment, etc.
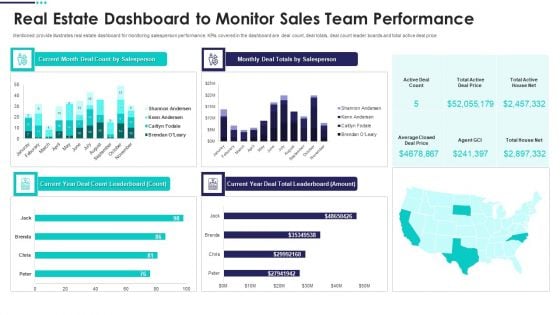
Real Estate Marketing Plan To Sell Real Estate Dashboard To Monitor Sales Team Demonstration PDF
Mentioned provide illustrates real estate dashboard for monitoring salesperson performance. KPIs covered in the dashboard are deal count, deal totals, deal count leader boards and total active deal price Deliver an awe inspiring pitch with this creative Real Estate Marketing Plan To Sell Real Estate Dashboard To Monitor Sales Team Demonstration PDF bundle. Topics like Real Estate Dashboard To Monitor Sales Team Performance can be discussed with this completely editable template. It is available for immediate download depending on the needs and requirements of the user.

Marketing Growth Strategy Performance Dashboard To Measure Marketing Strategy SS V
The following slide outlines key performance indicator KPI dashboard that can assist digital marketers to evaluate marketing campaign performance. The success metrics outlined in slide are total spend on advertisement, cost per thousand CPM, cost per click CPC, click-through rate CTR, etc. Take your projects to the next level with our ultimate collection of Marketing Growth Strategy Performance Dashboard To Measure Marketing Strategy SS V. Slidegeeks has designed a range of layouts that are perfect for representing task or activity duration, keeping track of all your deadlines at a glance. Tailor these designs to your exact needs and give them a truly corporate look with your own brand colors they will make your projects stand out from the rest The following slide outlines key performance indicator KPI dashboard that can assist digital marketers to evaluate marketing campaign performance. The success metrics outlined in slide are total spend on advertisement, cost per thousand CPM, cost per click CPC, click-through rate CTR, etc.
Activity Tracking Dashboard For Umbrella Brand Strategies For Achieving Summary Pdf
This slide provides information regarding activities tracking dashboard for umbrella brand in terms of customer retention, market share, etc. The Activity Tracking Dashboard For Umbrella Brand Strategies For Achieving Summary Pdf is a compilation of the most recent design trends as a series of slides. It is suitable for any subject or industry presentation, containing attractive visuals and photo spots for businesses to clearly express their messages. This template contains a variety of slides for the user to input data, such as structures to contrast two elements, bullet points, and slides for written information. Slidegeeks is prepared to create an impression. This slide provides information regarding activities tracking dashboard for umbrella brand in terms of customer retention, market share, etc.
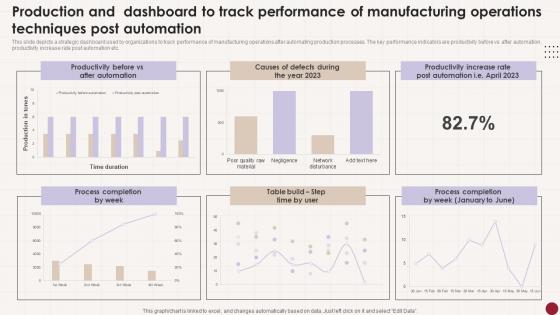
Production And Dashboard To Track Performance Of Manufacturing Operations Techniques Post Automation Tips Pdf
This slide depicts a strategic dashboard used by organizations to track performance of manufacturing operations after automating production processes. The key performance indicators are productivity before vs after automation, productivity increase rate post automation etc. Pitch your topic with ease and precision using this Production And Dashboard To Track Performance Of Manufacturing Operations Techniques Post Automation Tips Pdf This layout presents information on Productivity Before, After Automation, Process Completion It is also available for immediate download and adjustment. So, changes can be made in the color, design, graphics or any other component to create a unique layout. This slide depicts a strategic dashboard used by organizations to track performance of manufacturing operations after automating production processes. The key performance indicators are productivity before vs after automation, productivity increase rate post automation etc.
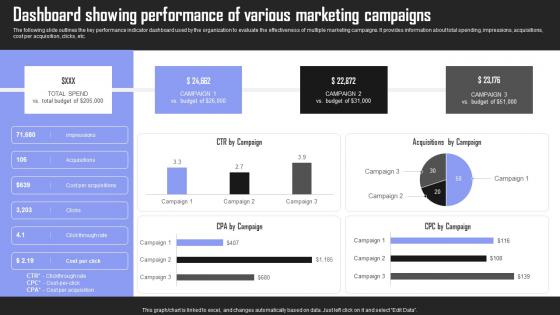
Dashboard Showing Performance Brand Building Techniques To Gain Competitive Edge Topics Pdf
The following slide outlines the key performance indicator dashboard used by the organization to evaluate the effectiveness of multiple marketing campaigns. It provides information about total spending, impressions, acquisitions, cost per acquisition, clicks, etc. If your project calls for a presentation, then Slidegeeks is your go to partner because we have professionally designed, easy to edit templates that are perfect for any presentation. After downloading, you can easily edit Dashboard Showing Performance Brand Building Techniques To Gain Competitive Edge Topics Pdf and make the changes accordingly. You can rearrange slides or fill them with different images. Check out all the handy templates The following slide outlines the key performance indicator dashboard used by the organization to evaluate the effectiveness of multiple marketing campaigns. It provides information about total spending, impressions, acquisitions, cost per acquisition, clicks, etc.

Hr Recruitment Dashboard Showcasing Open Positions By Analysing Hr Data For Effective Decision Making
This slide showcases a dashboard that helps organizations track and monitor the hiring process. It includes total applicants, shortlisted candidates, hired candidates, rejected candidates, time to hire, cost to hire, etc. The Hr Recruitment Dashboard Showcasing Open Positions By Analysing Hr Data For Effective Decision Making is a compilation of the most recent design trends as a series of slides. It is suitable for any subject or industry presentation, containing attractive visuals and photo spots for businesses to clearly express their messages. This template contains a variety of slides for the user to input data, such as structures to contrast two elements, bullet points, and slides for written information. Slidegeeks is prepared to create an impression. This slide showcases a dashboard that helps organizations track and monitor the hiring process. It includes total applicants, shortlisted candidates, hired candidates, rejected candidates, time to hire, cost to hire, etc.
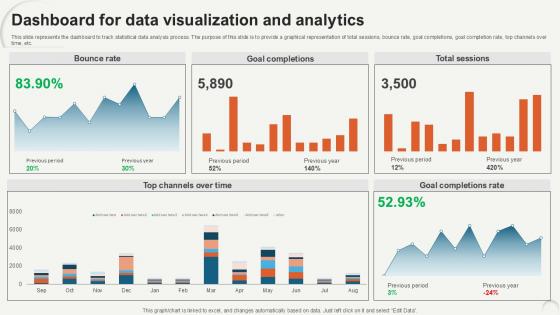
Dashboard For Data Visualization Data Analytics For Informed Decision Ppt Sample
This slide represents the dashboard to track statistical data analysis process. The purpose of this slide is to provide a graphical representation of total sessions, bounce rate, goal completions, goal completion rate, top channels over time, etc. Do you have an important presentation coming up Are you looking for something that will make your presentation stand out from the rest Look no further than Dashboard For Data Visualization Data Analytics For Informed Decision Ppt Sample. With our professional designs, you can trust that your presentation will pop and make delivering it a smooth process. And with Slidegeeks, you can trust that your presentation will be unique and memorable. So why wait Grab Dashboard For Data Visualization Data Analytics For Informed Decision Ppt Sample today and make your presentation stand out from the rest This slide represents the dashboard to track statistical data analysis process. The purpose of this slide is to provide a graphical representation of total sessions, bounce rate, goal completions, goal completion rate, top channels over time, etc.
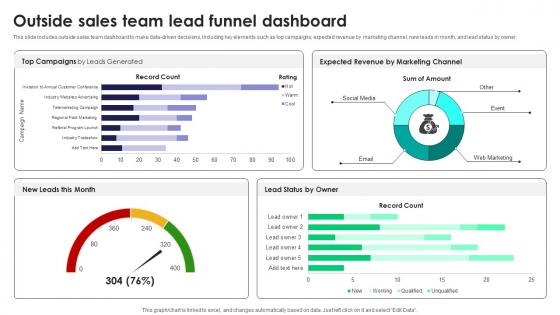
Outside Sales Team Lead Funnel Dashboard Tactics For Improving Field Sales Team SA SS V
This slide includes outside sales team dashboard to make data-driven decisions, including key elements such as top campaigns, expected revenue by marketing channel, new leads in month, and lead status by owner.Retrieve professionally designed Outside Sales Team Lead Funnel Dashboard Tactics For Improving Field Sales Team SA SS V to effectively convey your message and captivate your listeners. Save time by selecting pre-made slideshows that are appropriate for various topics, from business to educational purposes. These themes come in many different styles, from creative to corporate, and all of them are easily adjustable and can be edited quickly. Access them as PowerPoint templates or as Google Slides themes. You do not have to go on a hunt for the perfect presentation because Slidegeeks got you covered from everywhere. This slide includes outside sales team dashboard to make data-driven decisions, including key elements such as top campaigns, expected revenue by marketing channel, new leads in month, and lead status by owner.
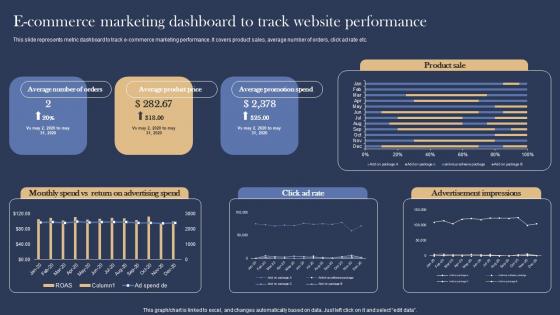
E Commerce Marketing Dashboard Management Marketing Strategies For E Commerce Information Pdf
This slide represents metric dashboard to track e commerce marketing performance. It covers product sales, average number of orders, click ad rate etc. This modern and well arranged E Commerce Marketing Dashboard Management Marketing Strategies For E Commerce Information Pdf provides lots of creative possibilities. It is very simple to customize and edit with the Powerpoint Software. Just drag and drop your pictures into the shapes. All facets of this template can be edited with Powerpoint, no extra software is necessary. Add your own material, put your images in the places assigned for them, adjust the colors, and then you can show your slides to the world, with an animated slide included. This slide represents metric dashboard to track e commerce marketing performance. It covers product sales, average number of orders, click ad rate etc.
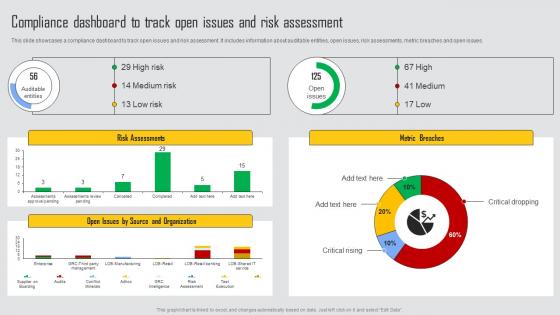
Compliance Dashboard To Track Managing Risks And Establishing Trust Through Efficient Rules Pdf
This slide showcases a compliance dashboard to track open issues and risk assessment. It includes information about auditable entities, open issues, risk assessments, metric breaches and open issues. This modern and well arranged Compliance Dashboard To Track Managing Risks And Establishing Trust Through Efficient Rules Pdf provides lots of creative possibilities. It is very simple to customize and edit with the Powerpoint Software. Just drag and drop your pictures into the shapes. All facets of this template can be edited with Powerpoint, no extra software is necessary. Add your own material, put your images in the places assigned for them, adjust the colors, and then you can show your slides to the world, with an animated slide included. This slide showcases a compliance dashboard to track open issues and risk assessment. It includes information about auditable entities, open issues, risk assessments, metric breaches and open issues.
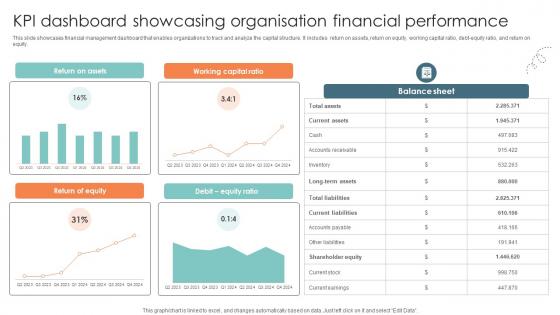
Kpi Dashboard Showcasing Organisation Financial Performance Strategic Approaches To Corporate Financial
This slide showcases financial management dashboard that enables organizations to track and analyze the capital structure. It includes return on assets, return on equity, working capital ratio, debt-equity ratio, and return on equity. This modern and well-arranged Kpi Dashboard Showcasing Organisation Financial Performance Strategic Approaches To Corporate Financial provides lots of creative possibilities. It is very simple to customize and edit with the Powerpoint Software. Just drag and drop your pictures into the shapes. All facets of this template can be edited with Powerpoint, no extra software is necessary. Add your own material, put your images in the places assigned for them, adjust the colors, and then you can show your slides to the world, with an animated slide included. This slide showcases financial management dashboard that enables organizations to track and analyze the capital structure. It includes return on assets, return on equity, working capital ratio, debt-equity ratio, and return on equity.
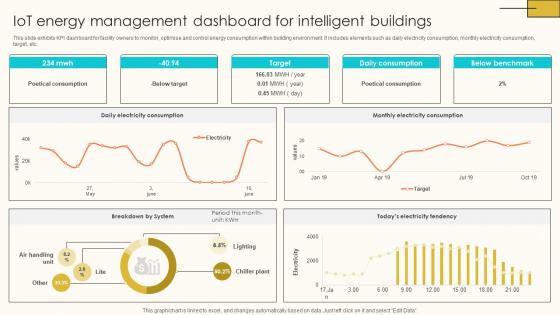
IoT Energy Management Dashboard For Internet Of Things Solutions To Enhance Energy IoT SS V
This slide exhibits KPI dashboard for facility owners to monitor, optimise and control energy consumption within building environment. It includes elements such as daily electricity consumption, monthly electricity consumption, target, etc. This modern and well-arranged IoT Energy Management Dashboard For Internet Of Things Solutions To Enhance Energy IoT SS V provides lots of creative possibilities. It is very simple to customize and edit with the Powerpoint Software. Just drag and drop your pictures into the shapes. All facets of this template can be edited with Powerpoint, no extra software is necessary. Add your own material, put your images in the places assigned for them, adjust the colors, and then you can show your slides to the world, with an animated slide included. This slide exhibits KPI dashboard for facility owners to monitor, optimise and control energy consumption within building environment. It includes elements such as daily electricity consumption, monthly electricity consumption, target, etc.
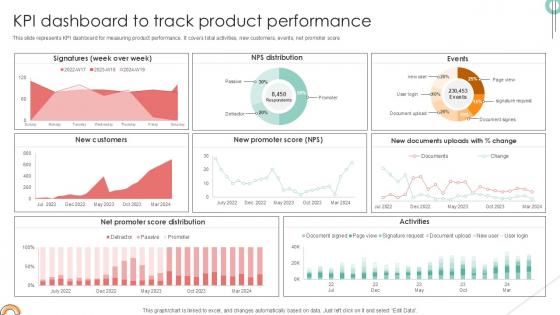
KPI Dashboard To Track Implementing Product Diversification PPT Presentation Strategy SS V
This slide represents KPI dashboard for measuring product performance. It covers total activities, new customers, events, net promoter score. This modern and well-arranged KPI Dashboard To Track Implementing Product Diversification PPT Presentation Strategy SS V provides lots of creative possibilities. It is very simple to customize and edit with the Powerpoint Software. Just drag and drop your pictures into the shapes. All facets of this template can be edited with Powerpoint, no extra software is necessary. Add your own material, put your images in the places assigned for them, adjust the colors, and then you can show your slides to the world, with an animated slide included. This slide represents KPI dashboard for measuring product performance. It covers total activities, new customers, events, net promoter score
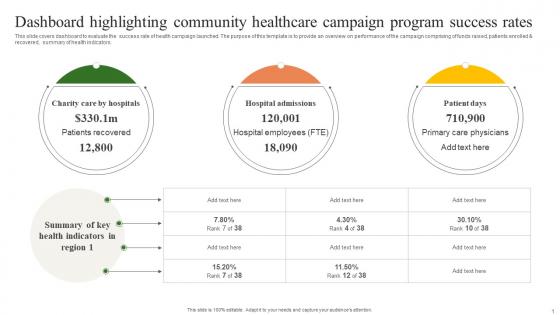
Dashboard Highlighting Community Building A Winning Community Outreach Strategy SS V
This slide covers dashboard to evaluate the success rate of health campaign launched. The purpose of this template is to provide an overview on performance of the campaign comprising of funds raised, patients enrolled and recovered, summary of health indicators. Whether you have daily or monthly meetings, a brilliant presentation is necessary. Dashboard Highlighting Community Building A Winning Community Outreach Strategy SS V can be your best option for delivering a presentation. Represent everything in detail using Dashboard Highlighting Community Building A Winning Community Outreach Strategy SS V and make yourself stand out in meetings. The template is versatile and follows a structure that will cater to your requirements. All the templates prepared by Slidegeeks are easy to download and edit. Our research experts have taken care of the corporate themes as well. So, give it a try and see the results. This slide covers dashboard to evaluate the success rate of health campaign launched. The purpose of this template is to provide an overview on performance of the campaign comprising of funds raised, patients enrolled and recovered, summary of health indicators.
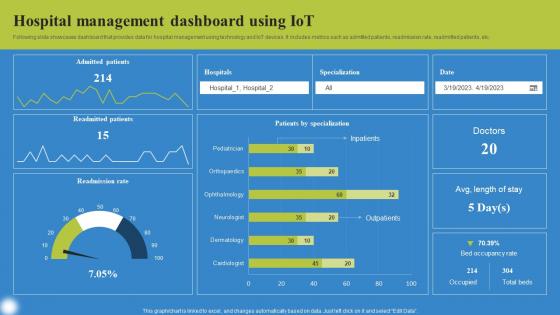
Hospital Management Dashboard Deploying IoT Solutions For Enhanced Healthcare Pictures Pdf
Following slide showcases dashboard that provides data for hospital management using technology and IoT devices. It includes metrics such as admitted patients, readmission rate, readmitted patients, etc. Find a pre designed and impeccable Hospital Management Dashboard Deploying IoT Solutions For Enhanced Healthcare Pictures Pdf. The templates can ace your presentation without additional effort. You can download these easy to edit presentation templates to make your presentation stand out from others. So, what are you waiting for Download the template from Slidegeeks today and give a unique touch to your presentation. Following slide showcases dashboard that provides data for hospital management using technology and IoT devices. It includes metrics such as admitted patients, readmission rate, readmitted patients, etc.
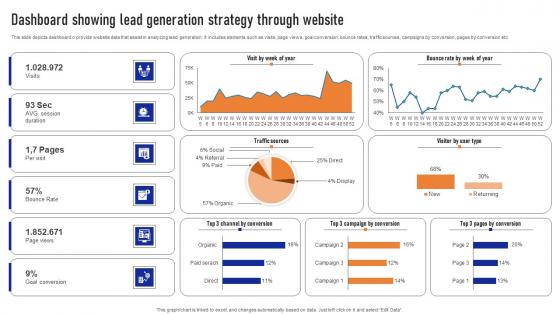
Dashboard Showing Lead Generation Strategy Through Website Ppt Infographic Template Rules Pdf
This slide depicts dashboard o provide website data that assist in analyzing lead generation. It includes elements such as visits, page views, goal conversion, bounce rates, traffic sources, campaigns by conversion, pages by conversion etc. Pitch your topic with ease and precision using this Dashboard Showing Lead Generation Strategy Through Website Ppt Infographic Template Rules Pdf. This layout presents information on Goal Conversion, Bounce Rates, Traffic Sources. It is also available for immediate download and adjustment. So, changes can be made in the color, design, graphics or any other component to create a unique layout. This slide depicts dashboard o provide website data that assist in analyzing lead generation. It includes elements such as visits, page views, goal conversion, bounce rates, traffic sources, campaigns by conversion, pages by conversion etc.
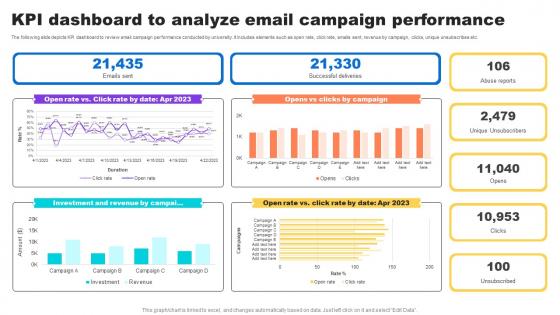
Kpi Dashboard To Analyze Email Campaign Key Step To Implementation University Strategy SS V
The following slide depicts KPI dashboard to review email campaign performance conducted by university. It includes elements such as open rate, click rate, emails sent, revenue by campaign, clicks, unique unsubscribes etc.The Kpi Dashboard To Analyze Email Campaign Key Step To Implementation University Strategy SS V is a compilation of the most recent design trends as a series of slides. It is suitable for any subject or industry presentation, containing attractive visuals and photo spots for businesses to clearly express their messages. This template contains a variety of slides for the user to input data, such as structures to contrast two elements, bullet points, and slides for written information. Slidegeeks is prepared to create an impression. The following slide depicts KPI dashboard to review email campaign performance conducted by university. It includes elements such as open rate, click rate, emails sent, revenue by campaign, clicks, unique unsubscribes etc.
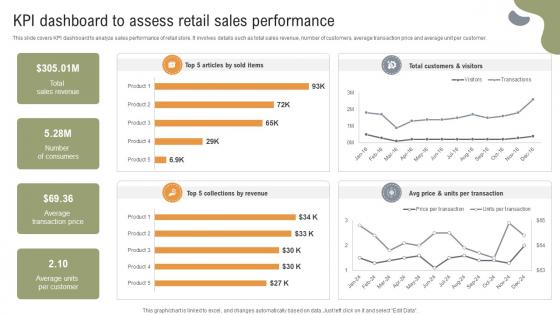
Implementing Strategies To Enhance KPI Dashboard To Assess Retail Sales Performance
This slide covers KPI dashboard to analyze sales performance of retail store. It involves details such as total sales revenue, number of customers, average transaction price and average unit per customer. The Implementing Strategies To Enhance KPI Dashboard To Assess Retail Sales Performance is a compilation of the most recent design trends as a series of slides. It is suitable for any subject or industry presentation, containing attractive visuals and photo spots for businesses to clearly express their messages. This template contains a variety of slides for the user to input data, such as structures to contrast two elements, bullet points, and slides for written information. Slidegeeks is prepared to create an impression. This slide covers KPI dashboard to analyze sales performance of retail store. It involves details such as total sales revenue, number of customers, average transaction price and average unit per customer.
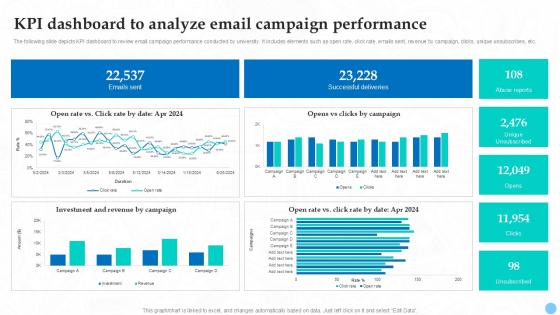
KPI Dashboard To Analyze Email Campaign Higher Education Ppt Sample Strategy SS V
The following slide depicts KPI dashboard to review email campaign performance conducted by university. It includes elements such as open rate, click rate, emails sent, revenue by campaign, clicks, unique unsubscribes, etc. The KPI Dashboard To Analyze Email Campaign Higher Education Ppt Sample Strategy SS V is a compilation of the most recent design trends as a series of slides. It is suitable for any subject or industry presentation, containing attractive visuals and photo spots for businesses to clearly express their messages. This template contains a variety of slides for the user to input data, such as structures to contrast two elements, bullet points, and slides for written information. Slidegeeks is prepared to create an impression. The following slide depicts KPI dashboard to review email campaign performance conducted by university. It includes elements such as open rate, click rate, emails sent, revenue by campaign, clicks, unique unsubscribes, etc.
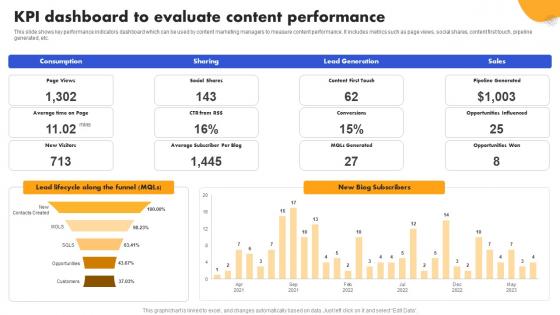
SEO Strategy To Improve ROI KPI Dashboard To Evaluate Content Strategy SS V
This slide shows key performance indicators dashboard which can be used by content marketing managers to measure content performance. It includes metrics such as page views, social shares, content first touch, pipeline generated, etc. Welcome to our selection of the SEO Strategy To Improve ROI KPI Dashboard To Evaluate Content Strategy SS V. These are designed to help you showcase your creativity and bring your sphere to life. Planning and Innovation are essential for any business that is just starting out. This collection contains the designs that you need for your everyday presentations. All of our PowerPoints are 100Percent editable, so you can customize them to suit your needs. This multi-purpose template can be used in various situations. Grab these presentation templates today. This slide shows key performance indicators dashboard which can be used by content marketing managers to measure content performance. It includes metrics such as page views, social shares, content first touch, pipeline generated, etc.

KPI Dashboard For Monitoring Warehouse Operations Strategic Plan For Enhancing Inspiration Pdf
Mentioned slide illustrates warehouse operations dashboard with key performance indicators KPIs. KPIs included are operating cost, order rate, total shipment by country and on-time shipment. Retrieve professionally designed KPI Dashboard For Monitoring Warehouse Operations Strategic Plan For Enhancing Inspiration Pdf to effectively convey your message and captivate your listeners. Save time by selecting pre-made slideshows that are appropriate for various topics, from business to educational purposes. These themes come in many different styles, from creative to corporate, and all of them are easily adjustable and can be edited quickly. Access them as PowerPoint templates or as Google Slides themes. You do not have to go on a hunt for the perfect presentation because Slidegeeks got you covered from everywhere. Mentioned slide illustrates warehouse operations dashboard with key performance indicators KPIs. KPIs included are operating cost, order rate, total shipment by country and on-time shipment.
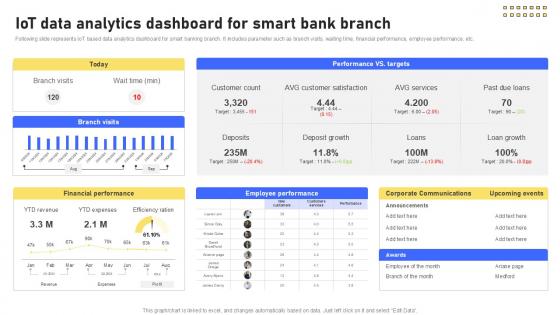
IoT Data Analytics Dashboard For Banking Future With IoT Ppt Powerpoint IoT SS V
Following slide represents IoT based data analytics dashboard for smart banking branch. It includes parameter such as branch visits, waiting time, financial performance, employee performance, etc. Slidegeeks is here to make your presentations a breeze with IoT Data Analytics Dashboard For Banking Future With IoT Ppt Powerpoint IoT SS V With our easy-to-use and customizable templates, you can focus on delivering your ideas rather than worrying about formatting. With a variety of designs to choose from, you are sure to find one that suits your needs. And with animations and unique photos, illustrations, and fonts, you can make your presentation pop. So whether you are giving a sales pitch or presenting to the board, make sure to check out Slidegeeks first Following slide represents IoT based data analytics dashboard for smart banking branch. It includes parameter such as branch visits, waiting time, financial performance, employee performance, etc.
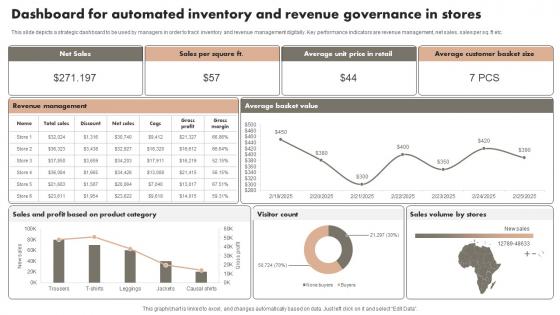
Dashboard For Automated Inventory And Revenue Governance In Stores Microsoft Pdf
This slide depicts a strategic dashboard to be used by managers in order to track inventory and revenue management digitally. Key performance indicators are revenue management, net sales, sales per sq. ft etc. Pitch your topic with ease and precision using this Dashboard For Automated Inventory And Revenue Governance In Stores Microsoft Pdf. This layout presents information on Net Sales, Stores, Category. It is also available for immediate download and adjustment. So, changes can be made in the color, design, graphics or any other component to create a unique layout. This slide depicts a strategic dashboard to be used by managers in order to track inventory and revenue management digitally. Key performance indicators are revenue management, net sales, sales per sq. ft etc.
Kpi Dashboard For Tracking Virtual Security Hazards Of Healthcare Organization Professional Pdf
This slide depicts dashboard for tracking cyber security risks faced by healthcare organizations to effectively manage the major threats and take action accordingly. The key performing indicators are percentage of risks exceeding threshold limit, breakdown of threat rating, action plan etc. Showcasing this set of slides titled Kpi Dashboard For Tracking Virtual Security Hazards Of Healthcare Organization Professional Pdf. The topics addressed in these templates are Analysis Progress, Resolution Progress, Threshold Limit. All the content presented in this PPT design is completely editable. Download it and make adjustments in color, background, font etc. as per your unique business setting. This slide depicts dashboard for tracking cyber security risks faced by healthcare organizations to effectively manage the major threats and take action accordingly. The key performing indicators are percentage of risks exceeding threshold limit, breakdown of threat rating, action plan etc.
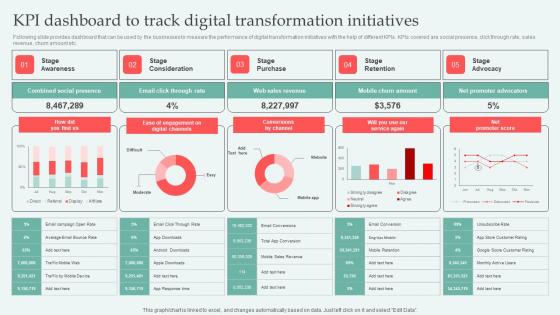
KPI Dashboard To Track Digital Approaches To Increase Business Growth Professional Pdf
Following slide provides dashboard that can be used by the businesses to measure the performance of digital transformation initiatives with the help of different KPIs. KPIs covered are social presence, click through rate, sales revenue, churn amount etc. If your project calls for a presentation, then Slidegeeks is your go to partner because we have professionally designed, easy to edit templates that are perfect for any presentation. After downloading, you can easily edit KPI Dashboard To Track Digital Approaches To Increase Business Growth Professional Pdf and make the changes accordingly. You can rearrange slides or fill them with different images. Check out all the handy templates Following slide provides dashboard that can be used by the businesses to measure the performance of digital transformation initiatives with the help of different KPIs. KPIs covered are social presence, click through rate, sales revenue, churn amount etc.
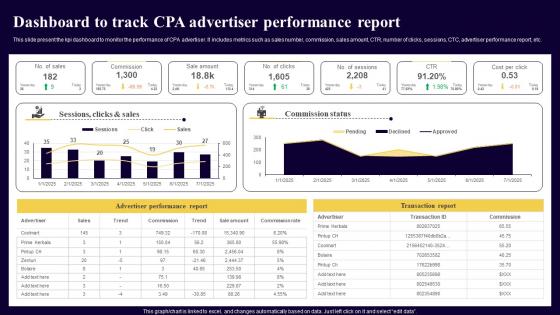
Dashboard To Track CPA Advertiser Performance Executing Cost Per Action Marketing Brochure Pdf
This slide present the kpi dashboard to monitor the performance of CPA advertiser. It includes metrics such as sales number, commission, sales amount, CTR, number of clicks, sessions, CTC, advertiser performance report, etc. Slidegeeks is here to make your presentations a breeze with Dashboard To Track CPA Advertiser Performance Executing Cost Per Action Marketing Brochure Pdf With our easy-to-use and customizable templates, you can focus on delivering your ideas rather than worrying about formatting. With a variety of designs to choose from, you are sure to find one that suits your needs. And with animations and unique photos, illustrations, and fonts, you can make your presentation pop. So whether you are giving a sales pitch or presenting to the board, make sure to check out Slidegeeks first. This slide present the kpi dashboard to monitor the performance of CPA advertiser. It includes metrics such as sales number, commission, sales amount, CTR, number of clicks, sessions, CTC, advertiser performance report, etc.
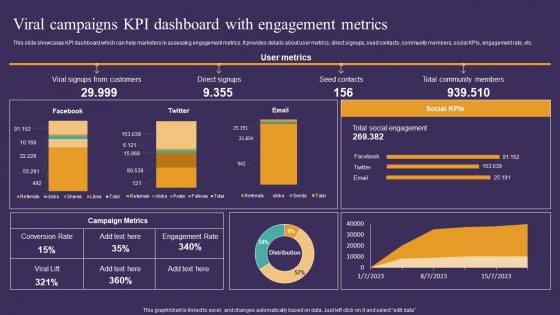
Strategic Guide To Attract Viral Campaigns KPI Dashboard With Engagement Metrics Summary Pdf
This slide showcases KPI dashboard which can help marketers in assessing engagement metrics. It provides details about user metrics, direct signups, seed contacts, community members, social KPIs, engagement rate, etc. Do you know about Slidesgeeks Strategic Guide To Attract Viral Campaigns KPI Dashboard With Engagement Metrics Summary Pdf These are perfect for delivering any kind od presentation. Using it, create PowerPoint presentations that communicate your ideas and engage audiences. Save time and effort by using our pre-designed presentation templates that are perfect for a wide range of topic. Our vast selection of designs covers a range of styles, from creative to business, and are all highly customizable and easy to edit. Download as a PowerPoint template or use them as Google Slides themes. This slide showcases KPI dashboard which can help marketers in assessing engagement metrics. It provides details about user metrics, direct signups, seed contacts, community members, social KPIs, engagement rate, etc.
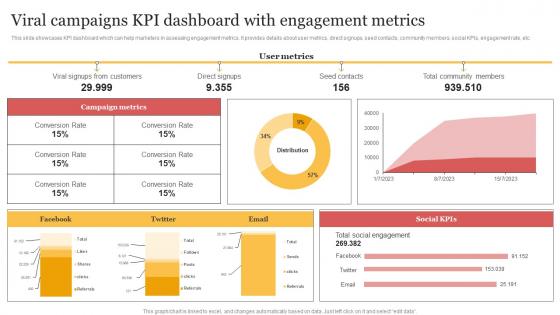
Viral Campaigns KPI Dashboard With Engagement Metrics Organizing Buzzworthy Social Portrait Pdf
This slide showcases KPI dashboard which can help marketers in assessing engagement metrics. It provides details about user metrics, direct signups, seed contacts, community members, social KPIs, engagement rate, etc. This Viral Campaigns KPI Dashboard With Engagement Metrics Organizing Buzzworthy Social Portrait Pdf from Slidegeeks makes it easy to present information on your topic with precision. It provides customization options, so you can make changes to the colors, design, graphics, or any other component to create a unique layout. It is also available for immediate download, so you can begin using it right away. Slidegeeks has done good research to ensure that you have everything you need to make your presentation stand out. Make a name out there for a brilliant performance. This slide showcases KPI dashboard which can help marketers in assessing engagement metrics. It provides details about user metrics, direct signups, seed contacts, community members, social KPIs, engagement rate, etc.
Leveraging Logistics Automation Dashboard For Tracking Impact Of Procurement Ideas Pdf
This slide covers the dashboard for analysing procurement performance after automation. It include KPIs such as on time delivery, percentage of returns, compliance index percentage, procurement ROI, cost saving, budget spent on training, etc. Slidegeeks is here to make your presentations a breeze with Leveraging Logistics Automation Dashboard For Tracking Impact Of Procurement Ideas Pdf With our easy to use and customizable templates, you can focus on delivering your ideas rather than worrying about formatting. With a variety of designs to choose from, you are sure to find one that suits your needs. And with animations and unique photos, illustrations, and fonts, you can make your presentation pop. So whether you are giving a sales pitch or presenting to the board, make sure to check out Slidegeeks first. This slide covers the dashboard for analysing procurement performance after automation. It include KPIs such as on time delivery, percentage of returns, compliance index percentage, procurement ROI, cost saving, budget spent on training, etc.

How To Create Cost Effective Facebook Ads Dashboard With Campaign Strategy SS V
The following slide outlines comprehensive dashboard through which advertisers can monitor Facebook ads performance. The KPIs outlined in slide are ad spend, conversions, cost per conversion, cost per action, brand impressions, clicks, etc. If your project calls for a presentation, then Slidegeeks is your go-to partner because we have professionally designed, easy-to-edit templates that are perfect for any presentation. After downloading, you can easily edit How To Create Cost Effective Facebook Ads Dashboard With Campaign Strategy SS V and make the changes accordingly. You can rearrange slides or fill them with different images. Check out all the handy templates The following slide outlines comprehensive dashboard through which advertisers can monitor Facebook ads performance. The KPIs outlined in slide are ad spend, conversions, cost per conversion, cost per action, brand impressions, clicks, etc.

Equity Asset Allocation Dashboard Analytics Strategic Investment Plan For Optimizing Risk SS V
This slide represents an equity asset allocation dashboard to measure and manage the performance of equity overtime. It tracks KPIs such as, average position size, market cap distribution, average PE distribution, ratio and yield, by geography, industry, currency and holding lists.If your project calls for a presentation, then Slidegeeks is your go-to partner because we have professionally designed, easy-to-edit templates that are perfect for any presentation. After downloading, you can easily edit Equity Asset Allocation Dashboard Analytics Strategic Investment Plan For Optimizing Risk SS V and make the changes accordingly. You can rearrange slides or fill them with different images. Check out all the handy templates This slide represents an equity asset allocation dashboard to measure and manage the performance of equity overtime. It tracks KPIs such as, average position size, market cap distribution, average PE distribution, ratio and yield, by geography, industry, currency and holding lists.
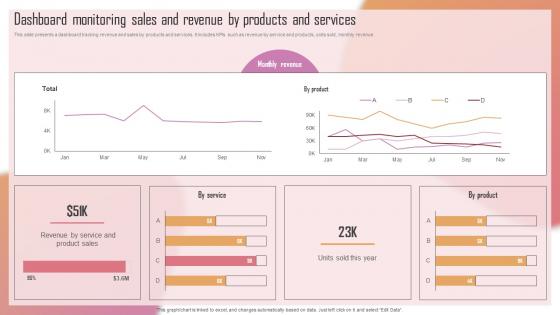
Customizing The Salon Experience Dashboard Monitoring Sales And Revenue By Products Strategy SS V
This slide presents a dashboard tracking revenue and sales by products and services. It includes KPIs such as revenue by service and products, units sold, monthly revenue. If your project calls for a presentation, then Slidegeeks is your go-to partner because we have professionally designed, easy-to-edit templates that are perfect for any presentation. After downloading, you can easily edit Customizing The Salon Experience Dashboard Monitoring Sales And Revenue By Products Strategy SS V and make the changes accordingly. You can rearrange slides or fill them with different images. Check out all the handy templates This slide presents a dashboard tracking revenue and sales by products and services. It includes KPIs such as revenue by service and products, units sold, monthly revenue.
Marketing Tech Stack Impact Tracking Dashboard Comprehensive Guide For Marketing Technology
Following slide demonstrates performance monitoring dashboard. It includes key KPIs such as website visits, blog traffic, social share, click through rate, conversion rate, bounce rate, and impressions. Slidegeeks is here to make your presentations a breeze with Marketing Tech Stack Impact Tracking Dashboard Comprehensive Guide For Marketing Technology With our easy-to-use and customizable templates, you can focus on delivering your ideas rather than worrying about formatting. With a variety of designs to choose from, you are sure to find one that suits your needs. And with animations and unique photos, illustrations, and fonts, you can make your presentation pop. So whether you are giving a sales pitch or presenting to the board, make sure to check out Slidegeeks first Following slide demonstrates performance monitoring dashboard. It includes key KPIs such as website visits, blog traffic, social share, click through rate, conversion rate, bounce rate, and impressions.
Effective Product Adaptation Dashboard Tracking Influencer Marketing Campaign Performance Diagrams PDF
If you are looking for a format to display your unique thoughts, then the professionally designed Effective Product Adaptation Dashboard Tracking Influencer Marketing Campaign Performance Diagrams PDF is the one for you. You can use it as a Google Slides template or a PowerPoint template. Incorporate impressive visuals, symbols, images, and other charts. Modify or reorganize the text boxes as you desire. Experiment with shade schemes and font pairings. Alter, share or cooperate with other people on your work. Download Effective Product Adaptation Dashboard Tracking Influencer Marketing Campaign Performance Diagrams PDF and find out how to give a successful presentation. Present a perfect display to your team and make your presentation unforgettable. This slide represents a dashboard monitoring the performance of local influencer marketing campaigns to promote the product in the target market. It tracks KPIs such as, post, Instagram impressions, likes, comments, visitor calculation, campaign insights, and top performers.
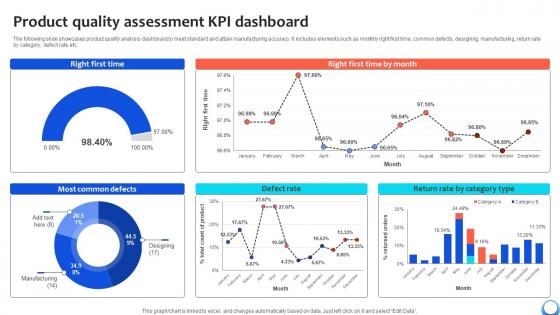
Product Quality Assessment KPI Dashboard Automating Production Process Strategy SS V
The following slide showcases product quality analysis dashboard to meet standard and attain manufacturing accuracy. It includes elements such as monthly right first time, common defects, designing, manufacturing, return rate by category, defect rate etc. Take your projects to the next level with our ultimate collection of Product Quality Assessment KPI Dashboard Automating Production Process Strategy SS V. Slidegeeks has designed a range of layouts that are perfect for representing task or activity duration, keeping track of all your deadlines at a glance. Tailor these designs to your exact needs and give them a truly corporate look with your own brand colors they will make your projects stand out from the rest The following slide showcases product quality analysis dashboard to meet standard and attain manufacturing accuracy. It includes elements such as monthly right first time, common defects, designing, manufacturing, return rate by category, defect rate etc.

Multiple Project Management Dashboard Excel Template In Powerpoint And Google Slides Cpb
Introducing our well designed Multiple Project Management Dashboard Excel Template In Powerpoint And Google Slides Cpb. This PowerPoint design presents information on topics like Multiple Project Management Dashboard Excel Template. As it is predesigned it helps boost your confidence level. It also makes you a better presenter because of its high quality content and graphics. This PPT layout can be downloaded and used in different formats like PDF, PNG, and JPG. Not only this, it is available in both Standard Screen and Widescreen aspect ratios for your convenience. Therefore, click on the download button now to persuade and impress your audience. Our Multiple Project Management Dashboard Excel Template In Powerpoint And Google Slides Cpb are topically designed to provide an attractive backdrop to any subject. Use them to look like a presentation pro.
KPI Dashboard For Tracking Monthly Personal Comprehensive Smartphone Banking Introduction Pdf
This slide shows dashboard which can be used by individuals to track monthly expenses in order to get better understanding of hisorher finances. It includes metrics such as users spending, savings, debt, etc.Take your projects to the next level with our ultimate collection of KPI Dashboard For Tracking Monthly Personal Comprehensive Smartphone Banking Introduction Pdf. Slidegeeks has designed a range of layouts that are perfect for representing task or activity duration, keeping track of all your deadlines at a glance. Tailor these designs to your exact needs and give them a truly corporate look with your own brand colors they all make your projects stand out from the rest. This slide shows dashboard which can be used by individuals to track monthly expenses in order to get better understanding of hisorher finances. It includes metrics such as users spending, savings, debt, etc.
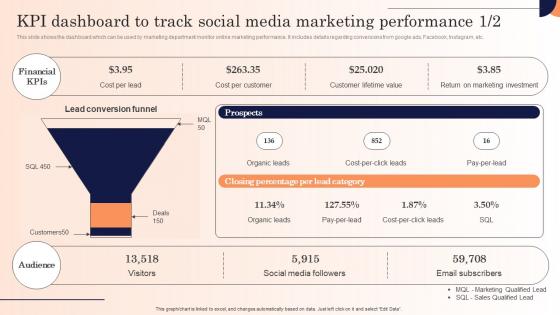
Kpi Dashboard To Track Social Media Marketing Strategic Marketing Campaign Inspiration Pdf
This slide shows the dashboard which can be used by marketing department monitor online marketing performance. It includes details regarding conversions from google ads, Facebook, Instagram, etc.Welcome to our selection of the Kpi Dashboard To Track Social Media Marketing Strategic Marketing Campaign Inspiration Pdf. These are designed to help you showcase your creativity and bring your sphere to life. Planning and Innovation are essential for any business that is just starting out. This collection contains the designs that you need for your everyday presentations. All of our PowerPoints are 100Precent editable, so you can customize them to suit your needs. This multi-purpose template can be used in various situations. Grab these presentation templates today. This slide shows the dashboard which can be used by marketing department monitor online marketing performance. It includes details regarding conversions from google ads, Facebook, Instagram, etc.
Referral Program Partners Performance Tracking Dashboard Word Of Mouth Marketing Pictures Pdf
This slide covers dashboard to track effectiveness of partners in referral program along revenue generation. It include elements such as total partners, patner employees, referrals received, revenue earned, etc.Do you know about Slidesgeeks Referral Program Partners Performance Tracking Dashboard Word Of Mouth Marketing Pictures Pdf These are perfect for delivering any kind od presentation. Using it, create PowerPoint presentations that communicate your ideas and engage audiences. Save time and effort by using our pre-designed presentation templates that are perfect for a wide range of topic. Our vast selection of designs covers a range of styles, from creative to business, and are all highly customizable and easy to edit. Download as a PowerPoint template or use them as Google Slides themes. This slide covers dashboard to track effectiveness of partners in referral program along revenue generation. It include elements such as total partners, patner employees, referrals received, revenue earned, etc.
KPI Dashboard For Tracking Social Implementing Marketing Tactics To Drive Sample Pdf
This slide covers the dashboard for analyzing social media marketing campaigns. It includes metrics such as tweets, followers, followings, listed favorites, reach, views, Facebook engagement, clicks, likes, Instagram photos, etc. Take your projects to the next level with our ultimate collection of KPI Dashboard For Tracking Social Implementing Marketing Tactics To Drive Sample Pdf. Slidegeeks has designed a range of layouts that are perfect for representing task or activity duration, keeping track of all your deadlines at a glance. Tailor these designs to your exact needs and give them a truly corporate look with your own brand colors they well make your projects stand out from the rest. This slide covers the dashboard for analyzing social media marketing campaigns. It includes metrics such as tweets, followers, followings, listed favorites, reach, views, Facebook engagement, clicks, likes, Instagram photos, etc.
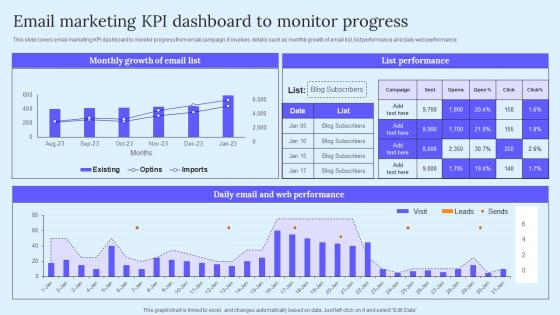
Email Marketing KPI Dashboard B2B Marketing Techniques To Attract Potential Professional Pdf
This slide covers email marketing KPI dashboard to monitor progress from email campaign. It involves details such as monthly growth of email list, list performance and daily web performance. Coming up with a presentation necessitates that the majority of the effort goes into the content and the message you intend to convey. The visuals of a PowerPoint presentation can only be effective if it supplements and supports the story that is being told. Keeping this in mind our experts created Email Marketing KPI Dashboard B2B Marketing Techniques To Attract Potential Professional Pdf to reduce the time that goes into designing the presentation. This way, you can concentrate on the message while our designers take care of providing you with the right template for the situation. This slide covers email marketing KPI dashboard to monitor progress from email campaign. It involves details such as monthly growth of email list, list performance and daily web performance.
Lead Generation Dashboard For Tracking Various Techniques For Managing Slides PDF
This slide covers the KPI dashboard for tracking lead conversion rates. It includes metrics such as visitors, average session rate, per visit, bounce rate, page views, etc. Welcome to our selection of the Lead Generation Dashboard For Tracking Various Techniques For Managing Slides PDF. These are designed to help you showcase your creativity and bring your sphere to life. Planning and Innovation are essential for any business that is just starting out. This collection contains the designs that you need for your everyday presentations. All of our PowerPoints are 100 percent editable, so you can customize them to suit your needs. This multi-purpose template can be used in various situations. Grab these presentation templates today This slide covers the KPI dashboard for tracking lead conversion rates. It includes metrics such as visitors, average session rate, per visit, bounce rate, page views, etc.
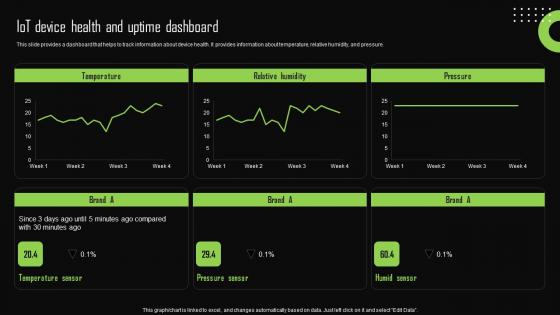
Iot Device Health And Uptime Dashboard Iot Device Management Graphics Pdf
This slide provides a dashboard that helps to track information about device health. It provides information about temperature, relative humidity, and pressure. Take your projects to the next level with our ultimate collection of Iot Device Health And Uptime Dashboard Iot Device Management Graphics Pdf. Slidegeeks has designed a range of layouts that are perfect for representing task or activity duration, keeping track of all your deadlines at a glance. Tailor these designs to your exact needs and give them a truly corporate look with your own brand colors they will make your projects stand out from the rest This slide provides a dashboard that helps to track information about device health. It provides information about temperature, relative humidity, and pressure.
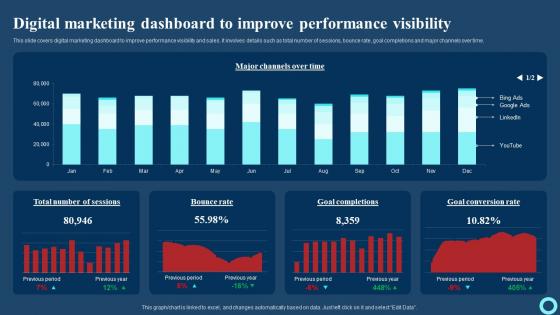
Digital Marketing Dashboard To Improve Performance Effective Strategies To Enhance Background Pdf
This slide covers digital marketing dashboard to improve performance visibility and sales. It involves details such as total number of sessions, bounce rate, goal completions and major channels over time. Do you know about Slidesgeeks Digital Marketing Dashboard To Improve Performance Effective Strategies To Enhance Background Pdf These are perfect for delivering any kind od presentation. Using it, create PowerPoint presentations that communicate your ideas and engage audiences. Save time and effort by using our pre-designed presentation templates that are perfect for a wide range of topic. Our vast selection of designs covers a range of styles, from creative to business, and are all highly customizable and easy to edit. Download as a PowerPoint template or use them as Google Slides themes. This slide covers digital marketing dashboard to improve performance visibility and sales. It involves details such as total number of sessions, bounce rate, goal completions and major channels over time.
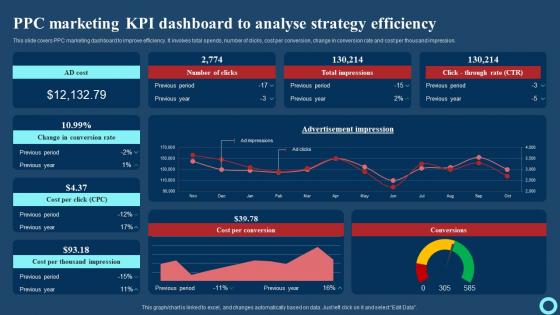
PPC Marketing KPI Dashboard To Analyse Strategy Efficiency Effective Strategies To Enhance Mockup Pdf
This slide covers PPC marketing dashboard to improve efficiency. It involves total spends, number of clicks, cost per conversion, change in conversion rate and cost per thousand impression. Welcome to our selection of the PPC Marketing KPI Dashboard To Analyse Strategy Efficiency Effective Strategies To Enhance Mockup Pdf These are designed to help you showcase your creativity and bring your sphere to life. Planning and Innovation are essential for any business that is just starting out. This collection contains the designs that you need for your everyday presentations. All of our PowerPoints are 100 percent editable, so you can customize them to suit your needs. This multi-purpose template can be used in various situations. Grab these presentation templates today. This slide covers PPC marketing dashboard to improve efficiency. It involves total spends, number of clicks, cost per conversion, change in conversion rate and cost per thousand impression.
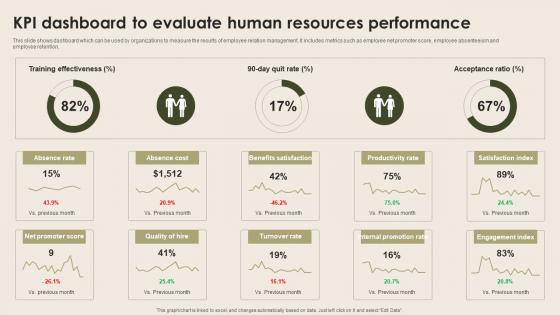
KPI Dashboard To Evaluate Human Resources Nurturing Positive Work Culture Diagrams Pdf
This slide shows dashboard which can be used by organizations to measure the results of employee relation management. It includes metrics such as employee net promoter score, employee absenteeism and employee retention. Welcome to our selection of the KPI Dashboard To Evaluate Human Resources Nurturing Positive Work Culture Diagrams Pdf. These are designed to help you showcase your creativity and bring your sphere to life. Planning and Innovation are essential for any business that is just starting out. This collection contains the designs that you need for your everyday presentations. All of our PowerPoints are 100 percent editable, so you can customize them to suit your needs. This multi-purpose template can be used in various situations. Grab these presentation templates today This slide shows dashboard which can be used by organizations to measure the results of employee relation management. It includes metrics such as employee net promoter score, employee absenteeism and employee retention.
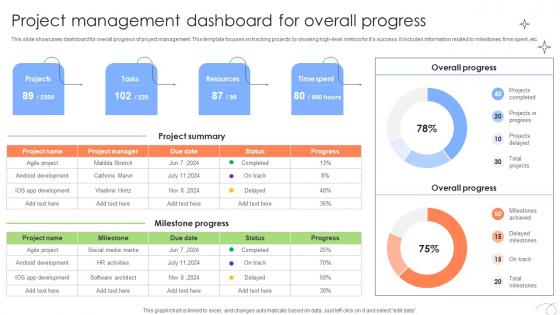
Executing And Monitoring Project Management Dashboard For Overall PM SS V
This slide showcases dashboard for overall progress of project management. This template focuses on tracking projects by showing high-level metrics for it is success. It includes information related to milestones, time spent, etc. Coming up with a presentation necessitates that the majority of the effort goes into the content and the message you intend to convey. The visuals of a PowerPoint presentation can only be effective if it supplements and supports the story that is being told. Keeping this in mind our experts created Executing And Monitoring Project Management Dashboard For Overall PM SS V to reduce the time that goes into designing the presentation. This way, you can concentrate on the message while our designers take care of providing you with the right template for the situation. This slide showcases dashboard for overall progress of project management. This template focuses on tracking projects by showing high-level metrics for it is success. It includes information related to milestones, time spent, etc.

Empowering The Future Smart Meters Dashboard For Effective Energy IoT SS V
This slide exhibits a dashboard that provides real-time energy specific information from multiple smart meters. It includes elements such as voltage, energy consumption, energy meters, alarms alert, and amperage Welcome to our selection of the Empowering The Future Smart Meters Dashboard For Effective Energy IoT SS V. These are designed to help you showcase your creativity and bring your sphere to life. Planning and Innovation are essential for any business that is just starting out. This collection contains the designs that you need for your everyday presentations. All of our PowerPoints are 100Percent editable, so you can customize them to suit your needs. This multi-purpose template can be used in various situations. Grab these presentation templates today. This slide exhibits a dashboard that provides real-time energy specific information from multiple smart meters. It includes elements such as voltage, energy consumption, energy meters, alarms alert, and amperage
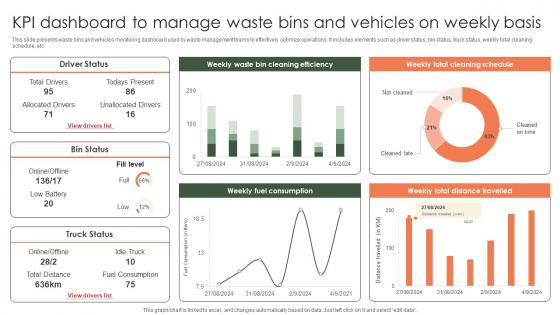
Kpi Dashboard To Manage Waste Bins And Vehicles On Weekly Implementation Of E Waste Guidelines
This slide presents waste bins and vehicles monitoring dashboard used by waste management teams to effectively optimize operations. It includes elements such as driver status, bin status, truck status, weekly total cleaning schedule, etc. Welcome to our selection of the Kpi Dashboard To Manage Waste Bins And Vehicles On Weekly Implementation Of E Waste Guidelines. These are designed to help you showcase your creativity and bring your sphere to life. Planning and Innovation are essential for any business that is just starting out. This collection contains the designs that you need for your everyday presentations. All of our PowerPoints are 100 percent editable, so you can customize them to suit your needs. This multi-purpose template can be used in various situations. Grab these presentation templates today. This slide presents waste bins and vehicles monitoring dashboard used by waste management teams to effectively optimize operations. It includes elements such as driver status, bin status, truck status, weekly total cleaning schedule, etc.
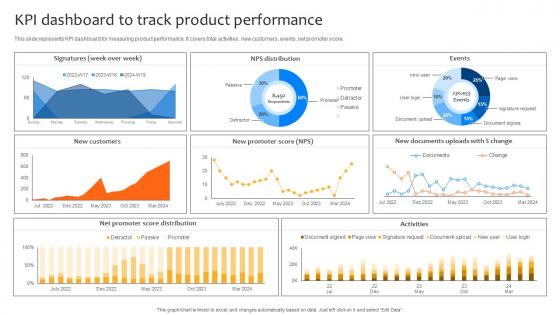
Deploying Strategies For Business KPI Dashboard To Track Product Performance Strategy SS V
This slide represents KPI dashboard for measuring product performance. It covers total activities, new customers, events, net promoter score. Coming up with a presentation necessitates that the majority of the effort goes into the content and the message you intend to convey. The visuals of a PowerPoint presentation can only be effective if it supplements and supports the story that is being told. Keeping this in mind our experts created Deploying Strategies For Business KPI Dashboard To Track Product Performance Strategy SS V to reduce the time that goes into designing the presentation. This way, you can concentrate on the message while our designers take care of providing you with the right template for the situation. This slide represents KPI dashboard for measuring product performance. It covers total activities, new customers, events, net promoter score.
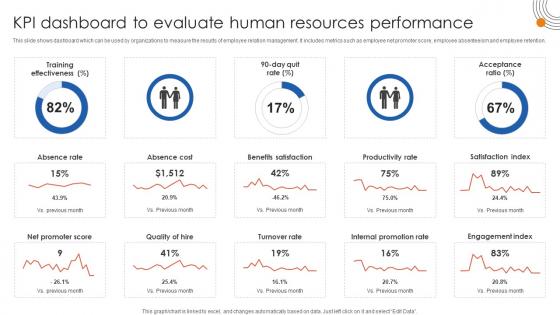
Human Resource Industrial Relationship Kpi Dashboard To Evaluate Human Resources Performance
This slide shows dashboard which can be used by organizations to measure the results of employee relation management. It includes metrics such as employee net promoter score, employee absenteeism and employee retention. Welcome to our selection of the Human Resource Industrial Relationship Kpi Dashboard To Evaluate Human Resources Performance. These are designed to help you showcase your creativity and bring your sphere to life. Planning and Innovation are essential for any business that is just starting out. This collection contains the designs that you need for your everyday presentations. All of our PowerPoints are 100Percent editable, so you can customize them to suit your needs. This multi-purpose template can be used in various situations. Grab these presentation templates today. This slide shows dashboard which can be used by organizations to measure the results of employee relation management. It includes metrics such as employee net promoter score, employee absenteeism and employee retention.
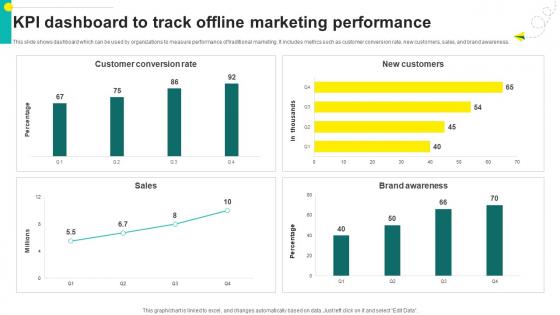
One On One Advertising Kpi Dashboard To Track Offline Marketing Performance Strategy SS V
This slide shows dashboard which can be used by organizations to measure performance of traditional marketing. It includes metrics such as customer conversion rate, new customers, sales, and brand awareness. Welcome to our selection of the One On One Advertising Kpi Dashboard To Track Offline Marketing Performance Strategy SS V. These are designed to help you showcase your creativity and bring your sphere to life. Planning and Innovation are essential for any business that is just starting out. This collection contains the designs that you need for your everyday presentations. All of our PowerPoints are 100Percent editable, so you can customize them to suit your needs. This multi-purpose template can be used in various situations. Grab these presentation templates today. This slide shows dashboard which can be used by organizations to measure performance of traditional marketing. It includes metrics such as customer conversion rate, new customers, sales, and brand awareness.
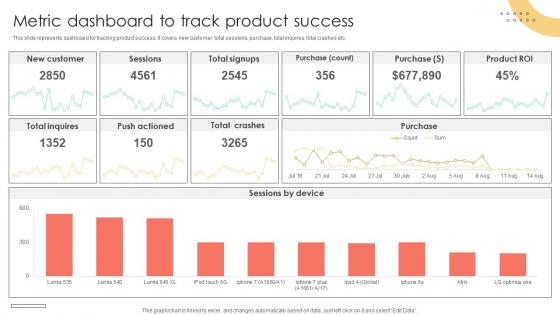
Brand Extension Techniques Metric Dashboard To Track Product Success Strategy SS V
This slide represents dashboard for tracking product success. It covers new customer, total sessions, purchase, total inquires, total crashes etc. Welcome to our selection of the Brand Extension Techniques Metric Dashboard To Track Product Success Strategy SS V. These are designed to help you showcase your creativity and bring your sphere to life. Planning and Innovation are essential for any business that is just starting out. This collection contains the designs that you need for your everyday presentations. All of our PowerPoints are 100Percent editable, so you can customize them to suit your needs. This multi-purpose template can be used in various situations. Grab these presentation templates today. This slide represents dashboard for tracking product success. It covers new customer, total sessions, purchase, total inquires, total crashes etc.
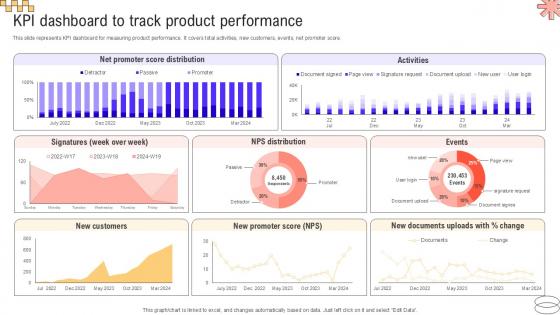
KPI Dashboard To Track Product Implementing Geographic Extension PPT Example Strategy SS V
This slide represents KPI dashboard for measuring product performance. It covers total activities, new customers, events, net promoter score. Coming up with a presentation necessitates that the majority of the effort goes into the content and the message you intend to convey. The visuals of a PowerPoint presentation can only be effective if it supplements and supports the story that is being told. Keeping this in mind our experts created KPI Dashboard To Track Product Implementing Geographic Extension PPT Example Strategy SS V to reduce the time that goes into designing the presentation. This way, you can concentrate on the message while our designers take care of providing you with the right template for the situation. This slide represents KPI dashboard for measuring product performance. It covers total activities, new customers, events, net promoter score.
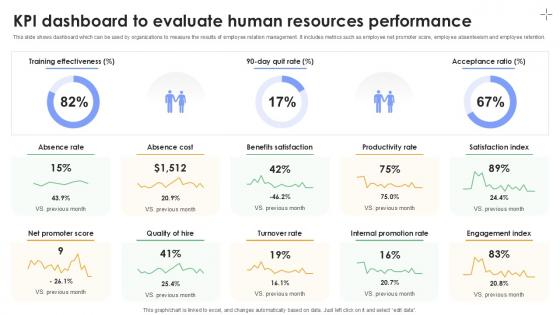
KPI Dashboard To Evaluate Human Resources Performance Plan To Develop Ppt Slides
This slide shows dashboard which can be used by organizations to measure the results of employee relation management. It includes metrics such as employee net promoter score, employee absenteeism and employee retention. Welcome to our selection of the KPI Dashboard To Evaluate Human Resources Performance Plan To Develop Ppt Slides. These are designed to help you showcase your creativity and bring your sphere to life. Planning and Innovation are essential for any business that is just starting out. This collection contains the designs that you need for your everyday presentations. All of our PowerPoints are 100Percent editable, so you can customize them to suit your needs. This multi-purpose template can be used in various situations. Grab these presentation templates today. This slide shows dashboard which can be used by organizations to measure the results of employee relation management. It includes metrics such as employee net promoter score, employee absenteeism and employee retention.
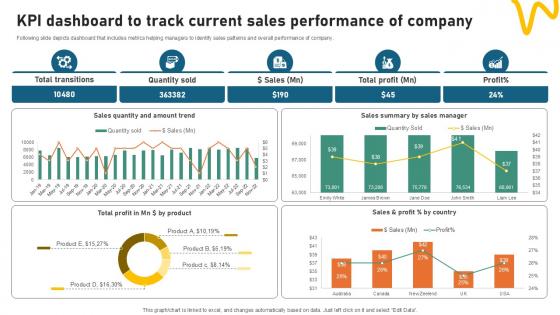
KPI Dashboard To Track Current Sales Sample Pitch Deck For Video Ppt Example
Following slide depicts dashboard that includes metrics helping managers to identify sales patterns and overall performance of company. Welcome to our selection of the KPI Dashboard To Track Current Sales Sample Pitch Deck For Video Ppt Example. These are designed to help you showcase your creativity and bring your sphere to life. Planning and Innovation are essential for any business that is just starting out. This collection contains the designs that you need for your everyday presentations. All of our PowerPoints are 100Percent editable, so you can customize them to suit your needs. This multi-purpose template can be used in various situations. Grab these presentation templates today. Following slide depicts dashboard that includes metrics helping managers to identify sales patterns and overall performance of company.


 Continue with Email

 Home
Home


