Dashboards Manufacturing
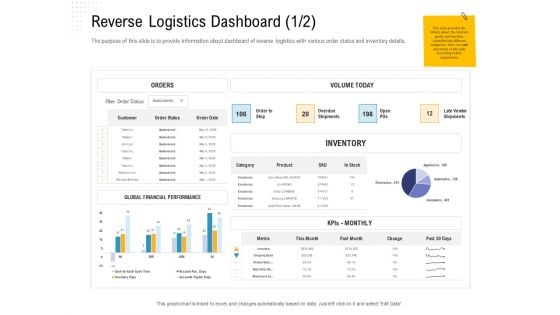
Reverse Logistic In Supply Chain Strategy Reverse Logistics Dashboard Category Introduction PDF
The purpose of this slide is to provide information about dashboard of reverse logistics with various order status and inventory details.Deliver an awe inspiring pitch with this creative reverse logistic in supply chain strategy reverse logistics dashboard category introduction pdf bundle. Topics like category, product, overdue shipments, inventory, shipping costs can be discussed with this completely editable template. It is available for immediate download depending on the needs and requirements of the user.

Reverse Logistic In Supply Chain Strategy Reverse Logistics Dashboard Orders Introduction PDF
The purpose of this slide is to provide information about dashboard of reverse logistics with various order status.Deliver and pitch your topic in the best possible manner with this reverse logistic in supply chain strategy reverse logistics dashboard orders introduction pdf. Use them to share invaluable insights on order, sales, products, cancelled, revenue and impress your audience. This template can be altered and modified as per your expectations. So, grab it now.
Benchmarking Vendor Operation Control Procedure Inventory Turnover Tracking Dashboard Pictures PDF
This slide displays inventory turnover tracking dashboard. It includes information about achievable and target inventory, it also shows various reasons for product or package return. Deliver and pitch your topic in the best possible manner with this benchmarking vendor operation control procedure inventory turnover tracking dashboard pictures pdf. Use them to share invaluable insights on reasons for return, inventory turnover and impress your audience. This template can be altered and modified as per your expectations. So, grab it now.
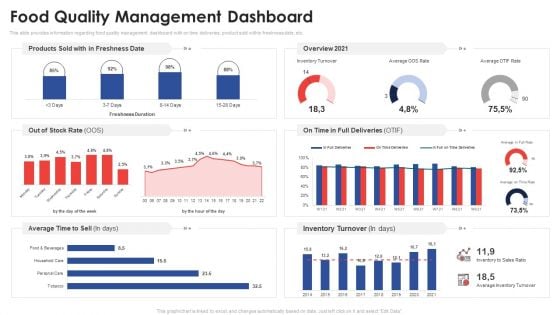
Food Quality Management Dashboard Application Of Quality Management For Food Processing Companies Clipart PDF
This slide provides information regarding food quality management dashboard with on time deliveries, product sold within freshness date, etc. Deliver and pitch your topic in the best possible manner with this food quality management dashboard application of quality management for food processing companies clipart pdf. Use them to share invaluable insights on inventory, sales, time to sell and impress your audience. This template can be altered and modified as per your expectations. So, grab it now.
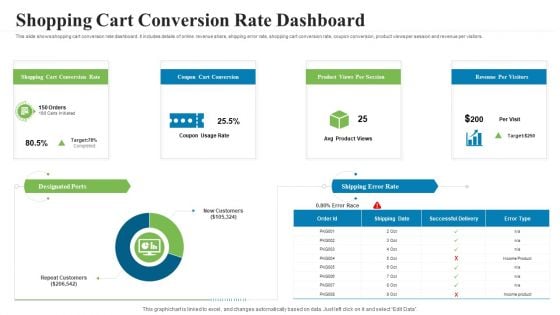
Creating Successful Advertising Campaign Shopping Cart Conversion Rate Dashboard Ideas PDF
This slide shows shopping cart conversion rate dashboard. It includes details of online revenue share, shipping error rate, shopping cart conversion rate, coupon conversion, product views per session and revenue per visitors. Deliver an awe inspiring pitch with this creative Creating Successful Advertising Campaign Shopping Cart Conversion Rate Dashboard Ideas PDF bundle. Topics like target, revenue per visitors, conversion rate can be discussed with this completely editable template. It is available for immediate download depending on the needs and requirements of the user.
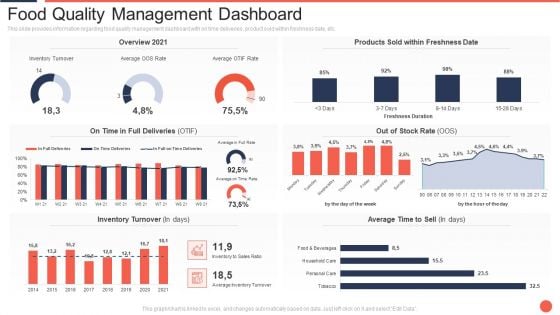
Food Quality Management Dashboard Assuring Food Quality And Hygiene Template PDF
This slide provides information regarding food quality management dashboard with on time deliveries, product sold within freshness date, etc. Deliver and pitch your topic in the best possible manner with this food quality management dashboard assuring food quality and hygiene template pdf. Use them to share invaluable insights on inventory, sales, time to sell and impress your audience. This template can be altered and modified as per your expectations. So, grab it now.
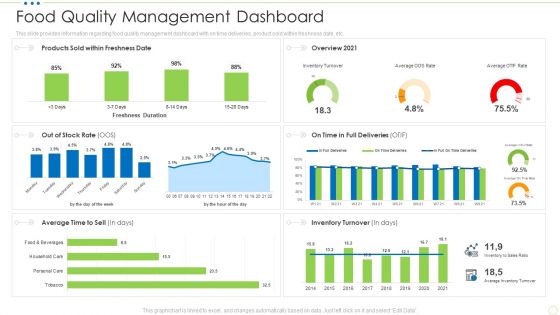
Food Quality Management Dashboard Food Security Excellence Ppt Infographic Template Graphics Pictures PDF
This slide provides information regarding food quality management dashboard with on time deliveries, product sold within freshness date, etc. Deliver and pitch your topic in the best possible manner with this food quality management dashboard food security excellence ppt infographic template graphics pictures pdf. Use them to share invaluable insights on inventory, sales, time to sell and impress your audience. This template can be altered and modified as per your expectations. So, grab it now.
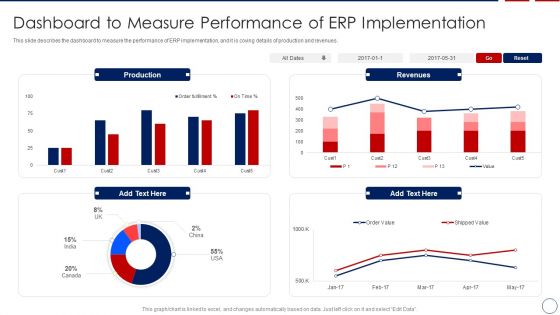
Business ERP Software Dashboard To Measure Performance Of ERP Implementation Demonstration PDF
This slide describes the dashboard to measure the performance of ERP implementation, and it is coving details of production and revenues.Deliver an awe inspiring pitch with this creative business erp software dashboard to measure performance of erp implementation demonstration pdf bundle. Topics like communication, marketing, database can be discussed with this completely editable template. It is available for immediate download depending on the needs and requirements of the user.
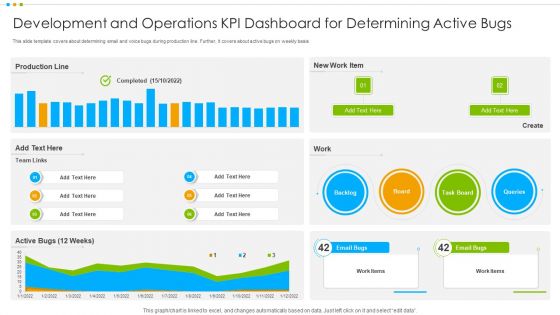
Development And Operations KPI Dashboard For Determining Active Bugs Portrait PDF
This slide template covers about determining email and voice bugs during production line. Further, it covers about active bugs on weekly basis.Showcasing this set of slides titled Development And Operations KPI Dashboard For Determining Active Bugs Portrait PDF The topics addressed in these templates are Development Operations, Dashboard Determining, Active Bugs All the content presented in this PPT design is completely editable. Download it and make adjustments in color, background, font etc. as per your unique business setting.
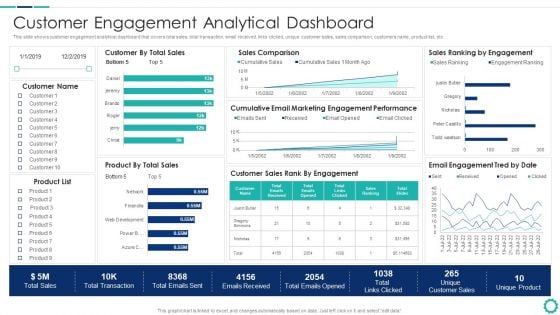
Creating Successful Strategies To Enhance Customer Experience Customer Engagement Analytical Dashboard Slides PDF
This slide shows customer engagement analytical dashboard that covers total sales, total transaction, email received, links clicked, unique customer sales, sales comparison, customers name, product list, etc.Deliver an awe inspiring pitch with this creative Creating Successful Strategies To Enhance Customer Experience Customer Engagement Analytical Dashboard Slides PDF bundle. Topics like Sales Comparison, Engagement Performance, Customer Sales can be discussed with this completely editable template. It is available for immediate download depending on the needs and requirements of the user.
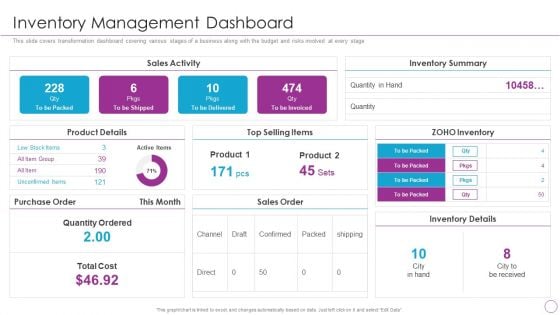
Integration Of Digital Technology In Organization Inventory Management Dashboard Ideas PDF
This slide covers transformation dashboard covering various stages of a business along with the budget and risks involved at every stage Deliver and pitch your topic in the best possible manner with this Integration Of Digital Technology In Organization Inventory Management Dashboard Ideas PDF Use them to share invaluable insights on Product Details, Inventory Summary, Sales Activity and impress your audience. This template can be altered and modified as per your expectations. So, grab it now.
Continual Improvement Procedure In Supply Chain Supply Chain Activity Tracking Dashboard Background PDF
This slide shows the dashboard that depicts supply chain management which includes retailer and warehouse capacity, delivery status from supplier to warehouse, time to reach there, etc.Deliver and pitch your topic in the best possible manner with this Continual Improvement Procedure In Supply Chain Supply Chain Activity Tracking Dashboard Background PDF. Use them to share invaluable insights on Segregating Products, Ensuring Optimized, Additional Responsibilities and impress your audience. This template can be altered and modified as per your expectations. So, grab it now.
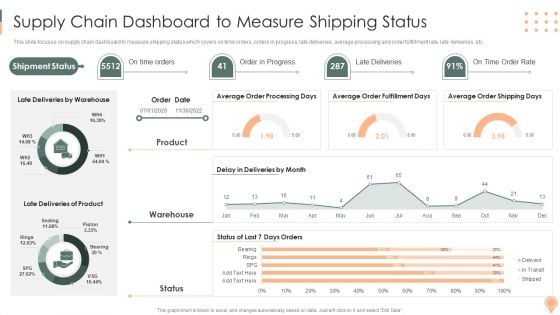
Supply Chain Approaches Supply Chain Dashboard To Measure Shipping Status Ideas PDF
This slide focuses on supply chain dashboard to measure shipping status which covers on time orders, orders in progress, late deliveries, average processing and order fulfillment rate, late deliveries, etc.Deliver an awe inspiring pitch with this creative Supply Chain Approaches Supply Chain Dashboard To Measure Shipping Status Ideas PDF bundle. Topics like Deliveries Product, Deliveries Warehouse, Average Fulfillment can be discussed with this completely editable template. It is available for immediate download depending on the needs and requirements of the user.

Customer Relationship Management Lifecycle Analytics Dashboard With Sales Record Brochure PDF
This slide signifies the customer relationship management analytics dashboard. It covers information about sales record by different representative, total products sold, sales by different month, etc.Pitch your topic with ease and precision using this Customer Relationship Management Lifecycle Analytics Dashboard With Sales Record Brochure PDF. This layout presents information on Sales Record, Representative, Total Items. It is also available for immediate download and adjustment. So, changes can be made in the color, design, graphics or any other component to create a unique layout.
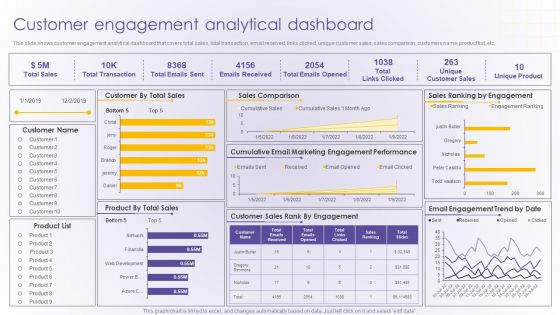
Customer Engagement Analytical Dashboard Developing Online Consumer Engagement Program Professional PDF
This slide shows customer engagement analytical dashboard that covers total sales, total transaction, email received, links clicked, unique customer sales, sales comparison, customers name, product list, etc.Deliver and pitch your topic in the best possible manner with this Customer Engagement Analytical Dashboard Developing Online Consumer Engagement Program Professional PDF. Use them to share invaluable insights on Cumulative Email, Marketing Engagement, Performance and impress your audience. This template can be altered and modified as per your expectations. So, grab it now.
Consumer Journey Mapping Techniques KPI Dashboard For Tracking Consumer Journey Touchpoints Rules PDF
This slide covers a touchpoint dashboard with different customer journey stages. It also includes a detailed evaluation of each stage on the basis of experience, importance, etc. Deliver an awe inspiring pitch with this creative Consumer Journey Mapping Techniques KPI Dashboard For Tracking Consumer Journey Touchpoints Rules PDF bundle. Topics like Product Inquiry, Purchasing, Consumer Journey can be discussed with this completely editable template. It is available for immediate download depending on the needs and requirements of the user.
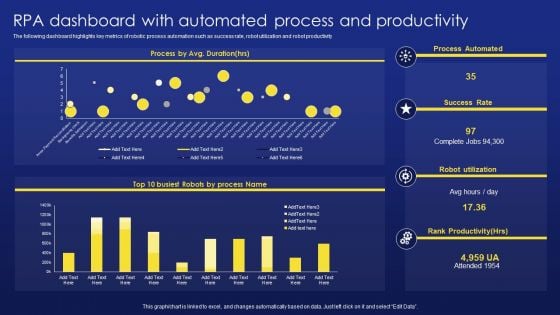
Deployment Procedure Of Hyper Automation RPA Dashboard With Automated Process And Productivity Brochure PDF
The following dashboard highlights key metrics of robotic process automation such as success rate, robot utilization and robot productivity. From laying roadmaps to briefing everything in detail, our templates are perfect for you. You can set the stage with your presentation slides. All you have to do is download these easy to edit and customizable templates. Deployment Procedure Of Hyper Automation RPA Dashboard With Automated Process And Productivity Brochure PDF will help you deliver an outstanding performance that everyone would remember and praise you for. Do download this presentation today.
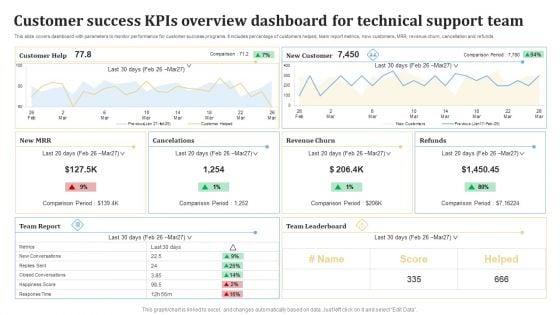
Customer Success KPIS Overview Dashboard For Technical Support Team Ppt PowerPoint Presentation Gallery Layouts PDF
This slide covers dashboard with parameters to monitor performance for customer success programs. It includes percentage of customers helped, team report metrics, new customers, MRR, revenue churn, cancellation and refunds. Showcasing this set of slides titled Customer Success KPIS Overview Dashboard For Technical Support Team Ppt PowerPoint Presentation Gallery Layouts PDF. The topics addressed in these templates are Customer, Cancelations, New Customer, Revenue Churn. All the content presented in this PPT design is completely editable. Download it and make adjustments in color, background, font etc. as per your unique business setting.
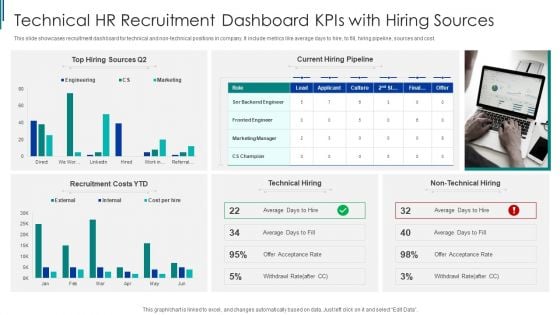
Technical HR Recruitment Dashboard Kpis With Hiring Sources Ppt Outline PDF
This slide showcases recruitment dashboard for technical and non-technical positions in company. It include metrics like average days to hire, to fill, hiring pipeline, sources and cost. Showcasing this set of slides titled Technical HR Recruitment Dashboard Kpis With Hiring Sources Ppt Outline PDF. The topics addressed in these templates are Recruitment Costs, Technical Hiring, Top Hiring Sources. All the content presented in this PPT design is completely editable. Download it and make adjustments in color, background, font etc. as per your unique business setting.
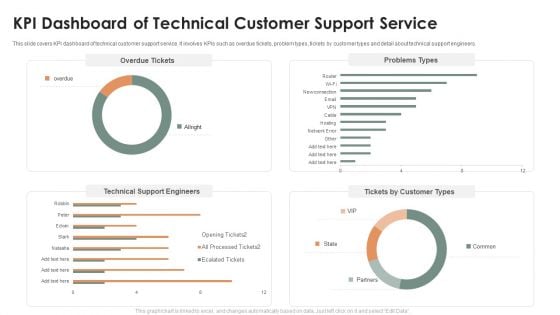
KPI Dashboard Of Technical Customer Support Service Ppt Layouts Professional PDF
This slide covers KPI dashboard of technical customer support service. It involves KPIs such as overdue tickets, problem types, tickets by customer types and detail about technical support engineers. Showcasing this set of slides titled KPI Dashboard Of Technical Customer Support Service Ppt Layouts Professional PDF. The topics addressed in these templates are Overdue Tickets, Problems Types, Technical Support Engineers. All the content presented in this PPT design is completely editable. Download it and make adjustments in color, background, font etc. as per your unique business setting.
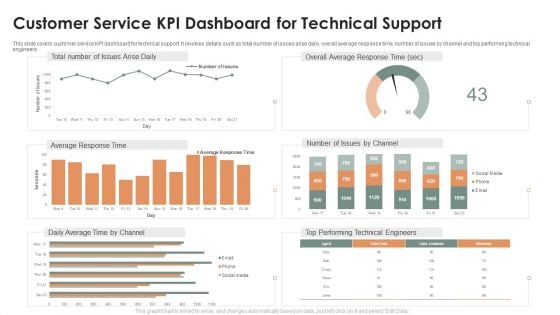
Customer Service KPI Dashboard For Technical Support Ppt Model Vector PDF
This slide covers customer service KPI dashboard for technical support. It involves details such as total number of issues arise daily, overall average response time, number of issues by channel and top performing technical engineers. Pitch your topic with ease and precision using this Customer Service KPI Dashboard For Technical Support Ppt Model Vector PDF. This layout presents information on Overall Average, Response Time, Total Number, Issues Arise Daily. It is also available for immediate download and adjustment. So, changes can be made in the color, design, graphics or any other component to create a unique layout.
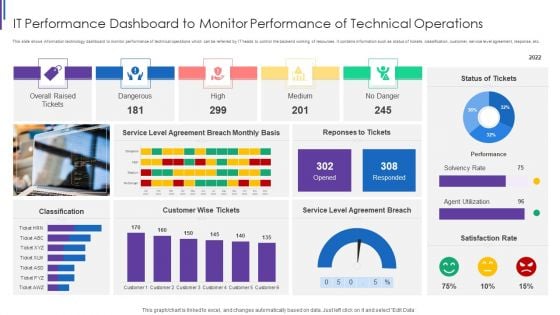
IT Performance Dashboard To Monitor Performance Of Technical Operations Download PDF
This slide shows information technology dashboard to monitor performance of technical operations which can be referred by IT heads to control the backend working of resources. It contains information such as status of tickets, classification, customer, service level agreement, response, etc. Showcasing this set of slides titled IT Performance Dashboard To Monitor Performance Of Technical Operations Download PDF. The topics addressed in these templates are Overall Raised Tickets, Dangerous High Medium, Service Level Agreement, Customer Wise Tickets. All the content presented in this PPT design is completely editable. Download it and make adjustments in color, background, font etc. as per your unique business setting.
Dashboard For Tracking Impact Of Transport Automation Optimizing Automated Supply Chain And Logistics Inspiration PDF
This slide covers the dashboard for tracking vehicle efficiency after transport automation. It include KPIs such as truck turnaround time, average revenue per hour, truckload capacity, transit time, on-time pickup, and average revenue per mile. Whether you have daily or monthly meetings, a brilliant presentation is necessary. Dashboard For Tracking Impact Of Transport Automation Optimizing Automated Supply Chain And Logistics Inspiration PDF can be your best option for delivering a presentation. Represent everything in detail using Dashboard For Tracking Impact Of Transport Automation Optimizing Automated Supply Chain And Logistics Inspiration PDF and make yourself stand out in meetings. The template is versatile and follows a structure that will cater to your requirements. All the templates prepared by Slidegeeks are easy to download and edit. Our research experts have taken care of the corporate themes as well. So, give it a try and see the results.
Streamlining Operations With Supply Chain Automation Dashboard For Tracking Impact Of Transport Automation Demonstration PDF
This slide covers the dashboard for tracking vehicle efficiency after transport automation. It include KPIs such as truck turnaround time, average revenue per hour, truckload capacity, transit time, on-time pickup, and average revenue per mile. Do you have to make sure that everyone on your team knows about any specific topic I yes, then you should give Streamlining Operations With Supply Chain Automation Dashboard For Tracking Impact Of Transport Automation Demonstration PDF a try. Our experts have put a lot of knowledge and effort into creating this impeccable Streamlining Operations With Supply Chain Automation Dashboard For Tracking Impact Of Transport Automation Demonstration PDF. You can use this template for your upcoming presentations, as the slides are perfect to represent even the tiniest detail. You can download these templates from the Slidegeeks website and these are easy to edit. So grab these today.
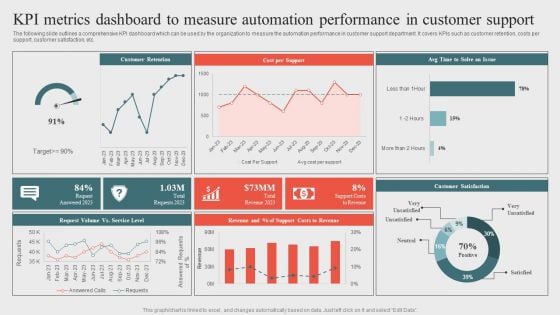
Kpi Metrics Dashboard To Measure Automation Performanceoptimizing Business Processes Through Automation Download PDF
The following slide outlines a comprehensive KPI dashboard which can be used by the organization to measure the automation performance in customer support department. It covers KPIs such as customer retention, costs per support, customer satisfaction, etc. Get a simple yet stunning designed Kpi Metrics Dashboard To Measure Automation Performanceoptimizing Business Processes Through Automation Download PDF. It is the best one to establish the tone in your meetings. It is an excellent way to make your presentations highly effective. So, download this PPT today from Slidegeeks and see the positive impacts. Our easy to edit Kpi Metrics Dashboard To Measure Automation Performanceoptimizing Business Processes Through Automation Download PDF can be your go to option for all upcoming conferences and meetings. So, what are you waiting for Grab this template today.
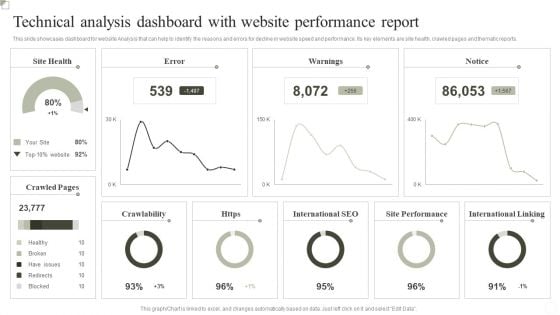
Technical Analysis Dashboard With Website Performance Report Ppt Inspiration Outline PDF
This slide showcases dashboard for website Analysis that can help to identify the reasons and errors for decline in website speed and performance. Its key elements are site health, crawled pages and thematic reports. Showcasing this set of slides titled Technical Analysis Dashboard With Website Performance Report Ppt Inspiration Outline PDF. The topics addressed in these templates are Crawlability, International SEO, Site Performance, International Linking. All the content presented in this PPT design is completely editable. Download it and make adjustments in color, background, font etc. as per your unique business setting.
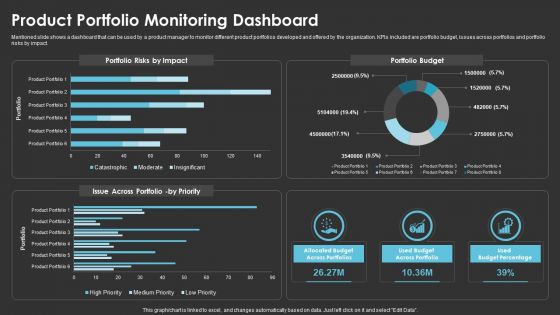
Method To Introduce New Product Offerings In The Industry Product Portfolio Monitoring Dashboard Template PDF
Mentioned slide shows a dashboard that can be used by a product manager to monitor different product portfolios developed and offered by the organization. KPIs included are portfolio budget, issues across portfolios and portfolio risks by impact. Deliver and pitch your topic in the best possible manner with this Method To Introduce New Product Offerings In The Industry Product Portfolio Monitoring Dashboard Template PDF. Use them to share invaluable insights on Portfolio Risks, Portfolio Budget and impress your audience. This template can be altered and modified as per your expectations. So, grab it now.
Automating Supply Chain Dashboard For Tracking Impact Of Procurement Process Automation Themes PDF
This slide covers the dashboard for analysing procurement performance after automation. It include KPIs such as on-time delivery, percentage of returns, compliance index percentage, procurement ROI, cost-saving, budget spent on training, etc. Deliver an awe inspiring pitch with this creative Automating Supply Chain Dashboard For Tracking Impact Of Procurement Process Automation Themes PDF bundle. Topics like Procurement ROI, Cost Saving, Perform Procurement can be discussed with this completely editable template. It is available for immediate download depending on the needs and requirements of the user.
Automating Supply Chain Dashboard For Tracking Impact Of Supply Chain Automation Pictures PDF
This slide covers the dashboard for back-end tracking of overall impact automation. It include KPIs such as retailer capacity, warehouse capacity, truck efficiency, time to reach warehouse, sustainability, etc. Deliver and pitch your topic in the best possible manner with this Automating Supply Chain Dashboard For Tracking Impact Of Supply Chain Automation Pictures PDF. Use them to share invaluable insights on Supply Chain Manager, Warehouse Manager, Truck Driver and impress your audience. This template can be altered and modified as per your expectations. So, grab it now.
Automating Supply Chain Dashboard For Tracking Impact Of Transport Automation Themes PDF
This slide covers the dashboard for tracking vehicle efficiency after transport automation. It include KPIs such as truck turnaround time, average revenue per hour, truckload capacity, transit time, on-time pickup, and average revenue per mile. Deliver an awe inspiring pitch with this creative Automating Supply Chain Dashboard For Tracking Impact Of Transport Automation Themes PDF bundle. Topics like Average Revenue, Per Mile, Truck Turnaround can be discussed with this completely editable template. It is available for immediate download depending on the needs and requirements of the user.
Automating Supply Chain Dashboard For Tracking Impact Of Warehouse House Automation Graphics PDF
This slide covers the dashboard with after automation warehouse overview. It include KPIs such as autonomous robots status, robotic arms status, battery level, performance, time to return, etc. Deliver and pitch your topic in the best possible manner with this Automating Supply Chain Dashboard For Tracking Impact Of Warehouse House Automation Graphics PDF. Use them to share invaluable insights on Autonomous Robot, Robotic Arms, Systems Engineer and impress your audience. This template can be altered and modified as per your expectations. So, grab it now.
Streamlining Operations With Supply Chain Automation Dashboard For Tracking Impact Of Supply Chain Automation Slides PDF
This slide covers the dashboard for back end tracking of overall impact automation. It include KPIs such as retailer capacity, warehouse capacity, truck efficiency, time to reach warehouse, sustainability, etc. There are so many reasons you need a Streamlining Operations With Supply Chain Automation Dashboard For Tracking Impact Of Supply Chain Automation Slides PDF. The first reason is you can not spend time making everything from scratch, Thus, Slidegeeks has made presentation templates for you too. You can easily download these templates from our website easily.
Intelligent Process Automation IPA Hyper Automation Performance Tracking Dashboard Sample PDF
This slide depicts the performance tracking dashboard for hyper-automation, covering the number of rules triggered, automated emails, average originator, recipient, average click-through rate for automated emails, and quick links. Take your projects to the next level with our ultimate collection of Intelligent Process Automation IPA Hyper Automation Performance Tracking Dashboard Sample PDF. Slidegeeks has designed a range of layouts that are perfect for representing task or activity duration, keeping track of all your deadlines at a glance. Tailor these designs to your exact needs and give them a truly corporate look with your own brand colors they will make your projects stand out from the rest
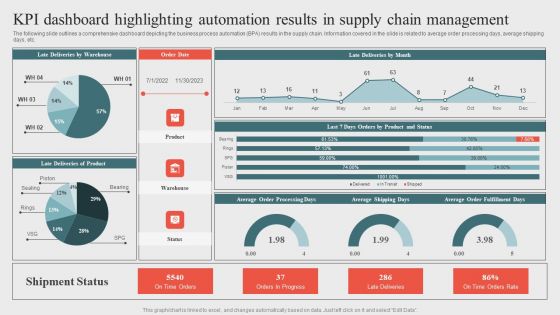
Kpi Dashboard Highlighting Automation Results In Supplyoptimizing Business Processes Through Automation Download PDF
The following slide outlines a comprehensive dashboard depicting the business process automation BPA results in the supply chain. Information covered in the slide is related to average order processing days, average shipping days, etc. There are so many reasons you need a Kpi Dashboard Highlighting Automation Results In Supplyoptimizing Business Processes Through Automation Download PDF. The first reason is you cannot spend time making everything from scratch, Thus, Slidegeeks has made presentation templates for you too. You can easily download these templates from our website easily.
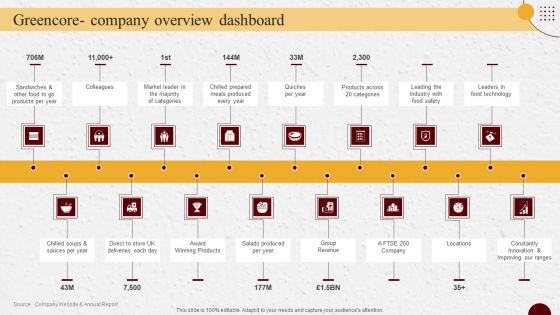
Industry Report Of Packaged Food Products Part 2 Greencore Company Overview Dashboard Clipart PDF
Whether you have daily or monthly meetings, a brilliant presentation is necessary. Industry Report Of Packaged Food Products Part 2 Greencore Company Overview Dashboard Clipart PDF can be your best option for delivering a presentation. Represent everything in detail using Industry Report Of Packaged Food Products Part 2 Greencore Company Overview Dashboard Clipart PDF and make yourself stand out in meetings. The template is versatile and follows a structure that will cater to your requirements. All the templates prepared by Slidegeeks are easy to download and edit. Our research experts have taken care of the corporate themes as well. So, give it a try and see the results.
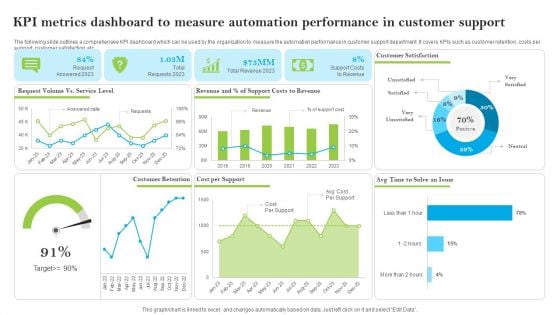
Introducing AI Tools KPI Metrics Dashboard To Measure Automation Performance Formats PDF
The following slide outlines a comprehensive KPI dashboard which can be used by the organization to measure the automation performance in customer support department. It covers KPIs such as customer retention, costs per support, customer satisfaction, etc. This Introducing AI Tools KPI Metrics Dashboard To Measure Automation Performance Formats PDF is perfect for any presentation, be it in front of clients or colleagues. It is a versatile and stylish solution for organizing your meetings. The Introducing AI Tools KPI Metrics Dashboard To Measure Automation Performance Formats PDF features a modern design for your presentation meetings. The adjustable and customizable slides provide unlimited possibilities for acing up your presentation. Slidegeeks has done all the homework before launching the product for you. So, dont wait, grab the presentation templates today.
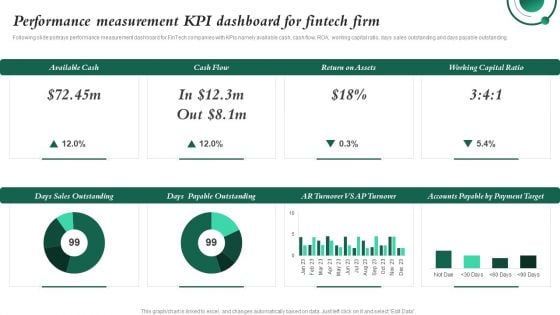
Performance Measurement KPI Dashboard For Fintech Firm Investment In Latest Technology To Ensure Portrait PDF
Following slide portrays performance measurement dashboard for FinTech companies with KPIs namely available cash, cash flow, ROA, working capital ratio, days sales outstanding and days payable outstanding.Whether you have daily or monthly meetings, a brilliant presentation is necessary. Performance Measurement KPI Dashboard For Fintech Firm Investment In Latest Technology To Ensure Portrait PDF can be your best option for delivering a presentation. Represent everything in detail using Performance Measurement KPI Dashboard For Fintech Firm Investment In Latest Technology To Ensure Portrait PDF and make yourself stand out in meetings. The template is versatile and follows a structure that will cater to your requirements. All the templates prepared by Slidegeeks are easy to download and edit. Our research experts have taken care of the corporate themes as well. So, give it a try and see the results.
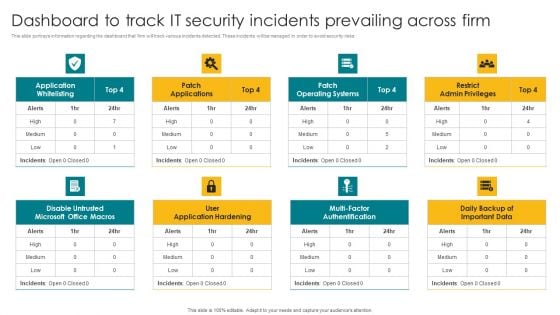
Dashboard To Track IT Security Incidents Prevailing Across Firm Elements PDF
This slide portrays information regarding the dashboard that firm will track various incidents detected. These incidents will be managed in order to avoid security risks. Formulating a presentation can take up a lot of effort and time, so the content and message should always be the primary focus. The visuals of the PowerPoint can enhance the presenters message, so our Dashboard To Track IT Security Incidents Prevailing Across Firm Elements PDF was created to help save time. Instead of worrying about the design, the presenter can concentrate on the message while our designers work on creating the ideal templates for whatever situation is needed. Slidegeeks has experts for everything from amazing designs to valuable content, we have put everything into Dashboard To Track IT Security Incidents Prevailing Across Firm Elements PDF.
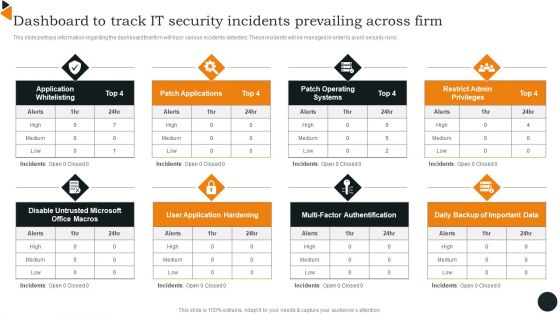
Dashboard To Track IT Security Incidents Prevailing Across Firm Infographics PDF
This slide portrays information regarding the dashboard that firm will track various incidents detected. These incidents will be managed in order to avoid security risks. Crafting an eye catching presentation has never been more straightforward. Let your presentation shine with this tasteful yet straightforward Dashboard To Track IT Security Incidents Prevailing Across Firm Infographics PDF template. It offers a minimalistic and classy look that is great for making a statement. The colors have been employed intelligently to add a bit of playfulness while still remaining professional. Construct the ideal Dashboard To Track IT Security Incidents Prevailing Across Firm Infographics PDF that effortlessly grabs the attention of your audience Begin now and be certain to wow your customers.
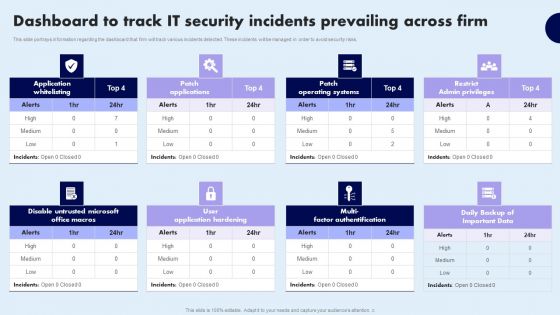
Dashboard To Track IT Security Incidents Prevailing Across Firm Demonstration PDF
This slide portrays information regarding the dashboard that firm will track various incidents detected. These incidents will be managed in order to avoid security risks. Do you have an important presentation coming up Are you looking for something that will make your presentation stand out from the rest Look no further than Dashboard To Track IT Security Incidents Prevailing Across Firm Demonstration PDF. With our professional designs, you can trust that your presentation will pop and make delivering it a smooth process. And with Slidegeeks, you can trust that your presentation will be unique and memorable. So why wait Grab Dashboard To Track IT Security Incidents Prevailing Across Firm Demonstration PDF today and make your presentation stand out from the rest
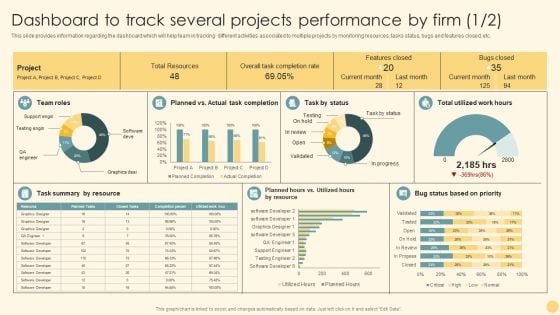
Dashboard To Track Several Projects Performance By Firm Ppt PowerPoint Presentation File Styles PDF
This slide provides information regarding the dashboard which will help team in tracking different activities associated to multiple projects by monitoring resources, tasks status, bugs and features closed, etc. Create an editable Dashboard To Track Several Projects Performance By Firm Ppt PowerPoint Presentation File Styles PDF that communicates your idea and engages your audience. Whether youre presenting a business or an educational presentation, pre designed presentation templates help save time. Dashboard To Track Several Projects Performance By Firm Ppt PowerPoint Presentation File Styles PDF is highly customizable and very easy to edit, covering many different styles from creative to business presentations. Slidegeeks has creative team members who have crafted amazing templates. So, go and get them without any delay.
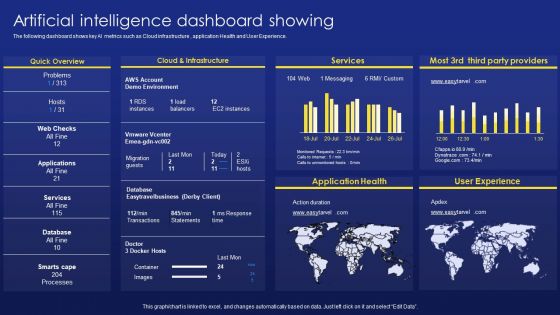
Deployment Procedure Of Hyper Automation Artificial Intelligence Dashboard Showing Pictures PDF
The following dashboard shows key AI metrics such as Cloud infrastructure , application Health and User Experience. Here you can discover an assortment of the finest PowerPoint and Google Slides templates. With these templates, you can create presentations for a variety of purposes while simultaneously providing your audience with an eye catching visual experience. Download Deployment Procedure Of Hyper Automation Artificial Intelligence Dashboard Showing Pictures PDF to deliver an impeccable presentation. These templates will make your job of preparing presentations much quicker, yet still, maintain a high level of quality. Slidegeeks has experienced researchers who prepare these templates and write high quality content for you. Later on, you can personalize the content by editing the Deployment Procedure Of Hyper Automation Artificial Intelligence Dashboard Showing Pictures PDF.
Integrating AI To Enhance Dashboard For Tracking Impact Of Supply Chain Automation Themes PDF
This slide covers the dashboard for back-end tracking of overall impact automation. It include KPIs such as retailer capacity, warehouse capacity, truck efficiency, time to reach warehouse, sustainability, etc. Do you have an important presentation coming up Are you looking for something that will make your presentation stand out from the rest Look no further than Integrating AI To Enhance Dashboard For Tracking Impact Of Supply Chain Automation Themes PDF. With our professional designs, you can trust that your presentation will pop and make delivering it a smooth process. And with Slidegeeks, you can trust that your presentation will be unique and memorable. So why wait Grab Integrating AI To Enhance Dashboard For Tracking Impact Of Supply Chain Automation Themes PDF today and make your presentation stand out from the rest.
Integrating AI To Enhance Dashboard For Tracking Impact Of Transport Automation Template PDF
This slide covers the dashboard for tracking vehicle efficiency after transport automation. It include KPIs such as truck turnaround time, average revenue per hour, truckload capacity, transit time, on-time pickup, and average revenue per mile. Whether you have daily or monthly meetings, a brilliant presentation is necessary. Integrating AI To Enhance Dashboard For Tracking Impact Of Transport Automation Template PDF can be your best option for delivering a presentation. Represent everything in detail using Integrating AI To Enhance Dashboard For Tracking Impact Of Transport Automation Template PDF and make yourself stand out in meetings. The template is versatile and follows a structure that will cater to your requirements. All the templates prepared by Slidegeeks are easy to download and edit. Our research experts have taken care of the corporate themes as well. So, give it a try and see the results.
Integrating AI To Enhance Dashboard For Tracking Impact Of Warehouse House Automation Professional PDF
This slide covers the dashboard with after automation warehouse overview. It include KPIs such as autonomous robots status, robotic arms status, battery level, performance, time to return, etc. Find highly impressive Integrating AI To Enhance Dashboard For Tracking Impact Of Warehouse House Automation Professional PDF on Slidegeeks to deliver a meaningful presentation. You can save an ample amount of time using these presentation templates. No need to worry to prepare everything from scratch because Slidegeeks experts have already done a huge research and work for you. You need to download Integrating AI To Enhance Dashboard For Tracking Impact Of Warehouse House Automation Professional PDF for your upcoming presentation. All the presentation templates are 100 percent editable and you can change the color and personalize the content accordingly. Download now.
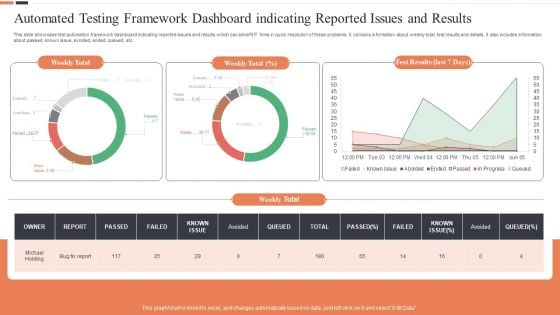
Automated Testing Framework Dashboard Indicating Reported Issues And Results Ideas PDF
This slide showcase test automation framework dashboard indicating reported issues and results which can benefit IT firms in quick resolution of these problems. It contains information about weekly total, test results and details. It also includes information about passed, known issue, avoided, ended, queued, etc. Showcasing this set of slides titled Automated Testing Framework Dashboard Indicating Reported Issues And Results Ideas PDF. The topics addressed in these templates are Weekly Total, Test Results, Last 7 Days. All the content presented in this PPT design is completely editable. Download it and make adjustments in color, background, font etc. as per your unique business setting.
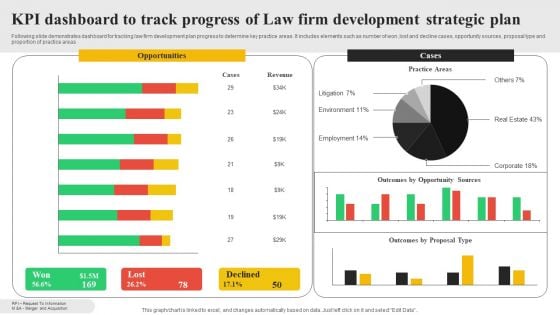
KPI Dashboard To Track Progress Of Law Firm Development Strategic Plan Infographics PDF
Following slide demonstrates dashboard for tracking law firm development plan progress to determine key practice areas. It includes elements such as number of won ,lost and decline cases, opportunity sources, proposal type and proportion of practice areas. Showcasing this set of slides titled KPI Dashboard To Track Progress Of Law Firm Development Strategic Plan Infographics PDF. The topics addressed in these templates are Opportunities, Cases, Practice Areas. All the content presented in this PPT design is completely editable. Download it and make adjustments in color, background, font etc. as per your unique business setting.
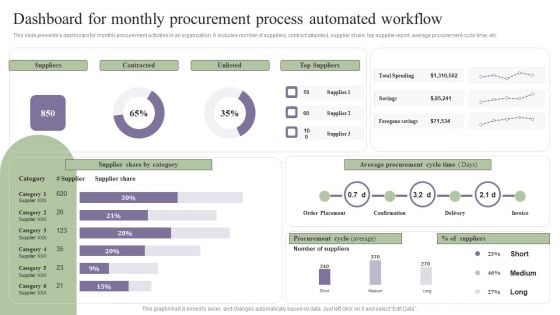
Deployment Of Process Automation To Increase Organisational Performance Dashboard For Monthly Graphics PDF
This slide presents a dashboard for monthly procurement activities in an organization. It includes number of suppliers, contract attainted, supplier share, top supplier report, average procurement cycle time, etc. Here you can discover an assortment of the finest PowerPoint and Google Slides templates. With these templates, you can create presentations for a variety of purposes while simultaneously providing your audience with an eye catching visual experience. Download Deployment Of Process Automation To Increase Organisational Performance Dashboard For Monthly Graphics PDF to deliver an impeccable presentation. These templates will make your job of preparing presentations much quicker, yet still, maintain a high level of quality. Slidegeeks has experienced researchers who prepare these templates and write high quality content for you. Later on, you can personalize the content by editing the Deployment Of Process Automation To Increase Organisational Performance Dashboard For Monthly Graphics PDF.
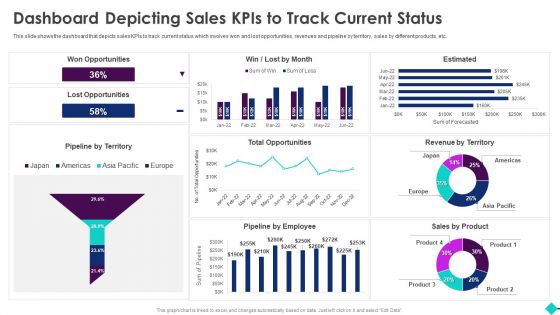
Sales Process Automation For Revenue Growth Dashboard Depicting Sales Kpis To Track Current Status Introduction PDF
This slide shows the dashboard that depicts sales KPIs to track current status which involves won and lost opportunities, revenues and pipeline by territory, sales by different products, etc.Deliver and pitch your topic in the best possible manner with this Sales Process Automation For Revenue Growth Dashboard Depicting Sales Kpis To Track Current Status Introduction PDF. Use them to share invaluable insights on Marketing Effectiveness, Forecast Accuracy, Pipeline Thickness and impress your audience. This template can be altered and modified as per your expectations. So, grab it now.
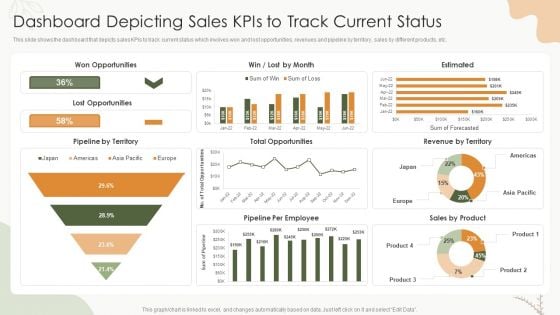
Sales Procedure Automation To Enhance Sales Dashboard Depicting Sales Kpis To Track Current Status Introduction PDF
This slide shows the dashboard that depicts sales KPIs to track current status which involves won and lost opportunities, revenues and pipeline by territory, sales by different products, etc.Deliver an awe inspiring pitch with this creative Sales Procedure Automation To Enhance Sales Dashboard Depicting Sales Kpis To Track Current Status Introduction PDF bundle. Topics like Won Opportunities, Total Opportunities, Pipeline Employee can be discussed with this completely editable template. It is available for immediate download depending on the needs and requirements of the user.
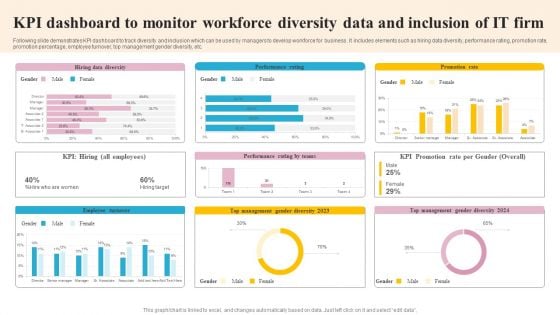
KPI Dashboard To Monitor Workforce Diversity Data And Inclusion Of IT Firm Slides PDF
Following slide demonstrates KPI dashboard to track diversity and inclusion which can be used by managers to develop workforce for business . It includes elements such as hiring data diversity, performance rating, promotion rate, promotion percentage, employee turnover, top management gender diversity, etc. Showcasing this set of slides titled KPI Dashboard To Monitor Workforce Diversity Data And Inclusion Of IT Firm Slides PDF. The topics addressed in these templates are Employee Turnover, Management, Promotion Rate. All the content presented in this PPT design is completely editable. Download it and make adjustments in color, background, font etc. as per your unique business setting.
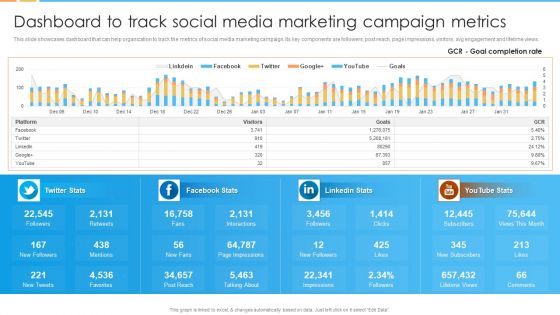
Digital Marketing Guide For B2B Firms Dashboard To Track Social Media Marketing Campaign Metrics Demonstration PDF
This slide showcases dashboard that can help organization to track the metrics of social media marketing campaign. Its key components are followers, post reach, page impressions, visitors, avg engagement and lifetime views.Deliver an awe inspiring pitch with this creative Digital Marketing Guide For B2B Firms Dashboard To Track Social Media Marketing Campaign Metrics Demonstration PDF bundle. Topics like Page Impressions, New Followers, Talking About can be discussed with this completely editable template. It is available for immediate download depending on the needs and requirements of the user.
Food Processing Industry Latest Insights Trends And Analytics Performance Monitoring Dashboard For Consumer Goods Icons PDF
This slide showcase the performance monitoring dashboard for consumer goods providing information regarding the overview of food and beverages sales, top selling products and on shelf availability. Get a simple yet stunning designed Food Processing Industry Latest Insights Trends And Analytics Performance Monitoring Dashboard For Consumer Goods Icons PDF. It is the best one to establish the tone in your meetings. It is an excellent way to make your presentations highly effective. So, download this PPT today from Slidegeeks and see the positive impacts. Our easy to edit Food Processing Industry Latest Insights Trends And Analytics Performance Monitoring Dashboard For Consumer Goods Icons PDF can be your go to option for all upcoming conferences and meetings. So, what are you waiting for Grab this template today.
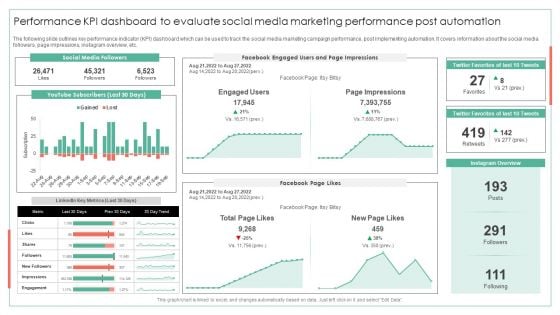
Performance KPI Dashboard To Evaluate Social Media Marketing Performance Post Automation Ideas PDF
The following slide outlines key performance indicator KPI dashboard which can be used to track the social media marketing campaign performance, post implementing automation. It covers information about the social media followers, page impressions, instagram overview, etc.Deliver an awe inspiring pitch with this creative Performance KPI Dashboard To Evaluate Social Media Marketing Performance Post Automation Ideas PDF bundle. Topics like Page Impressions, Twitter Favorites, Instagram Overview can be discussed with this completely editable template. It is available for immediate download depending on the needs and requirements of the user.
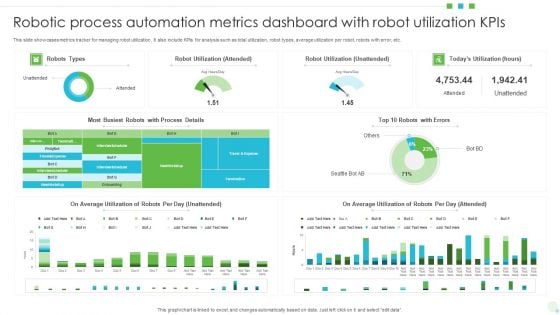
Robotic Process Automation Metrics Dashboard With Robot Utilization Kpis Background PDF
This slide showcases metrics tracker for managing robot utilization. It also include KPIs for analysis such as total utilization, robot types, average utilization per robot, robots with error, etc. Pitch your topic with ease and precision using this Robotic Process Automation Metrics Dashboard With Robot Utilization Kpis Background PDF. This layout presents information on Average Utilization, Robot Utilization, Automation Metrics Dashboard. It is also available for immediate download and adjustment. So, changes can be made in the color, design, graphics or any other component to create a unique layout.
Robotic Process Automation Metrics Dashboard For Tracking Business Return On Investment Information PDF
This slide illustrates KPI Dashboard for measuring time and money saved after RPA deployment. It also include metrics for analysis such as productivity in robot hours, hours saved per process, money saved per process, etc. Pitch your topic with ease and precision using this Robotic Process Automation Metrics Dashboard For Tracking Business Return On Investment Information PDF. This layout presents information on Management, Goal, Productivity. It is also available for immediate download and adjustment. So, changes can be made in the color, design, graphics or any other component to create a unique layout.
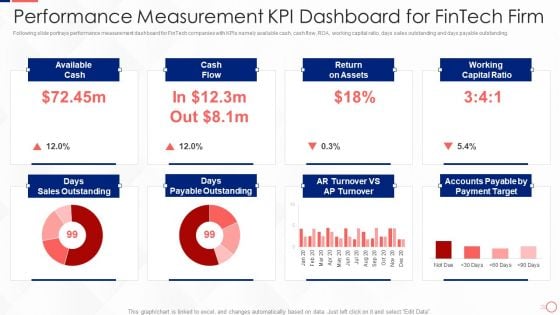
Investing In Tech Innovation Performance Measurement Kpi Dashboard For Fintech Firm Mockup PDF
Following slide portrays performance measurement dashboard for FinTech companies with KPIs namely available cash, cash flow, ROA, working capital ratio, days sales outstanding and days payable outstanding. Deliver and pitch your topic in the best possible manner with this Investing In Tech Innovation Performance Measurement Kpi Dashboard For Fintech Firm Mockup PDF. Use them to share invaluable insights on Available Cash, Cash Flow, Return on Assets, Working Capital Ratio and impress your audience. This template can be altered and modified as per your expectations. So, grab it now.
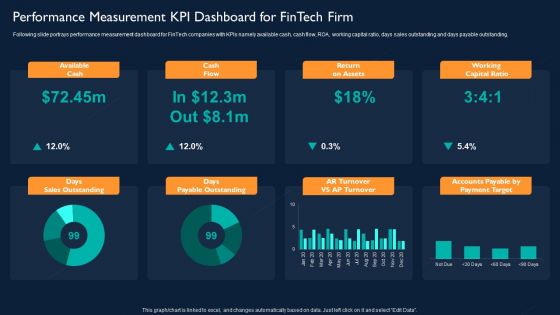
Technology Investment To Enhance Business Growth Performance Measurement KPI Dashboard For Fintech Firm Slides PDF
Following slide portrays performance measurement dashboard for FinTech companies with KPIs namely available cash, cash flow, ROA, working capital ratio, days sales outstanding and days payable outstanding. Deliver an awe inspiring pitch with this creative Technology Investment To Enhance Business Growth Performance Measurement KPI Dashboard For Fintech Firm Slides PDF bundle. Topics like Available Cash, Cash Flow, Return On Assets, Working Capital Ratio can be discussed with this completely editable template. It is available for immediate download depending on the needs and requirements of the user.
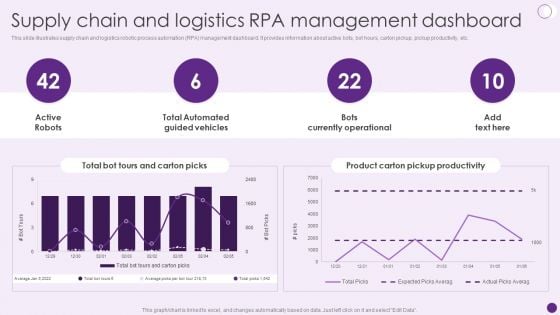
Supply Chain And Logistics Rpa Management Dashboard Deploying Automation To Enhance Diagrams PDF
This slide illustrates supply chain and logistics robotic process automation RPA management dashboard. It provides information about active bots, bot hours, carton pickup, pickup productivity, etc. Boost your pitch with our creative Supply Chain And Logistics Rpa Management Dashboard Deploying Automation To Enhance Diagrams PDF. Deliver an awe-inspiring pitch that will mesmerize everyone. Using these presentation templates you will surely catch everyones attention. You can browse the ppts collection on our website. We have researchers who are experts at creating the right content for the templates. So you do not have to invest time in any additional work. Just grab the template now and use them.
Warehouse Automation Deployment Dashboard For Tracking Impact Of Warehouse House Infographics PDF
This slide covers the dashboard with after automation warehouse overview. It include KPIs such as autonomous robots status, robotic arms status, battery level, performance, time to return, etc. Deliver and pitch your topic in the best possible manner with this Warehouse Automation Deployment Dashboard For Tracking Impact Of Warehouse House Infographics PDF. Use them to share invaluable insights on Autonomous Robot, Systems Engineer, Warehouse Manager and impress your audience. This template can be altered and modified as per your expectations. So, grab it now.


 Continue with Email

 Home
Home


