Dashboards Manufacturing
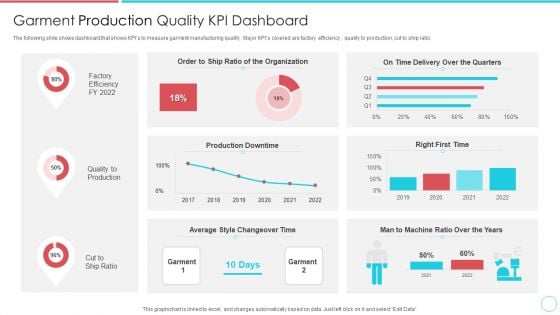
Garment Production Quality KPI Dashboard Portrait PDF
The following slide shows dashboard that shows KPIs to measure garment manufacturing quality . Major KPIs covered are factory efficiency , quality to production, cut to ship ratio.Pitch your topic with ease and precision using this Garment Production Quality KPI Dashboard Portrait PDF This layout presents information on Production Downtime, Time Delivery Over The Quarters, Average Style Changeover Time It is also available for immediate download and adjustment. So, changes can be made in the color, design, graphics or any other component to create a unique layout.
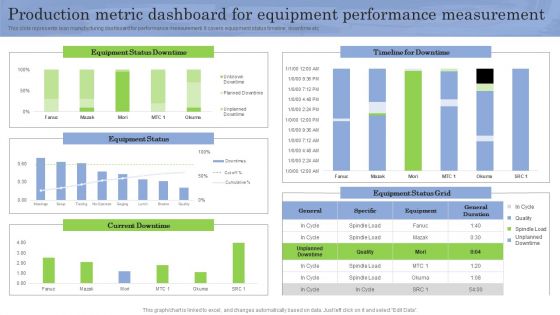
Production Metric Dashboard For Equipment Performance Measurement Slides PDF
This slide represents lean manufacturing dashboard for performance measurement. It covers equipment status timeline, downtime etc Want to ace your presentation in front of a live audience Our Production Metric Dashboard For Equipment Performance Measurement Slides PDF can help you do that by engaging all the users towards you. Slidegeeks experts have put their efforts and expertise into creating these impeccable powerpoint presentations so that you can communicate your ideas clearly. Moreover, all the templates are customizable, and easy to edit and downloadable. Use these for both personal and commercial use.
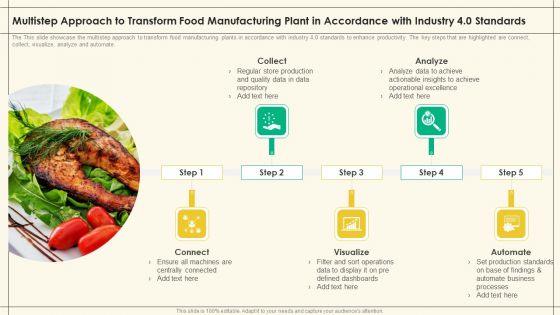
Multistep Approach Transform Food Manufacturing Plant Accordance Industry 4 0 Standards Precooked Food Industry Analysis Infographics PDF
The This slide showcase the multistep approach to transform food manufacturing plants in accordance with industry 4.0 standards to enhance productivity. The key steps that are highlighted are connect, collect, visualize, analyze and automate.Presenting Multistep Approach Transform Food Manufacturing Plant Accordance Industry 4 0 Standards Precooked Food Industry Analysis Infographics PDF to provide visual cues and insights. Share and navigate important information on five stages that need your due attention. This template can be used to pitch topics like Ensure Machines, Centrally Connected, Defined Dashboards. In addtion, this PPT design contains high resolution images, graphics, etc, that are easily editable and available for immediate download.
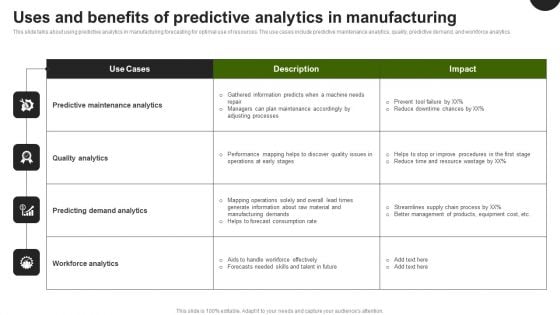
Predictive Analytics In The Age Of Big Data Uses And Benefits Predictive Analytics In Manufacturing Slides PDF
This slide talks about using predictive analytics in manufacturing forecasting for optimal use of resources. The use cases include predictive maintenance analytics, quality, predictive demand, and workforce analytics. From laying roadmaps to briefing everything in detail, our templates are perfect for you. You can set the stage with your presentation slides. All you have to do is download these easy to edit and customizable templates. Predictive Analytics In The Age Of Big Data Uses And Benefits Predictive Analytics In Manufacturing Slides PDF will help you deliver an outstanding performance that everyone would remember and praise you for. Do download this presentation today.
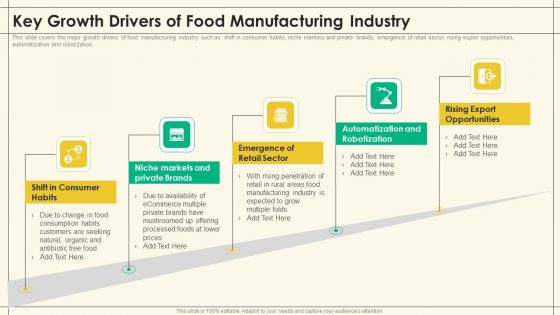
Precooked Food Industry Analysis Key Growth Drivers Of Food Manufacturing Industry Precooked Food Industry Analysis Portrait PDF
This slide covers the major growth drivers of food manufacturing industry such as shift in consumer habits, niche markets and private brands, emergence of retail sector, rising export opportunities, automatization and robotization.Presenting Precooked Food Industry Analysis Key Growth Drivers Of Food Manufacturing Industry Precooked Food Industry Analysis Portrait PDF to provide visual cues and insights. Share and navigate important information on five stages that need your due attention. This template can be used to pitch topics like Inventory Constraints, Logistic Issues, Veganism Trend. In addtion, this PPT design contains high resolution images, graphics, etc, that are easily editable and available for immediate download.
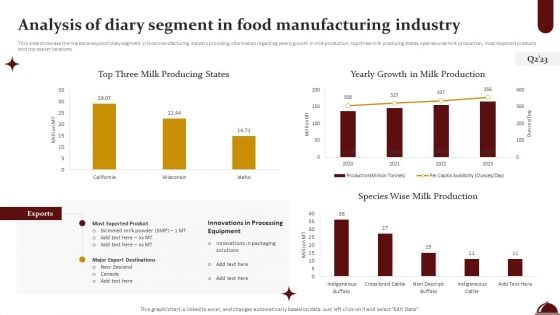
Food Processing Industry Latest Insights Trends And Analytics Analysis Of Diary Segment In Food Manufacturing Industry Mockup PDF
This slide showcase the market analysis of diary segment in food manufacturing industry providing information regarding yearly growth in milk production, top three milk producing states, species wise milk production, most exported products and top export locations. This Food Processing Industry Latest Insights Trends And Analytics Analysis Of Diary Segment In Food Manufacturing Industry Mockup PDF from Slidegeeks makes it easy to present information on your topic with precision. It provides customization options, so you can make changes to the colors, design, graphics, or any other component to create a unique layout. It is also available for immediate download, so you can begin using it right away. Slidegeeks has done good research to ensure that you have everything you need to make your presentation stand out. Make a name out there for a brilliant performance.
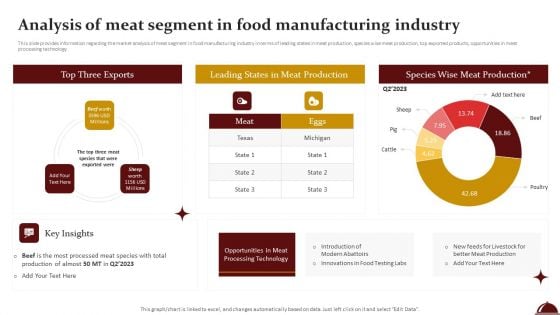
Food Processing Industry Latest Insights Trends And Analytics Analysis Of Meat Segment In Food Manufacturing Industry Inspiration PDF
This slide provides information regarding the market analysis of meat segment in food manufacturing industry in terms of leading states in meat production, species wise meat production, top exported products, opportunities in meat processing technology. Take your projects to the next level with our ultimate collection of Food Processing Industry Latest Insights Trends And Analytics Analysis Of Meat Segment In Food Manufacturing Industry Inspiration PDF. Slidegeeks has designed a range of layouts that are perfect for representing task or activity duration, keeping track of all your deadlines at a glance. Tailor these designs to your exact needs and give them a truly corporate look with your own brand colors they will make your projects stand out from the rest.
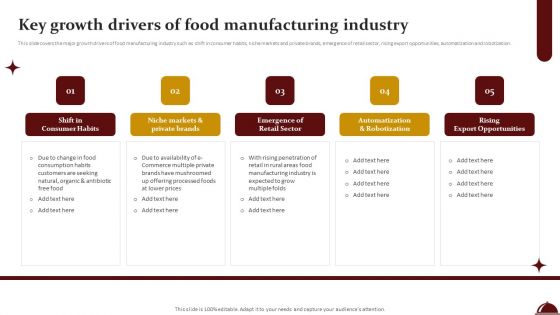
Food Processing Industry Latest Insights Trends And Analytics Key Growth Drivers Of Food Manufacturing Industry Slides PDF
This slide covers the major growth drivers of food manufacturing industry such as shift in consumer habits, niche markets and private brands, emergence of retail sector, rising export opportunities, automatization and robotization. Are you in need of a template that can accommodate all of your creative concepts This one is crafted professionally and can be altered to fit any style. Use it with Google Slides or PowerPoint. Include striking photographs, symbols, depictions, and other visuals. Fill, move around, or remove text boxes as desired. Test out color palettes and font mixtures. Edit and save your work, or work with colleagues. Download Food Processing Industry Latest Insights Trends And Analytics Key Growth Drivers Of Food Manufacturing Industry Slides PDF and observe how to make your presentation outstanding. Give an impeccable presentation to your group and make your presentation unforgettable.
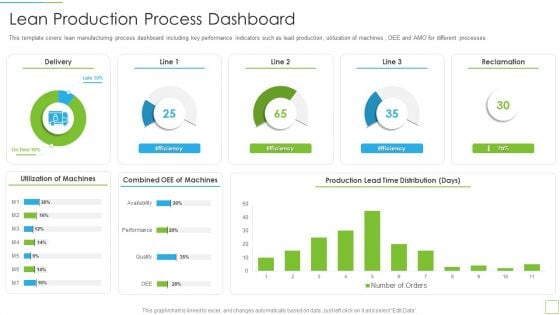
Hoshin Kanri Pitch Deck Lean Production Process Dashboard Guidelines PDF
This template covers lean manufacturing process dashboard including key performance indicators such as lead production, utilization of machines , OEE and AMO for different processes Deliver and pitch your topic in the best possible manner with this hoshin kanri pitch deck lean production process dashboard guidelines pdf Use them to share invaluable insights on utilization of machines, combined oee of machines, production lead time distribution and impress your audience. This template can be altered and modified as per your expectations. So, grab it now.
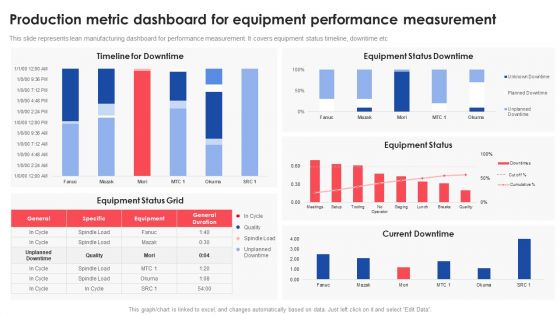
Production Metric Dashboard For Equipment Performance Measurement Deploying And Managing Lean Portrait PDF
This slide represents lean manufacturing dashboard for performance measurement. It covers equipment status timeline, downtime etcDeliver and pitch your topic in the best possible manner with this Production Metric Dashboard For Equipment Performance Measurement Deploying And Managing Lean Portrait PDF. Use them to share invaluable insights on Timeline Downtime, Equipment, Current Downtime and impress your audience. This template can be altered and modified as per your expectations. So, grab it now.
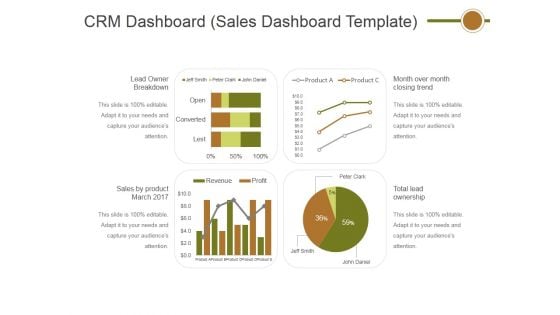
Crm Dashboard Sales Dashboard Template Ppt PowerPoint Presentation Professional Layout
This is a crm dashboard sales dashboard template ppt powerpoint presentation professional layout. This is a four stage process. The stages in this process are lead owner breakdown, sales by product march 2017, total lead ownership, month over month closing trend.
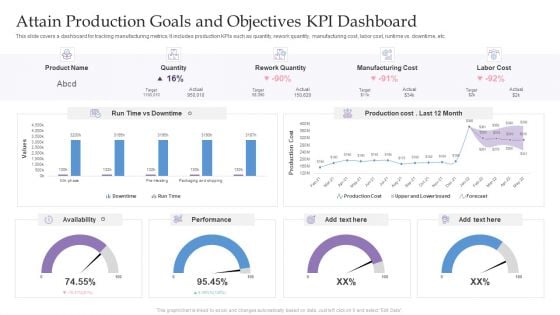
Attain Production Goals And Objectives KPI Dashboard Ppt Pictures Graphics PDF
This slide covers a dashboard for tracking manufacturing metrics. It includes production KPIs such as quantity, rework quantity, manufacturing cost, labor cost, runtime vs. downtime, etc. Showcasing this set of slides titled Attain Production Goals And Objectives KPI Dashboard Ppt Pictures Graphics PDF. The topics addressed in these templates are Product Name, Quantity, Rework Quantity, Manufacturing Cost. All the content presented in this PPT design is completely editable. Download it and make adjustments in color, background, font etc. as per your unique business setting.
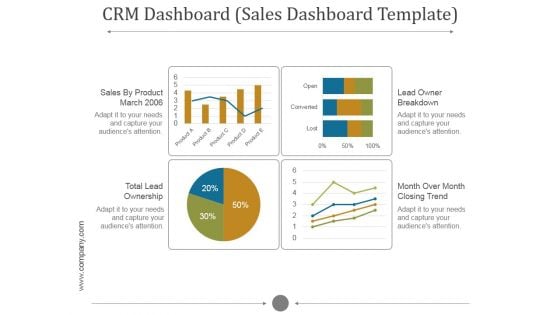
Crm Dashboard Sales Dashboard Template Ppt PowerPoint Presentation Inspiration
This is a crm dashboard sales dashboard template ppt powerpoint presentation inspiration. This is a five stage process. The stages in this process are sales by product march, lead owner breakdown, total lead ownership, month over month closing trend.
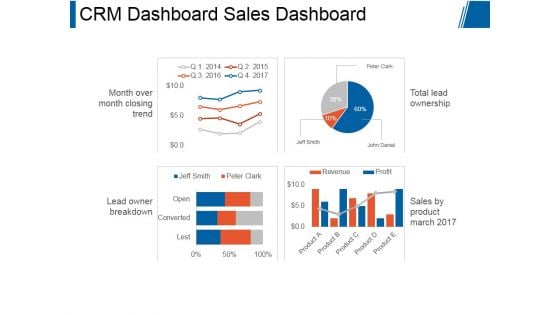
Crm Dashboard Sales Dashboard Ppt PowerPoint Presentation Themes
This is a crm dashboard sales dashboard ppt powerpoint presentation themes. This is a four stage process. The stages in this process are month over month closing trend, lead owner breakdown, total lead ownership, sales by product march 2017.
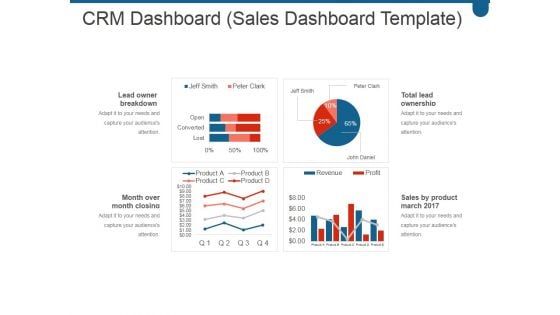
Crm Dashboard Sales Dashboard Template Ppt PowerPoint Presentation Microsoft
This is a crm dashboard sales dashboard template ppt powerpoint presentation microsoft. This is a four stage process. The stages in this process are lead owner breakdown, month over month closing trend, total lead ownership, sales by product march 2017.
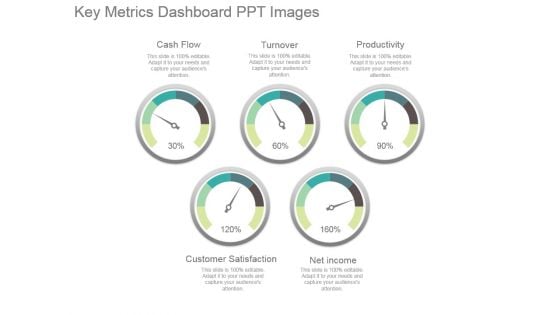
Key Metrics Dashboard Ppt Images
This is a key metrics dashboard ppt images. This is a five stage process. The stages in this process are cash flow, turnover, productivity, net income, customer satisfaction.

Retail Expenditure Dashboard And Performance Dashboard Formats PDF
This slide enables to track quarterly performance and return on marketing expenditure of online marketing executed by an organization. It includes source wise performance report , return on investment, sales funnel, average order value report etc. Pitch your topic with ease and precision using this Retail Expenditure Dashboard And Performance Dashboard Formats PDF. This layout presents information on Return On Investment, Product Sales, Revenue. It is also available for immediate download and adjustment. So, changes can be made in the color, design, graphics or any other component to create a unique layout.
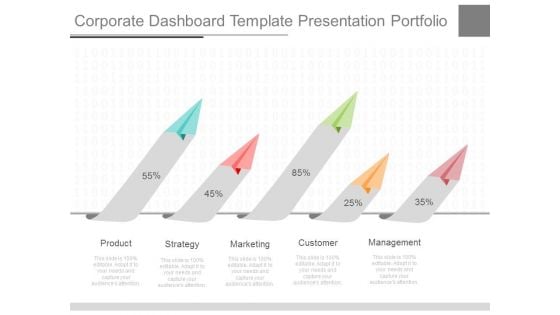
Corporate Dashboard Template Presentation Portfolio
This is a corporate dashboard template presentation portfolio. This is a five stage process. The stages in this process are product, strategy, marketing, customer, management.
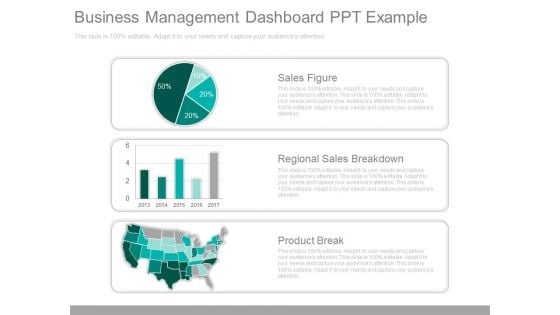
Business Management Dashboard Ppt Example
This is a business management dashboard ppt example. This is a three stage process. The stages in this process are sales figure, regional sales breakdown, product break.
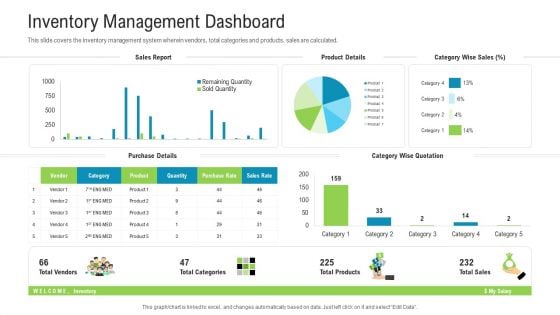
Inventory Management Dashboard Brochure PDF
Deliver and pitch your topic in the best possible manner with this inventory management dashboard brochure pdf. Use them to share invaluable insights on purchase details, category wise quotation, product details and impress your audience. This template can be altered and modified as per your expectations. So, grab it now.
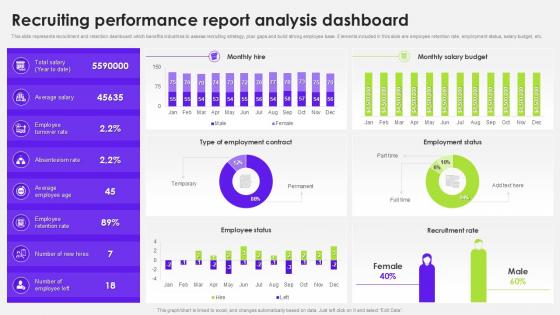
Recruiting Performance Report Analysis Dashboard
Welcome to our selection of the Recruiting Performance Report Analysis Dashboard. These are designed to help you showcase your creativity and bring your sphere to life. Planning and Innovation are essential for any business that is just starting out. This collection contains the designs that you need for your everyday presentations. All of our PowerPoints are 100Percent editable, so you can customize them to suit your needs. This multi-purpose template can be used in various situations. Grab these presentation templates today. This slide illustrates a recruitment and retention dashboard, which benefits industries by allowing them to assess recruiting strategy, plan gaps, and build a strong employee base. It includes employee retention rate, employment status, salary budget, etc.
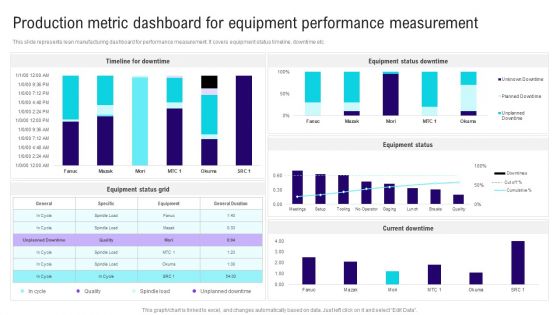
Implementing Lean Production Tool And Techniques Production Metric Dashboard For Equipment Performance Mockup PDF
This slide represents lean manufacturing dashboard for performance measurement. It covers equipment status timeline, downtime etc The Implementing Lean Production Tool And Techniques Production Metric Dashboard For Equipment Performance Mockup PDF is a compilation of the most recent design trends as a series of slides. It is suitable for any subject or industry presentation, containing attractive visuals and photo spots for businesses to clearly express their messages. This template contains a variety of slides for the user to input data, such as structures to contrast two elements, bullet points, and slides for written information. Slidegeeks is prepared to create an impression.
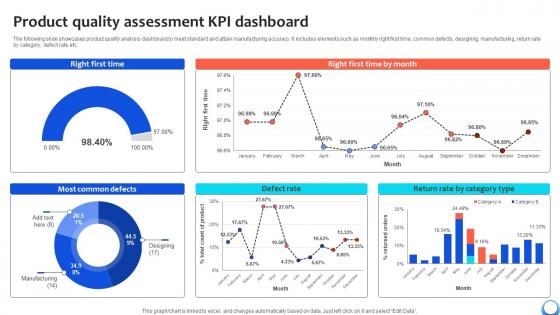
Product Quality Assessment KPI Dashboard Automating Production Process Strategy SS V
The following slide showcases product quality analysis dashboard to meet standard and attain manufacturing accuracy. It includes elements such as monthly right first time, common defects, designing, manufacturing, return rate by category, defect rate etc. Take your projects to the next level with our ultimate collection of Product Quality Assessment KPI Dashboard Automating Production Process Strategy SS V. Slidegeeks has designed a range of layouts that are perfect for representing task or activity duration, keeping track of all your deadlines at a glance. Tailor these designs to your exact needs and give them a truly corporate look with your own brand colors they will make your projects stand out from the rest The following slide showcases product quality analysis dashboard to meet standard and attain manufacturing accuracy. It includes elements such as monthly right first time, common defects, designing, manufacturing, return rate by category, defect rate etc.
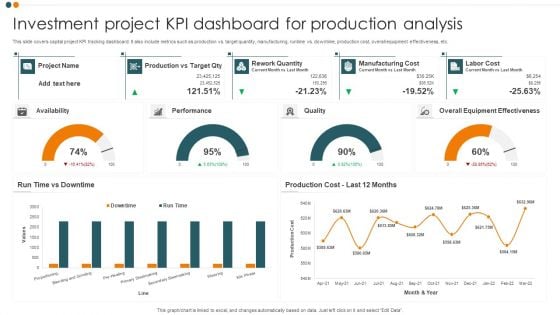
Investment Project KPI Dashboard For Production Analysis Ideas PDF
This slide covers capital project KPI tracking dashboard. It also include metrics such as production vs. target quantity, manufacturing, runtime vs. downtime, production cost, overall equipment effectiveness, etc. Showcasing this set of slides titled Investment Project KPI Dashboard For Production Analysis Ideas PDF. The topics addressed in these templates are Project, Performance, Quality, Overall Equipment Effectiveness. All the content presented in this PPT design is completely editable. Download it and make adjustments in color, background, font etc. as per your unique business setting.
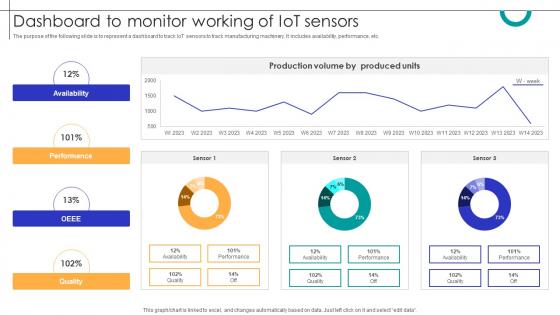
Dashboard To Monitor Working Of IOT Sensors Streamlining Production Ppt Powerpoint
The purpose of the following slide is to represent a dashboard to track IoT sensors to track manufacturing machinery. It includes availability, performance, etc. Coming up with a presentation necessitates that the majority of the effort goes into the content and the message you intend to convey. The visuals of a PowerPoint presentation can only be effective if it supplements and supports the story that is being told. Keeping this in mind our experts created Dashboard To Monitor Working Of IOT Sensors Streamlining Production Ppt Powerpoint to reduce the time that goes into designing the presentation. This way, you can concentrate on the message while our designers take care of providing you with the right template for the situation. The purpose of the following slide is to represent a dashboard to track IoT sensors to track manufacturing machinery. It includes availability, performance, etc.
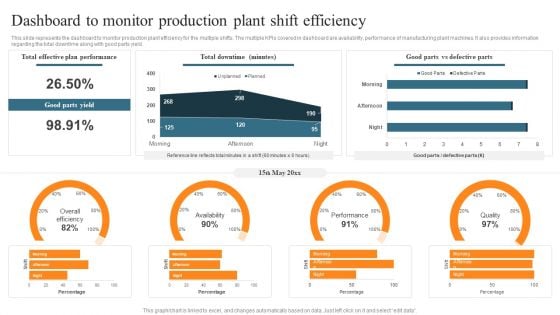
Leveraging Predictive Maintenance To Enhance Production Process Dashboard To Monitor Production Plant Shift Efficiency Structure PDF
This slide represents the dashboard to monitor production plant efficiency for the multiple shifts. The multiple KPIs covered in dashboard are availability, performance of manufacturing plant machines. It also provides information regarding the total downtime along with good parts yield. There are so many reasons you need a Leveraging Predictive Maintenance To Enhance Production Process Dashboard To Monitor Production Plant Shift Efficiency Structure PDF. The first reason is you cant spend time making everything from scratch, Thus, Slidegeeks has made presentation templates for you too. You can easily download these templates from our website easily.
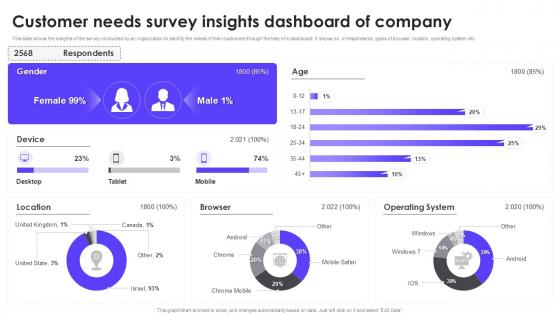
Customer Needs Survey Insights Dashboard Of Company
This Customer Needs Survey Insights Dashboard Of Company is perfect for any presentation, be it in front of clients or colleagues. It is a versatile and stylish solution for organizing your meetings. The Customer Needs Survey Insights Dashboard Of Company features a modern design for your presentation meetings. The adjustable and customizable slides provide unlimited possibilities for acing up your presentation. Slidegeeks has done all the homework before launching the product for you. So, do not wait, grab the presentation templates today This slide showcases insights from survey conducted by the organization to understand customer needs. The dashboard showcases key data, including the number of respondents, browser types, location, operating system, and other valuable factors to guide customer-focused decisions.
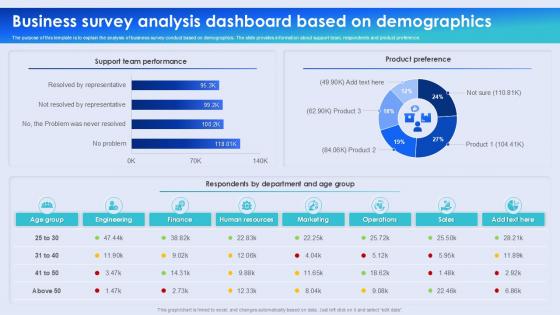
Business Survey Analysis Dashboard Based On Demographics
Slidegeeks is one of the best resources for PowerPoint templates. You can download easily and regulate Business Survey Analysis Dashboard Based On Demographics for your personal presentations from our wonderful collection. A few clicks is all it takes to discover and get the most relevant and appropriate templates. Use our Templates to add a unique zing and appeal to your presentation and meetings. All the slides are easy to edit and you can use them even for advertisement purposes. This template focus to explain the analysis of a business survey, focusing on demographics. The slide provides insights into the support team, survey respondents, and their product preferences, assisting to understand customer needs and improve business strategies.
Sustainable Green Cloud Computing Performance Tracking Dashboard
This slide depicts the performance tracking dashboard for green cloud computing. This slide aims to showcase the performance tracking report of green cloud computing by covering parameters such as Power Use Effectiveness PUE, high-density zone, history, consumption, and Average Propensity to Consume APC consumption. The Sustainable Green Cloud Computing Performance Tracking Dashboard is a compilation of the most recent design trends as a series of slides. It is suitable for any subject or industry presentation, containing attractive visuals and photo spots for businesses to clearly express their messages. This template contains a variety of slides for the user to input data, such as structures to contrast two elements, bullet points, and slides for written information. Slidegeeks is prepared to create an impression. This slide depicts the performance tracking dashboard for green cloud computing. This slide aims to showcase the performance tracking report of green cloud computing by covering parameters such as Power Use Effectiveness PUE, high-density zone, history, consumption, and Average Propensity to Consume APC consumption.
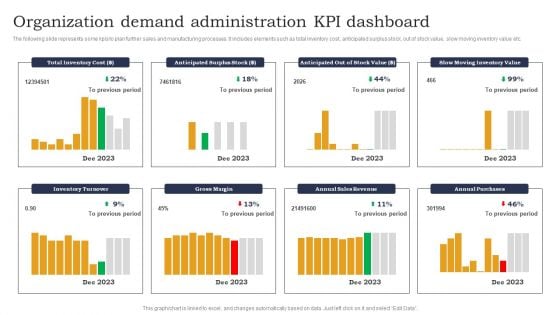
Organization Demand Administration KPI Dashboard Designs PDF
The following slide represents some kpis to plan further sales and manufacturing processes. It includes elements such as total inventory cost, anticipated surplus stock, out of stock value, slow moving inventory value etc. Pitch your topic with ease and precision using this Organization Demand Administration KPI Dashboard Designs PDF. This layout presents information on Anticipated Surplus Stock, Out Of Stock, Slow Moving Inventory. It is also available for immediate download and adjustment. So, changes can be made in the color, design, graphics or any other component to create a unique layout.
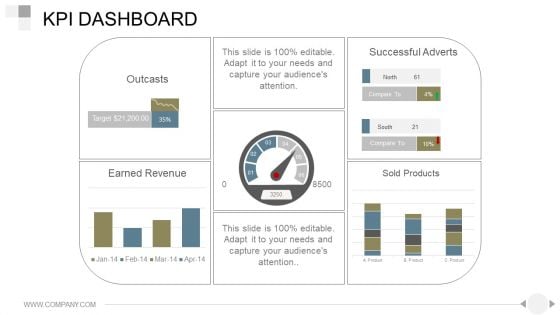
Kpi Dashboard Ppt PowerPoint Presentation Good
This is a kpi dashboard ppt powerpoint presentation good. This is a one stage process. The stages in this process are outcasts, earned revenue, successful adverts, sold products.
Dashboard Ppt PowerPoint Presentation Background Images
This is a dashboard ppt powerpoint presentation background images. This is a four stage process. The stages in this process are business, marketing, management, dashboard, analysis.
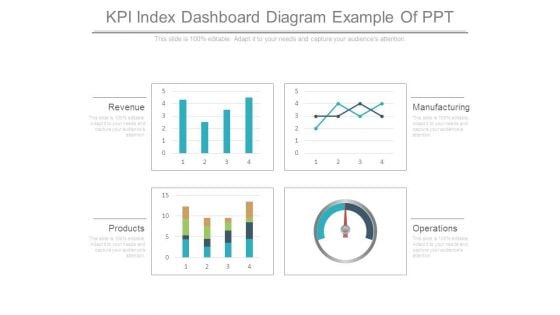
Kpi Index Dashboard Diagram Example Of Ppt
This is a kpi index dashboard diagram example of ppt. This is a four stage process. The stages in this process are revenue, products, operations, manufacturing.
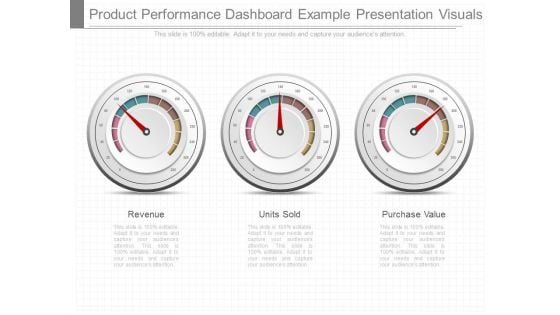
Product Performance Dashboard Example Presentation Visuals
This is a product performance dashboard example presentation visuals. This is a three stage process. The stages in this process are revenue, units sold, purchase value.

Enterprise Dashboard Ppt Presentation Powerpoint Example
This is a enterprise dashboard ppt presentation powerpoint example. This is a three stage process. The stages in this process are balance scorecard, enterprise performance, industry trends.

Finance Benchmarking Index Dashboard Example Of Ppt
This is a finance benchmarking index dashboard example of ppt. This is a six stage process. The stages in this process are industry, company, government, litigation, economics, credit.

Revenue Kpi Dashboard Ppt Infographic Template
This is a revenue kpi dashboard ppt infographic template. This is a five stage process. The stages in this process are outcasts, successful adverts, earned revenue, sold products, operations.
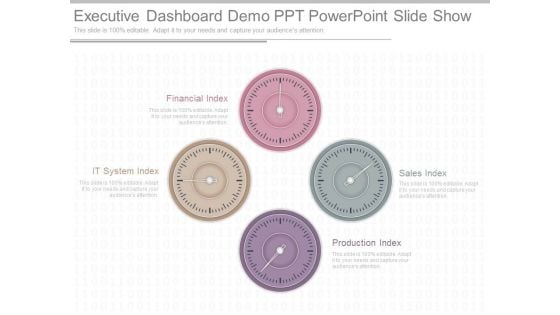
Executive Dashboard Demo Ppt Powerpoint Slide Show
This is a executive dashboard demo ppt powerpoint slide show. This is a four stage process. The stages in this process are financial index, it system index, production index, sales index.
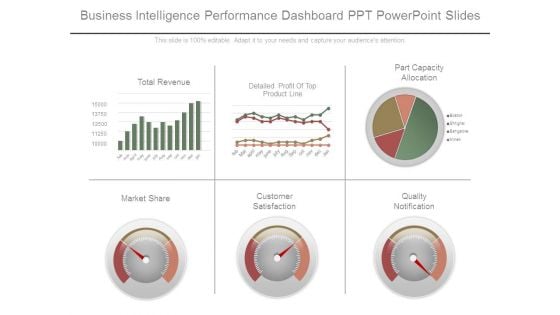
Business Intelligence Performance Dashboard Ppt Powerpoint Slides
This is a business intelligence performance dashboard ppt powerpoint slides. This is a six stage process. The stages in this process are total revenue, detailed profit of top product line, part capacity allocation, market share, customer satisfaction, quality notification.
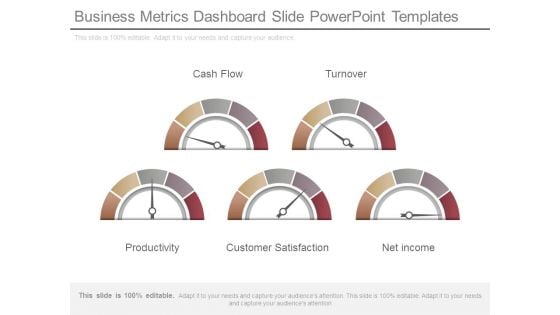
Business Metrics Dashboard Slide Powerpoint Templates
This is a business metrics dashboard slide powerpoint templates. This is a five stage process. The stages in this process are cash flow, turnover, productivity, customer satisfaction, net income.
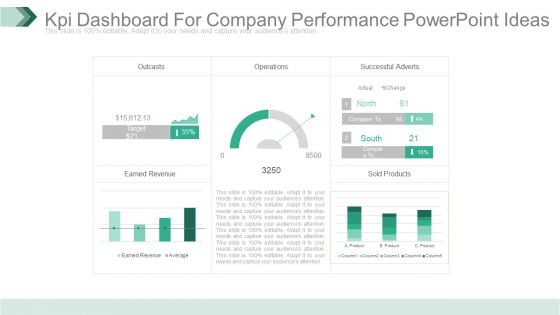
Kpi Dashboard For Company Performance Powerpoint Ideas
This is a kpi dashboard for company performance powerpoint ideas. This is a five stage process. The stages in this process are outcasts, operations, successful adverts, earned revenue, sold products.
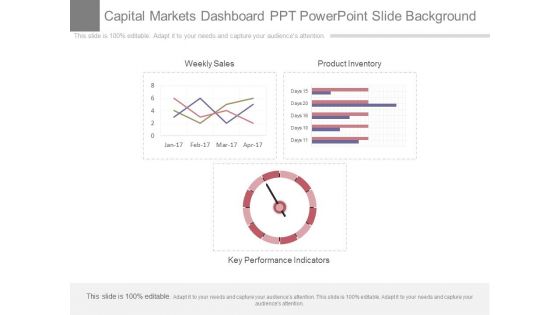
Capital Markets Dashboard Ppt Powerpoint Slide Background
This is a capital markets dashboard ppt powerpoint slide background. This is a three stage process. The stages in this process are weekly sales, product inventory, key performance indicators.
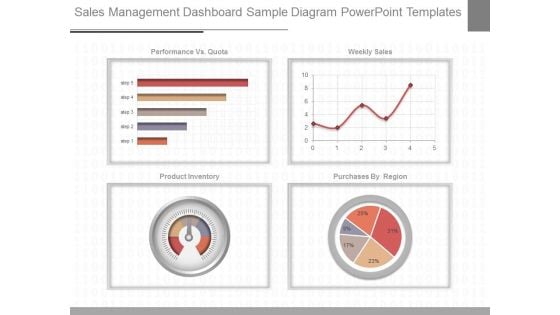
Sales Management Dashboard Sample Diagram Powerpoint Templates
This is a sales management dashboard sample diagram powerpoint templates. This is a four stage process. The stages in this process are performance vs quota, weekly sales, product inventory, purchases by region, step.
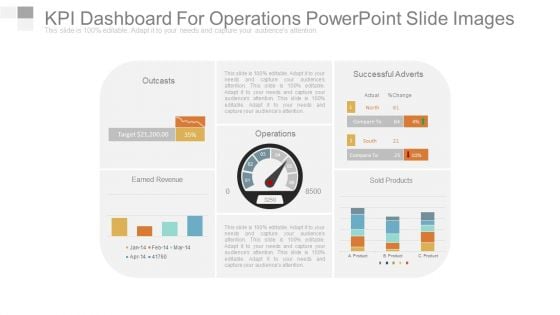
Kpi Dashboard For Operations Powerpoint Slide Images
This is a kpi dashboard for operations powerpoint slide images. This is a four stage process. The stages in this process are outcasts, earned revenue, operations, successful adverts, sold products.
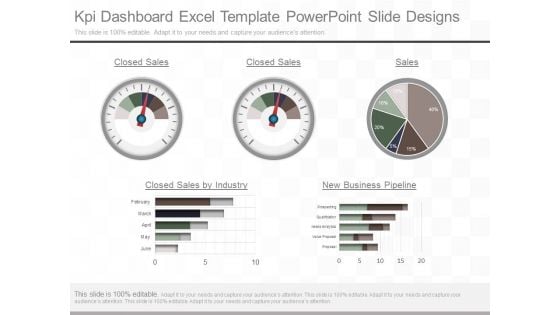
Kpi Dashboard Excel Template Powerpoint Slide Designs
This is a kpi dashboard excel template powerpoint slide designs. This is a five stage process. The stages in this process are closed sales, closed sales, sales, closed sales by industry, new business pipeline, february, march april, may, june, prospecting, qualification, needs analytics, value proposal, proposal.
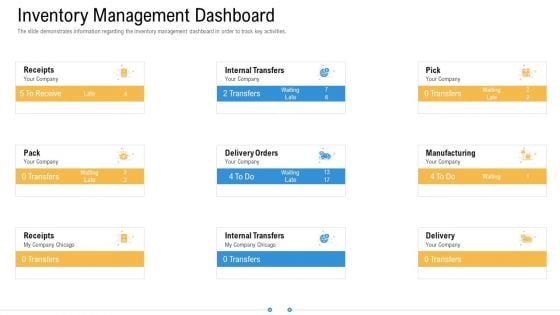
Storage Logistics Inventory Management Dashboard Infographics PDF
The slide demonstrates information regarding the inventory management dashboard in order to track key activities. Presenting storage logistics inventory management dashboard infographics pdf to provide visual cues and insights. Share and navigate important information on nine stages that need your due attention. This template can be used to pitch topics like manufacturing, internal transfers, internal transfers, delivery orders. In addtion, this PPT design contains high resolution images, graphics, etc, that are easily editable and available for immediate download.

WMS Implementation Inventory Management Dashboard Download PDF
The slide demonstrates information regarding the inventory management dashboard in order to track key activities. This is a wms implementation inventory management dashboard download pdf template with various stages. Focus and dispense information on wms implementation inventory management dashboard download pdf stages using this creative set, that comes with editable features. It contains large content boxes to add your information on topics like internal transfers, manufacturing, internal transfers. You can also showcase facts, figures, and other relevant content using this PPT layout. Grab it now.
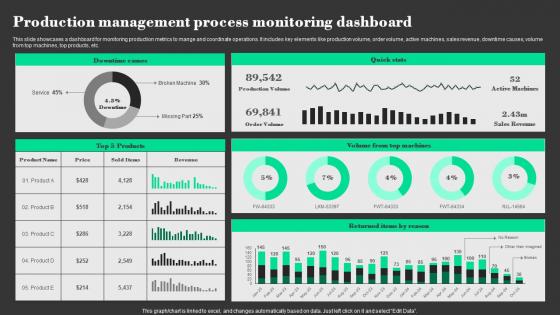
Production Management Process Monitoring Dashboard Designs Pdf
This slide showcases a dashboard for monitoring production metrics to mange and coordinate operations. It includes key elements like production volume, order volume, active machines, sales revenue, downtime causes, volume from top machines, top products, etc. Showcasing this set of slides titled Production Management Process Monitoring Dashboard Designs Pdf The topics addressed in these templates are Downtime Causes, Products, Volume From Top Machines All the content presented in this PPT design is completely editable. Download it and make adjustments in color, background, font etc. as per your unique business setting. This slide showcases a dashboard for monitoring production metrics to mange and coordinate operations. It includes key elements like production volume, order volume, active machines, sales revenue, downtime causes, volume from top machines, top products, etc.
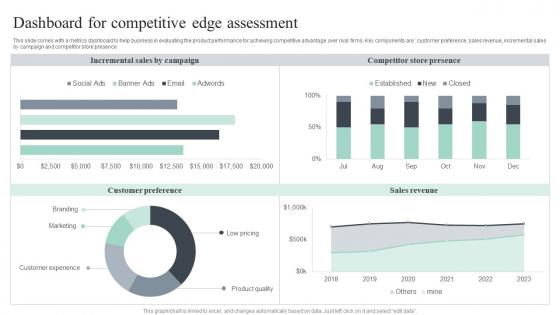
Dashboard For Competitive Edge Assessment Themes Pdf
This slide comes with a metrics dashboard to help business in evaluating the product performance for achieving competitive advantage over rival firms. Key components are customer preference, sales revenue, incremental sales by campaign and competitor store presence Pitch your topic with ease and precision using this Dashboard For Competitive Edge Assessment Themes Pdf. This layout presents information on Incremental Sales, Competitor Store Presence, Sales Revenue. It is also available for immediate download and adjustment. So, changes can be made in the color, design, graphics or any other component to create a unique layout. This slide comes with a metrics dashboard to help business in evaluating the product performance for achieving competitive advantage over rival firms. Key components are customer preference, sales revenue, incremental sales by campaign and competitor store presence
Sales Performance Evaluation Summary Dashboard Icons Pdf
This slide showcase Product sales performance summary dashboard to measure insights to ensure product success in marketplace. It includes elements such as total revenue, product sold, store orders, online orders, sales distribution etc.Showcasing this set of slides titled Sales Performance Evaluation Summary Dashboard Icons Pdf The topics addressed in these templates are Sales Distribution, Inventory Turnover Ratio, Order Comparison All the content presented in this PPT design is completely editable. Download it and make adjustments in color, background, font etc. as per your unique business setting. This slide showcase Product sales performance summary dashboard to measure insights to ensure product success in marketplace. It includes elements such as total revenue, product sold, store orders, online orders, sales distribution etc.
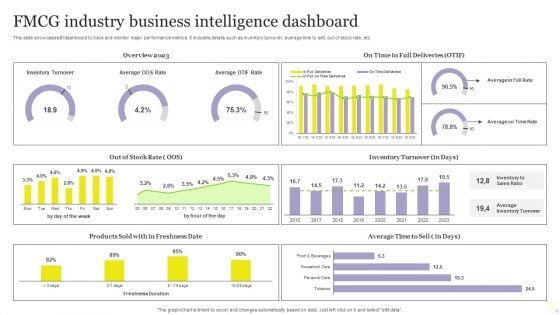
FMCG Industry Business Intelligence Dashboard Mockup PDF
This slide showcases BI dashboard to track and monitor major performance metrics. It includes details such as inventory turnover, average time to sell, out of stock rate, etc. Pitch your topic with ease and precision using this FMCG Industry Business Intelligence Dashboard Mockup PDF. This layout presents information on Average, Inventory Turnover, Business Intelligence Dashboard. It is also available for immediate download and adjustment. So, changes can be made in the color, design, graphics or any other component to create a unique layout.
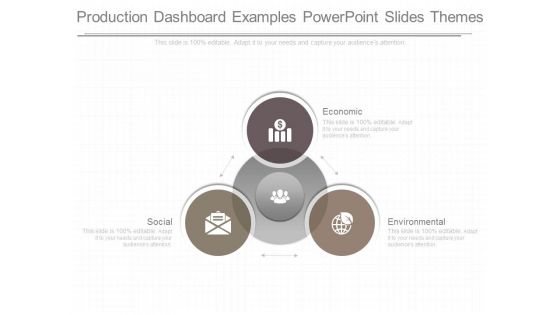
Production Dashboard Examples Powerpoint Slides Themes
This is a production dashboard examples powerpoint slides themes. This is a three stage process. The stages in this process are economic, social, environmental.
Financial Performance Tracking Dashboard Themes PDF
This slide presents the dashboard which will help firm in tracking the fiscal performance. This dashboard displays revenues and expenses trends and payment received analysis. There are so many reasons you need a Financial Performance Tracking Dashboard Themes PDF. The first reason is you can not spend time making everything from scratch, Thus, Slidegeeks has made presentation templates for you too. You can easily download these templates from our website easily.
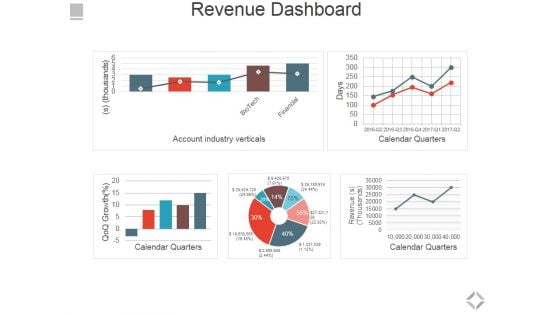
Revenue Dashboard Ppt PowerPoint Presentation Summary Brochure
This is a revenue dashboard ppt powerpoint presentation summary brochure. This is a five stage process. The stages in this process are account industry verticals, calendar quarters.
Client Support Performance Tracking Dashboard Template PDF
This slide shows KPI dashboard which can be used by organizations to track customer service delivery dashboard. It includes customer satisfaction score, total cases received, cases responses, etc. Showcasing this set of slides titled Client Support Performance Tracking Dashboard Template PDF. The topics addressed in these templates are Customer Satisfaction Score, Average, Cases By Product. All the content presented in this PPT design is completely editable. Download it and make adjustments in color, background, font etc. as per your unique business setting.
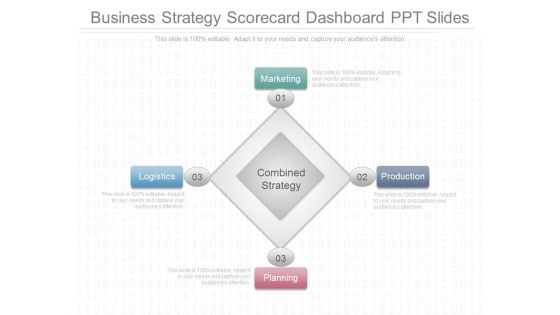
Business Strategy Scorecard Dashboard Ppt Slides
This is a business strategy scorecard dashboard ppt slides. This is a five stage process. The stages in this process are marketing, logistics, production, planning, combined strategy.
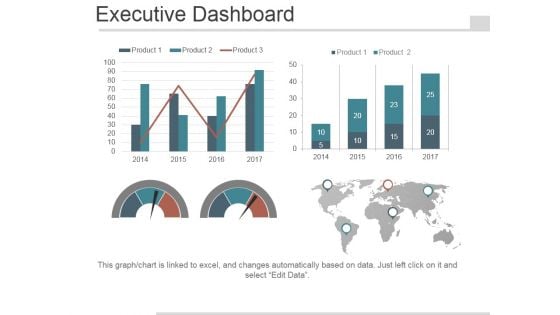
Executive Dashboard Ppt PowerPoint Presentation Visuals
This is a executive dashboard ppt powerpoint presentation visuals. This is a four stage process. The stages in this process are product, finance, management, arrows.
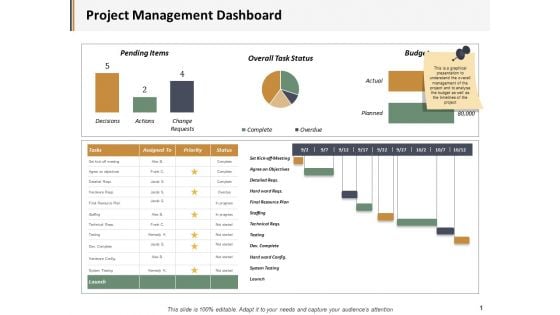
Project Management Dashboard Ppt PowerPoint Presentation Deck
This is a project management dashboard ppt powerpoint presentation deck. This is a five stage process. The stages in this process are business, management, marketing, percentage, product.
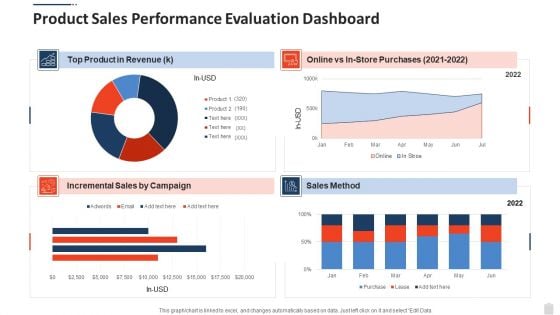
Product Sales Performance Evaluation Dashboard Graphics PDF
Pitch your topic with ease and precision using this product sales performance evaluation dashboard graphics pdf. This layout presents information on product sales performance evaluation dashboard. It is also available for immediate download and adjustment. So, changes can be made in the color, design, graphics or any other component to create a unique layout.
Monthly Production Report Dashboard Icon Background PDF
Persuade your audience using this Monthly Production Report Dashboard Icon Background PDF. This PPT design covers three stages, thus making it a great tool to use. It also caters to a variety of topics including Monthly Production, Report Dashboard Icon. Download this PPT design now to present a convincing pitch that not only emphasizes the topic but also showcases your presentation skills.


 Continue with Email

 Home
Home


