Dashboards Monitoring System
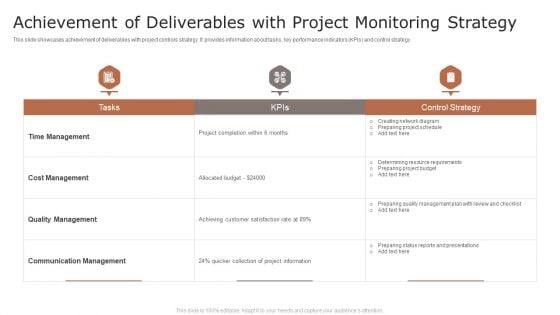
Achievement Of Deliverables With Project Monitoring Strategy Ppt Summary Outfit PDF
This slide showcases achievement of deliverables with project controls strategy. It provides information about tasks, key performance indicators KPIs and control strategy. Showcasing this set of slides titled Achievement Of Deliverables With Project Monitoring Strategy Ppt Summary Outfit PDF. The topics addressed in these templates are Time Management, Cost Management, Quality Management. All the content presented in this PPT design is completely editable. Download it and make adjustments in color, background, font etc. as per your unique business setting.
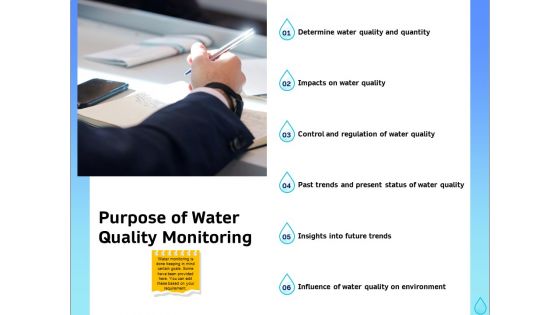
Integrated Water Resource Management Purpose Of Water Quality Monitoring Designs PDF
Presenting this set of slides with name integrated water resource management purpose of water quality monitoring designs pdf. This is a six stage process. The stages in this process are determine water quality and quantity, impacts water quality, control and regulation water quality, past trends and present status water quality, insights future trends, influence water quality environment. This is a completely editable PowerPoint presentation and is available for immediate download. Download now and impress your audience.
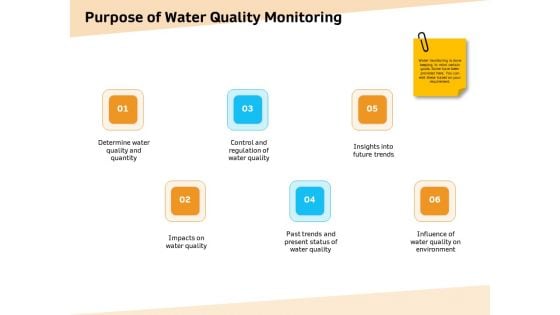
Optimization Of Water Usage Purpose Of Water Quality Monitoring Ppt Professional Graphics Pictures PDF
Presenting this set of slides with name optimization of water usage purpose of water quality monitoring ppt professional graphics pictures pdf. This is a six stage process. The stages in this process are determine water quality and quantity, impacts water quality, control and regulation water quality, past trends and present status water quality, insights future trends, influence water quality environment. This is a completely editable PowerPoint presentation and is available for immediate download. Download now and impress your audience.
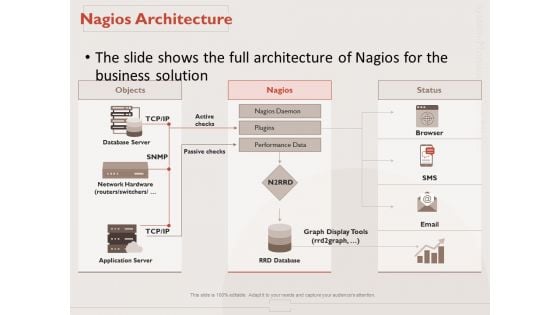
Monitoring Computer Software Application Nagios Architecture Ppt PowerPoint Presentation Ideas Infographic Template PDF
Presenting this set of slides with name monitoring computer software application nagios architecture ppt powerpoint presentation ideas infographic template pdf. This is a one stage process. The stages in this process are objects, nagios, status, database server, switch router, application server, passive checks, rrd database, performance data, plugins nagios. This is a completely editable PowerPoint presentation and is available for immediate download. Download now and impress your audience.
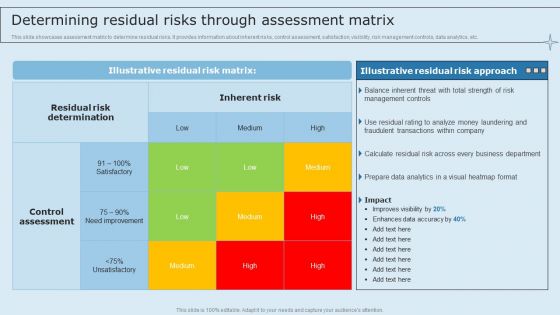
Actual Time Transaction Monitoring Software And Strategies Determining Residual Risks Through Assessment Portrait PDF
This slide showcases assessment matrix to determine residual risks. It provides information about inherent risks, control assessment, satisfaction, visibility, risk management controls, data analytics, etc. Do you have an important presentation coming up Are you looking for something that will make your presentation stand out from the rest Look no further than Actual Time Transaction Monitoring Software And Strategies Determining Residual Risks Through Assessment Portrait PDF. With our professional designs, you can trust that your presentation will pop and make delivering it a smooth process. And with Slidegeeks, you can trust that your presentation will be unique and memorable. So why wait Grab Actual Time Transaction Monitoring Software And Strategies Determining Residual Risks Through Assessment Portrait PDF today and make your presentation stand out from the rest.
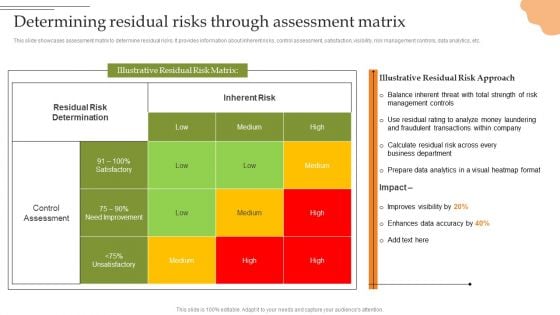
Creating Transaction Monitoring Determining Residual Risks Through Assessment Matrix Demonstration PDF
This slide showcases assessment matrix to determine residual risks. It provides information about inherent risks, control assessment, satisfaction, visibility, risk management controls, data analytics, etc. Whether you have daily or monthly meetings, a brilliant presentation is necessary. Creating Transaction Monitoring Determining Residual Risks Through Assessment Matrix Demonstration PDF can be your best option for delivering a presentation. Represent everything in detail using Creating Transaction Monitoring Determining Residual Risks Through Assessment Matrix Demonstration PDF and make yourself stand out in meetings. The template is versatile and follows a structure that will cater to your requirements. All the templates prepared by Slidegeeks are easy to download and edit. Our research experts have taken care of the corporate themes as well. So, give it a try and see the results.
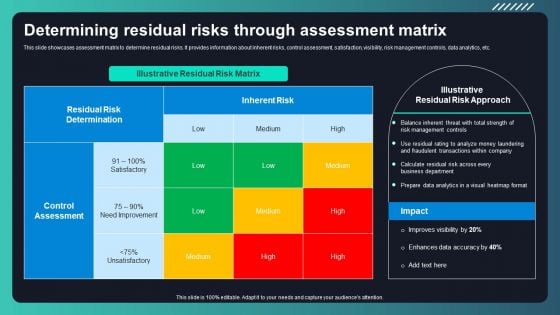
Deploying AML Transaction Monitoring Determining Residual Risks Through Assessment Matrix Background PDF
This slide showcases assessment matrix to determine residual risks. It provides information about inherent risks, control assessment, satisfaction, visibility, risk management controls, data analytics, etc. Find highly impressive Deploying AML Transaction Monitoring Determining Residual Risks Through Assessment Matrix Background PDF on Slidegeeks to deliver a meaningful presentation. You can save an ample amount of time using these presentation templates. No need to worry to prepare everything from scratch because Slidegeeks experts have already done a huge research and work for you. You need to download Deploying AML Transaction Monitoring Determining Residual Risks Through Assessment Matrix Background PDF for your upcoming presentation. All the presentation templates are 100 percent editable and you can change the color and personalize the content accordingly. Download now.
Situation Monitoring With Process Concerns Ppt PowerPoint Presentation Icon Slides PDF
Presenting this set of slides with name situation monitoring with process concerns ppt powerpoint presentation icon slides pdf. This is a four stage process. The stages in this process are data collection perception, comprehension recognition, anticipate projection, decide process concerns, recognize symptoms, if untreated process resulting shock act. This is a completely editable PowerPoint presentation and is available for immediate download. Download now and impress your audience.
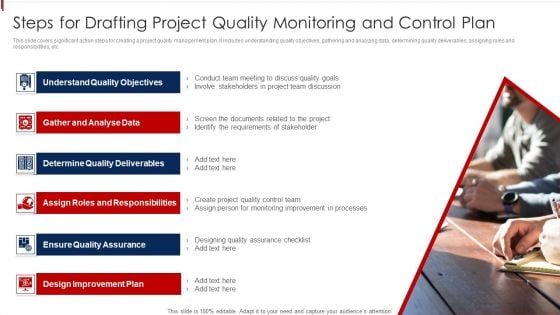
Steps For Drafting Project Quality Monitoring And Control Plan Graphics PDF
This slide covers significant action steps for creating a project quality management plan. It includes understanding quality objectives, gathering and analyzing data, determining quality deliverables, assigning roles and responsibilities, etc. Presenting Steps For Drafting Project Quality Monitoring And Control Plan Graphics PDF to dispense important information. This template comprises six stages. It also presents valuable insights into the topics including Determine Quality Deliverables, Ensure Quality Assurance, Design Improvement Plan. This is a completely customizable PowerPoint theme that can be put to use immediately. So, download it and address the topic impactfully.
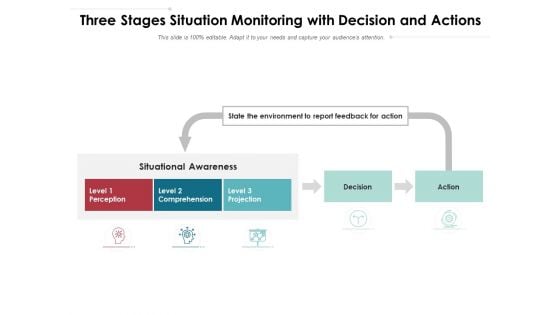
Three Stages Situation Monitoring With Decision And Actions Ppt PowerPoint Presentation Summary Shapes PDF
Presenting this set of slides with name three stages situation monitoring with decision and actions ppt powerpoint presentation summary shapes pdf. This is a three stage process. The stages in this process are perception, comprehension, projection, decision, action, state the environment to report feedback for action, situational awareness. This is a completely editable PowerPoint presentation and is available for immediate download. Download now and impress your audience.
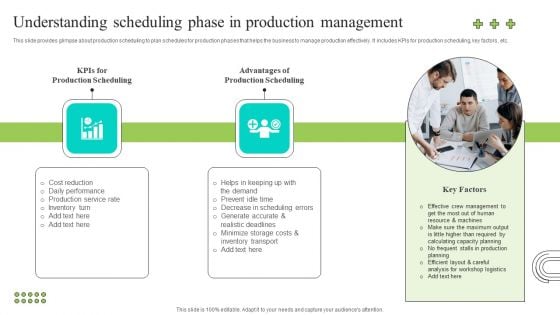
Effective Production Planning And Monitoring Techniques Understanding Scheduling Phase In Production Themes PDF
This slide provides glimpse about production scheduling to plan schedules for production phases that helps the business to manage production effectively. It includes KPIs for production scheduling, key factors, etc. Do you have an important presentation coming up Are you looking for something that will make your presentation stand out from the rest Look no further than Effective Production Planning And Monitoring Techniques Understanding Scheduling Phase In Production Themes PDF. With our professional designs, you can trust that your presentation will pop and make delivering it a smooth process. And with Slidegeeks, you can trust that your presentation will be unique and memorable. So why wait Grab Effective Production Planning And Monitoring Techniques Understanding Scheduling Phase In Production Themes PDF today and make your presentation stand out from the rest.
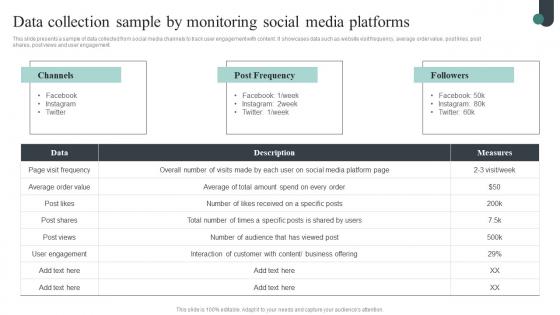
Competitive Intelligence Guide To Determine Market Data Collection Sample By Monitoring Portrait Pdf
This slide presents a sample of data collected from social media channels to track user engagement with content. It showcases data such as website visit frequency, average order value, post likes, post shares, post views and user engagement. Get a simple yet stunning designed Competitive Intelligence Guide To Determine Market Data Collection Sample By Monitoring Portrait Pdf. It is the best one to establish the tone in your meetings. It is an excellent way to make your presentations highly effective. So, download this PPT today from Slidegeeks and see the positive impacts. Our easy-to-edit Competitive Intelligence Guide To Determine Market Data Collection Sample By Monitoring Portrait Pdf can be your go-to option for all upcoming conferences and meetings. So, what are you waiting for Grab this template today. This slide presents a sample of data collected from social media channels to track user engagement with content. It showcases data such as website visit frequency, average order value, post likes, post shares, post views and user engagement.

Project Benchmarking Process Social Media Campaign Performance Monitoring CRP DK SS V
This slide showcases assessment of social media marketing cameoing performance based on KPIs such as cost per impression, purchases, URL clicks etc. There are so many reasons you need a Project Benchmarking Process Social Media Campaign Performance Monitoring CRP DK SS V. The first reason is you can not spend time making everything from scratch, Thus, Slidegeeks has made presentation templates for you too. You can easily download these templates from our website easily. This slide showcases assessment of social media marketing cameoing performance based on KPIs such as cost per impression, purchases, URL clicks etc.
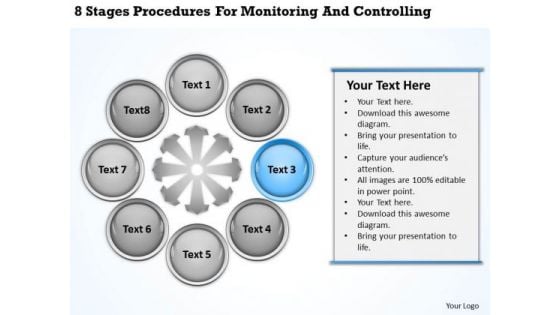
Business Process Flowchart Procedures For Monitoring And Controlling Ppt PowerPoint Templates
We present our business process flowchart procedures for monitoring and controlling ppt PowerPoint templates.Download and present our Industrial PowerPoint Templates because You can Connect the dots. Fan expectations as the whole picture emerges. Download our Arrows PowerPoint Templates because Timeline crunches are a fact of life. Meet all deadlines using our PowerPoint Templates and Slides. Download and present our Signs PowerPoint Templates because You have gained great respect for your brilliant ideas. Use our PowerPoint Templates and Slides to strengthen and enhance your reputation. Download and present our Shapes PowerPoint Templates because Our PowerPoint Templates and Slides are effectively colour coded to prioritise your plans They automatically highlight the sequence of events you desire. Download and present our Process and Flows PowerPoint Templates because You have gained great respect for your brilliant ideas. Use our PowerPoint Templates and Slides to strengthen and enhance your reputation.Use these PowerPoint slides for presentations relating to 3d, abstract, arrow, art, background, blank, business, chart, circle, concept, connection, cycle, development, diagram, direction, element, environment, exchange, finance, financial, flow, graph, graphic, graphic presentation, group, icon, illustration, investment, isolated, isometric, market, motion, movement, organization, passive income, perspective, presentation, process, process chart, recycle, report, ring, sign, step, stock, success, symbol, teamwork, text. The prominent colors used in the PowerPoint template are Blue, Gray, White. Design goals with our Business Process Flowchart Procedures For Monitoring And Controlling Ppt PowerPoint Templates. Download without worries with our money back guaranteee.
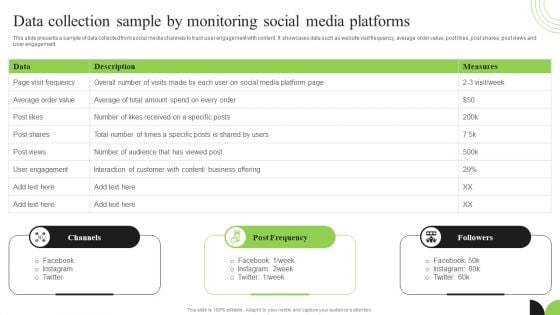
Guidebook For Executing Business Market Intelligence Data Collection Sample By Monitoring Formats PDF
This slide presents a sample of data collected from social media channels to track user engagement with content. It showcases data such as website visit frequency, average order value, post likes, post shares, post views and user engagement. Coming up with a presentation necessitates that the majority of the effort goes into the content and the message you intend to convey. The visuals of a PowerPoint presentation can only be effective if it supplements and supports the story that is being told. Keeping this in mind our experts created Guidebook For Executing Business Market Intelligence Data Collection Sample By Monitoring Formats PDF to reduce the time that goes into designing the presentation. This way, you can concentrate on the message while our designers take care of providing you with the right template for the situation.
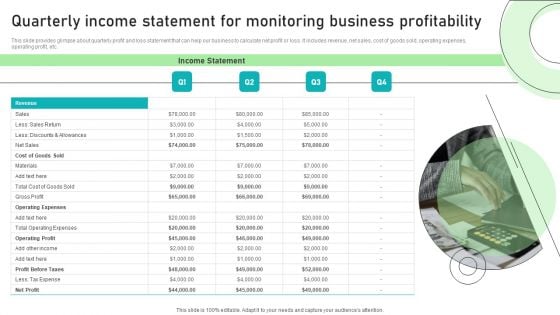
Adjusting Financial Strategies And Planning Quarterly Income Statement For Monitoring Business Profitability Infographics PDF
This slide provides glimpse about quarterly profit and loss statement that can help our business to calculate net profit or loss. It includes revenue, net sales, cost of goods sold, operating expenses, operating profit, etc. The Adjusting Financial Strategies And Planning Quarterly Income Statement For Monitoring Business Profitability Infographics PDF is a compilation of the most recent design trends as a series of slides. It is suitable for any subject or industry presentation, containing attractive visuals and photo spots for businesses to clearly express their messages. This template contains a variety of slides for the user to input data, such as structures to contrast two elements, bullet points, and slides for written information. Slidegeeks is prepared to create an impression.
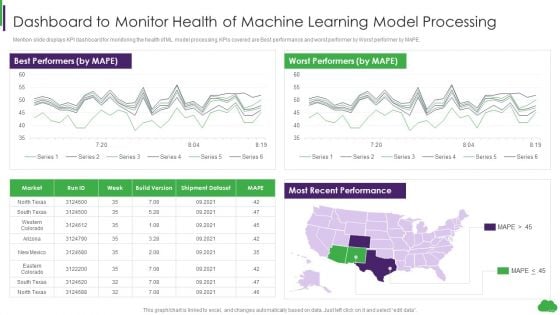
Using Ml And Devops In Product Development Process Dashboard To Monitor Health Of Machine Learning Themes PDF
Mention slide displays KPI dashboard for monitoring the health of ML model processing. KPIs covered are Best performance and worst performer by Worst performer by MAPE. Deliver and pitch your topic in the best possible manner with this Using Ml And Devops In Product Development Process Dashboard To Monitor Health Of Machine Learning Themes PDF. Use them to share invaluable insights on Learning Model Processing, Monitor Health , Dashboard and impress your audience. This template can be altered and modified as per your expectations. So, grab it now.
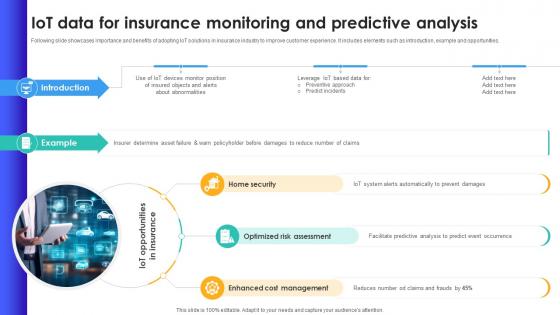
IoT Data For Insurance Monitoring And Predictive Analysis IoT In Banking For Digital Future IoT SS V
Following slide showcases importance and benefits of adopting IoT solutions in insurance industry to improve customer experience. It includes elements such as introduction, example and opportunities. Whether you have daily or monthly meetings, a brilliant presentation is necessary. IoT Data For Insurance Monitoring And Predictive Analysis IoT In Banking For Digital Future IoT SS V can be your best option for delivering a presentation. Represent everything in detail using IoT Data For Insurance Monitoring And Predictive Analysis IoT In Banking For Digital Future IoT SS V and make yourself stand out in meetings. The template is versatile and follows a structure that will cater to your requirements. All the templates prepared by Slidegeeks are easy to download and edit. Our research experts have taken care of the corporate themes as well. So, give it a try and see the results. Following slide showcases importance and benefits of adopting IoT solutions in insurance industry to improve customer experience. It includes elements such as introduction, example and opportunities.
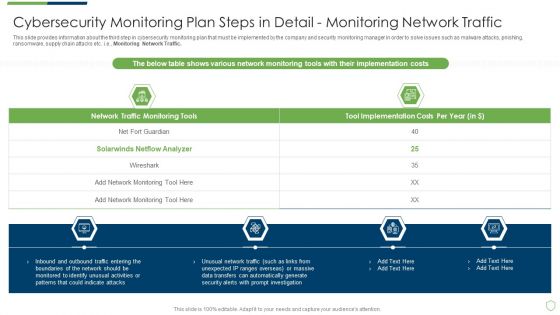
Modern Security Observation Plan To Eradicate Cybersecurity Risk And Data Breach Cybersecurity Monitoring Plan Steps Elements PDF
This slide provides information about the ninth step in cybersecurity monitoring plan that must be implemented by the company and security monitoring manager in order to solve issues such as malware attacks, pnishing, ransomware, supply chain attacks etc. i.e. Review and Risk Analysis. Deliver and pitch your topic in the best possible manner with this modern security observation plan to eradicate cybersecurity risk and data breach cybersecurity monitoring plan steps elements pdf. Use them to share invaluable insights on cybersecurity monitoring plan steps in detail review and risk analysis and impress your audience. This template can be altered and modified as per your expectations. So, grab it now.
Types Of Monitoring Tools With Remote Sensing And Location Tracking Ppt PowerPoint Presentation Gallery Background Images PDF
Presenting this set of slides with name types of monitoring tools with remote sensing and location tracking ppt powerpoint presentation gallery background images pdf. This is a five stage process. The stages in this process are mobile phones, digital data entry, remote sensing. This is a completely editable PowerPoint presentation and is available for immediate download. Download now and impress your audience.
CRM System Implementation Stages CRM Dashboard For Tracking Contract Rate Demonstration PDF
This slide covers the KPI dashboard for monitoring the sales teams performance through CRM software. It includes metrics such as outbound calls, demos, contracts closed, average contract value, etc. Deliver an awe inspiring pitch with this creative CRM System Implementation Stages CRM Dashboard For Tracking Contract Rate Demonstration PDF bundle. Topics like Outbound Calls, Contractvalue, Outbound Calls can be discussed with this completely editable template. It is available for immediate download depending on the needs and requirements of the user.
CRM System Deployment Plan CRM Dashboard For Tracking Contract Rate Introduction PDF
This slide covers the KPI dashboard for monitoring the sales teams performance through CRM software. It includes metrics such as outbound calls, demos, contracts closed, average contract value, etc. Deliver an awe inspiring pitch with this creative CRM System Deployment Plan CRM Dashboard For Tracking Contract Rate Introduction PDF bundle. Topics like Outbound Calls, Contracts Closed, Avg Contractvalue can be discussed with this completely editable template. It is available for immediate download depending on the needs and requirements of the user.
CRM System Implementation Stages CRM Dashboard For Tracking Sales Pipeline Background PDF
This slide covers the CRM KPI dashboard for monitoring lead status in the sales funnel. It includes metrics such as open pipeline value, open pipeline by product package, pipeline value forecast, etc. Deliver and pitch your topic in the best possible manner with this CRM System Implementation Stages CRM Dashboard For Tracking Sales Pipeline Background PDF. Use them to share invaluable insights on Pipeline Value, Value Forecast, Sales Opportunities and impress your audience. This template can be altered and modified as per your expectations. So, grab it now.
CRM System Deployment Plan CRM Dashboard For Tracking Sales Pipeline Pictures PDF
This slide covers the CRM KPI dashboard for monitoring lead status in the sales funnel. It includes metrics such as open pipeline value, open pipeline by product package, pipeline value forecast, etc. Deliver an awe inspiring pitch with this creative CRM System Deployment Plan CRM Dashboard For Tracking Sales Pipeline Pictures PDF bundle. Topics like Pipeline Value Forecast, Open Pipeline Value, Branding can be discussed with this completely editable template. It is available for immediate download depending on the needs and requirements of the user.
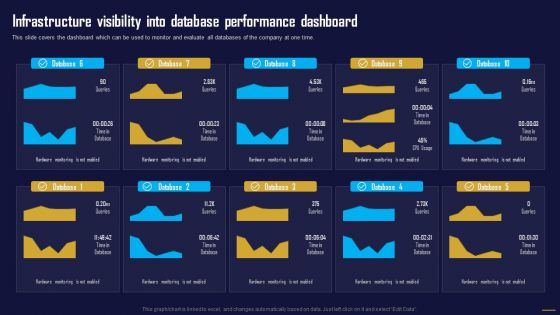
Infrastructure Visibility Into Database Dashboard Information Tech System Maintenance Designs PDF
This slide covers the dashboard which can be used to monitor and evaluate all databases of the company at one time.This slide covers the dashboard which can be used to monitor and evaluate all databases of the company at one time.Slidegeeks is one of the best resources for PowerPoint templates. You can download easily and regulate Infrastructure Visibility Into Database Dashboard Information Tech System Maintenance Designs PDF for your personal presentations from our wonderful collection. A few clicks is all it takes to discover and get the most relevant and appropriate templates. Use our Templates to add a unique zing and appeal to your presentation and meetings. All the slides are easy to edit and you can use them even for advertisement purposes.
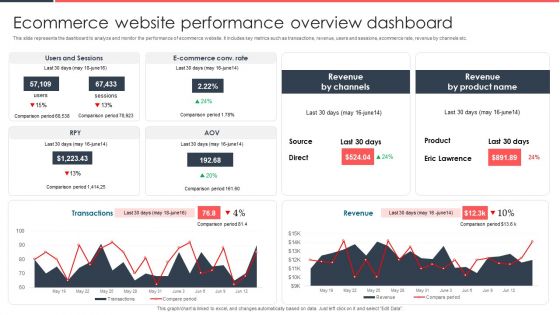
Implementing Management System To Enhance Ecommerce Processes Ecommerce Website Performance Overview Dashboard Slides PDF
This slide represents the dashboard to analyze and monitor the performance of ecommerce website. It includes key metrics such as transactions, revenue, users and sessions, ecommerce rate, revenue by channels etc. Here you can discover an assortment of the finest PowerPoint and Google Slides templates. With these templates, you can create presentations for a variety of purposes while simultaneously providing your audience with an eye catching visual experience. Download Implementing Management System To Enhance Ecommerce Processes Ecommerce Website Performance Overview Dashboard Slides PDF to deliver an impeccable presentation. These templates will make your job of preparing presentations much quicker, yet still, maintain a high level of quality. Slidegeeks has experienced researchers who prepare these templates and write high quality content for you. Later on, you can personalize the content by editing the Implementing Management System To Enhance Ecommerce Processes Ecommerce Website Performance Overview Dashboard Slides PDF.

Customer Segmentation And Behavioral Analysis Customer Segmentation Monitor Elements PDF
The following slide showcases a dashboard to monitor customer segmentation based on similar traits and characteristics. It highlights elements such as total customer in each segments, segments description, segment characteristics and search customer by ID. Crafting an eye catching presentation has never been more straightforward. Let your presentation shine with this tasteful yet straightforward Customer Segmentation And Behavioral Analysis Customer Segmentation Monitor Elements PDF template. It offers a minimalistic and classy look that is great for making a statement. The colors have been employed intelligently to add a bit of playfulness while still remaining professional. Construct the ideal Customer Segmentation And Behavioral Analysis Customer Segmentation Monitor Elements PDF that effortlessly grabs the attention of your audience. Begin now and be certain to wow your customers.
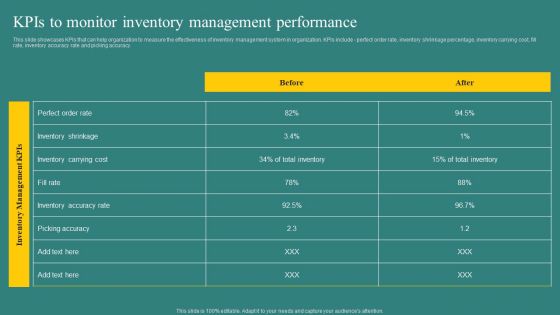
Kpis To Monitor Inventory Management Performance Graphics PDF
This slide showcases KPIs that can help organization to measure the effectiveness of inventory management system in organization. KPIs include perfect order rate, inventory shrinkage percentage, inventory carrying cost, fill rate, inventory accuracy rate and picking accuracy. This Kpis To Monitor Inventory Management Performance Graphics PDF is perfect for any presentation, be it in front of clients or colleagues. It is a versatile and stylish solution for organizing your meetings. The product features a modern design for your presentation meetings. The adjustable and customizable slides provide unlimited possibilities for acing up your presentation. Slidegeeks has done all the homework before launching the product for you. So, do not wait, grab the presentation templates today
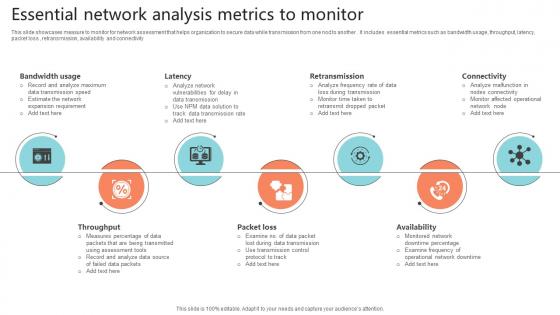
Essential Network Analysis Metrics To Monitor Portrait Pdf
This slide showcases measure to monitor for network assessment that helps organization to secure data while transmission from one nod to another . It includes essential metrics such as bandwidth usage, throughput, latency, packet loss , retransmission, availability and connectivity.Pitch your topic with ease and precision using this Essential Network Analysis Metrics To Monitor Portrait Pdf This layout presents information on Bandwidth Usage, Retransmission, Throughput It is also available for immediate download and adjustment. So, changes can be made in the color, design, graphics or any other component to create a unique layout. This slide showcases measure to monitor for network assessment that helps organization to secure data while transmission from one nod to another . It includes essential metrics such as bandwidth usage, throughput, latency, packet loss , retransmission, availability and connectivity

Ways Monitor Employee Performance Ppt PowerPoint Presentation Outline Infographics Cpb
Presenting this set of slides with name ways monitor employee performance ppt powerpoint presentation outline infographics cpb. This is an editable Powerpoint five stages graphic that deals with topics like ways monitor employee performance to help convey your message better graphically. This product is a premium product available for immediate download and is 100 percent editable in Powerpoint. Download this now and use it in your presentations to impress your audience.
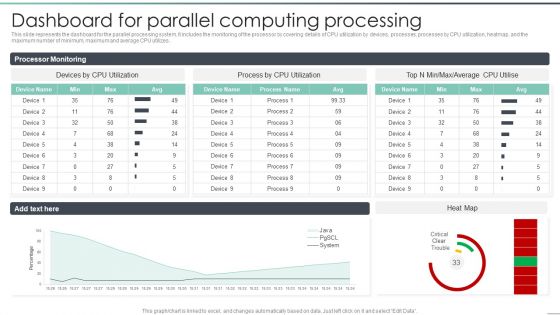
Parallel Computing Processing Dashboard For Parallel Computing Processing Template PDF
This slide represents the dashboard for the parallel processing system. It includes the monitoring of the processor by covering details of CPU utilization by devices, processes, processes by CPU utilization, heatmap, and the maximum number of minimum, maximum and average CPU utilizes. Deliver an awe inspiring pitch with this creative Parallel Computing Processing Dashboard For Parallel Computing Processing Template PDF bundle. Topics like Average, Processor Monitoring, Device can be discussed with this completely editable template. It is available for immediate download depending on the needs and requirements of the user.
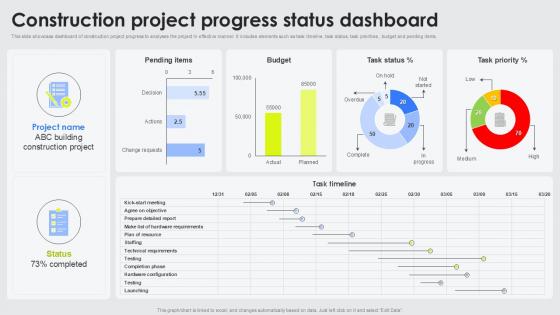
Construction Project Progress Status Dashboard
Create an editable Construction Project Progress Status Dashboard that communicates your idea and engages your audience. Whether you are presenting a business or an educational presentation, pre-designed presentation templates help save time. Construction Project Progress Status Dashboard is highly customizable and very easy to edit, covering many different styles from creative to business presentations. Slidegeeks has creative team members who have crafted amazing templates. So, go and get them without any delay. Our construction project progress status dashboard PowerPoint template covers detailed and efficient tool to analyze project performance. This slide showcases a comprehensive dashboard that includes details such as task timelines, task status, priorities, budget details,etc. It allows project managers and construction teams to effectively track and manage project milestones. This deck helps stakeholders to make informed decisions and effectively monitor progress. Improve your project presentations with our SEO-friendly and visually appealing progress tracking dashboard.
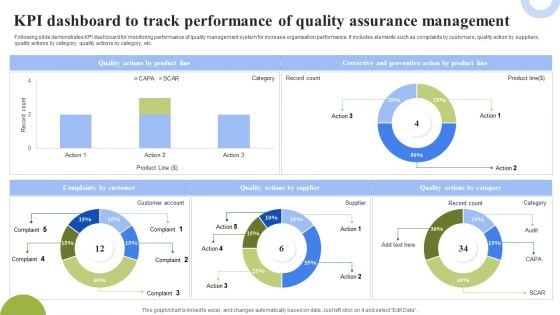
KPI Dashboard To Track Performance Of Quality Assurance Management Topics PDF
Following slide demonstrates KPI dashboard for monitoring performance of quality management system for increase organisation performance. It includes elements such as complaints by customers, quality action by suppliers, quality actions by category, quality actions by category, etc. Showcasing this set of slides titled KPI Dashboard To Track Performance Of Quality Assurance Management Topics PDF. The topics addressed in these templates are Corrective Preventive Action, Quality Actions Supplier, Quality Actions Category. All the content presented in this PPT design is completely editable. Download it and make adjustments in color, background, font etc. as per your unique business setting.
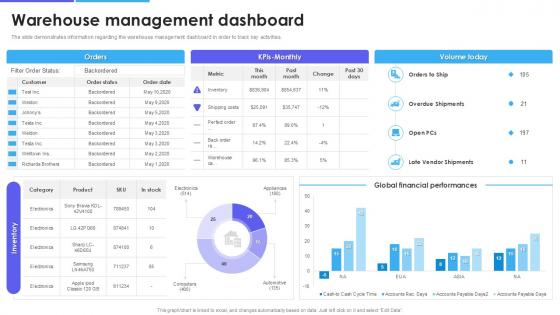
Warehouse Management Inventory Control Warehouse Management Dashboard
Do you have an important presentation coming up Are you looking for something that will make your presentation stand out from the rest Look no further than Warehouse Management Inventory Control Warehouse Management Dashboard. With our professional designs, you can trust that your presentation will pop and make delivering it a smooth process. And with Slidegeeks, you can trust that your presentation will be unique and memorable. So why wait Grab Warehouse Management Inventory Control Warehouse Management Dashboard today and make your presentation stand out from the rest The slide highlights an overview of the warehouse management dashboard, designed to monitor and track critical activities effectively. It includes key operational metrics such as order status, shipping cost, volume, financial performance, overdue shipments etc.
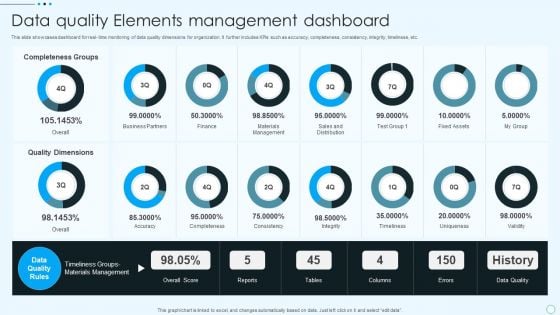
Data Quality Elements Management Dashboard Download PDF
This slide showcases dashboard for real- time monitoring of data quality dimensions for organization. It further includes KPIs such as accuracy, completeness, consistency, integrity, timeliness, etc. Showcasing this set of slides titled Data Quality Elements Management Dashboard Download PDF. The topics addressed in these templates are Quality Dimensions, Accuracy, Completeness, Consistency, Integrity, Timeliness. All the content presented in this PPT design is completely editable. Download it and make adjustments in color, background, font etc. as per your unique business setting.
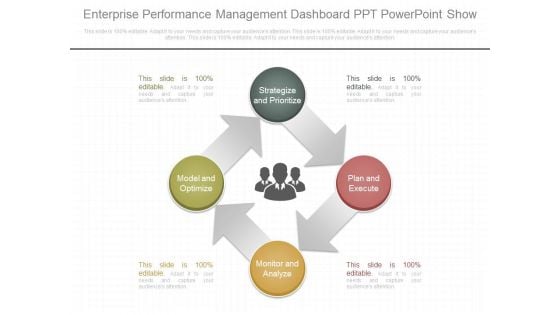
Enterprise Performance Management Dashboard Ppt Powerpoint Show
This is a enterprise performance management dashboard ppt powerpoint show. This is a four stage process. The stages in this process are strategize and prioritize, plan and execute, monitor and analyze, model and optimize.

Techniques To Monitor Transactions Tms And Data Analytics Process Flow Topics PDF
This slide represents transaction monitoring system process flow. It provides information about data analytics, risk framework, alerting, ad hoc analysis, case management, external source entrance, stop list, politically exposed persons PEP, watch list, etc. There are so many reasons you need a Techniques To Monitor Transactions Tms And Data Analytics Process Flow Topics PDF. The first reason is you cant spend time making everything from scratch, Thus, Slidegeeks has made presentation templates for you too. You can easily download these templates from our website easily.
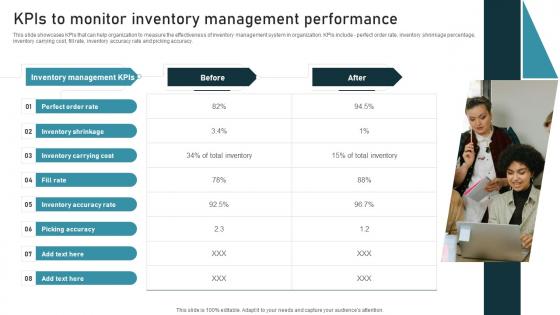
KPIs To Monitor Inventory Administration Techniques For Enhanced Stock Accuracy Portrait Pdf
This slide showcases KPIs that can help organization to measure the effectiveness of inventory management system in organization. KPIs include perfect order rate, inventory shrinkage percentage, inventory carrying cost, fill rate, inventory accuracy rate and picking accuracy. Explore a selection of the finest KPIs To Monitor Inventory Administration Techniques For Enhanced Stock Accuracy Portrait Pdf here. With a plethora of professionally designed and pre made slide templates, you can quickly and easily find the right one for your upcoming presentation. You can use our KPIs To Monitor Inventory Administration Techniques For Enhanced Stock Accuracy Portrait Pdf to effectively convey your message to a wider audience. Slidegeeks has done a lot of research before preparing these presentation templates. The content can be personalized and the slides are highly editable. Grab templates today from Slidegeeks. This slide showcases KPIs that can help organization to measure the effectiveness of inventory management system in organization. KPIs include perfect order rate, inventory shrinkage percentage, inventory carrying cost, fill rate, inventory accuracy rate and picking accuracy.
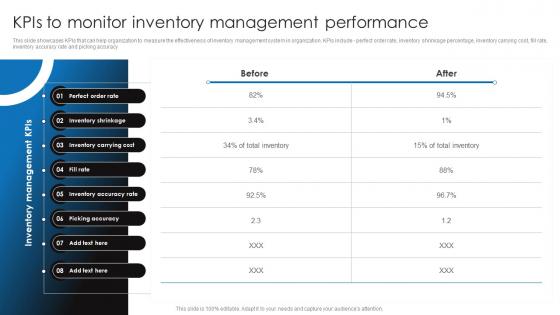
Kpis To Monitor Inventory Management Retail Stock Administration Strategies Pictures Pdf
This slide showcases KPIs that can help organization to measure the effectiveness of inventory management system in organization. KPIs include - perfect order rate, inventory shrinkage percentage, inventory carrying cost, fill rate, inventory accuracy rate and picking accuracy.This Kpis To Monitor Inventory Management Retail Stock Administration Strategies Pictures Pdf from Slidegeeks makes it easy to present information on your topic with precision. It provides customization options, so you can make changes to the colors, design, graphics, or any other component to create a unique layout. It is also available for immediate download, so you can begin using it right away. Slidegeeks has done good research to ensure that you have everything you need to make your presentation stand out. Make a name out there for a brilliant performance. This slide showcases KPIs that can help organization to measure the effectiveness of inventory management system in organization. KPIs include perfect order rate, inventory shrinkage percentage, inventory carrying cost, fill rate, inventory accuracy rate and picking accuracy
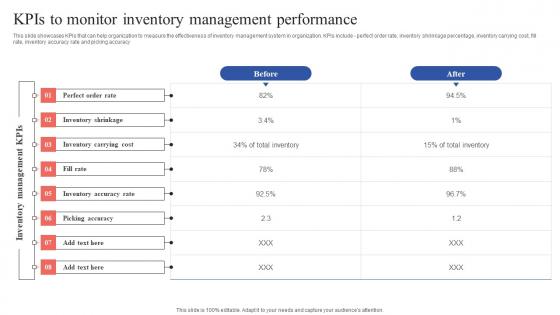
Kpis To Monitor Inventory Management Performance Tactical Guide Stock Administration Guidelines Pdf
This slide showcases KPIs that can help organization to measure the effectiveness of inventory management system in organization. KPIs include - perfect order rate, inventory shrinkage percentage, inventory carrying cost, fill rate, inventory accuracy rate and picking accuracy. This modern and well-arranged Kpis To Monitor Inventory Management Performance Tactical Guide Stock Administration Guidelines Pdf provides lots of creative possibilities. It is very simple to customize and edit with the Powerpoint Software. Just drag and drop your pictures into the shapes. All facets of this template can be edited with Powerpoint, no extra software is necessary. Add your own material, put your images in the places assigned for them, adjust the colors, and then you can show your slides to the world, with an animated slide included. This slide showcases KPIs that can help organization to measure the effectiveness of inventory management system in organization. KPIs include - perfect order rate, inventory shrinkage percentage, inventory carrying cost, fill rate, inventory accuracy rate and picking accuracy.
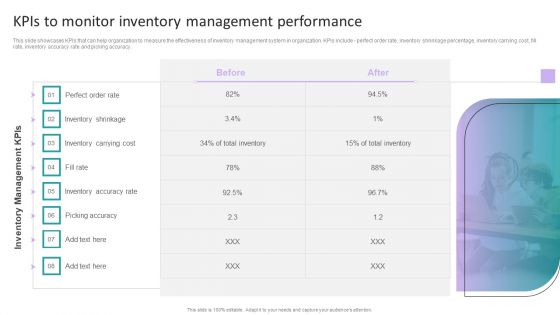
Stock Inventory Acquisition Kpis To Monitor Inventory Management Performance Template PDF
This slide showcases KPIs that can help organization to measure the effectiveness of inventory management system in organization. KPIs include - perfect order rate, inventory shrinkage percentage, inventory carrying cost, fill rate, inventory accuracy rate and picking accuracy. Want to ace your presentation in front of a live audience Our Stock Inventory Acquisition Kpis To Monitor Inventory Management Performance Template PDF can help you do that by engaging all the users towards you. Slidegeeks experts have put their efforts and expertise into creating these impeccable powerpoint presentations so that you can communicate your ideas clearly. Moreover, all the templates are customizable, and easy-to-edit and downloadable. Use these for both personal and commercial use.
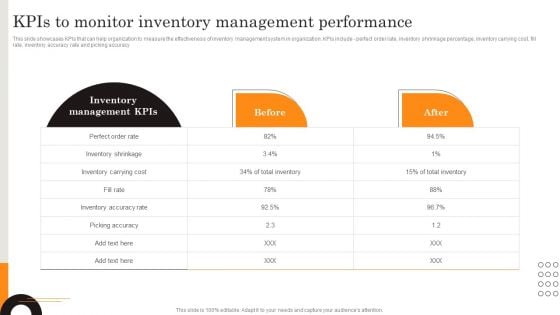
Procurement Strategies For Reducing Stock Wastage Kpis To Monitor Inventory Template PDF
This slide showcases KPIs that can help organization to measure the effectiveness of inventory management system in organization. KPIs include perfect order rate, inventory shrinkage percentage, inventory carrying cost, fill rate, inventory accuracy rate and picking accuracy. Coming up with a presentation necessitates that the majority of the effort goes into the content and the message you intend to convey. The visuals of a PowerPoint presentation can only be effective if it supplements and supports the story that is being told. Keeping this in mind our experts created Procurement Strategies For Reducing Stock Wastage Kpis To Monitor Inventory Template PDF to reduce the time that goes into designing the presentation. This way, you can concentrate on the message while our designers take care of providing you with the right template for the situation.
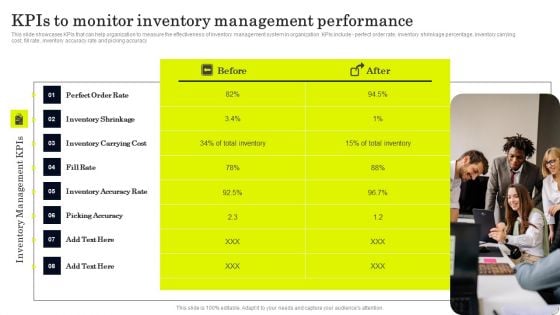
Strategies To Order And Manage Ideal Inventory Levels Kpis To Monitor Inventory Management Mockup PDF
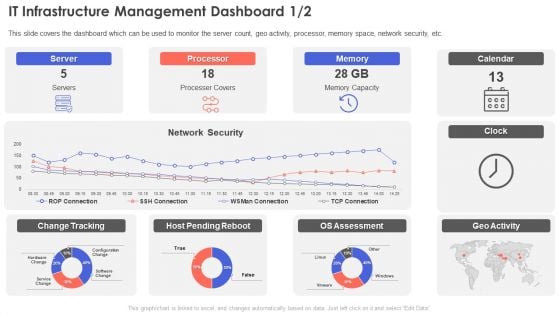
IT Infrastructure Management Dashboard Summary PDF
This slide covers the dashboard which can be used to monitor the server count, geo activity, processor, memory space, network security, etc.Deliver an awe inspiring pitch with this creative IT Infrastructure Management Dashboard Summary PDF bundle. Topics like Processer Covers, Memory Capacity, Pending Reboot can be discussed with this completely editable template. It is available for immediate download depending on the needs and requirements of the user.
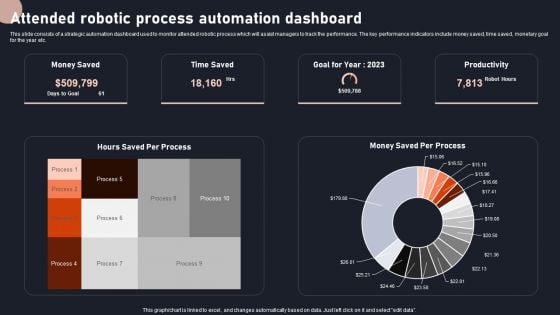
Attended Robotic Process Automation Dashboard Rules PDF
This slide consists of a strategic automation dashboard used to monitor attended robotic process which will assist managers to track the performance. The key performance indicators include money saved, time saved, monetary goal for the year etc. Showcasing this set of slides titled Attended Robotic Process Automation Dashboard Rules PDF. The topics addressed in these templates are Productivity, Goal, Process Automation Dashboard. All the content presented in this PPT design is completely editable. Download it and make adjustments in color, background, font etc. as per your unique business setting.

Monthly Product Sales Analysis Dashboard Infographics PDF
This slide illustrates a dashboard for product sales review to measure to help business monitor and improve productivity, employee engagement and meet revenue targets. It covers product names with sales reps, lead conversion, response time and outbound calls. Showcasing this set of slides titled Monthly Product Sales Analysis Dashboard Infographics PDF. The topics addressed in these templates are Lead Conversion Rate, Outbound Calls, Sales Analysis Dashboard. All the content presented in this PPT design is completely editable. Download it and make adjustments in color, background, font etc. as per your unique business setting.

Continuously Monitor Digital Content Performance Comprehensive Guide To Implement Strategy SS V
Do you have an important presentation coming up Are you looking for something that will make your presentation stand out from the rest Look no further than Continuously Monitor Digital Content Performance Comprehensive Guide To Implement Strategy SS V. With our professional designs, you can trust that your presentation will pop and make delivering it a smooth process. And with Slidegeeks, you can trust that your presentation will be unique and memorable. So why wait Grab Continuously Monitor Digital Content Performance Comprehensive Guide To Implement Strategy SS V today and make your presentation stand out from the rest The following slide highlights key performance indicators to be tracked to ensure continuous content performance review. It includes elements such as user behavior, engagement, SEO outcomes, company revenue, comments, mention, keyword ranking etc.
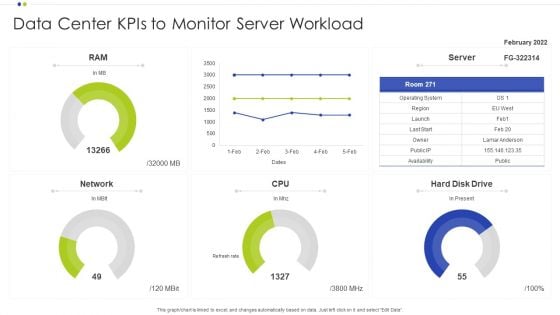
Data Center Kpis To Monitor Server Workload Ppt Gallery Portrait PDF
Showcasing this set of slides titled Data Center Kpis To Monitor Server Workload Ppt Gallery Portrait PDF. The topics addressed in these templates are Operating System, Data Center, Monitor Server Workload. All the content presented in this PPT design is completely editable. Download it and make adjustments in color, background, font etc. as per your unique business setting.
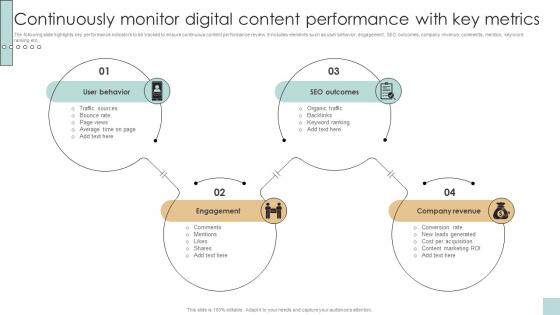
Continuously Monitor Digital Content Developing And Creating Digital Content Strategy SS V
The following slide highlights key performance indicators to be tracked to ensure continuous content performance review. It includes elements such as user behavior, engagement, SEO outcomes, company revenue, comments, mention, keyword ranking etc. Present like a pro with Continuously Monitor Digital Content Developing And Creating Digital Content Strategy SS V. Create beautiful presentations together with your team, using our easy-to-use presentation slides. Share your ideas in real-time and make changes on the fly by downloading our templates. So whether you are in the office, on the go, or in a remote location, you can stay in sync with your team and present your ideas with confidence. With Slidegeeks presentation got a whole lot easier. Grab these presentations today. The following slide highlights key performance indicators to be tracked to ensure continuous content performance review. It includes elements such as user behavior, engagement, SEO outcomes, company revenue, comments, mention, keyword ranking etc.
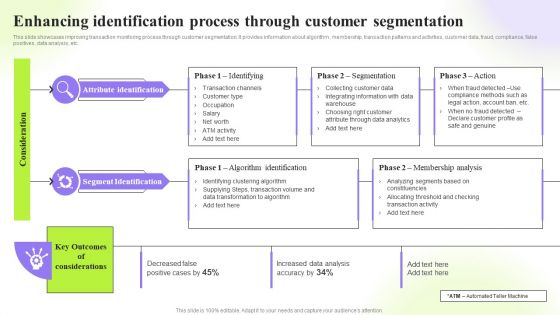
Techniques To Monitor Transactions Enhancing Identification Process Through Customer Sample PDF
This slide showcases improving transaction monitoring process through customer segmentation. It provides information about algorithm , membership, transaction patterns and activities, customer data, fraud, compliance, false positives, data analysis, etc. Crafting an eye-catching presentation has never been more straightforward. Let your presentation shine with this tasteful yet straightforward Techniques To Monitor Transactions Enhancing Identification Process Through Customer Sample PDF template. It offers a minimalistic and classy look that is great for making a statement. The colors have been employed intelligently to add a bit of playfulness while still remaining professional. Construct the ideal Techniques To Monitor Transactions Enhancing Identification Process Through Customer Sample PDF that effortlessly grabs the attention of your audience Begin now and be certain to wow your customers.

University Marketing Guide Set Kpis To Monitor And Review Marketing Performance Strategy SS V
The following slide depicts some KPIs to analyse university marketing performance and determine deviations. It includes elements such as enrolments, retention rate, student satisfaction, cost per acquisition, revenue per student etc. Slidegeeks is here to make your presentations a breeze with University Marketing Guide Set Kpis To Monitor And Review Marketing Performance Strategy SS V With our easy-to-use and customizable templates, you can focus on delivering your ideas rather than worrying about formatting. With a variety of designs to choose from, you are sure to find one that suits your needs. And with animations and unique photos, illustrations, and fonts, you can make your presentation pop. So whether you are giving a sales pitch or presenting to the board, make sure to check out Slidegeeks first The following slide depicts some KPIs to analyse university marketing performance and determine deviations. It includes elements such as enrolments, retention rate, student satisfaction, cost per acquisition, revenue per student etc.

Set KPIs To Monitor And Review Marketing Performance Running Marketing Campaigns Strategy SS V
The following slide depicts some KPIs to analyse university marketing performance and determine deviations. It includes elements such as enrolments, retention rate, student satisfaction, cost per acquisition, revenue per student etc. Take your projects to the next level with our ultimate collection of Set KPIs To Monitor And Review Marketing Performance Running Marketing Campaigns Strategy SS V. Slidegeeks has designed a range of layouts that are perfect for representing task or activity duration, keeping track of all your deadlines at a glance. Tailor these designs to your exact needs and give them a truly corporate look with your own brand colors they will make your projects stand out from the rest The following slide depicts some KPIs to analyse university marketing performance and determine deviations. It includes elements such as enrolments, retention rate, student satisfaction, cost per acquisition, revenue per student etc.

Set KPIs To Monitor And Review Marketing Higher Education Ppt Template Strategy SS V
The following slide depicts some KPIs to analyse university marketing performance and determine deviations. It includes elements such as enrolments, retention rate, student satisfaction, cost per acquisition, revenue per student, etc. Present like a pro with Set KPIs To Monitor And Review Marketing Higher Education Ppt Template Strategy SS V. Create beautiful presentations together with your team, using our easy-to-use presentation slides. Share your ideas in real-time and make changes on the fly by downloading our templates. So whether you are in the office, on the go, or in a remote location, you can stay in sync with your team and present your ideas with confidence. With Slidegeeks presentation got a whole lot easier. Grab these presentations today. The following slide depicts some KPIs to analyse university marketing performance and determine deviations. It includes elements such as enrolments, retention rate, student satisfaction, cost per acquisition, revenue per student, etc.
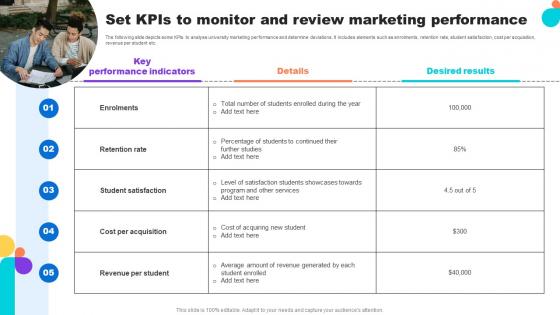
Set Kpis To Monitor And Review Marketing Performance Key Step To Implementation University Strategy SS V
Present like a pro with Set Kpis To Monitor And Review Marketing Performance Key Step To Implementation University Strategy SS V. Create beautiful presentations together with your team, using our easy-to-use presentation slides. Share your ideas in real-time and make changes on the fly by downloading our templates. So whether you are in the office, on the go, or in a remote location, you can stay in sync with your team and present your ideas with confidence. With Slidegeeks presentation got a whole lot easier. Grab these presentations today. The following slide depicts some KPIs to analyse university marketing performance and determine deviations. It includes elements such as enrolments, retention rate, student satisfaction, cost per acquisition, revenue per student etc.
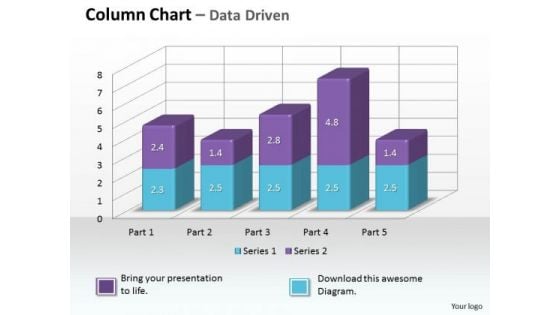
Data Analysis On Excel 3d Chart To Monitor Business Process PowerPoint Templates
Make Some Dough With Our data analysis on excel 3d chart to monitor business process Powerpoint Templates . Your Assets Will Rise Significantly.
Influencers Tracking Report To Monitor Content Word Of Mouth Marketing Structure Pdf
This slide covers influencer performance tracking sheet to check effectiveness of referral program. It includes elements such clicks, likes, reaction received, shares, comments, etc received by different influencers.Coming up with a presentation necessitates that the majority of the effort goes into the content and the message you intend to convey. The visuals of a PowerPoint presentation can only be effective if it supplements and supports the story that is being told. Keeping this in mind our experts created Influencers Tracking Report To Monitor Content Word Of Mouth Marketing Structure Pdf to reduce the time that goes into designing the presentation. This way, you can concentrate on the message while our designers take care of providing you with the right template for the situation. This slide covers influencer performance tracking sheet to check effectiveness of referral program. It includes elements such clicks, likes, reaction received, shares, comments, etc received by different influencers.
Corporate Financial Performance Tracking Dashboard Elements PDF
This slide provides information regarding dashboard utilized by firm to monitor financial performance. The performance is tracked through revenues generated, vendors associated, profit generated, etc. Whether you have daily or monthly meetings, a brilliant presentation is necessary. Corporate Financial Performance Tracking Dashboard Elements PDF can be your best option for delivering a presentation. Represent everything in detail using Corporate Financial Performance Tracking Dashboard Elements PDF and make yourself stand out in meetings. The template is versatile and follows a structure that will cater to your requirements. All the templates prepared by Slidegeeks are easy to download and edit. Our research experts have taken care of the corporate themes as well. So, give it a try and see the results.
Smart Attendance Tracking Systems Dashboard Impact Of IoT Technology On Education IoT SS V
Following slide highlights dashboard to monitor and track student attendance by using Io enabled asset tracking devices. It includes indicators such as overtime, statistics, source, exceptions, pending requests, etc. Want to ace your presentation in front of a live audience Our Smart Attendance Tracking Systems Dashboard Impact Of IoT Technology On Education IoT SS V can help you do that by engaging all the users towards you. Slidegeeks experts have put their efforts and expertise into creating these impeccable powerpoint presentations so that you can communicate your ideas clearly. Moreover, all the templates are customizable, and easy-to-edit and downloadable. Use these for both personal and commercial use. Following slide highlights dashboard to monitor and track student attendance by using Io enabled asset tracking devices. It includes indicators such as overtime, statistics, source, exceptions, pending requests, etc.

Continuously Monitor Digital Content Performance Top Of The Funnel Digital Content Strategy SS V
The following slide highlights key performance indicators to be tracked to ensure continuous content performance review. It includes elements such as user behavior, engagement, SEO outcomes, company revenue, comments, mention, keyword ranking etc. Slidegeeks is here to make your presentations a breeze with Continuously Monitor Digital Content Performance Top Of The Funnel Digital Content Strategy SS V With our easy-to-use and customizable templates, you can focus on delivering your ideas rather than worrying about formatting. With a variety of designs to choose from, you are sure to find one that suits your needs. And with animations and unique photos, illustrations, and fonts, you can make your presentation pop. So whether you are giving a sales pitch or presenting to the board, make sure to check out Slidegeeks first The following slide highlights key performance indicators to be tracked to ensure continuous content performance review. It includes elements such as user behavior, engagement, SEO outcomes, company revenue, comments, mention, keyword ranking etc.
Data Analysis Icon Computer Monitor Bar Chart Ppt PowerPoint Presentation File Graphics Example PDF
Presenting this set of slides with name data analysis icon computer monitor bar chart ppt powerpoint presentation file graphics example pdf. This is a two stage process. The stages in this process are data analysis icon computer monitor bar chart. This is a completely editable PowerPoint presentation and is available for immediate download. Download now and impress your audience.


 Continue with Email

 Home
Home


