Dashboards Summary
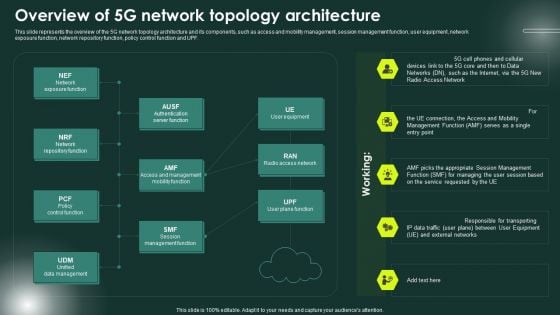
5G Network Applications And Features Overview Of 5G Network Topology Architecture Mockup PDF
This slide represents the overview of the 5G network topology architecture and its components, such as access and mobility management, session management function, user equipment, network exposure function, network repository function, policy control function and UPF. Want to ace your presentation in front of a live audience Our 5G Network Applications And Features Overview Of 5G Network Topology Architecture Mockup PDF can help you do that by engaging all the users towards you.. Slidegeeks experts have put their efforts and expertise into creating these impeccable powerpoint presentations so that you can communicate your ideas clearly. Moreover, all the templates are customizable, and easy-to-edit and downloadable. Use these for both personal and commercial use.

Strategic Market Insight Implementation Guide Sentiment Analysis Method Sample In Data Evaluation Sample PDF
This slide showcases sample of sentiment analysis method to analyze emotions behind user feedbacks and execute improvement strategies. It showcases elements such as comments, sentiments and response count overview. There are so many reasons you need a Strategic Market Insight Implementation Guide Sentiment Analysis Method Sample In Data Evaluation Sample PDF. The first reason is you cannot spend time making everything from scratch, Thus, Slidegeeks has made presentation templates for you too. You can easily download these templates from our website easily.
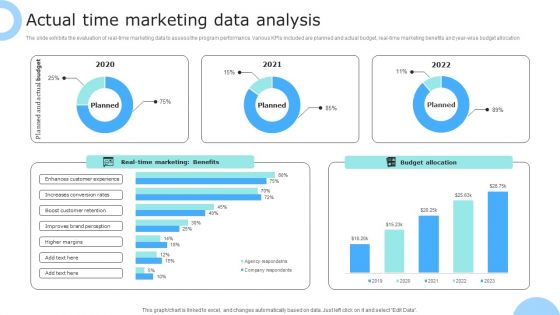
Actual Time Marketing Data Analysis Ppt PowerPoint Presentation Gallery Pictures PDF
The slide exhibits the evaluation of real-time marketing data to assess the program performance. Various KPIs included are planned and actual budget, real-time marketing benefits and year-wise budget allocation. Showcasing this set of slides titled Actual Time Marketing Data Analysis Ppt PowerPoint Presentation Gallery Pictures PDF. The topics addressed in these templates are Planned, Actual Budget, Budget Allocation, Real Time Marketing, Benefits. All the content presented in this PPT design is completely editable. Download it and make adjustments in color, background, font etc. as per your unique business setting.

Facts About Big Data In Marketing Ppt PowerPoint Presentation Clipart
This is a facts about big data in marketing ppt powerpoint presentation clipart. This is a eight stage process. The stages in this process are arrow, process, business, marketing, success.
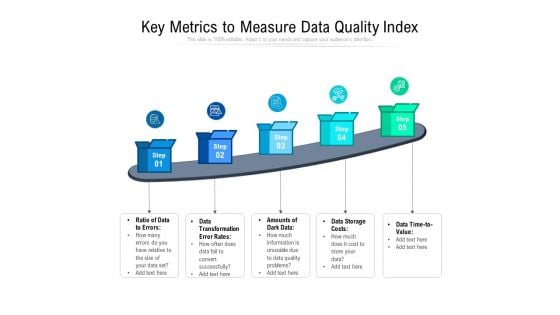
Key Metrics For Data Quality Measurement Ppt PowerPoint Presentation Styles Deck PDF
Persuade your audience using this key metrics for data quality measurement ppt powerpoint presentation styles deck pdf. This PPT design covers five stages, thus making it a great tool to use. It also caters to a variety of topics including ratio of data to errors, data transformation error rates, amounts of dark data, data storage costs, data time to value. Download this PPT design now to present a convincing pitch that not only emphasizes the topic but also showcases your presentation skills.
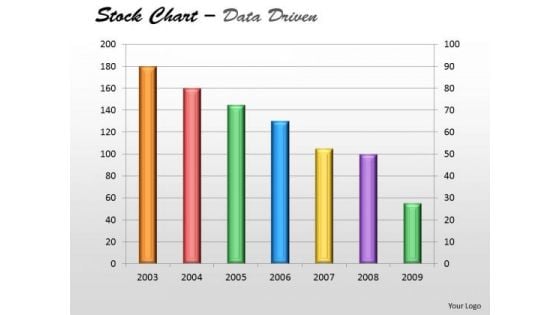
Data Analysis In Excel Of Stock Chart PowerPoint Templates
Plan Your Storyboard With Our data analysis in excel of stock chart Powerpoint Templates . Give An Outline To The Solutions You Have.
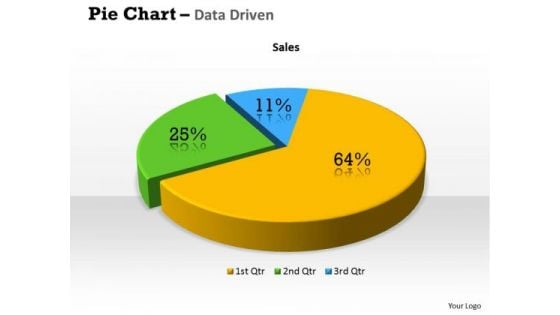
Quantitative Data Analysis 3d Percentage Ratio Pie Chart PowerPoint Templates
Plan Your Storyboard With Our quantitative data analysis 3d percentage ratio pie chart Powerpoint Templates . Give An Outline To The Solutions You Have.
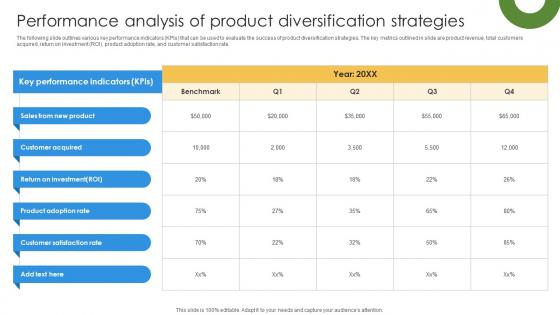
Marketing Growth Strategy To Strengthen Performance Analysis Of Product Strategy SS V
The following slide outlines various key performance indicators KPIs that can be used to evaluate the success of product diversification strategies. The key metrics outlined in slide are product revenue, total customers acquired, return on investment ROI, product adoption rate, and customer satisfaction rate. If you are looking for a format to display your unique thoughts, then the professionally designed Marketing Growth Strategy To Strengthen Performance Analysis Of Product Strategy SS V is the one for you. You can use it as a Google Slides template or a PowerPoint template. Incorporate impressive visuals, symbols, images, and other charts. Modify or reorganize the text boxes as you desire. Experiment with shade schemes and font pairings. Alter, share or cooperate with other people on your work. Download Marketing Growth Strategy To Strengthen Performance Analysis Of Product Strategy SS V and find out how to give a successful presentation. Present a perfect display to your team and make your presentation unforgettable. The following slide outlines various key performance indicators KPIs that can be used to evaluate the success of product diversification strategies. The key metrics outlined in slide are product revenue, total customers acquired, return on investment ROI, product adoption rate, and customer satisfaction rate.
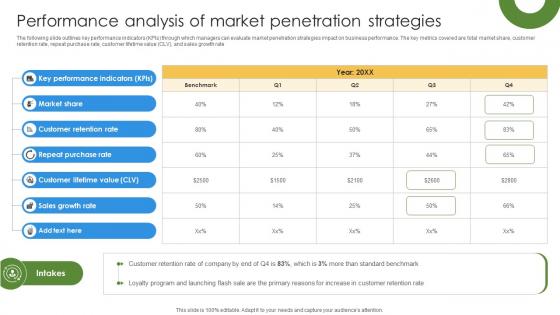
Marketing Growth Strategy To Performance Analysis Of Market Penetration Strategies Strategy SS V
The following slide outlines key performance indicators KPIs through which managers can evaluate market penetration strategies impact on business performance. The key metrics covered are total market share, customer retention rate, repeat purchase rate, customer lifetime value CLV, and sales growth rate. Slidegeeks is here to make your presentations a breeze with Marketing Growth Strategy To Performance Analysis Of Market Penetration Strategies Strategy SS V With our easy-to-use and customizable templates, you can focus on delivering your ideas rather than worrying about formatting. With a variety of designs to choose from, you are sure to find one that suits your needs. And with animations and unique photos, illustrations, and fonts, you can make your presentation pop. So whether you are giving a sales pitch or presenting to the board, make sure to check out Slidegeeks first The following slide outlines key performance indicators KPIs through which managers can evaluate market penetration strategies impact on business performance. The key metrics covered are total market share, customer retention rate, repeat purchase rate, customer lifetime value CLV, and sales growth rate.
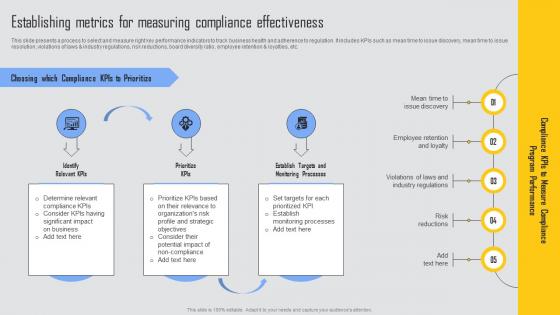
Establishing Metrics Measuring Managing Risks And Establishing Trust Through Efficient Ideas Pdf
This slide presents a process to select and measure right key performance indicators to track business health and adherence to regulation. It includes KPIs such as mean time to issue discovery, mean time to issue resolution, violations of laws and industry regulations, risk reductions, board diversity ratio, employee retention and loyalties, etc. Do you have to make sure that everyone on your team knows about any specific topic I yes, then you should give Establishing Metrics Measuring Managing Risks And Establishing Trust Through Efficient Ideas Pdf a try. Our experts have put a lot of knowledge and effort into creating this impeccable Establishing Metrics Measuring Managing Risks And Establishing Trust Through Efficient Ideas Pdf. You can use this template for your upcoming presentations, as the slides are perfect to represent even the tiniest detail. You can download these templates from the Slidegeeks website and these are easy to edit. So grab these today This slide presents a process to select and measure right key performance indicators to track business health and adherence to regulation. It includes KPIs such as mean time to issue discovery, mean time to issue resolution, violations of laws and industry regulations, risk reductions, board diversity ratio, employee retention and loyalties, etc.

Utilization Of Product Analytics By Various Business Product Analytics Implementation Data Analytics V
This slide provides an overview of business positions leveraging product analytics to improve their business operations. It covers use of product analytics by the following positions product manager, UX designers, marketers, customer success team, executives and business intelligence analyst Retrieve professionally designed Utilization Of Product Analytics By Various Business Product Analytics Implementation Data Analytics V to effectively convey your message and captivate your listeners. Save time by selecting pre-made slideshows that are appropriate for various topics, from business to educational purposes. These themes come in many different styles, from creative to corporate, and all of them are easily adjustable and can be edited quickly. Access them as PowerPoint templates or as Google Slides themes. You do not have to go on a hunt for the perfect presentation because Slidegeeks got you covered from everywhere. This slide provides an overview of business positions leveraging product analytics to improve their business operations. It covers use of product analytics by the following positions product manager, UX designers, marketers, customer success team, executives and business intelligence analyst
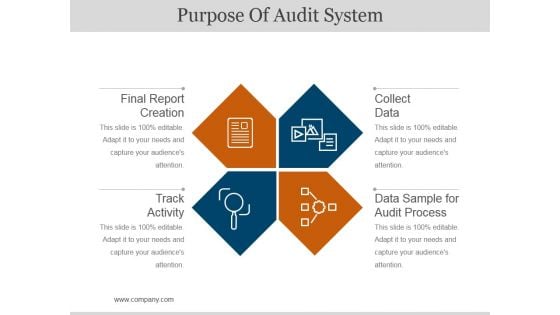
Purpose Of Audit System Ppt PowerPoint Presentation File Layouts
This is a purpose of audit system ppt powerpoint presentation file layouts. This is a four stage process. The stages in this process are final report creation, track activity, collect data, data sample for audit process.
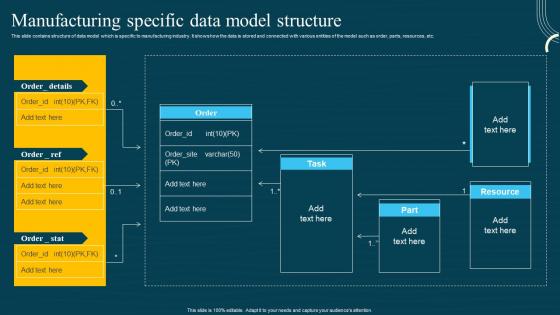
Database Modeling Structures Manufacturing Specific Data Model Structure Template Pdf
This slide contains structure of data model which is specific to manufacturing industry. It shows how the data is stored and connected with various entities of the model such as order, parts, resources, etc. This Database Modeling Structures Manufacturing Specific Data Model Structure Template Pdf from Slidegeeks makes it easy to present information on your topic with precision. It provides customization options, so you can make changes to the colors, design, graphics, or any other component to create a unique layout. It is also available for immediate download, so you can begin using it right away. Slidegeeks has done good research to ensure that you have everything you need to make your presentation stand out. Make a name out there for a brilliant performance. This slide contains structure of data model which is specific to manufacturing industry. It shows how the data is stored and connected with various entities of the model such as order, parts, resources, etc.
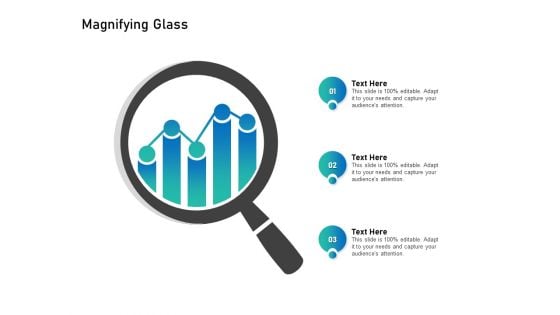
Alliance Evaluation Magnifying Glass Ppt Layouts Graphics Tutorials PDF
Presenting this set of slides with name alliance evaluation magnifying glass ppt layouts graphics tutorials pdf. This is a three stage process. The stages in this process are magnifying glass. This is a completely editable PowerPoint presentation and is available for immediate download. Download now and impress your audience.

Co Worker Feedback KPIS For Team Collaboration Pictures Pdf
This slide covers KPIs for Peer Feedback related to Team Collaboration. This template aims to outline key performance indicators that assess cross-functional collaboration, communication effectiveness, conflict resolution, diversity and inclusion efforts, and overall team engagement. Pitch your topic with ease and precision using this Co Worker Feedback KPIS For Team Collaboration Pictures Pdf This layout presents information on Cross Functional, Team Communication, Team Engagement It is also available for immediate download and adjustment. So, changes can be made in the color, design, graphics or any other component to create a unique layout. This slide covers KPIs for Peer Feedback related to Team Collaboration. This template aims to outline key performance indicators that assess cross-functional collaboration, communication effectiveness, conflict resolution, diversity and inclusion efforts, and overall team engagement.
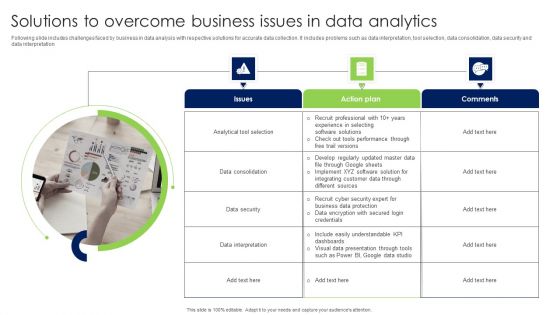
Solutions To Overcome Business Issues In Data Analytics Infographics PDF
Following slide includes challenges faced by business in data analysis with respective solutions for accurate data collection. It includes problems such as data interpretation, tool selection, data consolidation, data security and data interpretation Presenting Solutions To Overcome Business Issues In Data Analytics Infographics PDF to dispense important information. This template comprises Three stages. It also presents valuable insights into the topics including Issues, Action Plan, Comments. This is a completely customizable PowerPoint theme that can be put to use immediately. So, download it and address the topic impactfully.
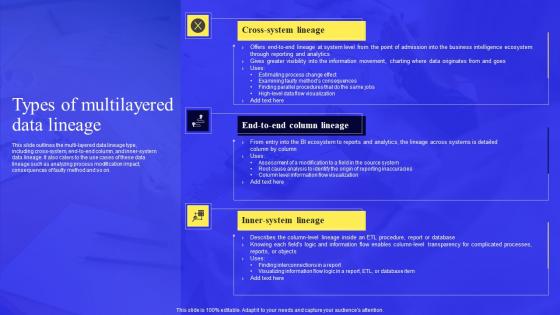
Business Process Data Lineage Types Of Multilayered Data Lineage Microsoft Pdf
This slide outlines the multi layered data lineage type, including cross system, end to end column, and inner system data lineage. It also caters to the use cases of these data lineage such as analyzing process modification impact, consequences of faulty method and so on. Crafting an eye catching presentation has never been more straightforward. Let your presentation shine with this tasteful yet straightforward Business Process Data Lineage Types Of Multilayered Data Lineage Microsoft Pdf template. It offers a minimalistic and classy look that is great for making a statement. The colors have been employed intelligently to add a bit of playfulness while still remaining professional. Construct the ideal Business Process Data Lineage Types Of Multilayered Data Lineage Microsoft Pdf that effortlessly grabs the attention of your audience Begin now and be certain to wow your customers This slide outlines the multi-layered data lineage type, including cross-system, end-to-end column, and inner-system data lineage. It also caters to the use cases of these data lineage such as analyzing process modification impact, consequences of faulty method and so on.

Agenda For Optimizing Decision Making The Power Of Prescriptive Analytics Data Analytics SS V
Boost your pitch with our creative Agenda For Optimizing Decision Making The Power Of Prescriptive Analytics Data Analytics SS V. Deliver an awe-inspiring pitch that will mesmerize everyone. Using these presentation templates you will surely catch everyones attention. You can browse the ppts collection on our website. We have researchers who are experts at creating the right content for the templates. So you do not have to invest time in any additional work. Just grab the template now and use them. Our Agenda For Optimizing Decision Making The Power Of Prescriptive Analytics Data Analytics SS V are topically designed to provide an attractive backdrop to any subject. Use them to look like a presentation pro.
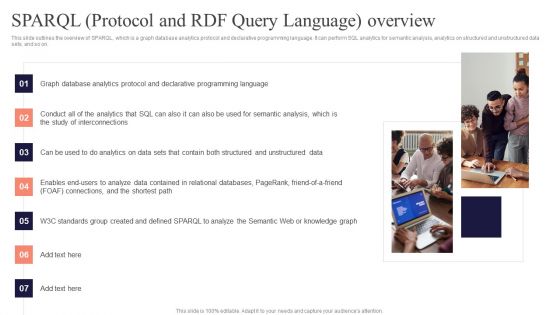
Concept Of Ontology In The Semantic Web Sparql Protocol And Rdf Query Language Overview Guidelines PDF
This slide outlines the overview of SPARQL, which is a graph database analytics protocol and declarative programming language. It can perform SQL analytics for semantic analysis, analytics on structured and unstructured data sets, and so on. Whether you have daily or monthly meetings, a brilliant presentation is necessary. Concept Of Ontology In The Semantic Web Sparql Protocol And Rdf Query Language Overview Guidelines PDF can be your best option for delivering a presentation. Represent everything in detail using Concept Of Ontology In The Semantic Web Sparql Protocol And Rdf Query Language Overview Guidelines PDF and make yourself stand out in meetings. The template is versatile and follows a structure that will cater to your requirements. All the templates prepared by Slidegeeks are easy to download and edit. Our research experts have taken care of the corporate themes as well. So, give it a try and see the results.
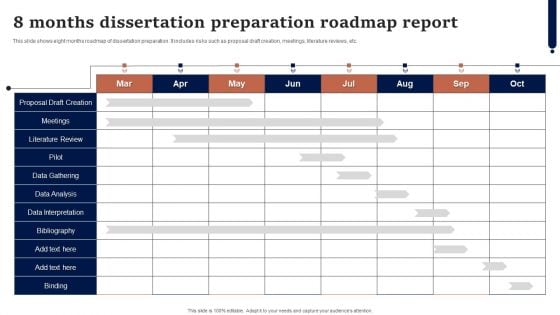
8 Months Dissertation Preparation Roadmap Report Introduction PDF
This slide shows 10 weeks dissertation report timeline. It includes various tasks such as training, database setup, data collection, data analysis, etc. Showcasing this set of slides titled 8 Months Dissertation Preparation Roadmap Report Introduction PDF. The topics addressed in these templates are Database Setup, Preparation Of Manuscript, Data Analysis. All the content presented in this PPT design is completely editable. Download it and make adjustments in color, background, font etc. as per your unique business setting.
Histogram Column Chart With Red Arrow Vector Icon Ppt PowerPoint Presentation Outline Ideas Cpb
This is a histogram column chart with red arrow vector icon ppt powerpoint presentation outline ideas cpb. This is a three stage process. The stages in this process are bar chart icon, bar graph icon, data chart icon.
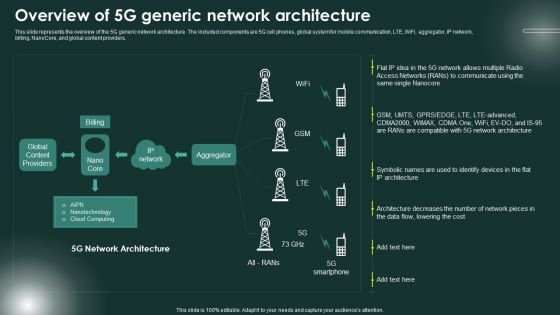
5G Network Applications And Features Overview Of 5G Generic Network Architecture Inspiration PDF
This slide represents the overview of the 5G generic network architecture. The included components are 5G cell phones, global system for mobile communication, LTE, WiFi, aggregator, IP network, billing, NanoCore, and global content providers. Slidegeeks is one of the best resources for PowerPoint templates. You can download easily and regulate 5G Network Applications And Features Overview Of 5G Generic Network Architecture Inspiration PDF for your personal presentations from our wonderful collection. A few clicks is all it takes to discover and get the most relevant and appropriate templates. Use our Templates to add a unique zing and appeal to your presentation and meetings. All the slides are easy to edit and you can use them even for advertisement purposes.
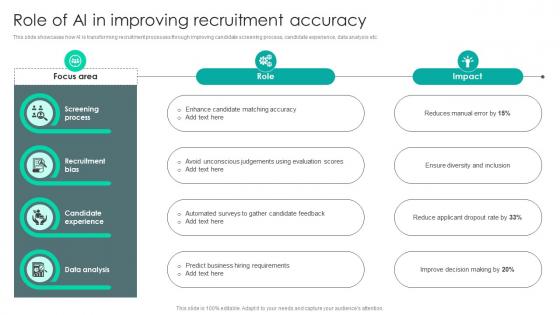
Strategic Staffing Using Data Role Of AI In Improving Recruitment Accuracy CRP DK SS V
This slide showcases how AI is transforming recruitment processes through improving candidate screening process, candidate experience, data analysis etc. Create an editable Strategic Staffing Using Data Role Of AI In Improving Recruitment Accuracy CRP DK SS V that communicates your idea and engages your audience. Whether you are presenting a business or an educational presentation, pre-designed presentation templates help save time. Strategic Staffing Using Data Role Of AI In Improving Recruitment Accuracy CRP DK SS V is highly customizable and very easy to edit, covering many different styles from creative to business presentations. Slidegeeks has creative team members who have crafted amazing templates. So, go and get them without any delay. This slide showcases how AI is transforming recruitment processes through improving candidate screening process, candidate experience, data analysis etc.
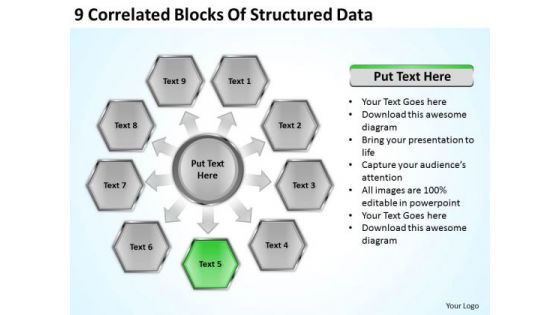
9 Correlated Blocks Of Structured Data How To Present Business Plan PowerPoint Slides
We present our 9 correlated blocks of structured data how to present business plan PowerPoint Slides.Download our Marketing PowerPoint Templates because Our PowerPoint Templates and Slides are focused like a searchlight beam. They highlight your ideas for your target audience. Use our Business PowerPoint Templates because You can Stir your ideas in the cauldron of our PowerPoint Templates and Slides. Cast a magic spell on your audience. Use our Finance PowerPoint Templates because You can Rise to the occasion with our PowerPoint Templates and Slides. You will bring your audience on their feet in no time. Present our Process and Flows PowerPoint Templates because Our PowerPoint Templates and Slides are innately eco-friendly. Their high recall value negate the need for paper handouts. Use our Arrows PowerPoint Templates because our PowerPoint Templates and Slides will give your ideas the shape.Use these PowerPoint slides for presentations relating to Diagram, Chart, Business, Background, Vector, Pie, Brown, Abstract, Wheel, Options, Board, Website, Cross, Statistics, Model, Item, Document, Media, Beehives, Red, Hive, Concept, Presentation, Template, Matt, Brochure, Orange, Guide, Description, Multicolor, Marketing, Gray, Development, Title, Management, Honeycomb, Illustration, Six, Catalog, Direction, Plans, Blue, Text, Reports, Financial, Workplace, Navigation, Parts. The prominent colors used in the PowerPoint template are Green, Gray, Black. Begin with a bang with our 9 Correlated Blocks Of Structured Data How To Present Business Plan PowerPoint Slides. Explode off the blocks with your thoughts.
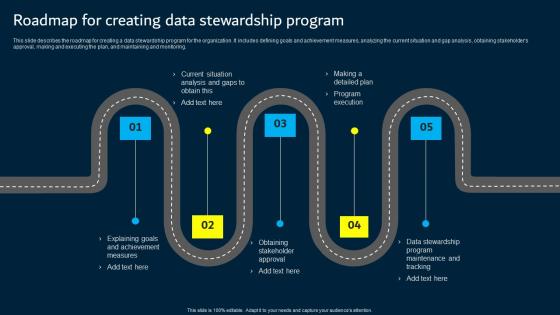
Roadmap For Creating Data Stewardship Program Data Custodianship Introduction Pdf
This slide describes the roadmap for creating a data stewardship program for the organization. It includes defining goals and achievement measures, analyzing the current situation and gap analysis, obtaining stakeholder s approval, making and executing the plan, and maintaining and monitoring. Are you searching for a Roadmap For Creating Data Stewardship Program Data Custodianship Introduction Pdf that is uncluttered, straightforward, and original Its easy to edit, and you can change the colors to suit your personal or business branding. For a presentation that expresses how much effort you have put in, this template is ideal With all of its features, including tables, diagrams, statistics, and lists, its perfect for a business plan presentation. Make your ideas more appealing with these professional slides. Download Roadmap For Creating Data Stewardship Program Data Custodianship Introduction Pdf from Slidegeeks today. This slide describes the roadmap for creating a data stewardship program for the organization. It includes defining goals and achievement measures, analyzing the current situation and gap analysis, obtaining stakeholder s approval, making and executing the plan, and maintaining and monitoring.
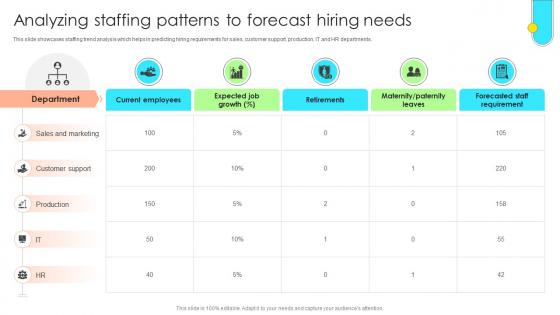
Data Driven Approach To Optimise Analyzing Staffing Patterns To Forecast CRP SS V
This slide showcases staffing trend analysis which helps in predicting hiring requirements for sales, customer support, production, IT and HR departments. Get a simple yet stunning designed Data Driven Approach To Optimise Analyzing Staffing Patterns To Forecast CRP SS V. It is the best one to establish the tone in your meetings. It is an excellent way to make your presentations highly effective. So, download this PPT today from Slidegeeks and see the positive impacts. Our easy-to-edit Data Driven Approach To Optimise Analyzing Staffing Patterns To Forecast CRP SS V can be your go-to option for all upcoming conferences and meetings. So, what are you waiting for Grab this template today. This slide showcases staffing trend analysis which helps in predicting hiring requirements for sales, customer support, production, IT and HR departments.
Data Analytics Plan For Product Pricing Decisions Icon Professional PDF
Presenting Data Analytics Plan For Product Pricing Decisions Icon Professional PDF to dispense important information. This template comprises three stages. It also presents valuable insights into the topics including Data Analytics Plan, Product Pricing, Decisions Icon. This is a completely customizable PowerPoint theme that can be put to use immediately. So, download it and address the topic impactfully.
Analytics Based Marketing Trends Icon Infographics Pdf
Showcasing this set of slides titled Analytics Based Marketing Trends Icon Infographics Pdf The topics addressed in these templates are Analytics Based, Marketing Trends Icon All the content presented in this PPT design is completely editable. Download it and make adjustments in color, background, font etc. as per your unique business setting. Our Analytics Based Marketing Trends Icon Infographics Pdf are topically designed to provide an attractive backdrop to any subject. Use them to look like a presentation pro.
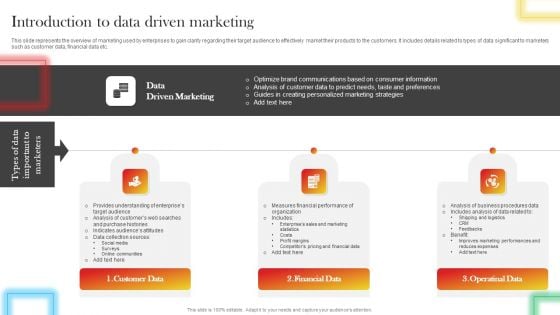
Introduction To Data Driven Marketing Portrait PDF
This slide represents the overview of marketing used by enterprises to gain clarity regarding their target audience to effectively market their products to the customers. It includes details related to types of data significant to marketers such as customer data, financial data etc. Explore a selection of the finest Introduction To Data Driven Marketing Portrait PDF here. With a plethora of professionally designed and pre-made slide templates, you can quickly and easily find the right one for your upcoming presentation. You can use our Introduction To Data Driven Marketing Portrait PDF to effectively convey your message to a wider audience. Slidegeeks has done a lot of research before preparing these presentation templates. The content can be personalized and the slides are highly editable. Grab templates today from Slidegeeks.
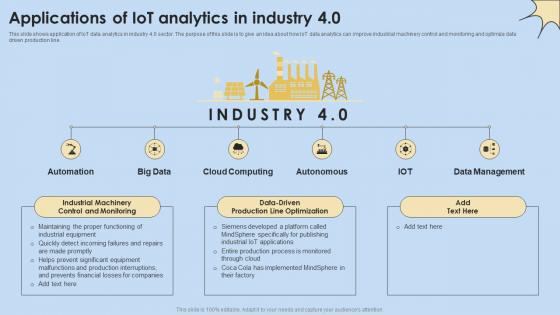
Applications Of IoT Analytics In Industry 4 0 Internet Of Things Analysis Sample Pdf
This slide shows application of IoT data analytics in industry 4.0 sector. The purpose of this slide is to give an idea about how IoT data analytics can improve industrial machinery control and monitoring and optimize data driven production line. Want to ace your presentation in front of a live audience Our Applications Of IoT Analytics In Industry 4 0 Internet Of Things Analysis Sample Pdf can help you do that by engaging all the users towards you. Slidegeeks experts have put their efforts and expertise into creating these impeccable powerpoint presentations so that you can communicate your ideas clearly. Moreover, all the templates are customizable, and easy-to-edit and downloadable. Use these for both personal and commercial use. This slide shows application of IoT data analytics in industry 4.0 sector. The purpose of this slide is to give an idea about how IoT data analytics can improve industrial machinery control and monitoring and optimize data driven production line.
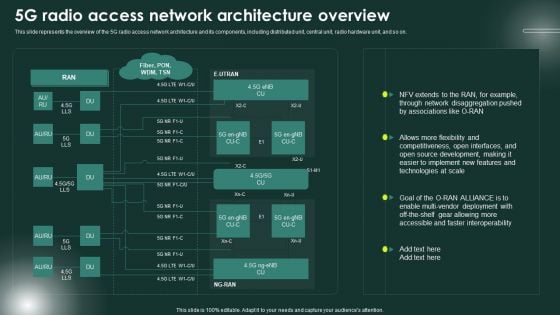
5G Network Applications And Features 5G Radio Access Network Architecture Overview Background PDF
This slide represents the overview of the 5G radio access network architecture and its components, including distributed unit, central unit, radio hardware unit, and so on. Coming up with a presentation necessitates that the majority of the effort goes into the content and the message you intend to convey. The visuals of a PowerPoint presentation can only be effective if it supplements and supports the story that is being told. Keeping this in mind our experts created 5G Network Applications And Features 5G Radio Access Network Architecture Overview Background PDF to reduce the time that goes into designing the presentation. This way, you can concentrate on the message while our designers take care of providing you with the right template for the situation.
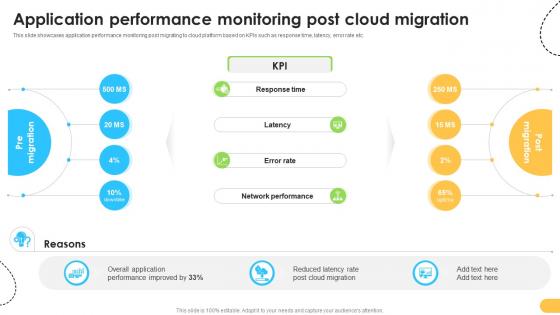
Application Performance Monitoring Post Cloud Migration Data Migration From On Premises
This slide showcases application performance monitoring post migrating to cloud platform based on KPIs such as response time, latency, error rate etc. Create an editable Application Performance Monitoring Post Cloud Migration Data Migration From On Premises that communicates your idea and engages your audience. Whether you are presenting a business or an educational presentation, pre-designed presentation templates help save time. Application Performance Monitoring Post Cloud Migration Data Migration From On Premises is highly customizable and very easy to edit, covering many different styles from creative to business presentations. Slidegeeks has creative team members who have crafted amazing templates. So, go and get them without any delay. This slide showcases application performance monitoring post migrating to cloud platform based on KPIs such as response time, latency, error rate etc.
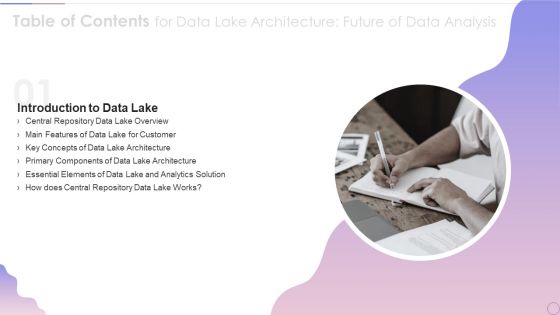
Table Of Contents For Data Lake Architecture Future Of Data Analysis Rules Background PDF
Presenting Table Of Contents For Data Lake Architecture Future Of Data Analysis Rules Background PDF to provide visual cues and insights. Share and navigate important information on one stage that need your due attention. This template can be used to pitch topics like Central Repository, Concepts Of Data, Primary Components. In addtion, this PPT design contains high resolution images, graphics, etc, that are easily editable and available for immediate download.
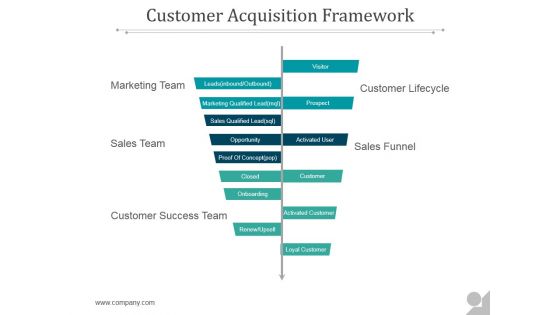
Customer Acquisition Framework Ppt PowerPoint Presentation Example
This is a customer acquisition framework ppt powerpoint presentation example. This is a six stage process. The stages in this process are marketing team, sales team, customer success team, sales funnel, customer lifecycle.
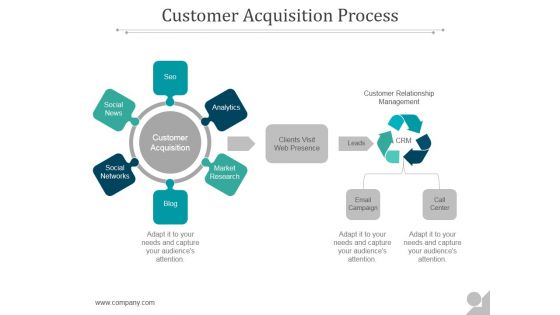
Customer Acquisition Process Ppt PowerPoint Presentation Graphics
This is a customer acquisition process ppt powerpoint presentation graphics. This is a six stage process. The stages in this process are customer acquisition, social news, social networks, blog, market research.
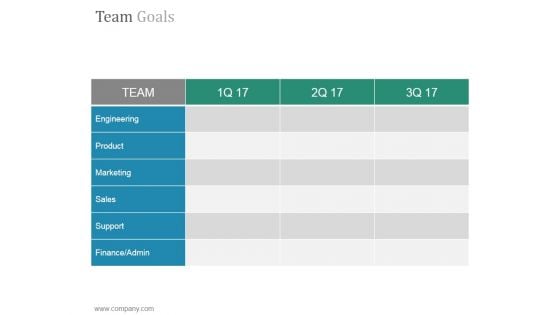
Team Goals Slide Ppt PowerPoint Presentation Tips
This is a team goals slide ppt powerpoint presentation tips. This is a six stage process. The stages in this process are engineering, product, marketing, sales, support, finance admin.
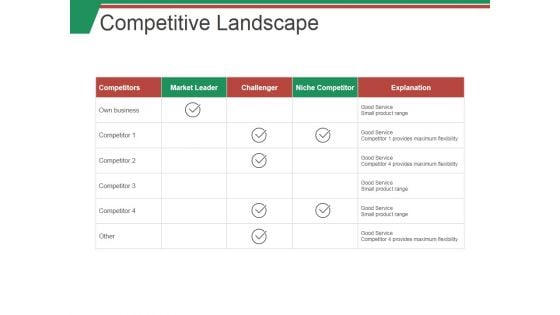
Competitive Landscape Ppt PowerPoint Presentation Pictures Microsoft
This is a competitive landscape ppt powerpoint presentation pictures microsoft. This is a four stage process. The stages in this process are competitors, market leader, challenger, niche competitor, explanation.
Evaluating Scores Ppt PowerPoint Presentation Icon Model
This is a evaluating scores ppt powerpoint presentation icon model. This is a eight stage process. The stages in this process are evaluator, strategic, product advantage, market attractiveness, leverage competencies.
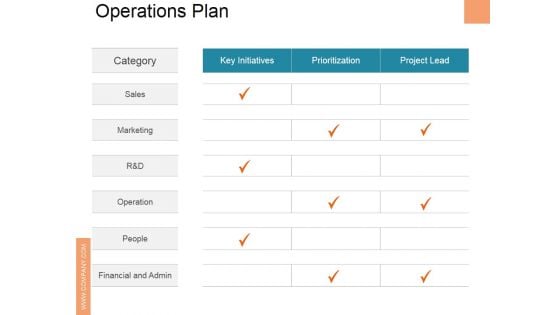
Operations Plan Ppt PowerPoint Presentation Pictures Example
This is a operations plan ppt powerpoint presentation pictures example. This is a three stage process. The stages in this process are key initiatives, prioritization, project lead, sales, marketing.
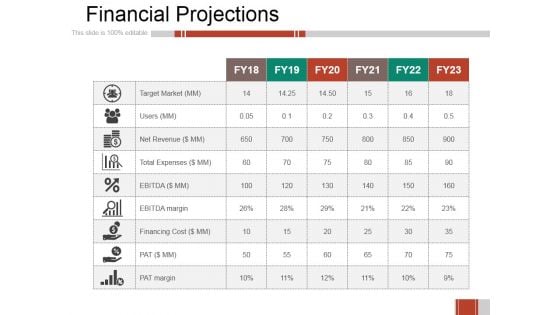
Financial Projections Ppt PowerPoint Presentation Styles Microsoft
This is a financial projections ppt powerpoint presentation styles microsoft. This is a six stage process. The stages in this process are target market, users, net revenue, total expenses, financing cost.
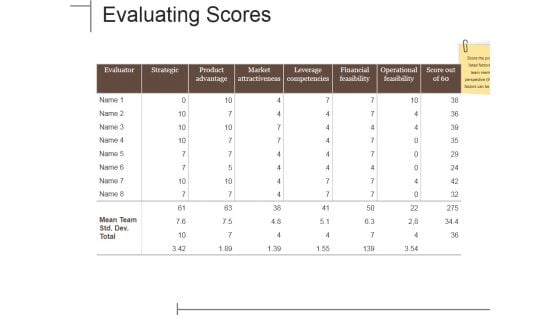
Evaluating Scores Ppt PowerPoint Presentation Infographics Rules
This is a evaluating scores ppt powerpoint presentation infographics rules. This is a seven stage process. The stages in this process are strategic, product advantage, market attractiveness, leverage competencies, financial feasibility, operational feasibility.
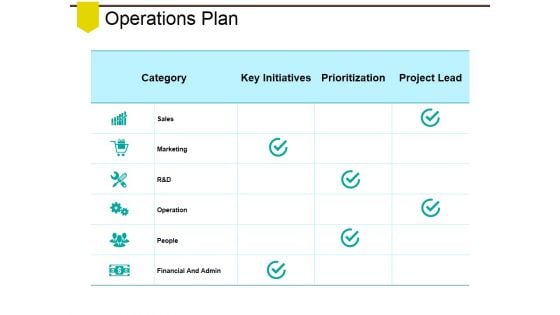
Operations Plan Ppt PowerPoint Presentation Model Samples
This is a operations plan ppt powerpoint presentation model samples. This is a three stage process. The stages in this process are sales, marketing, operation, people, financial and admin.
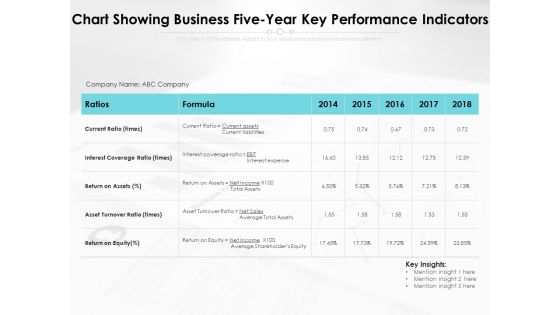
Chart Showing Business Five Year Key Performance Indicators Ppt PowerPoint Presentation File Infographics PDF
Presenting this set of slides with name chart showing business five year key performance indicators ppt powerpoint presentation file infographics pdf. The topics discussed in these slides are liabilities, equity, assets. This is a completely editable PowerPoint presentation and is available for immediate download. Download now and impress your audience.
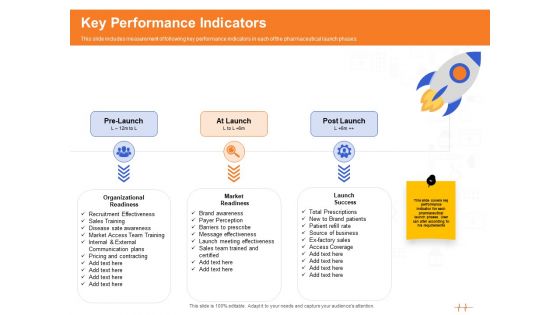
Wellness Program Promotion Key Performance Indicators Ppt PowerPoint Presentation Infographics Inspiration PDF
Presenting this set of slides with name wellness program promotion key performance indicators ppt powerpoint presentation infographics inspiration pdf. This is a three stage process. The stages in this process are pre launch, organizational, readiness, at launch, market, readiness, post launch, launch success. This is a completely editable PowerPoint presentation and is available for immediate download. Download now and impress your audience.
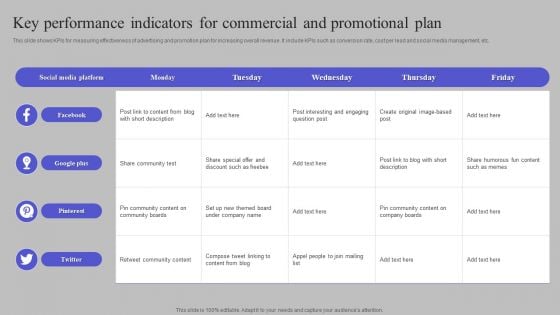
Key Performance Indicators For Commercial And Promotional Plan Information PDF
This slide shows KPIs for measuring effectiveness of advertising and promotion plan for increasing overall revenue. It include KPIs such as conversion rate, cost per lead and social media management, etc. Showcasing this set of slides titled Key Performance Indicators For Commercial And Promotional Plan Information PDF. The topics addressed in these templates are Facebook, Google Plus, Pinterest. All the content presented in this PPT design is completely editable. Download it and make adjustments in color, background, font etc. as per your unique business setting.
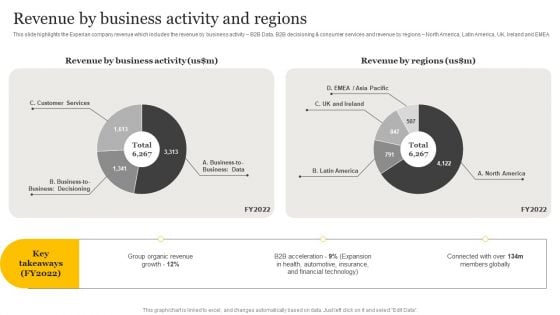
Customer Credit Reporting Company Outline Revenue By Business Activity And Regions Background PDF
This slide highlights the Experian company revenue which includes the revenue by business activity B2B Data, B2B decisioning and consumer services and revenue by regions North America, Latin America, UK, Ireland and EMEA. Welcome to our selection of the Customer Credit Reporting Company Outline Revenue By Business Activity And Regions Background PDF. These are designed to help you showcase your creativity and bring your sphere to life. Planning and Innovation are essential for any business that is just starting out. This collection contains the designs that you need for your everyday presentations. All of our PowerPoints are 100 percent editable, so you can customize them to suit your needs. This multi purpose template can be used in various situations. Grab these presentation templates today.
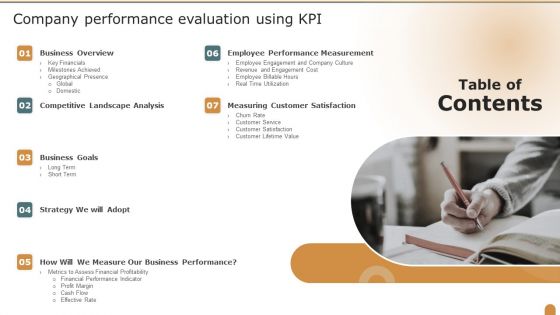
Table Of Contents Company Performance Evaluation Using KPI Infographics PDF
Presenting Table Of Contents Company Performance Evaluation Using KPI Infographics PDF to provide visual cues and insights. Share and navigate important information on seven stages that need your due attention. This template can be used to pitch topics like Business Overview, Business Goals, Competitive Landscape Analysis. In addtion, this PPT design contains high resolution images, graphics, etc, that are easily editable and available for immediate download.
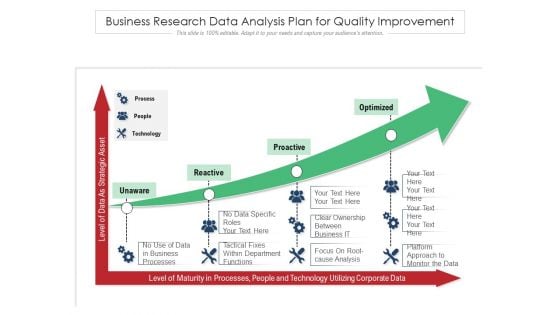
Business Research Data Analysis Plan For Quality Improvement Ppt PowerPoint Presentation File Visual Aids PDF
Presenting business research data analysis plan for quality improvement ppt powerpoint presentation file visual aids pdf to dispense important information. This template comprises four stages. It also presents valuable insights into the topics including unaware, reactive, proactive. This is a completely customizable PowerPoint theme that can be put to use immediately. So, download it and address the topic impactfully.
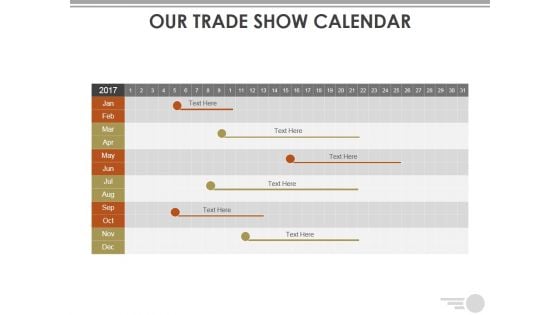
Our Trade Show Calendar Ppt PowerPoint Presentation Styles Tips
This is a our trade show calendar ppt powerpoint presentation styles tips. This is a six stage process. The stages in this process are table, data, analysis, marketing, business.
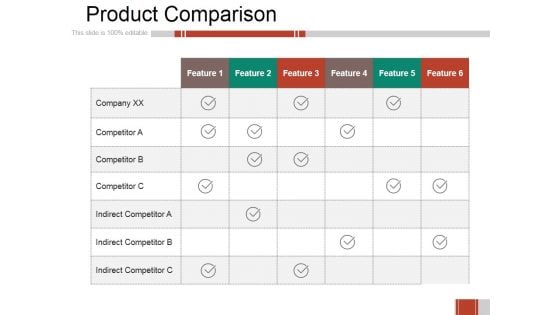
Product Comparison Ppt PowerPoint Presentation Visual Aids Gallery
This is a product comparison ppt powerpoint presentation visual aids gallery. This is a six stage process. The stages in this process are business, table, marketing, data analysis, feature.
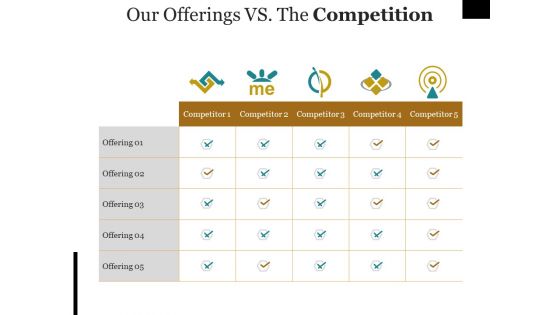
Our Offerings Vs The Competition Ppt PowerPoint Presentation Professional Grid
This is a our offerings vs the competition ppt powerpoint presentation professional grid. This is a five stage process. The stages in this process are tables, data, analysis, marketing, business.

Proposal For Data Analysis In Research Project Why Our Data Analytics Company One Pager Sample Example Document
Presenting you an exemplary Proposal For Data Analysis In Research Project Why Our Data Analytics Company One Pager Sample Example Document. Our one-pager comprises all the must-have essentials of an inclusive document. You can edit it with ease, as its layout is completely editable. With such freedom, you can tweak its design and other elements to your requirements. Download this Proposal For Data Analysis In Research Project Why Our Data Analytics Company One Pager Sample Example Document brilliant piece now.
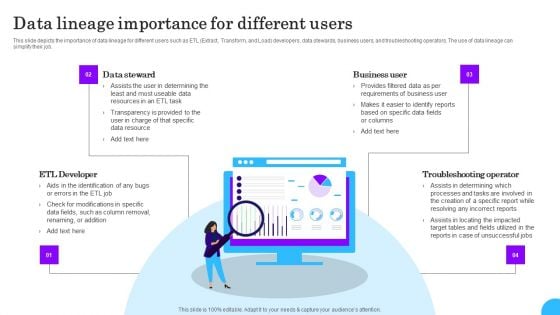
Comprehensive Analysis Of Different Data Lineage Classification Data Lineage Importance For Different Users Template PDF
This slide depicts the importance of data lineage for different users such as ETL Extract, Transform, and Load developers, data stewards, business users, and troubleshooting operators. The use of data lineage can simplify their job. Formulating a presentation can take up a lot of effort and time, so the content and message should always be the primary focus. The visuals of the PowerPoint can enhance the presenters message, so our Comprehensive Analysis Of Different Data Lineage Classification Data Lineage Importance For Different Users Template PDF was created to help save time. Instead of worrying about the design, the presenter can concentrate on the message while our designers work on creating the ideal templates for whatever situation is needed. Slidegeeks has experts for everything from amazing designs to valuable content, we have put everything into Comprehensive Analysis Of Different Data Lineage Classification Data Lineage Importance For Different Users Template PDF
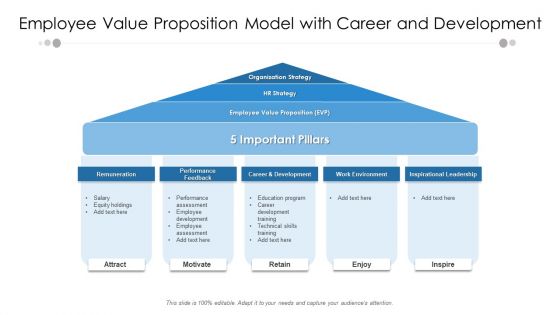
Employee Value Proposition Model With Career And Development Ppt PowerPoint Presentation Infographic Template Outline PDF
Persuade your audience using this employee value proposition model with career and development ppt powerpoint presentation infographic template outline pdf. This PPT design covers five stages, thus making it a great tool to use. It also caters to a variety of topics including remuneration, performance feedback, career and development, work environment, inspirational leadership. Download this PPT design now to present a convincing pitch that not only emphasizes the topic but also showcases your presentation skills.
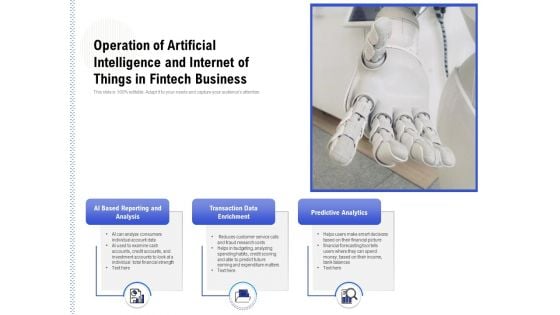
Operation Of Artificial Intelligence And Internet Of Things In Fintech Business Ppt PowerPoint Presentation Infographic Template Example File
Pitch your topic with ease and precision using this operation of artificial intelligence and internet of things in fintech business ppt powerpoint presentation infographic template example file. This layout presents information on ai based reporting and analysis, transaction data enrichment, predictive analytics. It is also available for immediate download and adjustment. So, changes can be made in the color, design, graphics or any other component to create a unique layout.
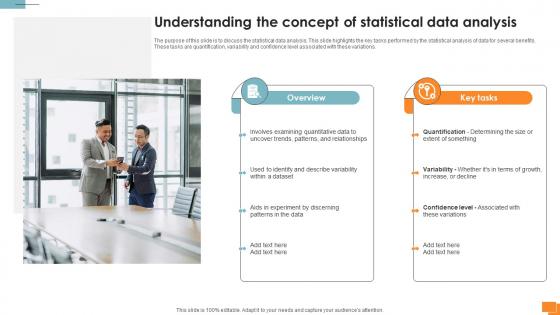
Statistical Tools For Evidence Understanding The Concept Of Statistical Data Analysis
The purpose of this slide is to discuss the statistical data analysis. This slide highlights the key tasks performed by the statistical analysis of data for several benefits. These tasks are quantification, variability and confidence level associated with these variations. Present like a pro with Statistical Tools For Evidence Understanding The Concept Of Statistical Data Analysis. Create beautiful presentations together with your team, using our easy-to-use presentation slides. Share your ideas in real-time and make changes on the fly by downloading our templates. So whether you are in the office, on the go, or in a remote location, you can stay in sync with your team and present your ideas with confidence. With Slidegeeks presentation got a whole lot easier. Grab these presentations today. The purpose of this slide is to discuss the statistical data analysis. This slide highlights the key tasks performed by the statistical analysis of data for several benefits. These tasks are quantification, variability and confidence level associated with these variations.
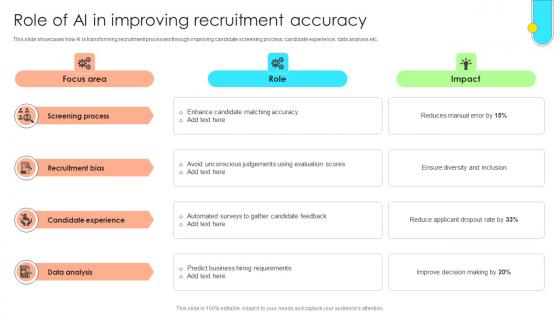
Data Driven Approach To Optimise Role Of Ai In Improving Recruitment Accuracy CRP SS V
This slide showcases how AI is transforming recruitment processes through improving candidate screening process, candidate experience, data analysis etc. Boost your pitch with our creative Data Driven Approach To Optimise Role Of Ai In Improving Recruitment Accuracy CRP SS V. Deliver an awe-inspiring pitch that will mesmerize everyone. Using these presentation templates you will surely catch everyones attention. You can browse the ppts collection on our website. We have researchers who are experts at creating the right content for the templates. So you do not have to invest time in any additional work. Just grab the template now and use them. This slide showcases how AI is transforming recruitment processes through improving candidate screening process, candidate experience, data analysis etc.
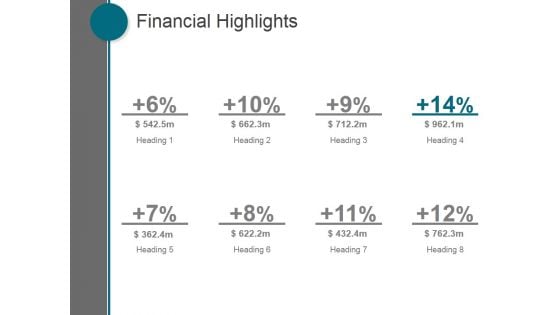
Financial Highlights Ppt PowerPoint Presentation Visual Aids
This is a financial highlights ppt powerpoint presentation visual aids. This is a eight stage process. The stages in this process are business, marketing, management, finance, strategy.
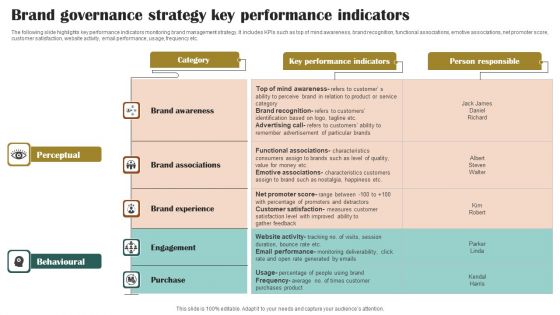
Brand Governance Strategy Key Performance Indicators Portrait PDF
The following slide highlights key performance indicators monitoring brand management strategy. It includes KPIs such as top of mind awareness, brand recognition, functional associations, emotive associations, net promoter score, customer satisfaction, website activity, email performance, usage, frequency etc. Pitch your topic with ease and precision using this Brand Governance Strategy Key Performance Indicators Portrait PDF. This layout presents information on Brand Awareness, Brand Associations, Brand Experience . It is also available for immediate download and adjustment. So, changes can be made in the color, design, graphics or any other component to create a unique layout.
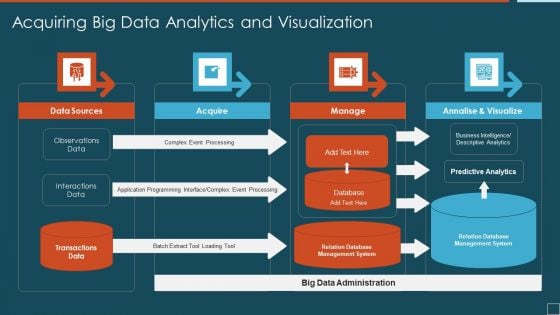
Acquiring Big Data Analytics And Visualization Ideas PDF
Presenting acquiring big data analytics and visualization ideas pdf to dispense important information. This template comprises four stages. It also presents valuable insights into the topics including data sources, acquire, manage. This is a completely customizable PowerPoint theme that can be put to use immediately. So, download it and address the topic impactfully.


 Continue with Email

 Home
Home


