Dashboards Summary
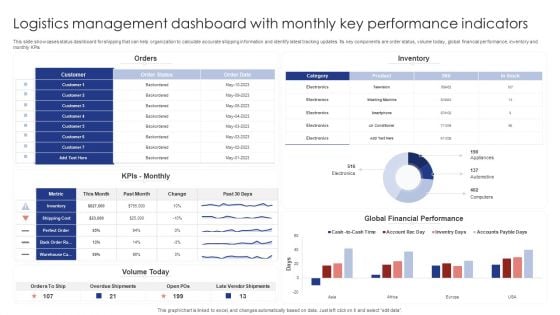
Logistics Management Dashboard With Monthly Key Performance Indicators Rules PDF
This slide showcases status dashboard for shipping that can help organization to calculate accurate shipping information and identify latest tracking updates. Its key components are order status, volume today, global financial performance, inventory and monthly KPIs. Pitch your topic with ease and precision using this Logistics Management Dashboard With Monthly Key Performance Indicators Rules PDF. This layout presents information on Orders, Inventory, Kpis Monthly. It is also available for immediate download and adjustment. So, changes can be made in the color, design, graphics or any other component to create a unique layout.
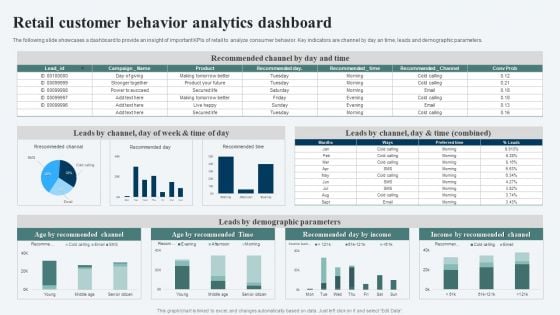
Retail Customer Behavior Analytics Dashboard Ppt Ideas Templates PDF
The following slide showcases a dashboard to provide an insight of important KPIs of retail to analyze consumer behavior. Key indicators are channel by day an time, leads and demographic parameters. Showcasing this set of slides titled Retail Customer Behavior Analytics Dashboard Ppt Ideas Templates PDF. The topics addressed in these templates are Recommended Channel, Leads Demographic Parameters, Income Recommended Channel. All the content presented in this PPT design is completely editable. Download it and make adjustments in color, background, font etc. as per your unique business setting.
Instagram Influencer Marketing Campaign Dashboard Ppt Icon Slide PDF
This slide represents key metrics dashboard to track and measure progress of Instagram influencer marketing campaign. It includes details related to KPIs such as impressions, likes, engagement rates etc. Explore a selection of the finest Instagram Influencer Marketing Campaign Dashboard Ppt Icon Slide PDF here. With a plethora of professionally designed and pre made slide templates, you can quickly and easily find the right one for your upcoming presentation. You can use our Instagram Influencer Marketing Campaign Dashboard Ppt Icon Slide PDF to effectively convey your message to a wider audience. Slidegeeks has done a lot of research before preparing these presentation templates. The content can be personalized and the slides are highly editable. Grab templates today from Slidegeeks.

Internal Audit Metrics Analysis Dashboard Ppt Ideas Clipart Images PDF
This slide depicts the key performance indicator dashboard and status for internal audit. It includes information related to the audit observations and plan status. Pitch your topic with ease and precision using this Internal Audit Metrics Analysis Dashboard Ppt Ideas Clipart Images PDF. This layout presents information on Quarterly Audit Observations, Financial Year Internal, Audit Plan Status. It is also available for immediate download and adjustment. So, changes can be made in the color, design, graphics or any other component to create a unique layout.
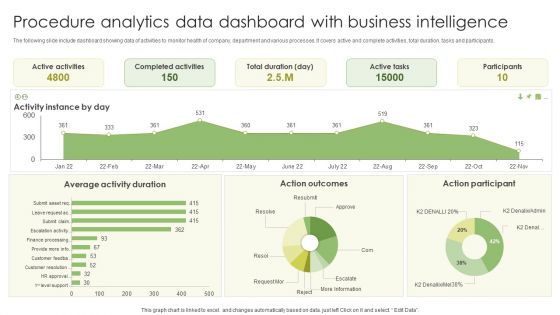
Procedure Analytics Data Dashboard With Business Intelligence Slides PDF
The following slide include dashboard showing data of activities to monitor health of company, department and various processes. It covers active and complete activities, total duration, tasks and participants. Pitch your topic with ease and precision using this Procedure Analytics Data Dashboard With Business Intelligence Slides PDF. This layout presents information on Active Activities, Completed Activities, Active Tasks . It is also available for immediate download and adjustment. So, changes can be made in the color, design, graphics or any other component to create a unique layout.
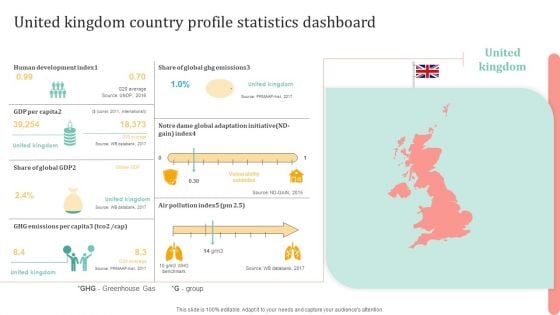
United Kingdom Country Profile Statistics Dashboard Ppt Show Layout PDF
Presenting United Kingdom Country Profile Statistics Dashboard Ppt Show Layout PDF to dispense important information. This template comprises one stages. It also presents valuable insights into the topics including Human Development Index, GDP Per Capita, GHG Emissions. This is a completely customizable PowerPoint theme that can be put to use immediately. So, download it and address the topic impactfully.
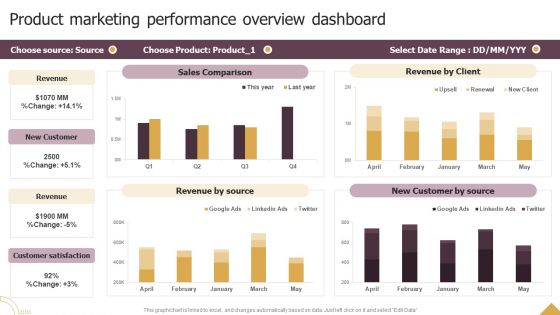
Product Marketing Performance Overview Dashboard Ppt Portfolio Professional PDF
The best PPT templates are a great way to save time, energy, and resources. Slidegeeks have 100 percent editable powerpoint slides making them incredibly versatile. With these quality presentation templates, you can create a captivating and memorable presentation by combining visually appealing slides and effectively communicating your message. Download Product Marketing Performance Overview Dashboard Ppt Portfolio Professional PDF from Slidegeeks and deliver a wonderful presentation.
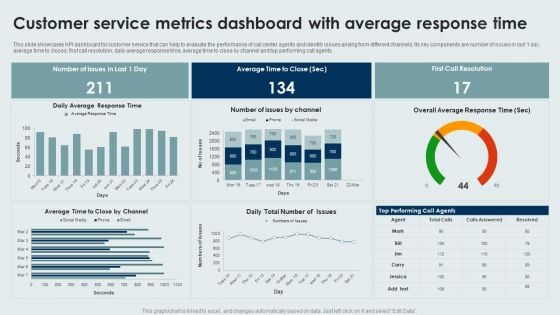
Customer Service Metrics Dashboard With Average Response Time Formats PDF
This slide showcases KPI dashboard for customer service that can help to evaluate the performance of call center agents and identify issues arising from different channels. Its key components are number of issues in last 1 day, average time to closes, first call resolution, daily average response time, average time to close by channel and top performing call agents. Pitch your topic with ease and precision using this Customer Service Metrics Dashboard With Average Response Time Formats PDF. This layout presents information on Customer Service, Metrics Dashboard, Average Response Time. It is also available for immediate download and adjustment. So, changes can be made in the color, design, graphics or any other component to create a unique layout.
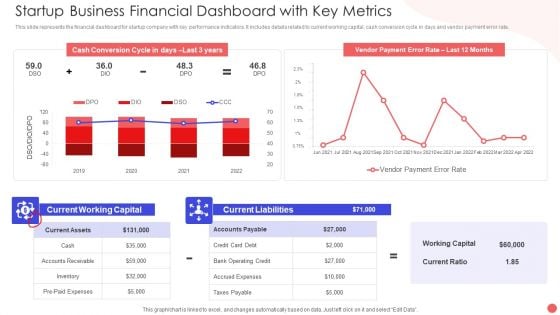
Startup Business Financial Dashboard With Key Metrics Sample PDF
This slide represents the financial dashboard for startup company with key performance indicators. It includes details related to current working capital, cash conversion cycle in days and vendor payment error rate. Pitch your topic with ease and precision using this Startup Business Financial Dashboard With Key Metrics Sample PDF. This layout presents information on Cash Conversion Cycle, Current Working Capital, Current Liabilities Debt. It is also available for immediate download and adjustment. So, changes can be made in the color, design, graphics or any other component to create a unique layout.
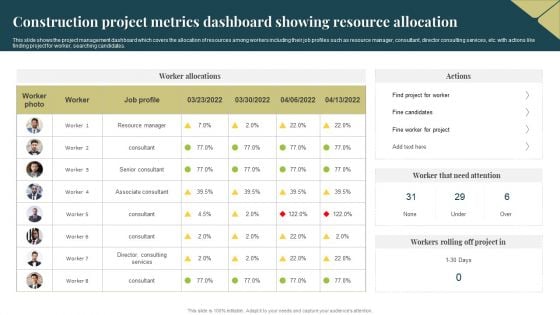
Construction Project Metrics Dashboard Showing Resource Allocation Professional PDF
This slide shows the project management dashboard which covers the allocation of resources among workers including their job profiles such as resource manager, consultant, director consulting services, etc. with actions like finding project for worker, searching candidates. Showcasing this set of slides titled Construction Project Metrics Dashboard Showing Resource Allocation Professional PDF. The topics addressed in these templates are Resource Manager, Services, Project. All the content presented in this PPT design is completely editable. Download it and make adjustments in color, background, font etc. as per your unique business setting.

Project Metrics Dashboard Depicting Weekly Schedule Graphics PDF
This slide focuses on project management dashboard which shows the activities scheduled for one month such as demo task for resource management, meeting regarding onboarding process, long term support for personnel, weekly meetups, to do list for next month, etc. Showcasing this set of slides titled Project Metrics Dashboard Depicting Weekly Schedule Graphics PDF. The topics addressed in these templates are Equipment, Sales Activity, Resource. All the content presented in this PPT design is completely editable. Download it and make adjustments in color, background, font etc. as per your unique business setting.
HR Strategic Employee Talent Management Procedure Tracking Dashboard Brochure PDF
This slide shows the dashboard of human resource department for tracking the strategies implemented for management and measurement of performance of the organizational employees. It includes details related to strategic growth, retention and engagement of employees, their career development and business growth rates. Showcasing this set of slides titled HR Strategic Employee Talent Management Procedure Tracking Dashboard Brochure PDF. The topics addressed in these templates are Enable Engaging Careers, Grow Strategically, Enable Business Growth. All the content presented in this PPT design is completely editable. Download it and make adjustments in color, background, font etc. as per your unique business setting.
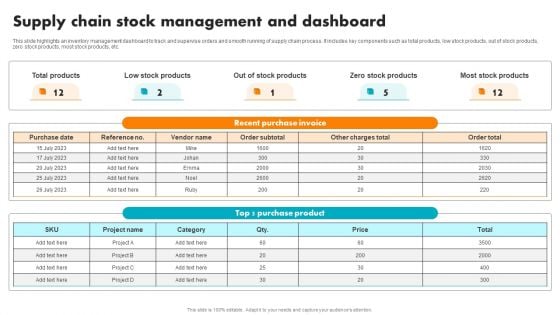
Supply Chain Stock Management And Dashboard Inspiration PDF
This slide highlights an inventory management dashboard to track and supervise orders and smooth running of supply chain process. It includes key components such as total products, low stock products, out of stock products, zero stock products, most stock products, etc. Showcasing this set of slides titled Supply Chain Stock Management And Dashboard Inspiration PDF. The topics addressed in these templates are Low Stock Products, Out Of Stock Products, Zero Stock Products, Most Stock Products. All the content presented in this PPT design is completely editable. Download it and make adjustments in color, background, font etc. as per your unique business setting.
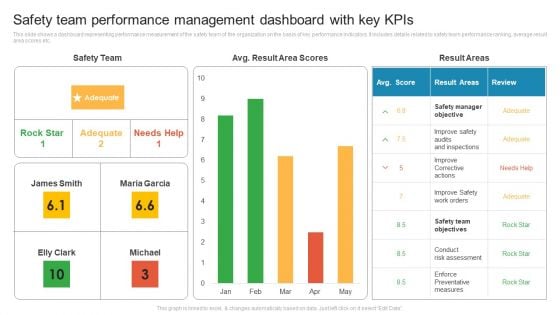
Safety Team Performance Management Dashboard With Key Kpis Rules PDF
This slide shows a dashboard representing performance measurement of the safety team of the organization on the basis of key performance indicators. It includes details related to safety team performance ranking, average result area scores etc. Pitch your topic with ease and precision using this Safety Team Performance Management Dashboard With Key Kpis Rules PDF. This layout presents information on Improve Corrective Actions, Safety Manager Objective, Conduct Risk Assessment. It is also available for immediate download and adjustment. So, changes can be made in the color, design, graphics or any other component to create a unique layout.
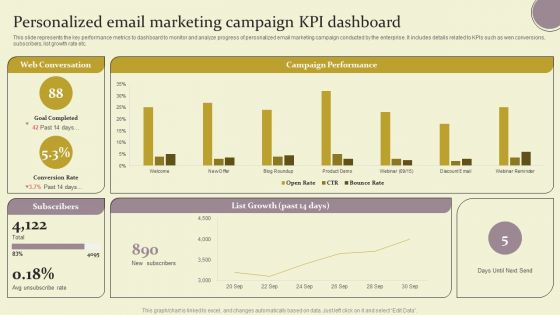
Personalized Email Marketing Campaign KPI Dashboard Ppt Professional Ideas PDF
This slide represents the key performance metrics to dashboard to monitor and analyze progress of personalized email marketing campaign conducted by the enterprise. It includes details related to KPIs such as wen conversions, subscribers, list growth rate etc. Do you have to make sure that everyone on your team knows about any specific topic I yes, then you should give Personalized Email Marketing Campaign KPI Dashboard Ppt Professional Ideas PDF a try. Our experts have put a lot of knowledge and effort into creating this impeccable Personalized Email Marketing Campaign KPI Dashboard Ppt Professional Ideas PDF. You can use this template for your upcoming presentations, as the slides are perfect to represent even the tiniest detail. You can download these templates from the Slidegeeks website and these are easy to edit. So grab these today.
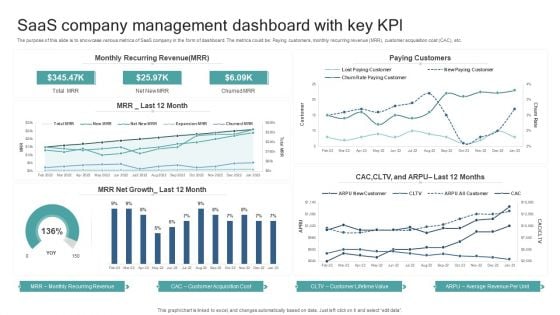
Saas Company Management Dashboard With Key Kpl Template PDF
The purpose of this slide is to showcase various metrics of SaaS company in the form of dashboard. The metrics could be, Paying customers, monthly recurring revenue MRR, customer acquisition cost CAC, etc. Showcasing this set of slides titled Saas Company Management Dashboard With Key Kpl Template PDF. The topics addressed in these templates are Monthly Recurring Revenue, Customer Acquisition Cost, Customer Lifetime Value, Average Revenue Per Unit. All the content presented in this PPT design is completely editable. Download it and make adjustments in color, background, font etc. as per your unique business setting.
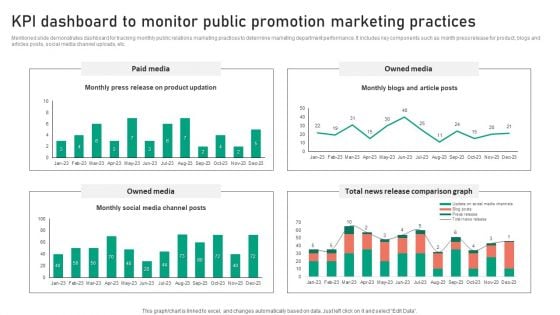
KPI Dashboard To Monitor Public Promotion Marketing Practices Template PDF
Mentioned slide demonstrates dashboard for tracking monthly public relations marketing practices to determine marketing department performance. It includes key components such as month press release for product, blogs and articles posts, social media channel uploads, etc. Pitch your topic with ease and precision using this KPI Dashboard To Monitor Public Promotion Marketing Practices Template PDF. This layout presents information on Paid Media, Owned Media, Total News Release, Comparison Graph. It is also available for immediate download and adjustment. So, changes can be made in the color, design, graphics or any other component to create a unique layout.
Logistics Management Time Tracking Dashboard With Warehousing Costs Template PDF
This slide showcases shipping dashboard that can help company to deliver the products in stipulated time and keep warehousing operating expenses within pre decided budget. Its also displays perfect order rate and total shipments by country. Pitch your topic with ease and precision using this Logistics Management Time Tracking Dashboard With Warehousing Costs Template PDF. This layout presents information on Warehouse Operating Costs, Perfect Order Rate, On Time Shipments. It is also available for immediate download and adjustment. So, changes can be made in the color, design, graphics or any other component to create a unique layout.
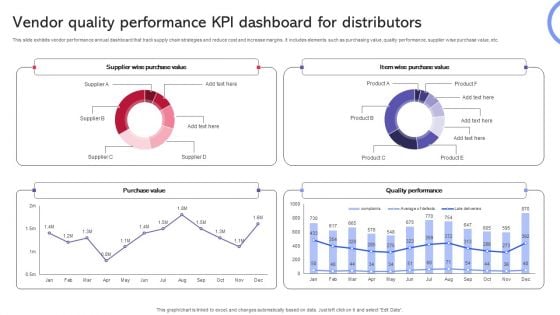
Vendor Quality Performance KPI Dashboard For Distributors Template PDF
This slide exhibits vendor performance annual dashboard that track supply chain strategies and reduce cost and increase margins. It includes elements such as purchasing value, quality performance, supplier wise purchase value, etc. Pitch your topic with ease and precision using this Vendor Quality Performance KPI Dashboard For Distributors Template PDF. This layout presents information on Purchase Value, Quality Performance, Supplier Wise Purchase Value. It is also available for immediate download and adjustment. So, changes can be made in the color, design, graphics or any other component to create a unique layout.
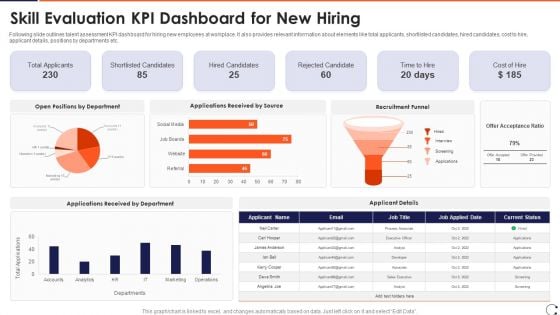
Skill Evaluation KPI Dashboard For New Hiring Download PDF
Following slide outlines talent assessment KPI dashboard for hiring new employees at workplace. It also provides relevant information about elements like total applicants, shortlisted candidates, hired candidates, cost to hire, applicant details, positions by departments etc.Showcasing this set of slides titled Skill Evaluation KPI Dashboard For New Hiring Download PDF The topics addressed in these templates are Hired Candidates, Rejected Candidate, Shortlisted Candidates All the content presented in this PPT design is completely editable. Download it and make adjustments in color, background, font etc. as per your unique business setting.
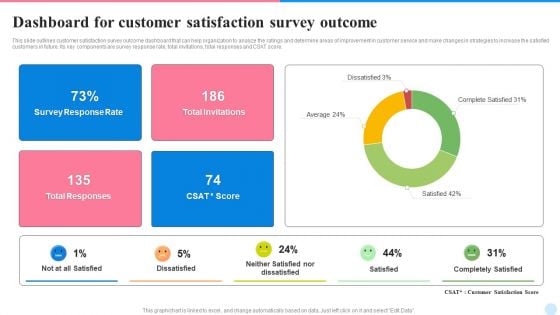
Dashboard For Customer Satisfaction Survey Outcome Demonstration PDF
This slide outlines customer satisfaction survey outcome dashboard that can help organization to analyze the ratings and determine areas of improvement in customer service and make changes in strategies to increase the satisfied customers in future. Its key components are survey response rate, total invitations, total responses and CSAT score. Showcasing this set of slides titled Dashboard For Customer Satisfaction Survey Outcome Demonstration PDF. The topics addressed in these templates are Total Invitations, Survey Response Rate, Total Responses. All the content presented in this PPT design is completely editable. Download it and make adjustments in color, background, font etc. as per your unique business setting.
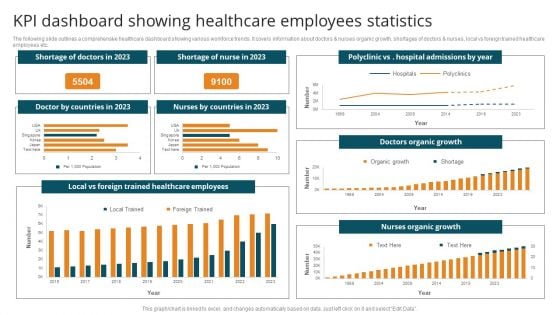
KPI Dashboard Showing Healthcare Employees Statistics Graphics PDF
The following slide outlines a comprehensive healthcare dashboard showing various workforce trends. It covers information about doctors and nurses organic growth, shortages of doctors nurses, local vs foreign trained healthcare employees etc. Showcasing this set of slides titled KPI Dashboard Showing Healthcare Employees Statistics Graphics PDF. The topics addressed in these templates are Shortage Doctors, Shortage Nurse, Organic Growth. All the content presented in this PPT design is completely editable. Download it and make adjustments in color, background, font etc. as per your unique business setting.
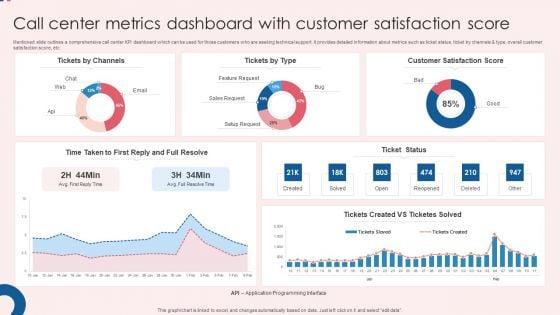
Call Center Metrics Dashboard With Customer Satisfaction Score Ideas PDF
Mentioned slide outlines a comprehensive call center KPI dashboard which can be used for those customers who are seeking technical support. It provides detailed information about metrics such as ticket status, ticket by channels and type, overall customer satisfaction score, etc. Showcasing this set of slides titled Call Center Metrics Dashboard With Customer Satisfaction Score Ideas PDF. The topics addressed in these templates are Customer Satisfaction, Score Ticket Status, Satisfaction Score. All the content presented in this PPT design is completely editable. Download it and make adjustments in color, background, font etc. as per your unique business setting.
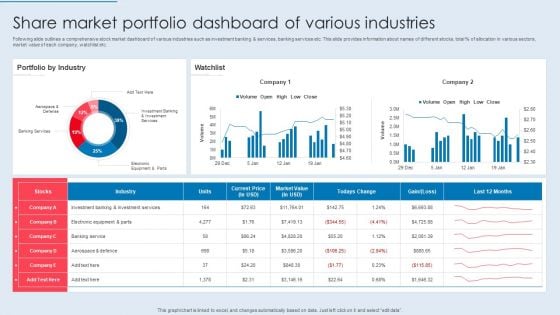
Share Market Portfolio Dashboard Of Various Industries Graphics PDF
Following slide outlines a comprehensive stock market dashboard of various industries such as investment banking and services, banking services etc. This slide provides information about names of different stocks, total percent of allocation in various sectors, market value of each company, watchlist etc. Showcasing this set of slides titled Share Market Portfolio Dashboard Of Various Industries Graphics PDF. The topics addressed in these templates are Portfolio By Industry, Watchlist, Various Industries. All the content presented in this PPT design is completely editable. Download it and make adjustments in color, background, font etc. as per your unique business setting.
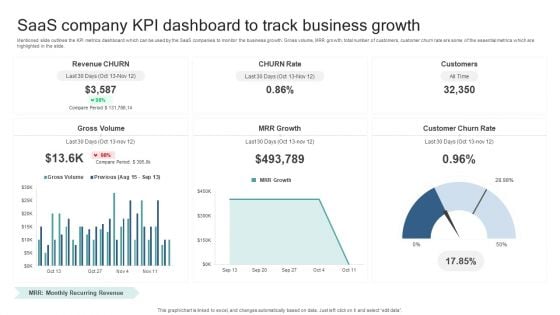
Saas Company KPI Dashboard To Track Business Growth Guidelines PDF
Mentioned slide outlines the KPI metrics dashboard which can be used by the SaaS companies to monitor the business growth. Gross volume, MRR growth, total number of customers, customer churn rate are some of the essential metrics which are highlighted in the slide. Showcasing this set of slides titled Saas Company KPI Dashboard To Track Business Growth Guidelines PDF. The topics addressed in these templates are Gross Volume, Mrr Growth, Customer Churn Rate. All the content presented in this PPT design is completely editable. Download it and make adjustments in color, background, font etc. as per your unique business setting.
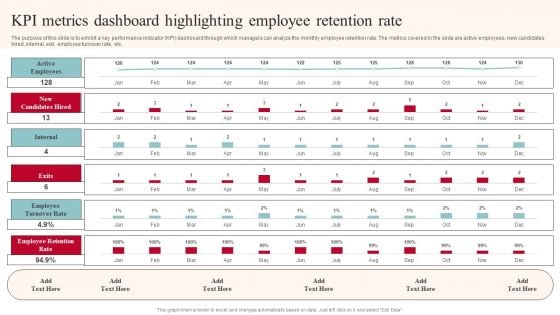
KPI Metrics Dashboard Highlighting Employee Retention Rate Structure PDF
The purpose of this slide is to exhibit a key performance indicator KPI dashboard through which managers can analyze the monthly employee retention rate. The metrics covered in the slide are active employees, new candidates hired, internal, exit, employee turnover rate, etc. Do you have to make sure that everyone on your team knows about any specific topic I yes, then you should give KPI Metrics Dashboard Highlighting Employee Retention Rate Structure PDF a try. Our experts have put a lot of knowledge and effort into creating this impeccable KPI Metrics Dashboard Highlighting Employee Retention Rate Structure PDF. You can use this template for your upcoming presentations, as the slides are perfect to represent even the tiniest detail. You can download these templates from the Slidegeeks website and these are easy to edit. So grab these today.
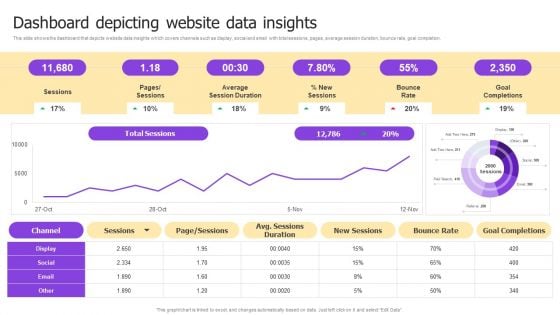
Implementing Brand Development Dashboard Depicting Website Data Insights Guidelines PDF
This slide shows the dashboard that depicts website data insights which covers channels such as display, social and email with total sessions, pages, average session duration, bounce rate, goal completion. Get a simple yet stunning designed Implementing Brand Development Dashboard Depicting Website Data Insights Guidelines PDF. It is the best one to establish the tone in your meetings. It is an excellent way to make your presentations highly effective. So, download this PPT today from Slidegeeks and see the positive impacts. Our easy-to-edit Implementing Brand Development Dashboard Depicting Website Data Insights Guidelines PDF can be your go-to option for all upcoming conferences and meetings. So, what are you waiting for Grab this template today.
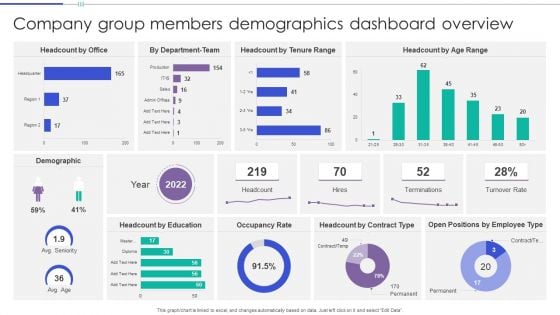
Company Group Members Demographics Dashboard Overview Clipart PDF
This graph or chart is linked to excel, and changes automatically based on data. Just left click on it and select Edit Data. Pitch your topic with ease and precision using this Company Group Members Demographics Dashboard Overview Clipart PDF. This layout presents information on Headcount Office, Headcount Tenure Range, Headcount Age Range. It is also available for immediate download and adjustment. So, changes can be made in the color, design, graphics or any other component to create a unique layout.
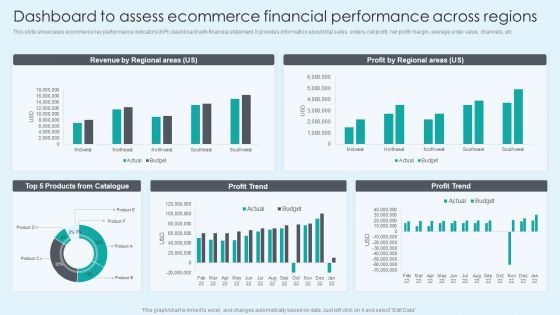
Dashboard To Assess Ecommerce Financial Performance Across Regions Themes PDF
This slide showcases ecommerce key performance indicators KPI dashboard with financial statement. It provides information about total sales, orders, net profit, net profit margin, average order value, channels, etc. Here you can discover an assortment of the finest PowerPoint and Google Slides templates. With these templates, you can create presentations for a variety of purposes while simultaneously providing your audience with an eye catching visual experience. Download Dashboard To Assess Ecommerce Financial Performance Across Regions Themes PDF to deliver an impeccable presentation. These templates will make your job of preparing presentations much quicker, yet still, maintain a high level of quality. Slidegeeks has experienced researchers who prepare these templates and write high quality content for you. Later on, you can personalize the content by editing the Dashboard To Assess Ecommerce Financial Performance Across Regions Themes PDF.
DSS Software Program Augmented Intelligence Information Tracking Dashboard Background PDF
This slide depicts the information tracking dashboard by augmented intelligence model covering the data analysis. Data analysis includes image analysis, storage size, new users on the cloud platform, etc. Do you have to make sure that everyone on your team knows about any specific topic I yes, then you should give DSS Software Program Augmented Intelligence Information Tracking Dashboard Background PDF a try. Our experts have put a lot of knowledge and effort into creating this impeccable DSS Software Program Augmented Intelligence Information Tracking Dashboard Background PDF. You can use this template for your upcoming presentations, as the slides are perfect to represent even the tiniest detail. You can download these templates from the Slidegeeks website and these are easy to edit. So grab these today.
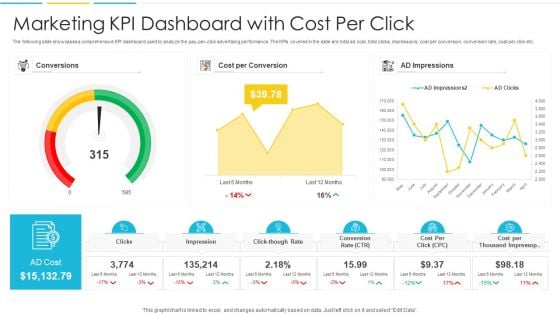
Marketing KPI Dashboard With Cost Per Click Infographics PDF
The following slide showcases a comprehensive KPI dashboard used to analyze the pay-per-click advertising performance. The KPIs covered in the slide are total ad cost, total clicks, impressions, cost per conversion, conversion rate, cost per click etc. Pitch your topic with ease and precision using this Marketing KPI Dashboard With Cost Per Click Infographics PDF. This layout presents information on Conversions, Cost, Impressions. It is also available for immediate download and adjustment. So, changes can be made in the color, design, graphics or any other component to create a unique layout.
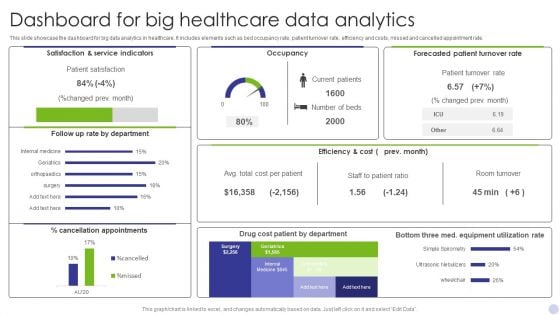
Dashboard For Big Healthcare Data Analytics Graphics PDF
This slide showcase the dashboard for big data analytics in healthcare. It includes elements such as bed occupancy rate, patient turnover rate, efficiency and costs, missed and cancelled appointment rate. Showcasing this set of slides titled Dashboard For Big Healthcare Data Analytics Graphics PDF. The topics addressed in these templates are Satisfaction Service Indicators, Occupancy, Forecasted Patient Turnover. All the content presented in this PPT design is completely editable. Download it and make adjustments in color, background, font etc. as per your unique business setting.
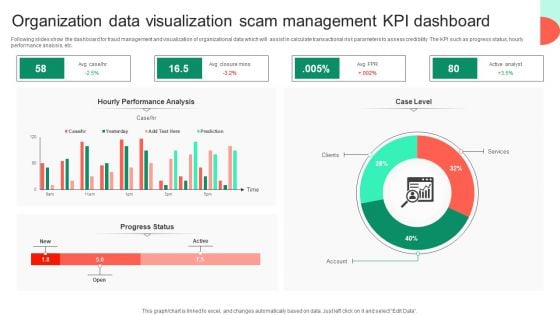
Organization Data Visualization Scam Management KPI Dashboard Rules PDF
Following slides show the dashboard for fraud management and visualization of organizational data which will assist in calculate transactional risk parameters to assess credibility. The KPI such as progress status, hourly performance analysis, etc. Showcasing this set of slides titled Organization Data Visualization Scam Management KPI Dashboard Rules PDF. The topics addressed in these templates are Hourly Performance Analysis, Services, Organization Data Visualization. All the content presented in this PPT design is completely editable. Download it and make adjustments in color, background, font etc. as per your unique business setting.
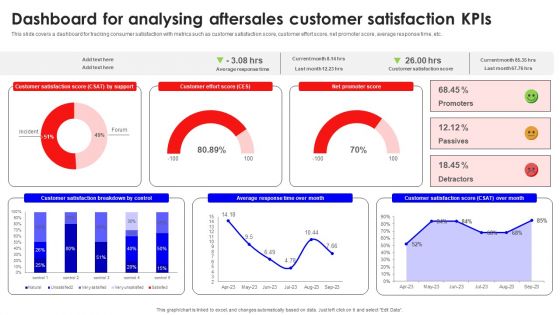
Dashboard For Analysing Aftersales Customer Satisfaction Kpis Mockup PDF
This slide covers a dashboard for tracking consumer satisfaction with metrics such as customer satisfaction score, customer effort score, net promoter score, average response time, etc. Are you searching for a Dashboard For Analysing Aftersales Customer Satisfaction Kpis Mockup PDF that is uncluttered, straightforward, and original Its easy to edit, and you can change the colors to suit your personal or business branding. For a presentation that expresses how much effort you have put in, this template is ideal With all of its features, including tables, diagrams, statistics, and lists, its perfect for a business plan presentation. Make your ideas more appealing with these professional slides. Download Dashboard For Analysing Aftersales Customer Satisfaction Kpis Mockup PDF from Slidegeeks today.
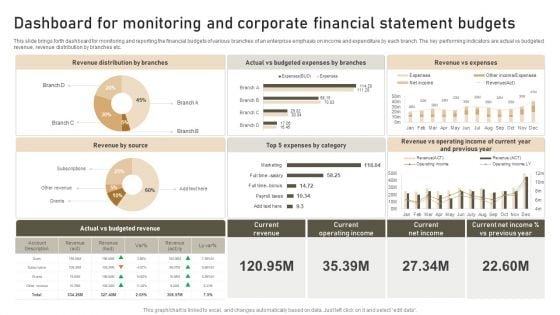
Dashboard For Monitoring And Corporate Financial Statement Budgets Template PDF
This slide brings forth dashboard for monitoring and reporting the financial budgets of various branches of an enterprise emphasis on income and expenditure by each branch. The key performing indicators are actual vs budgeted revenue, revenue distribution by branches etc. Showcasing this set of slides titled Dashboard For Monitoring And Corporate Financial Statement Budgets Template PDF. The topics addressed in these templates are Revenue Distribution, Revenue Source, Revenue Expenses. All the content presented in this PPT design is completely editable. Download it and make adjustments in color, background, font etc. as per your unique business setting.
Website Performance Tracking And Monitoring Dashboard Ppt Slides Files PDF
The following slide showcases a dashboard to track and measure website performance. It includes key elements such as visits, average session duration, bounce rate, page views, goal conversion, visits by week, traffic sources, top channels by conversions, etc. Whether you have daily or monthly meetings, a brilliant presentation is necessary. Website Performance Tracking And Monitoring Dashboard Ppt Slides Files PDF can be your best option for delivering a presentation. Represent everything in detail using Website Performance Tracking And Monitoring Dashboard Ppt Slides Files PDF and make yourself stand out in meetings. The template is versatile and follows a structure that will cater to your requirements. All the templates prepared by Slidegeeks are easy to download and edit. Our research experts have taken care of the corporate themes as well. So, give it a try and see the results.
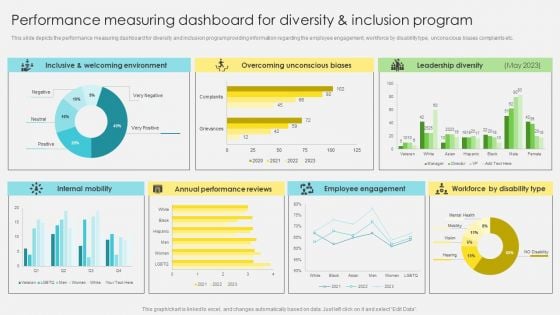
Performance Measuring Dashboard For Diversity And Inclusion Program Template PDF
This slide depicts the performance measuring dashboard for diversity and inclusion program providing information regarding the employee engagement, workforce by disability type, unconscious biases complaints etc. The Performance Measuring Dashboard For Diversity And Inclusion Program Template PDF is a compilation of the most recent design trends as a series of slides. It is suitable for any subject or industry presentation, containing attractive visuals and photo spots for businesses to clearly express their messages. This template contains a variety of slides for the user to input data, such as structures to contrast two elements, bullet points, and slides for written information. Slidegeeks is prepared to create an impression.
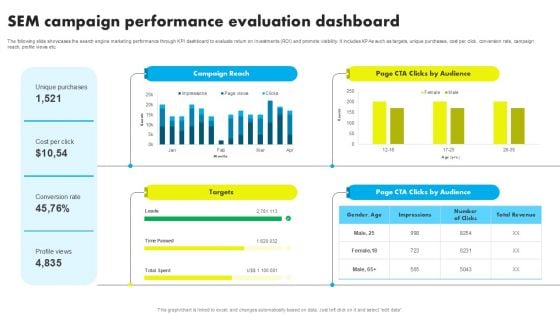
SEM Campaign Performance Evaluation Dashboard Ppt Icon Graphics Tutorials PDF
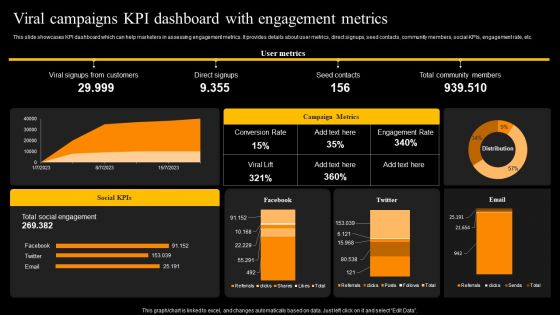
Viral Campaigns Kpi Dashboard With Engagement Metrics Template PDF
This slide showcases KPI dashboard which can help marketers in assessing engagement metrics. It provides details about user metrics, direct signups, seed contacts, community members, social KPIs, engagement rate, etc. Want to ace your presentation in front of a live audience Our Viral Campaigns Kpi Dashboard With Engagement Metrics Template PDF can help you do that by engaging all the users towards you. Slidegeeks experts have put their efforts and expertise into creating these impeccable powerpoint presentations so that you can communicate your ideas clearly. Moreover, all the templates are customizable, and easy to edit and downloadable. Use these for both personal and commercial use.
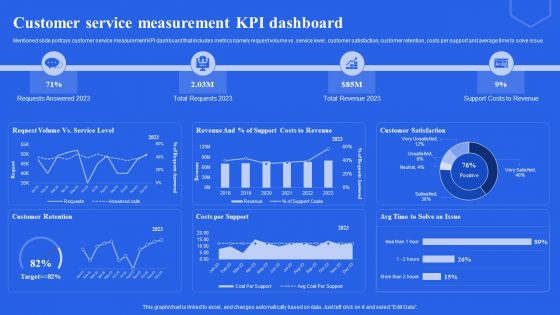
Customer Service Measurement KPI Dashboard Ppt File Portfolio PDF
Mentioned slide portrays customer service measurement KPI dashboard that includes metrics namely request volume vs. service level, customer satisfaction, customer retention, costs per support and average time to solve issue. Do you have to make sure that everyone on your team knows about any specific topic I yes, then you should give Customer Service Measurement KPI Dashboard Ppt File Portfolio PDF a try. Our experts have put a lot of knowledge and effort into creating this impeccable Customer Service Measurement KPI Dashboard Ppt File Portfolio PDF. You can use this template for your upcoming presentations, as the slides are perfect to represent even the tiniest detail. You can download these templates from the Slidegeeks website and these are easy to edit. So grab these today.
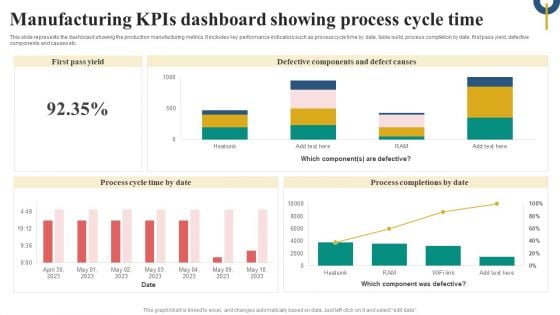
Manufacturing Kpis Dashboard Showing Process Cycle Time Microsoft PDF
This slide represents the dashboard showing the production manufacturing metrics. It includes key performance indicators such as process cycle time by date, table build, process completion by date, first pass yield, defective components and causes etc. Pitch your topic with ease and precision using this Manufacturing Kpis Dashboard Showing Process Cycle Time Microsoft PDF. This layout presents information on Defective Components Defect Causes, Process Cycle, Time By Date, Process Completions By Date. It is also available for immediate download and adjustment. So, changes can be made in the color, design, graphics or any other component to create a unique layout.
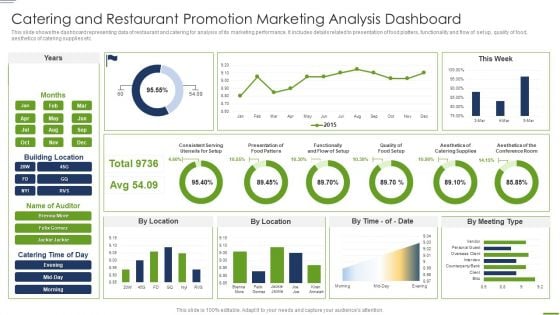
Catering And Restaurant Promotion Marketing Analysis Dashboard Graphics PDF
This slide shows the dashboard representing data of restaurant and catering for analysis of its marketing performance. It includes details related to presentation of food platters, functionality and flow of set up, quality of food, aesthetics of catering supplies etc.Showcasing this set of slides titled Catering And Restaurant Promotion Marketing Analysis Dashboard Graphics PDF The topics addressed in these templates are Consistent Serving, Functionally, Quality Food All the content presented in this PPT design is completely editable. Download it and make adjustments in color, background, font etc. as per your unique business setting.
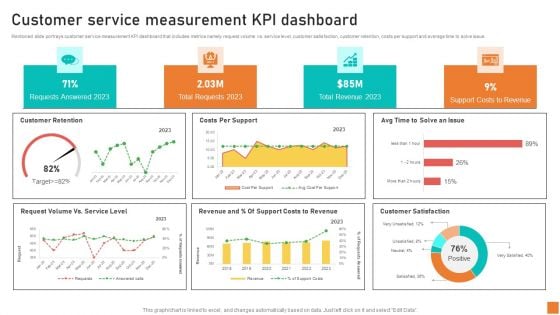
Customer Service Measurement KPI Dashboard Ppt Infographics Themes PDF
Mentioned slide portrays customer service measurement KPI dashboard that includes metrics namely request volume vs. service level, customer satisfaction, customer retention, costs per support and average time to solve issue. If your project calls for a presentation, then Slidegeeks is your go-to partner because we have professionally designed, easy-to-edit templates that are perfect for any presentation. After downloading, you can easily edit Customer Service Measurement KPI Dashboard Ppt Infographics Themes PDF and make the changes accordingly. You can rearrange slides or fill them with different images. Check out all the handy templates
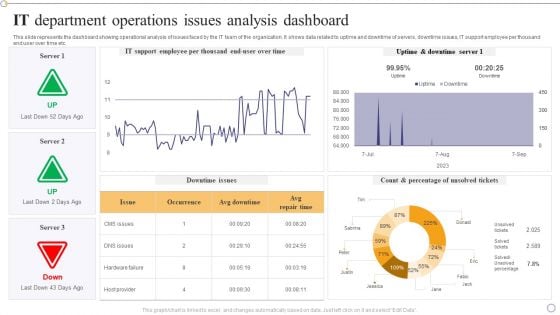
IT Department Operations Issues Analysis Dashboard Designs PDF
This slide represents the dashboard showing operational analysis of issues faced by the IT team of the organization. It shows data related to uptime and downtime of servers, downtime issues, IT support employee per thousand end user over time etc.Pitch your topic with ease and precision using this IT Department Operations Issues Analysis Dashboard Designs PDF. This layout presents information on Support Employee, Uptime Downtime, Percentage Unsolved. It is also available for immediate download and adjustment. So, changes can be made in the color, design, graphics or any other component to create a unique layout.
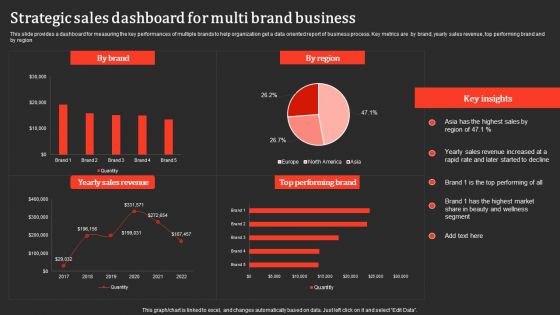
Strategic Sales Dashboard For Multi Brand Business Professional PDF
This slide provides a dashboard for measuring the key performances of multiple brands to help organization get a data oriented report of business process. Key metrics are by brand, yearly sales revenue, top performing brand and by region. Pitch your topic with ease and precision using this Strategic Sales Dashboard For Multi Brand Business Professional PDF. This layout presents information on Yearly Sales Revenue, Performing Brand. It is also available for immediate download and adjustment. So, changes can be made in the color, design, graphics or any other component to create a unique layout.
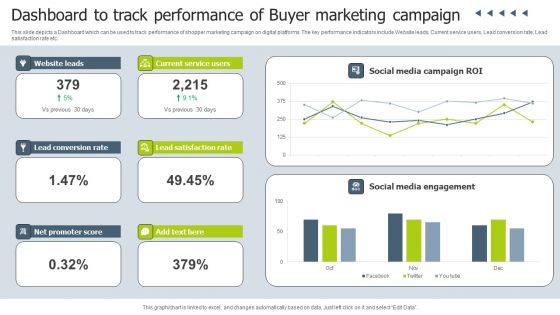
Dashboard To Track Performance Of Buyer Marketing Campaign Infographics PDF
This slide depicts a Dashboard which can be used to track performance of shopper marketing campaign on digital platforms. The key performance indicators include Website leads, Current service users, Lead conversion rate, Lead satisfaction rate etc. Pitch your topic with ease and precision using this Dashboard To Track Performance Of Buyer Marketing Campaign Infographics PDF. This layout presents information on Social Media Campaign, Social Media Engagement, Current Service Users. It is also available for immediate download and adjustment. So, changes can be made in the color, design, graphics or any other component to create a unique layout.
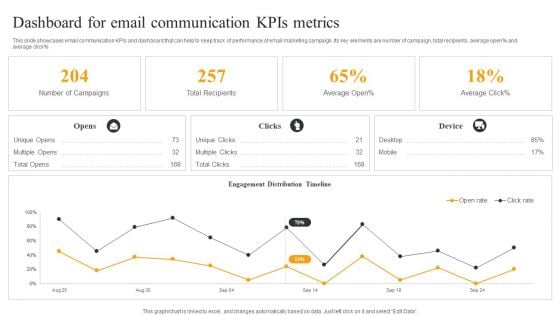
Dashboard For Email Communication Kpis Metrics Topics PDF
This slide showcases email communication KPIs and dashboard that can help to keep track of performance of email marketing campaign. Its key elements are number of campaign, total recipients, average open percent and average click percent. Showcasing this set of slides titled Dashboard For Email Communication Kpis Metrics Topics PDF. The topics addressed in these templates are Number Campaigns, Total Recipients, Engagement Distribution. All the content presented in this PPT design is completely editable. Download it and make adjustments in color, background, font etc. as per your unique business setting.
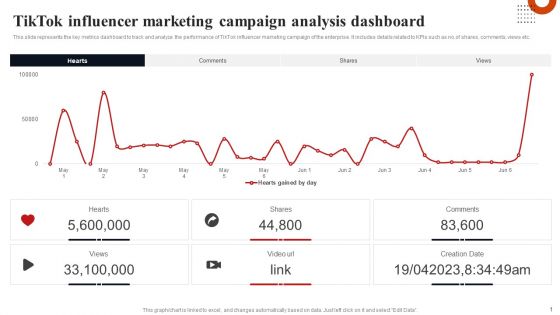
Tiktok Influencer Marketing Campaign Analysis Dashboard Formats PDF
This slide represents the key metrics dashboard to track and analyze the performance of TikTok influencer marketing campaign of the enterprise. It includes details related to KPIs such as no.of shares, comments, views etc. Formulating a presentation can take up a lot of effort and time, so the content and message should always be the primary focus. The visuals of the PowerPoint can enhance the presenters message, so our Tiktok Influencer Marketing Campaign Analysis Dashboard Formats PDF was created to help save time. Instead of worrying about the design, the presenter can concentrate on the message while our designers work on creating the ideal templates for whatever situation is needed. Slidegeeks has experts for everything from amazing designs to valuable content, we have put everything into Tiktok Influencer Marketing Campaign Analysis Dashboard Formats PDF.
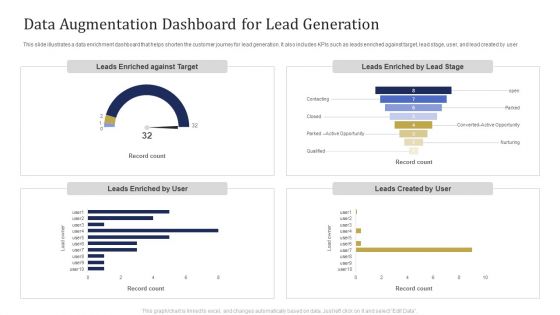
Data Augmentation Dashboard For Lead Generation Ppt Pictures Deck PDF
This slide illustrates a data enrichment dashboard that helps shorten the customer journey for lead generation. It also includes KPIs such as leads enriched against target, lead stage, user, and lead created by user. Showcasing this set of slides titled Data Augmentation Dashboard For Lead Generation Ppt Pictures Deck PDF. The topics addressed in these templates are Leads Enriched against, Target, Leads Enriched, Lead Stage, Leads Created User, Leads Enriched User. All the content presented in this PPT design is completely editable. Download it and make adjustments in color, background, font etc. as per your unique business setting.

Automated Supplier Relationship Management Risk Assessment Dashboard Showing Template PDF
This slide delineates risk assessment dashboard which can help vendor managers in assessing procurement contract status. It includes information about suppliers, renewals, actions, assessment status, concentration, etc. Slidegeeks is one of the best resources for PowerPoint templates. You can download easily and regulate Automated Supplier Relationship Management Risk Assessment Dashboard Showing Template PDF for your personal presentations from our wonderful collection. A few clicks is all it takes to discover and get the most relevant and appropriate templates. Use our Templates to add a unique zing and appeal to your presentation and meetings. All the slides are easy to edit and you can use them even for advertisement purposes.
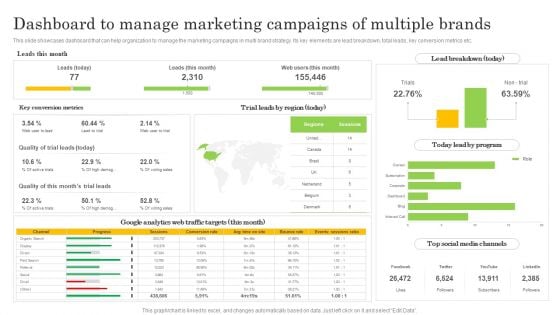
Dashboard To Manage Marketing Campaigns Of Multiple Brands Diagrams PDF
This slide showcases dashboard that can help organization to manage the marketing campaigns in multi brand strategy. Its key elements are lead breakdown, total leads, key conversion metrics etc. Here you can discover an assortment of the finest PowerPoint and Google Slides templates. With these templates, you can create presentations for a variety of purposes while simultaneously providing your audience with an eye catching visual experience. Download Dashboard To Manage Marketing Campaigns Of Multiple Brands Diagrams PDF to deliver an impeccable presentation. These templates will make your job of preparing presentations much quicker, yet still, maintain a high level of quality. Slidegeeks has experienced researchers who prepare these templates and write high quality content for you. Later on, you can personalize the content by editing the Dashboard To Manage Marketing Campaigns Of Multiple Brands Diagrams PDF.
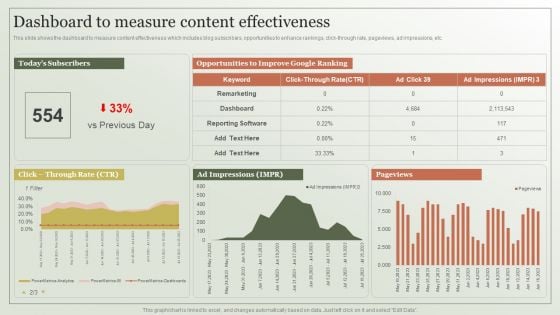
Content Marketing Strategy Dashboard To Measure Content Effectiveness Template PDF
This slide shows the dashboard to measure content effectiveness which includes blog subscribers, opportunities to enhance rankings, click-through rate, pageviews, ad impressions, etc. Want to ace your presentation in front of a live audience Our Content Marketing Strategy Dashboard To Measure Content Effectiveness Template PDF can help you do that by engaging all the users towards you.. Slidegeeks experts have put their efforts and expertise into creating these impeccable powerpoint presentations so that you can communicate your ideas clearly. Moreover, all the templates are customizable, and easy-to-edit and downloadable. Use these for both personal and commercial use.
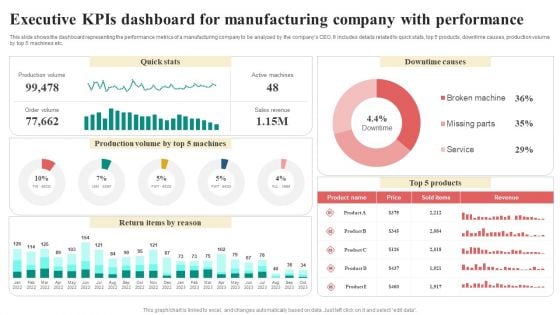
Executive Kpis Dashboard For Manufacturing Company With Performance Infographics PDF
This slide shows the dashboard representing the performance metrics of a manufacturing company to be analyzed by the companys CEO. It includes details related to quick stats, top 5 products, downtime causes, production volume by top 5 machines etc. Showcasing this set of slides titled Executive Kpis Dashboard For Manufacturing Company With Performance Infographics PDF. The topics addressed in these templates are Return Items By Reason, Quick Stats, Downtime Causes, Revenue. All the content presented in this PPT design is completely editable. Download it and make adjustments in color, background, font etc. as per your unique business setting.
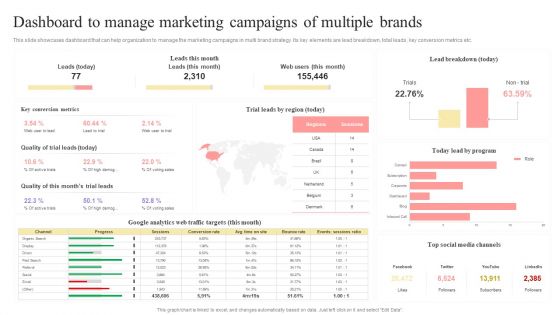
Dashboard To Manage Marketing Campaigns Of Multiple Brands Structure PDF
This slide showcases dashboard that can help organization to manage the marketing campaigns in multi brand strategy. Its key elements are lead breakdown, total leads, key conversion metrics etc.If you are looking for a format to display your unique thoughts, then the professionally designed Dashboard To Manage Marketing Campaigns Of Multiple Brands Structure PDF is the one for you. You can use it as a Google Slides template or a PowerPoint template. Incorporate impressive visuals, symbols, images, and other charts. Modify or reorganize the text boxes as you desire. Experiment with shade schemes and font pairings. Alter, share or cooperate with other people on your work. Download Dashboard To Manage Marketing Campaigns Of Multiple Brands Structure PDF and find out how to give a successful presentation. Present a perfect display to your team and make your presentation unforgettable.
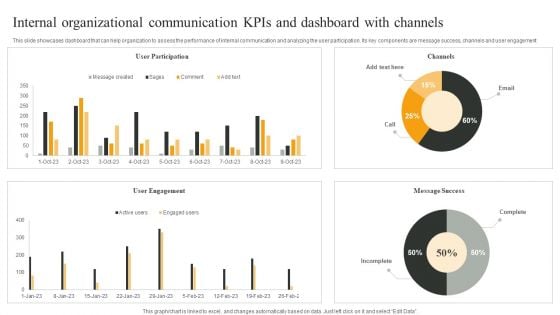
Internal Organizational Communication Kpis And Dashboard With Channels Infographics PDF
This slide showcases dashboard that can help organization to assess the performance of internal communication and analyzing the user participation. Its key components are message success, channels and user engagement. Pitch your topic with ease and precision using this Internal Organizational Communication Kpis And Dashboard With Channels Infographics PDF. This layout presents information on User Participation, User Engagement, Message Success. It is also available for immediate download and adjustment. So, changes can be made in the color, design, graphics or any other component to create a unique layout.
Employee Talent Management Procedure Tracking Dashboard With Kpis Download PDF
This slide represents dashboard of the human resource department for tracking the performance and management of organizations workforce. It includes details related to monthly new hires, total active employees, suite people metrics along with key performance indicators. Showcasing this set of slides titled Employee Talent Management Procedure Tracking Dashboard With Kpis Download PDF. The topics addressed in these templates are Total Active Employees, Employees, Suite People Metrics. All the content presented in this PPT design is completely editable. Download it and make adjustments in color, background, font etc. as per your unique business setting.
Dashboard For Tracking Impact Of Procurement Process Automation Inspiration PDF
This slide covers the dashboard for analysing procurement performance after automation. It include KPIs such as on-time delivery, percentage of returns, compliance index percentage, procurement ROI, cost-saving, budget spent on training, etc. Here you can discover an assortment of the finest PowerPoint and Google Slides templates. With these templates, you can create presentations for a variety of purposes while simultaneously providing your audience with an eye catching visual experience. Download Dashboard For Tracking Impact Of Procurement Process Automation Inspiration PDF to deliver an impeccable presentation. These templates will make your job of preparing presentations much quicker, yet still, maintain a high level of quality. Slidegeeks has experienced researchers who prepare these templates and write high quality content for you. Later on, you can personalize the content by editing the Dashboard For Tracking Impact Of Procurement Process Automation Inspiration PDF.
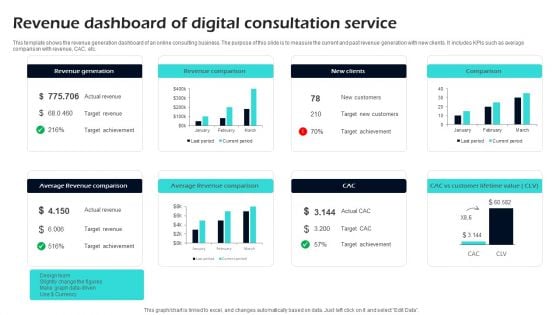
Revenue Dashboard Of Digital Consultation Service Ppt Designs
This template shows the revenue generation dashboard of an online consulting business. The purpose of this slide is to measure the current and past revenue generation with new clients. It includes KPIs such as average comparison with revenue, CAC, etc. Pitch your topic with ease and precision using this Revenue Dashboard Of Digital Consultation Service Ppt Designs. This layout presents information on Revenue, Digital, Consultation. It is also available for immediate download and adjustment. So, changes can be made in the color, design, graphics or any other component to create a unique layout.
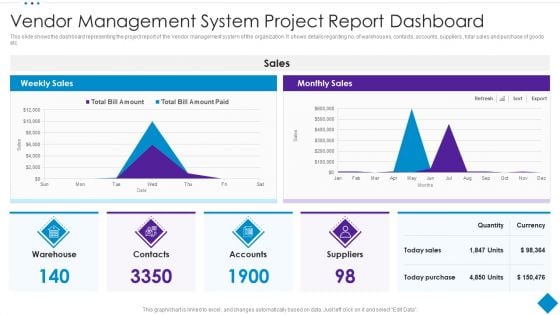
Vendor Management System Project Report Dashboard Template PDF
This slide shows the dashboard representing the project report of the Vendor management system of the organization. It shows details regarding no. of warehouses, contacts, accounts, suppliers , total sales and purchase of goods etc. Showcasing this set of slides titled Vendor Management System Project Report Dashboard Template PDF. The topics addressed in these templates are Purchase, Sales, Suppliers. All the content presented in this PPT design is completely editable. Download it and make adjustments in color, background, font etc. as per your unique business setting.
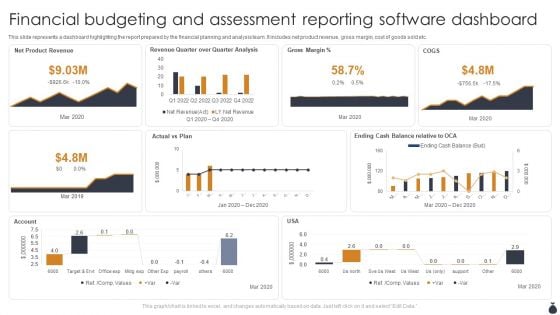
Financial Budgeting And Assessment Reporting Software Dashboard Template PDF
This slide represents a dashboard highlighting the report prepared by the financial planning and analysis team. It includes net product revenue, gross margin, cost of goods sold etc. Showcasing this set of slides titled Financial Budgeting And Assessment Reporting Software Dashboard Template PDF. The topics addressed in these templates are Net Product Revenue, Actual Vs Plan, Account. All the content presented in this PPT design is completely editable. Download it and make adjustments in color, background, font etc. as per your unique business setting.


 Continue with Email

 Home
Home


