Dashboards Summary
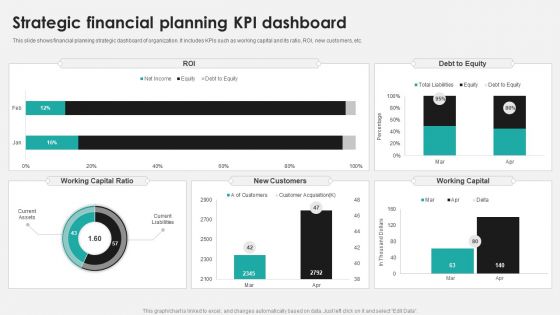
Strategic Financial Planning KPI Dashboard Ppt PowerPoint Presentation Layouts Background Designs PDF
This slide shows financial planning strategic dashboard of organization. It includes KPIs such as working capital and its ratio, ROI, new customers, etc. Pitch your topic with ease and precision using this Strategic Financial Planning KPI Dashboard Ppt PowerPoint Presentation Layouts Background Designs PDF. This layout presents information on New Customers, Working Capital, Debt Equity. It is also available for immediate download and adjustment. So, changes can be made in the color, design, graphics or any other component to create a unique layout.
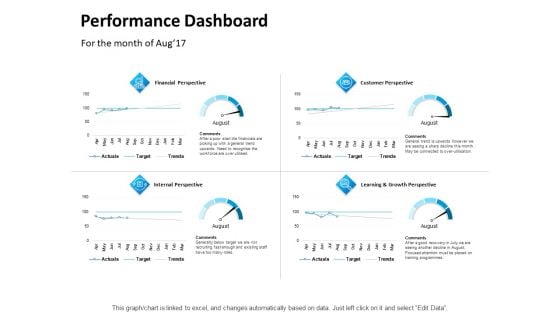
Balanced Scorecard Outline Performance Dashboard Ppt PowerPoint Presentation Outline Slides PDF
Presenting this set of slides with name balanced scorecard outline performance dashboard ppt powerpoint presentation outline slides pdf. The topics discussed in these slides are financial perspective, customer perspective, internal perspective, learning and growth perspective, actual, target, trade. This is a completely editable PowerPoint presentation and is available for immediate download. Download now and impress your audience.
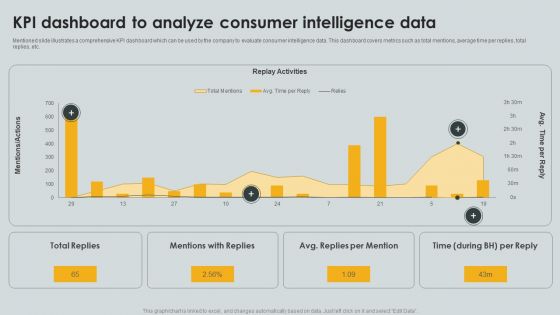
KPI Dashboard To Analyze Consumer Intelligence Data Ppt PowerPoint Presentation File Portfolio PDF
Mentioned slide illustrates a comprehensive KPI dashboard which can be used by the company to evaluate consumer intelligence data. This dashboard covers metrics such as total mentions, average time per replies, total replies, etc. Pitch your topic with ease and precision using this KPI Dashboard To Analyze Consumer Intelligence Data Ppt PowerPoint Presentation File Portfolio PDF. This layout presents information on Replay Activities, Total Replies, Mentions Replies. It is also available for immediate download and adjustment. So, changes can be made in the color, design, graphics or any other component to create a unique layout.
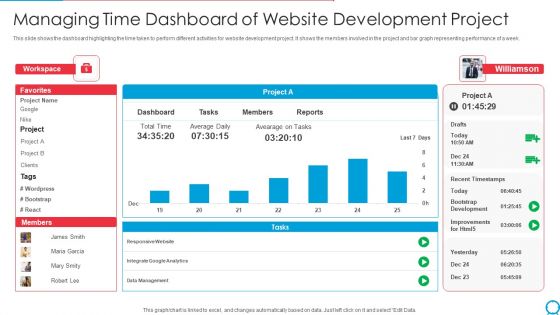
Managing Time Dashboard Of Website Development Project Ppt PowerPoint Presentation Gallery Outline PDF
This slide shows the dashboard highlighting the time taken to perform different activities for website development project. It shows the members involved in the project and bar graph representing performance of a week. Showcasing this set of slides titled managing time dashboard of website development project ppt powerpoint presentation gallery outline pdf. The topics addressed in these templates are workspace, project, data management, recent timestamps. All the content presented in this PPT design is completely editable. Download it and make adjustments in color, background, font etc. as per your unique business setting.
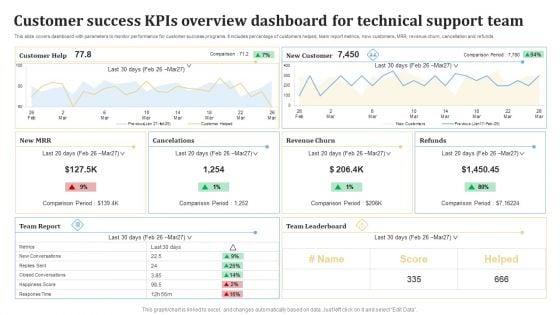
Customer Success KPIS Overview Dashboard For Technical Support Team Ppt PowerPoint Presentation Gallery Layouts PDF
This slide covers dashboard with parameters to monitor performance for customer success programs. It includes percentage of customers helped, team report metrics, new customers, MRR, revenue churn, cancellation and refunds. Showcasing this set of slides titled Customer Success KPIS Overview Dashboard For Technical Support Team Ppt PowerPoint Presentation Gallery Layouts PDF. The topics addressed in these templates are Customer, Cancelations, New Customer, Revenue Churn. All the content presented in this PPT design is completely editable. Download it and make adjustments in color, background, font etc. as per your unique business setting.
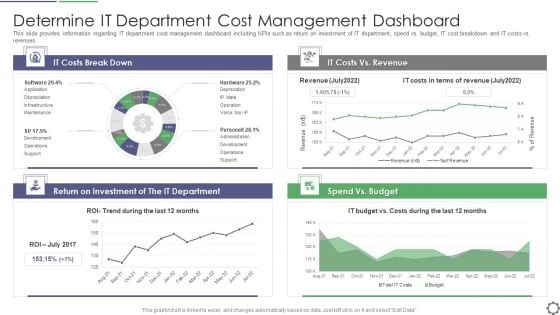
Determine IT Department Cost Management Dashboard Ppt PowerPoint Presentation Gallery Outline PDF
This slide provides information regarding IT department cost management dashboard including KPIs such as return on investment of IT department, spend vs. budget, IT cost breakdown and IT costs vs. revenues. Deliver an awe inspiring pitch with this creative determine it department cost management dashboard ppt powerpoint presentation gallery outline pdf bundle. Topics like it costs break down, it costs vs revenue, spend vs budget, return on investment can be discussed with this completely editable template. It is available for immediate download depending on the needs and requirements of the user.
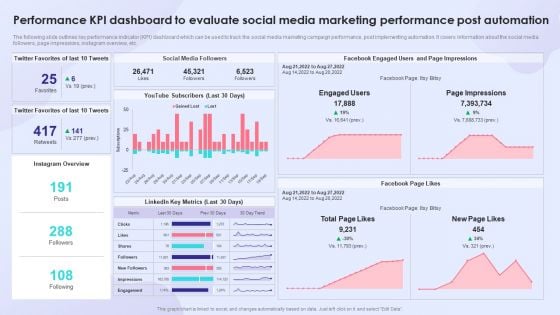
Performance KPI Dashboard To Evaluate Social Media Marketing Performance Post Automation Themes PDF
The following slide outlines key performance indicator KPI dashboard which can be used to track the social media marketing campaign performance, post implementing automation. It covers information about the social media followers, page impressions, instagram overview, etc. Deliver and pitch your topic in the best possible manner with this Performance KPI Dashboard To Evaluate Social Media Marketing Performance Post Automation Themes PDF. Use them to share invaluable insights on Social Media Followers, Linkedin Key Metrics, Performance KPI Dashboard and impress your audience. This template can be altered and modified as per your expectations. So, grab it now.
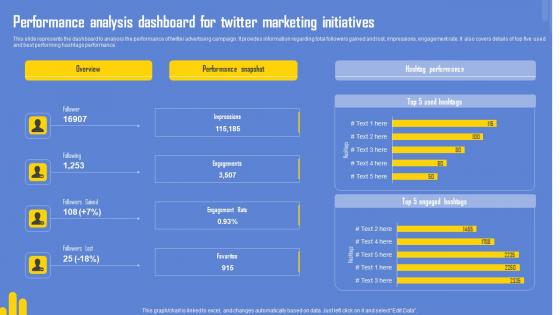
Optimizing Twitter For Online Performance Analysis Dashboard For Twitter Marketing Initiatives Topics Pdf
This slide represents the dashboard to analysis the performance of twitter campaign. It provides information regarding total followers gained and lost, impressions, engagement rate. It also covers details of top five used and best performing hashtags performance. Crafting an eye-catching presentation has never been more straightforward. Let your presentation shine with this tasteful yet straightforward Optimizing Twitter For Online Overview Of Twitter As Social Media Marketing Tool Themes Pdf template. It offers a minimalistic and classy look that is great for making a statement. The colors have been employed intelligently to add a bit of playfulness while still remaining professional. Construct the ideal Optimizing Twitter For Online Overview Of Twitter As Social Media Marketing Tool Themes Pdf that effortlessly grabs the attention of your audience Begin now and be certain to wow your customers This slide represents the dashboard to analysis the performance of twitter advertising campaign. It provides information regarding total followers gained and lost, impressions, engagement rate. It also covers details of top five used and best performing hashtags performance.
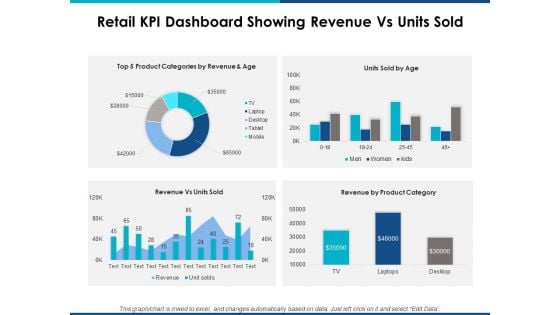
Retail Kpi Dashboard Showing Revenue Vs Units Sold Ppt Powerpoint Presentation Layouts Show
This is a retail kpi dashboard showing revenue vs units sold ppt powerpoint presentation layouts show. This is a four stage process. The stages in this process are finance, marketing, management, investment, analysis.
Patient Healthcare Online Transformation Dashboard Ppt PowerPoint Presentation Icon Example File PDF
This slide displays the dashboard depicting the results of patients after the digital transformation. It includes the daily activity of the patients on the app, appointments, water balance, etc. Pitch your topic with ease and precision using this Patient Healthcare Online Transformation Dashboard Ppt PowerPoint Presentation Icon Example File PDF. This layout presents information on General Health, Water Balance, Transformation Dashboard. It is also available for immediate download and adjustment. So, changes can be made in the color, design, graphics or any other component to create a unique layout.
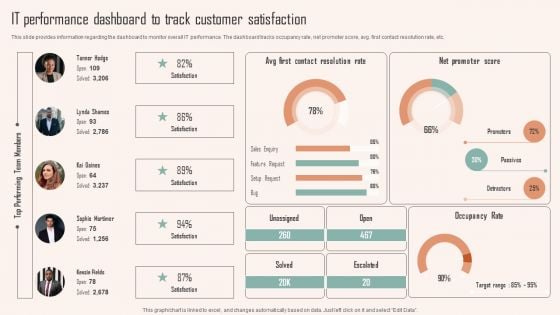
IT Performance Dashboard To Track Customer Satisfaction Ppt PowerPoint Presentation File Styles PDF
This slide provides information regarding the dashboard to monitor overall IT performance. The dashboard tracks occupancy rate, net promoter score, avg. first contact resolution rate, etc. The IT Performance Dashboard To Track Customer Satisfaction Ppt PowerPoint Presentation File Styles PDF is a compilation of the most recent design trends as a series of slides. It is suitable for any subject or industry presentation, containing attractive visuals and photo spots for businesses to clearly express their messages. This template contains a variety of slides for the user to input data, such as structures to contrast two elements, bullet points, and slides for written information. Slidegeeks is prepared to create an impression.
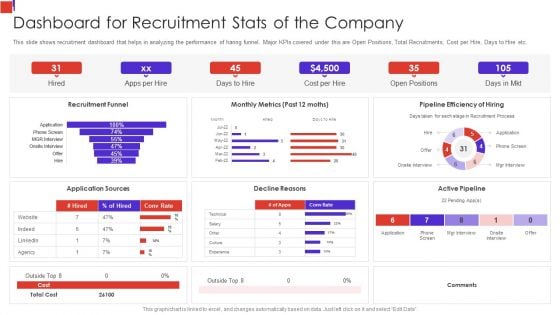
Outline Of Employee Recruitment Dashboard For Recruitment Stats Of The Company Formats PDF
This slide shows recruitment dashboard that helps in analyzing the performance of haring funnel. Major KPIs covered under this are Open Positions, Total Recruitments, Cost per Hire, Days to Hire etc.Deliver and pitch your topic in the best possible manner with this Outline Of Employee Recruitment Dashboard For Recruitment Stats Of The Company Formats PDF Use them to share invaluable insights on Dashboard For Recruitment, Stats Of The Company, Decline Reasons and impress your audience. This template can be altered and modified as per your expectations. So, grab it now.
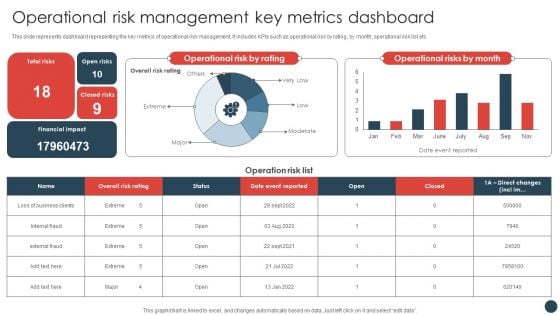
Strategic Risk Management Plan Operational Risk Management Key Metrics Dashboard Structure PDF
This slide represents dashboard representing the key metrics of operational risk management. It includes KPIs such as operational risk by rating, by month, operational risk list etc.Create an editable Strategic Risk Management Plan Operational Risk Management Key Metrics Dashboard Structure PDF that communicates your idea and engages your audience. Whether you are presenting a business or an educational presentation, pre-designed presentation templates help save time. Strategic Risk Management Plan Operational Risk Management Key Metrics Dashboard Structure PDF is highly customizable and very easy to edit, covering many different styles from creative to business presentations. Slidegeeks has creative team members who have crafted amazing templates. So, go and get them without any delay.

Product Sales Report Dashboard For Profit Margin Analysis Ppt PowerPoint Presentation Ideas Slide Portrait
This is a product sales report dashboard for profit margin analysis ppt powerpoint presentation ideas slide portrait. This is a four stage process. The stages in this process are business analytics, ba, organizations data.
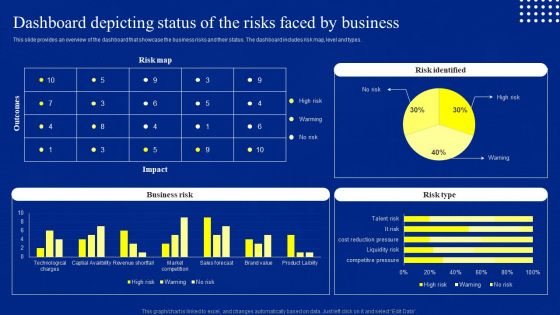
Risk Control And Surveillance Dashboard Depicting Status Of The Risks Faced By Business Elements PDF
This slide provides an overview of the dashboard that showcase the business risks and their status. The dashboard includes risk map, level and types. The best PPT templates are a great way to save time, energy, and resources. Slidegeeks have 100 percent editable powerpoint slides making them incredibly versatile. With these quality presentation templates, you can create a captivating and memorable presentation by combining visually appealing slides and effectively communicating your message. Download Risk Control And Surveillance Dashboard Depicting Status Of The Risks Faced By Business Elements PDF from Slidegeeks and deliver a wonderful presentation.
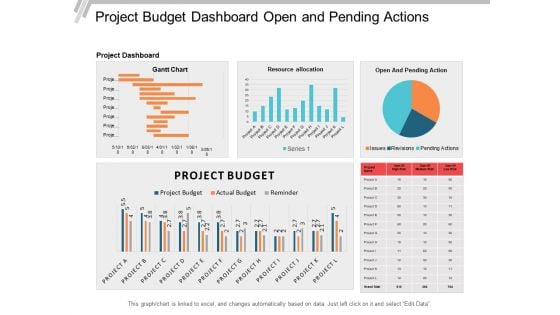
Project Budget Dashboard Open And Pending Actions Ppt PowerPoint Presentation File Templates
This is a project budget dashboard open and pending actions ppt powerpoint presentation file templates. This is a three stage process. The stages in this process are business analytics, ba, organizations data.
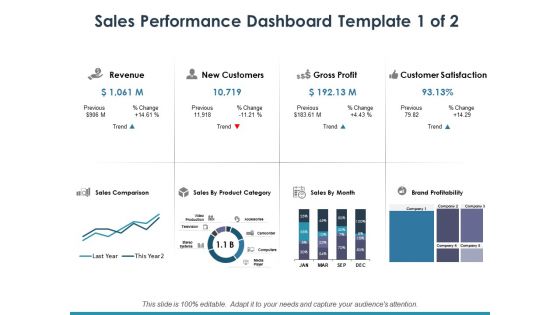
Sales Performance Dashboard Template 1 Ppt PowerPoint Presentation Infographic Template Maker
This is a sales performance dashboard template 1 ppt powerpoint presentation infographic template maker. This is a eight stage process. The stages in this process are dollar, business, finance, marketing.
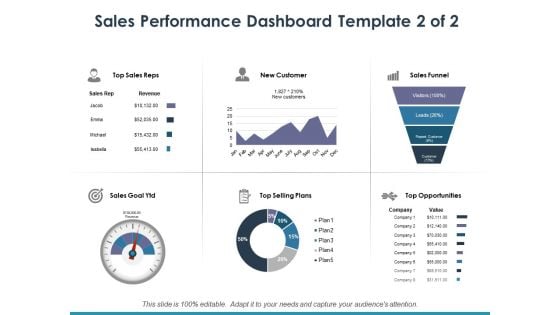
Sales Performance Dashboard Template 2 Ppt PowerPoint Presentation Infographic Template Clipart
This is a sales performance dashboard template 2 ppt powerpoint presentation infographic template clipart. This is a six stage process. The stages in this process are top sales reps, new customer, sales funnel, top selling plans, top opportunities.

KPI Dashboard Showing Results Of Sales And Marketing Project Campaign Formats PDF
Following slide showcases performance KPI dashboard used to evaluate marketing project campaign results. The dashboard provides overview of key metrics such as total revenue, marketing spend, profit and cost per acquisition, leads etc. Showcasing this set of slides titled KPI Dashboard Showing Results Of Sales And Marketing Project Campaign Formats PDF. The topics addressed in these templates are Marketing Spend, Revenue, Profit Per Acquisition. All the content presented in this PPT design is completely editable. Download it and make adjustments in color, background, font etc. as per your unique business setting.
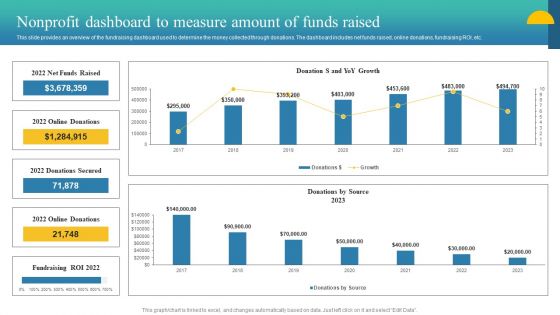
Charity Fundraising Marketing Plan Nonprofit Dashboard To Measure Amount Sample PDF
This slide provides an overview of the fundraising dashboard used to determine the money collected through donations. The dashboard includes net funds raised, online donations, fundraising ROI, etc. Slidegeeks is one of the best resources for PowerPoint templates. You can download easily and regulate Charity Fundraising Marketing Plan Nonprofit Dashboard To Measure Amount Sample PDF for your personal presentations from our wonderful collection. A few clicks is all it takes to discover and get the most relevant and appropriate templates. Use our Templates to add a unique zing and appeal to your presentation and meetings. All the slides are easy to edit and you can use them even for advertisement purposes.
Data Lake Implementation Centralized Repository Data Lake Reporting Dashboard Icons PDF
This slide represents the data lake reporting dashboard by covering the total number of users, total lake size, trusted zone size, conversion rate, and retention. Get a simple yet stunning designed Data Lake Implementation Centralized Repository Data Lake Reporting Dashboard Icons PDF. It is the best one to establish the tone in your meetings. It is an excellent way to make your presentations highly effective. So, download this PPT today from Slidegeeks and see the positive impacts. Our easy-to-edit Data Lake Implementation Centralized Repository Data Lake Reporting Dashboard Icons PDF can be your go-to option for all upcoming conferences and meetings. So, what are you waiting for Grab this template today.
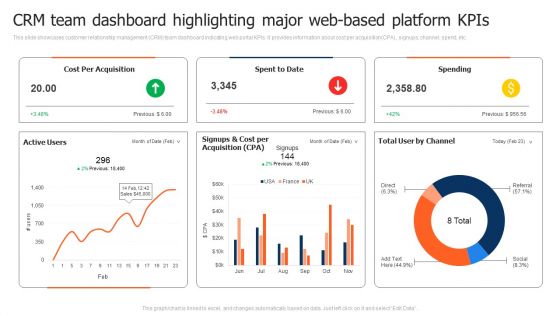
CRM Team Dashboard Highlighting Major Web Based Platform Kpis Template PDF
This slide showcases customer relationship management CRM team dashboard indicating web portal KPIs. It provides information about cost per acquisition CPA, signups, channel, spend, etc. Pitch your topic with ease and precision using this CRM Team Dashboard Highlighting Major Web Based Platform Kpis Template PDF. This layout presents information on CRM Team Dashboard Highlighting, Web Based Platform Kpis. It is also available for immediate download and adjustment. So, changes can be made in the color, design, graphics or any other component to create a unique layout.
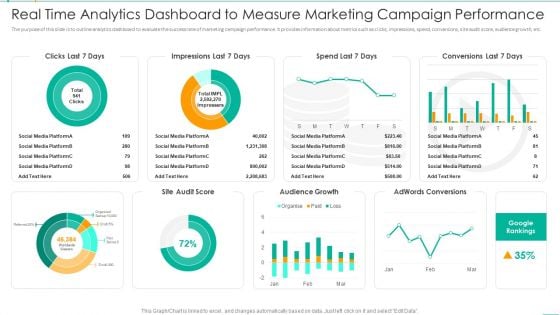
Real Time Analytics Dashboard To Measure Marketing Campaign Performance Information PDF
The purpose of this slide is to outline analytics dashboard to evaluate the success rate of marketing campaign performance. It provides information about metrics such as clicks, impressions, spend, conversions, site audit score, audience growth, etc. Pitch your topic with ease and precision using this Real Time Analytics Dashboard To Measure Marketing Campaign Performance Information PDF. This layout presents information on Real Time Analytics Dashboard To Measure Marketing Campaign Performance. It is also available for immediate download and adjustment. So, changes can be made in the color, design, graphics or any other component to create a unique layout.
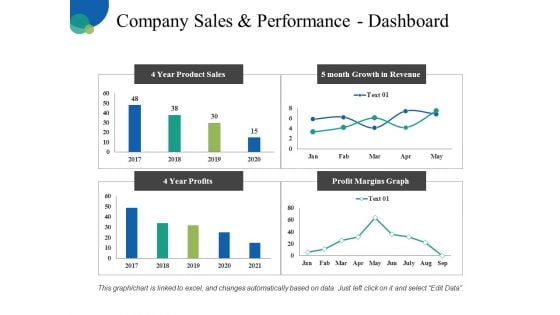
Company Sales And Performance Dashboard Ppt PowerPoint Presentation Pictures Infographic Template
This is a company sales and performance dashboard ppt powerpoint presentation pictures infographic template. This is a four stage process. The stages in this process are business, finance, analysis, management, marketing.
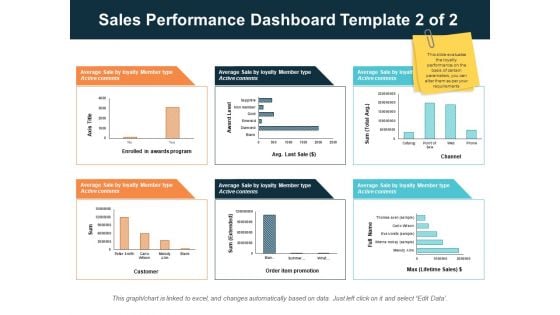
Sales Performance Dashboard Template 2 Of 2 Ppt PowerPoint Presentation Infographics Design Inspiration
This is a sales performance dashboard template 2 of 2 ppt powerpoint presentation infographics design inspiration. This is a three stage process. The stages in this process are finance, management, strategy, analysis, marketing.
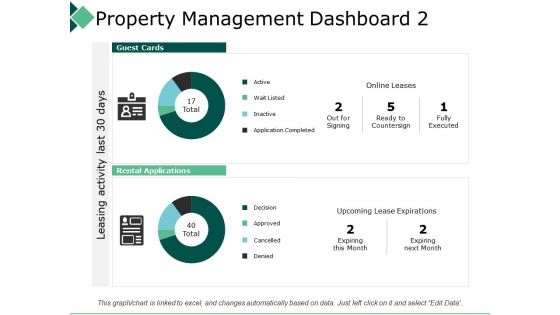
Property Management Dashboard 2 Leasing Activity Ppt PowerPoint Presentation Infographic Template Templates
This is a property management dashboard 2 leasing activity ppt powerpoint presentation infographic template templates. This is a two stage process. The stages in this process are business, management, strategy, analysis, marketing.
Tracking Sales Pipeline And Lead Activity Dashboard Managing Sales Pipeline Health Professional PDF
This slide covers information regarding dashboard associated to tracking lead activity across sales pipeline. Explore a selection of the finest Tracking Sales Pipeline And Lead Activity Dashboard Managing Sales Pipeline Health Professional PDF here. With a plethora of professionally designed and pre-made slide templates, you can quickly and easily find the right one for your upcoming presentation. You can use our Tracking Sales Pipeline And Lead Activity Dashboard Managing Sales Pipeline Health Professional PDF to effectively convey your message to a wider audience. Slidegeeks has done a lot of research before preparing these presentation templates. The content can be personalized and the slides are highly editable. Grab templates today from Slidegeeks.
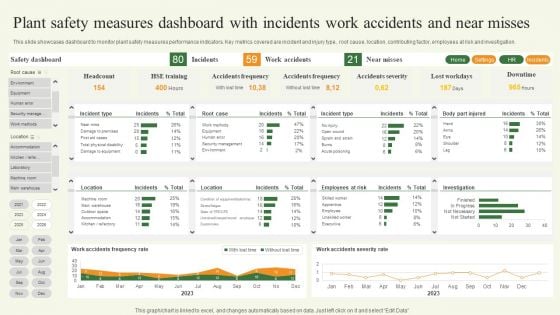
Plant Safety Measures Dashboard With Incidents Work Accidents And Near Misses Template PDF
This slide showcases dashboard to monitor plant safety measures performance indicators. Key metrics covered are incident and injury type, root cause, location, contributing factor, employees at risk and investigation. Pitch your topic with ease and precision using this Plant Safety Measures Dashboard With Incidents Work Accidents And Near Misses Template PDF. This layout presents information on Plant Safety Measures Dashboard, Incidents Work Accidents. It is also available for immediate download and adjustment. So, changes can be made in the color, design, graphics or any other component to create a unique layout.
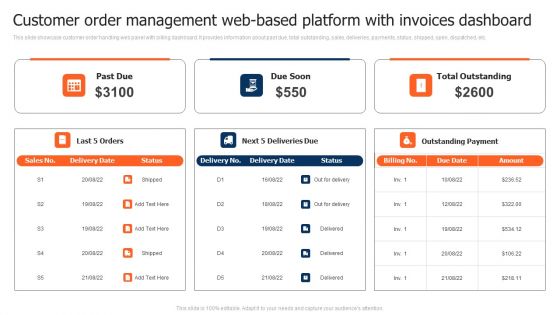
Customer Order Management Web Based Platform With Invoices Dashboard Clipart PDF
This slide showcase customer order handling web panel with billing dashboard. It provides information about past due, total outstanding, sales, deliveries, payments, status, shipped, open, dispatched, etc. Showcasing this set of slides titled Customer Order Management Web Based Platform With Invoices Dashboard Clipart PDF. The topics addressed in these templates are Customer Order Management, Web Based Platform, Invoices Dashboard. All the content presented in this PPT design is completely editable. Download it and make adjustments in color, background, font etc. as per your unique business setting.
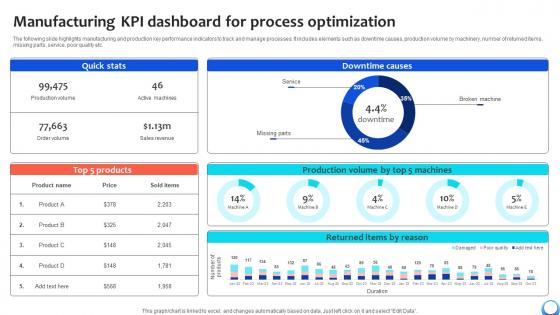
Manufacturing KPI Dashboard For Process Optimization Automating Production Process Strategy SS V
The following slide highlights manufacturing and production key performance indicators to track and manage processes. It includes elements such as downtime causes, production volume by machinery, number of returned items, missing parts, service, poor quality etc. Formulating a presentation can take up a lot of effort and time, so the content and message should always be the primary focus. The visuals of the PowerPoint can enhance the presenters message, so our Manufacturing KPI Dashboard For Process Optimization Automating Production Process Strategy SS V was created to help save time. Instead of worrying about the design, the presenter can concentrate on the message while our designers work on creating the ideal templates for whatever situation is needed. Slidegeeks has experts for everything from amazing designs to valuable content, we have put everything into Manufacturing KPI Dashboard For Process Optimization Automating Production Process Strategy SS V The following slide highlights manufacturing and production key performance indicators to track and manage processes. It includes elements such as downtime causes, production volume by machinery, number of returned items, missing parts, service, poor quality etc.
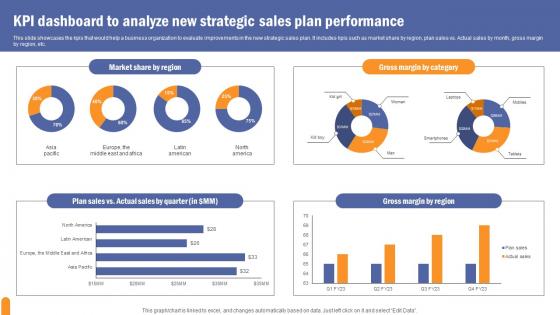
KPI Dashboard To Analyze Developing Extensive Sales And Operations Strategy Slides Pdf
This slide showcases the kpis that would help a business organization to evaluate improvements in the new strategic sales plan. It includes kpis such as market share by region, plan sales vs. Actual sales by month, gross margin by region, etc. Explore a selection of the finest KPI Dashboard To Analyze Developing Extensive Sales And Operations Strategy Slides Pdf here. With a plethora of professionally designed and pre made slide templates, you can quickly and easily find the right one for your upcoming presentation. You can use our KPI Dashboard To Analyze Developing Extensive Sales And Operations Strategy Slides Pdf to effectively convey your message to a wider audience. Slidegeeks has done a lot of research before preparing these presentation templates. The content can be personalized and the slides are highly editable. Grab templates today from Slidegeeks. This slide showcases the kpis that would help a business organization to evaluate improvements in the new strategic sales plan. It includes kpis such as market share by region, plan sales vs. Actual sales by month, gross margin by region, etc.
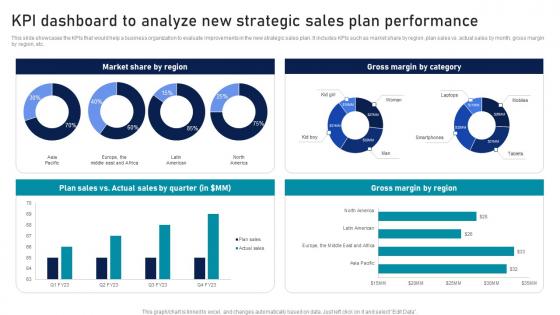
KPI Dashboard To Analyze New Strategic Sales Plan Strategic Sales Plan To Enhance Ideas Pdf
This slide showcases the KPIs that would help a business organization to evaluate improvements in the new strategic sales plan. It includes KPIs such as market share by region, plan sales vs. actual sales by month, gross margin by region, etc. Explore a selection of the finest KPI Dashboard To Analyze New Strategic Sales Plan Strategic Sales Plan To Enhance Ideas Pdf here. With a plethora of professionally designed and pre-made slide templates, you can quickly and easily find the right one for your upcoming presentation. You can use our KPI Dashboard To Analyze New Strategic Sales Plan Strategic Sales Plan To Enhance Ideas Pdf to effectively convey your message to a wider audience. Slidegeeks has done a lot of research before preparing these presentation templates. The content can be personalized and the slides are highly editable. Grab templates today from Slidegeeks. This slide showcases the KPIs that would help a business organization to evaluate improvements in the new strategic sales plan. It includes KPIs such as market share by region, plan sales vs. actual sales by month, gross margin by region, etc.
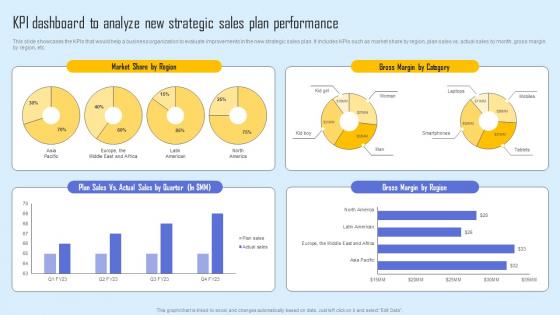
KPI Dashboard Analyze New Effective Sales Strategy To Enhance Customer Retention Background Pdf
This slide showcases the KPIs that would help a business organization to evaluate improvements in the new strategic sales plan. It includes KPIs such as market share by region, plan sales vs. actual sales by month, gross margin by region, etc. Explore a selection of the finest KPI Dashboard Analyze New Effective Sales Strategy To Enhance Customer Retention Background Pdf here. With a plethora of professionally designed and pre made slide templates, you can quickly and easily find the right one for your upcoming presentation. You can use our KPI Dashboard Analyze New Effective Sales Strategy To Enhance Customer Retention Background Pdf to effectively convey your message to a wider audience. Slidegeeks has done a lot of research before preparing these presentation templates. The content can be personalized and the slides are highly editable. Grab templates today from Slidegeeks. This slide showcases the KPIs that would help a business organization to evaluate improvements in the new strategic sales plan. It includes KPIs such as market share by region, plan sales vs. actual sales by month, gross margin by region, etc.
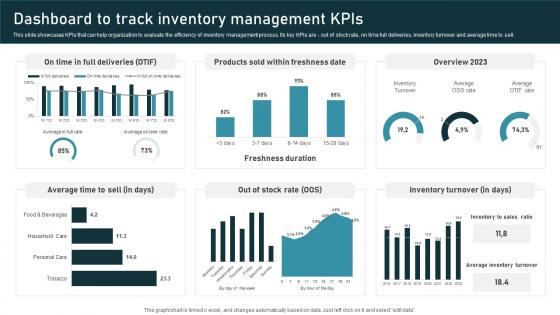
Dashboard To Track Inventory Administration Techniques For Enhanced Stock Accuracy Structure Pdf
This slide showcases KPIs that can help organization to evaluate the efficiency of inventory management process. Its key KPIs are out of stock rate, on time full deliveries, inventory turnover and average time to sell. Whether you have daily or monthly meetings, a brilliant presentation is necessary. Dashboard To Track Inventory Administration Techniques For Enhanced Stock Accuracy Structure Pdf can be your best option for delivering a presentation. Represent everything in detail using Dashboard To Track Inventory Administration Techniques For Enhanced Stock Accuracy Structure Pdf and make yourself stand out in meetings. The template is versatile and follows a structure that will cater to your requirements. All the templates prepared by Slidegeeks are easy to download and edit. Our research experts have taken care of the corporate themes as well. So, give it a try and see the results. This slide showcases KPIs that can help organization to evaluate the efficiency of inventory management process. Its key KPIs are out of stock rate, on time full deliveries, inventory turnover and average time to sell.
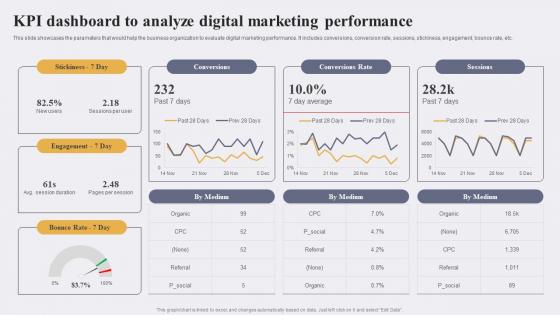
KPI Dashboard To Analyze Digital Marketing Enhancing Conversion Rate By Leveraging Background Pdf
This slide showcases the parameters that would help the business organization to evaluate digital marketing performance. It includes conversions, conversion rate, sessions, stickiness, engagement, bounce rate, etc.If you are looking for a format to display your unique thoughts, then the professionally designed KPI Dashboard To Analyze Digital Marketing Enhancing Conversion Rate By Leveraging Background Pdf is the one for you. You can use it as a Google Slides template or a PowerPoint template. Incorporate impressive visuals, symbols, images, and other charts. Modify or reorganize the text boxes as you desire. Experiment with shade schemes and font pairings. Alter, share or cooperate with other people on your work. Download KPI Dashboard To Analyze Digital Marketing Enhancing Conversion Rate By Leveraging Background Pdf and find out how to give a successful presentation. Present a perfect display to your team and make your presentation unforgettable. This slide showcases the parameters that would help the business organization to evaluate digital marketing performance. It includes conversions, conversion rate, sessions, stickiness, engagement, bounce rate, etc.
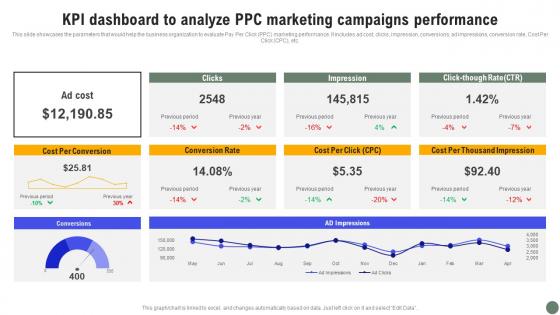
KPI Dashboard To Analyze PPC Exhaustive Guide Of Pay Per Click Advertising Initiatives Inspiration Pdf
This slide showcases the parameters that would help the business organization to evaluate Pay Per Click PPC marketing performance. It includes ad cost, clicks, impression, conversions, ad impressions, conversion rate, Cost Per Click CPC, etc. Formulating a presentation can take up a lot of effort and time, so the content and message should always be the primary focus. The visuals of the PowerPoint can enhance the presenters message, so our KPI Dashboard To Analyze PPC Exhaustive Guide Of Pay Per Click Advertising Initiatives Inspiration Pdf was created to help save time. Instead of worrying about the design, the presenter can concentrate on the message while our designers work on creating the ideal templates for whatever situation is needed. Slidegeeks has experts for everything from amazing designs to valuable content, we have put everything into KPI Dashboard To Analyze PPC Exhaustive Guide Of Pay Per Click Advertising Initiatives Inspiration Pdf This slide showcases the parameters that would help the business organization to evaluate Pay Per Click PPC marketing performance. It includes ad cost, clicks, impression, conversions, ad impressions, conversion rate, Cost Per Click CPC, etc.
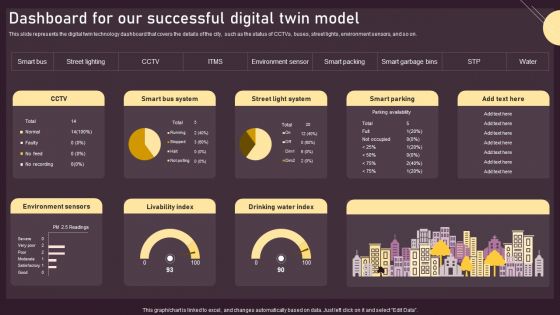
Dashboard For Our Successful Digital Twin Model Ppt PowerPoint Presentation Diagram Templates PDF
This slide represents the digital twin technology dashboard that covers the details of the city, such as the status of CCTVs, buses, street lights, environment sensors, and so on. Presenting this PowerPoint presentation, titled Dashboard For Our Successful Digital Twin Model Ppt PowerPoint Presentation Diagram Templates PDF, with topics curated by our researchers after extensive research. This editable presentation is available for immediate download and provides attractive features when used. Download now and captivate your audience. Presenting this Dashboard For Our Successful Digital Twin Model Ppt PowerPoint Presentation Diagram Templates PDF. Our researchers have carefully researched and created these slides with all aspects taken into consideration. This is a completely customizable Dashboard For Our Successful Digital Twin Model Ppt PowerPoint Presentation Diagram Templates PDF that is available for immediate downloading. Download now and make an impact on your audience. Highlight the attractive features available with our PPTs.
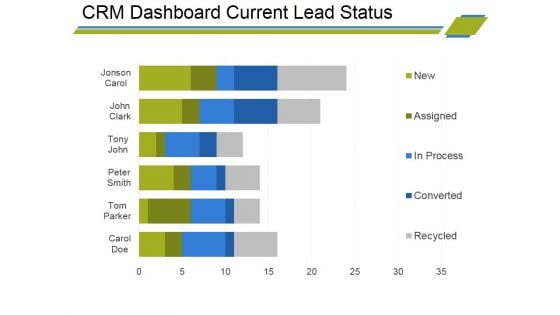
Crm Dashboard Current Lead Status Ppt PowerPoint Presentation Infographic Template Visual Aids
This is a crm dashboard current lead status ppt powerpoint presentation infographic template visual aids. This is a six stage process. The stages in this process are bar graph, finance, marketing, strategy, business, analysis.
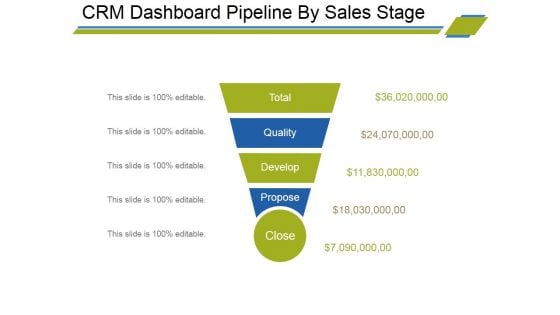
Crm Dashboard Pipeline By Sales Stage Ppt PowerPoint Presentation Infographic Template Slides
This is a crm dashboard pipeline by sales stage ppt powerpoint presentation infographic template slides. This is a five stage process. The stages in this process are total, quality, develop, propose, close.
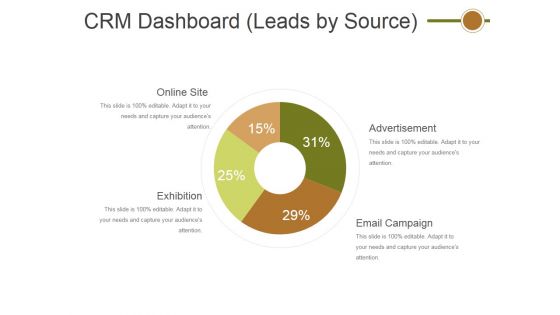
Crm Dashboard Leads By Source Ppt PowerPoint Presentation File Graphics Template
This is a crm dashboard leads by source ppt powerpoint presentation file graphics template. This is a four stage process. The stages in this process are online site, exhibition, advertisement, email campaign.
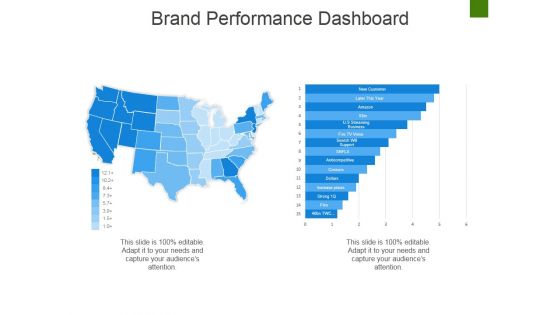
Brand Performance Dashboard Template 2 Ppt PowerPoint Presentation Show Designs Download
This is a brand performance dashboard template 2 ppt powerpoint presentation show designs download. This is a two stage process. The stages in this process are business, location, geography, information, strategy.
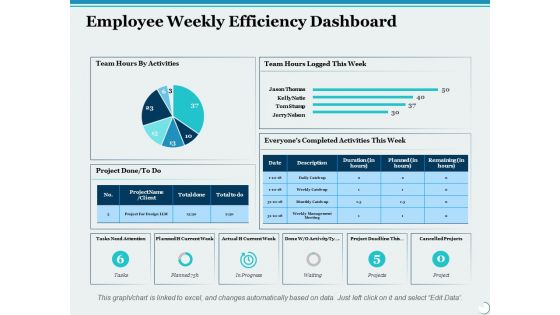
Employee Weekly Efficiency Dashboard Ppt PowerPoint Presentation Infographic Template Graphic Images
This is a employee weekly efficiency dashboard ppt powerpoint presentation infographic template graphic images. This is a six stage process. The stages in this process are percentage, product, business, management, marketing.
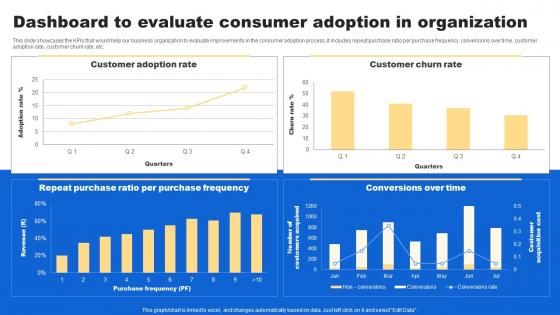
Dashboard To Evaluate Consumer Analyzing Customer Buying Behavior Enhance Conversion Inspiration Pdf
This slide showcases the KPIs that would help our business organization to evaluate improvements in the consumer adoption process. It includes repeat purchase ratio per purchase frequency, conversions over time, customer adoption rate, customer churn rate, etc. Whether you have daily or monthly meetings, a brilliant presentation is necessary. Dashboard To Evaluate Consumer Analyzing Customer Buying Behavior Enhance Conversion Inspiration Pdf can be your best option for delivering a presentation. Represent everything in detail using Dashboard To Evaluate Consumer Analyzing Customer Buying Behavior Enhance Conversion Inspiration Pdf and make yourself stand out in meetings. The template is versatile and follows a structure that will cater to your requirements. All the templates prepared by Slidegeeks are easy to download and edit. Our research experts have taken care of the corporate themes as well. So, give it a try and see the results. This slide showcases the KPIs that would help our business organization to evaluate improvements in the consumer adoption process. It includes repeat purchase ratio per purchase frequency, conversions over time, customer adoption rate, customer churn rate, etc.
Dashboard For Tracking Viral Implementing Social Media Tactics For Boosting WOM Professional Pdf
This slide showcases the parameters for business organizations to evaluate viral marketing performance. It includes KPIs such as user metrics, campaign metrics, social metrics, engagement rate, viral sign ups, etc. Whether you have daily or monthly meetings, a brilliant presentation is necessary. Dashboard For Tracking Viral Implementing Social Media Tactics For Boosting WOM Professional Pdf can be your best option for delivering a presentation. Represent everything in detail using Dashboard For Tracking Viral Implementing Social Media Tactics For Boosting WOM Professional Pdf and make yourself stand out in meetings. The template is versatile and follows a structure that will cater to your requirements. All the templates prepared by Slidegeeks are easy to download and edit. Our research experts have taken care of the corporate themes as well. So, give it a try and see the results. This slide showcases the parameters for business organizations to evaluate viral marketing performance. It includes KPIs such as user metrics, campaign metrics, social metrics, engagement rate, viral sign ups, etc.
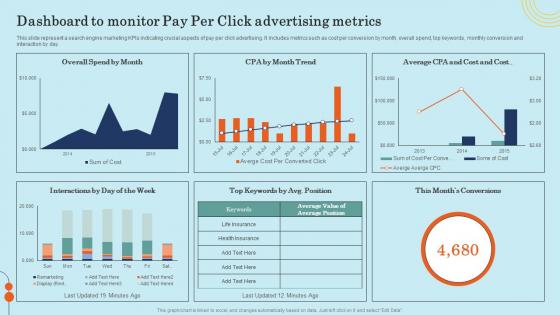
Dashboard To Monitor Pay Per Click Advertising Metrics Effective General Insurance Marketing Themes Pdf
This slide represent a search engine marketing KPIs indicating crucial aspects of pay per click advertising. It includes metrics such as cost per conversion by month, overall spend, top keywords, monthly conversion and interaction by day. Do you have to make sure that everyone on your team knows about any specific topic I yes, then you should give Dashboard To Monitor Pay Per Click Advertising Metrics Effective General Insurance Marketing Themes Pdf a try. Our experts have put a lot of knowledge and effort into creating this impeccable Dashboard To Monitor Pay Per Click Advertising Metrics Effective General Insurance Marketing Themes Pdf. You can use this template for your upcoming presentations, as the slides are perfect to represent even the tiniest detail. You can download these templates from the Slidegeeks website and these are easy to edit. So grab these today. This slide represent a search engine marketing KPIs indicating crucial aspects of pay per click advertising. It includes metrics such as cost per conversion by month, overall spend, top keywords, monthly conversion and interaction by day.
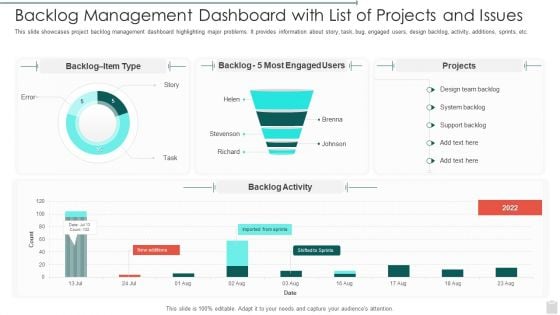
Backlog Management Dashboard With List Of Projects And Issues Template PDF
This slide showcases project backlog management dashboard highlighting major problems. It provides information about story, task, bug, engaged users, design backlog, activity, additions, sprints, etc. Pitch your topic with ease and precision using this Backlog Management Dashboard With List Of Projects And Issues Template PDF. This layout presents information on Backlog Management Dashboard With List Of Projects And Issues. It is also available for immediate download and adjustment. So, changes can be made in the color, design, graphics or any other component to create a unique layout.
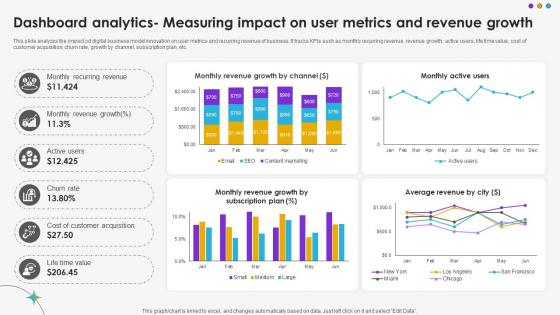
Dashboard Analytics Measuring Impact On User Metrics And Revenue Growth DT SS V
This slide analyzes the impact od digital business model innovation on user metrics and recurring revenue of business. It tracks KPIs such as monthly recurring revenue, revenue growth, active users, life time value, cost of customer acquisition, churn rate, growth by channel, subscription plan, etc.Are you searching for a Dashboard Analytics Measuring Impact On User Metrics And Revenue Growth DT SS V that is uncluttered, straightforward, and original Its easy to edit, and you can change the colors to suit your personal or business branding. For a presentation that expresses how much effort you have put in, this template is ideal With all of its features, including tables, diagrams, statistics, and lists, its perfect for a business plan presentation. Make your ideas more appealing with these professional slides. Download Dashboard Analytics Measuring Impact On User Metrics And Revenue Growth DT SS V from Slidegeeks today. This slide analyzes the impact od digital business model innovation on user metrics and recurring revenue of business. It tracks KPIs such as monthly recurring revenue, revenue growth, active users, life time value, cost of customer acquisition, churn rate, growth by channel, subscription plan, etc.
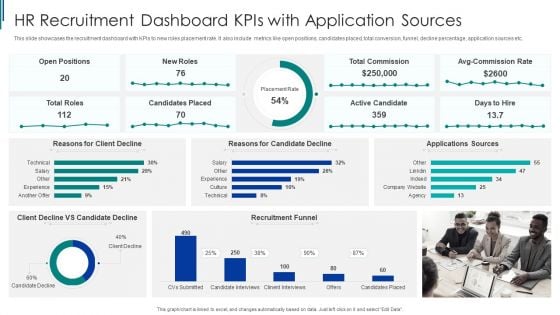
HR Recruitment Dashboard Kpis With Application Sources Ppt Pictures Styles PDF
This slide showcases the recruitment dashboard with KPIs to new roles placement rate. It also include metrics like open positions, candidates placed, total conversion, funnel, decline percentage, application sources etc. Pitch your topic with ease and precision using this HR Recruitment Dashboard Kpis With Application Sources Ppt Pictures Styles PDF. This layout presents information on Recruitment Funnel, HR Recruitment, Dashboard Kpis. It is also available for immediate download and adjustment. So, changes can be made in the color, design, graphics or any other component to create a unique layout.
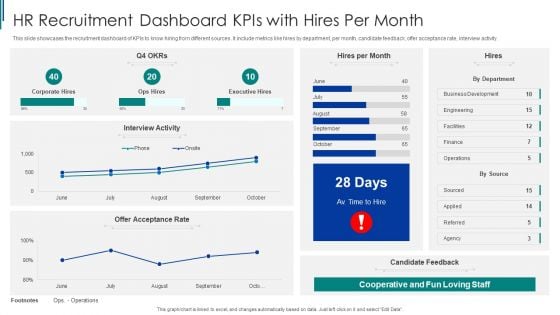
HR Recruitment Dashboard Kpis With Hires Per Month Ppt Slides Portfolio PDF
This slide showcases the recruitment dashboard of KPIs to know hiring from different sources. It include metrics like hires by department, per month, candidate feedback, offer acceptance rate, interview activity. Pitch your topic with ease and precision using this HR Recruitment Dashboard Kpis With Hires Per Month Ppt Slides Portfolio PDF. This layout presents information on HR Recruitment, Dashboard Kpis, Business Development. It is also available for immediate download and adjustment. So, changes can be made in the color, design, graphics or any other component to create a unique layout.
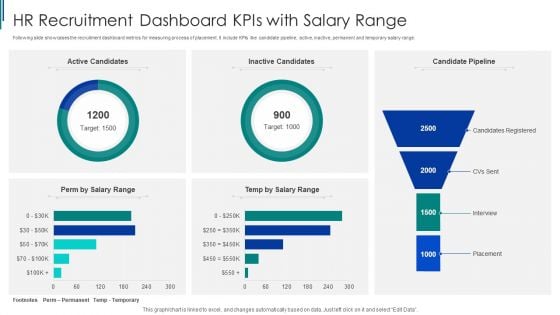
HR Recruitment Dashboard Kpis With Salary Range Ppt Inspiration Rules PDF
Following slide showcases the recruitment dashboard metrics for measuring process of placement. It include KPIs like candidate pipeline, active, inactive, permanent and temporary salary range. Pitch your topic with ease and precision using this HR Recruitment Dashboard Kpis With Salary Range Ppt Inspiration Rules PDF. This layout presents information on HR Recruitment, Dashboard Kpis, Salary Range. It is also available for immediate download and adjustment. So, changes can be made in the color, design, graphics or any other component to create a unique layout.

Infrastructure Monitoring Dashboard Infrastructure Supervision Ppt PowerPoint Presentation File Master Slide PDF
This slide covers the dashboard which can be used to monitor the system and host status based on host group, disaster, high, average, warning, etc. Deliver an awe inspiring pitch with this creative Infrastructure Monitoring Dashboard Infrastructure Supervision Ppt PowerPoint Presentation File Master Slide PDF bundle. Topics like System Status, Host Status, Average, Disaster, Warning, High, Information can be discussed with this completely editable template. It is available for immediate
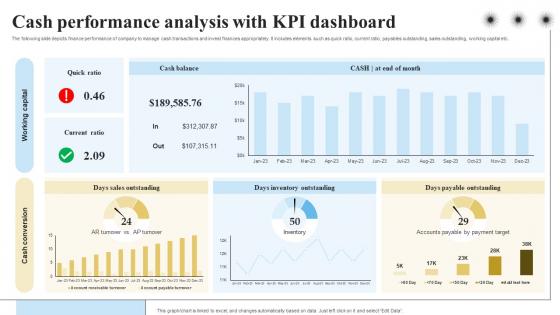
Cash Performance Analysis With KPI Dashboard Objectives And Key Result Methodology For Business
The following slide depicts finance performance of company to manage cash transactions and invest finances appropriately. It includes elements such as quick ratio, current ratio, payables outstanding, sales outstanding, working capital etc. Do you have to make sure that everyone on your team knows about any specific topic I yes, then you should give Cash Performance Analysis With KPI Dashboard Objectives And Key Result Methodology For Business a try. Our experts have put a lot of knowledge and effort into creating this impeccable Cash Performance Analysis With KPI Dashboard Objectives And Key Result Methodology For Business. You can use this template for your upcoming presentations, as the slides are perfect to represent even the tiniest detail. You can download these templates from the Slidegeeks website and these are easy to edit. So grab these today The following slide depicts finance performance of company to manage cash transactions and invest finances appropriately. It includes elements such as quick ratio, current ratio, payables outstanding, sales outstanding, working capital etc.
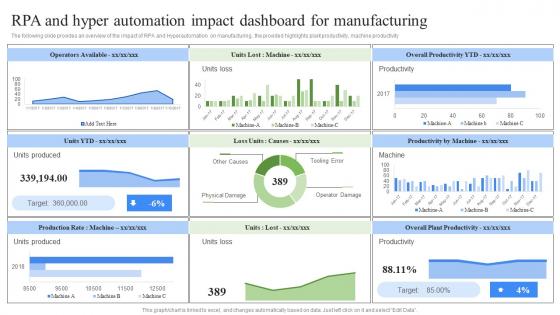
RPA And Hyper Automation Impact Dashboard RPA Influence On Industries Ideas Pdf
The following slide provides an overview of the impact of RPA and Hyperautomation on manufacturing , the provided highlights plant productivity, machine productivity. Retrieve professionally designed RPA And Hyper Automation Impact Dashboard RPA Influence On Industries Ideas Pdf to effectively convey your message and captivate your listeners. Save time by selecting pre-made slideshows that are appropriate for various topics, from business to educational purposes. These themes come in many different styles, from creative to corporate, and all of them are easily adjustable and can be edited quickly. Access them as PowerPoint templates or as Google Slides themes. You do not have to go on a hunt for the perfect presentation because Slidegeeks got you covered from everywhere. The following slide provides an overview of the impact of RPA and Hyperautomation on manufacturing , the provided highlights plant productivity, machine productivity.
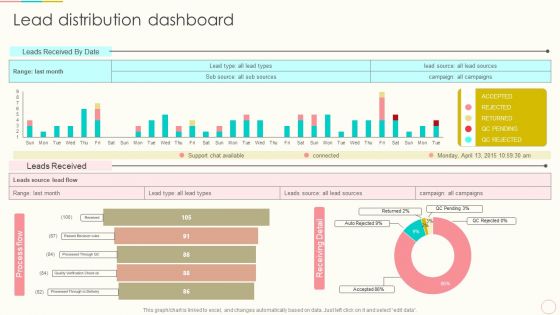
Lead Management To Engage Potential Customers Lead Distribution Dashboard Template PDF
Presenting this PowerPoint presentation, titled Lead Management To Engage Potential Customers Lead Distribution Dashboard Template PDF with topics curated by our researchers after extensive research. This editable presentation is available for immediate download and provides attractive features when used. Download now and captivate your audience. Presenting this Lead Management To Engage Potential Customers Lead Distribution Dashboard Template PDF. Our researchers have carefully researched and created these slides with all aspects taken into consideration. This is a completely customizable Lead Management To Engage Potential Customers Lead Distribution Dashboard Template PDF that is available for immediate downloading. Download now and make an impact on your audience. Highlight the attractive features available with our PPTs.
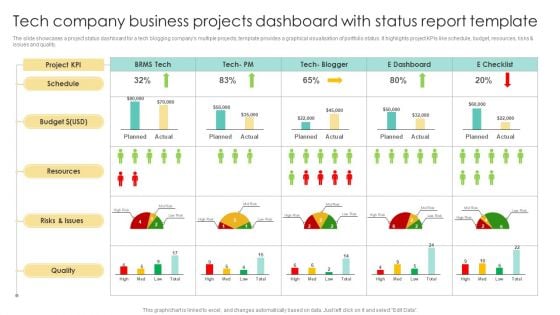
Tech Company Business Projects Dashboard With Status Report Template Brochure PDF
The slide showcases a project status dashboard for a tech blogging companys multiple projects, template provides a graphical visualisation of portfolio status. It highlights project KPIs like schedule, budget, resources, risks and issues and quality. Showcasing this set of slides titled Tech Company Business Projects Dashboard With Status Report Template Brochure PDF. The topics addressed in these templates are Tech Company Business, Projects Dashboard, Status Report Template. All the content presented in this PPT design is completely editable. Download it and make adjustments in color, background, font etc. as per your unique business setting.
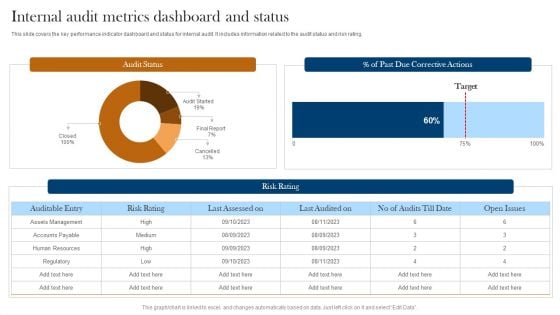
Internal Audit Metrics Dashboard And Status Ppt Layouts Graphic Images PDF
This slide covers the key performance indicator dashboard and status for internal audit. It includes information related to the audit status and risk rating. Pitch your topic with ease and precision using this Internal Audit Metrics Dashboard And Status Ppt Layouts Graphic Images PDF. This layout presents information on Audit Status, Risk Rating, Auditable Entry. It is also available for immediate download and adjustment. So, changes can be made in the color, design, graphics or any other component to create a unique layout.
Energy Tracking Device KPI Metrics And Dashboard Ppt PowerPoint Presentation Visual Aids Show PDF
This is a energy tracking device kpi metrics and dashboard ppt powerpoint presentation visual aids show pdf template with various stages. Focus and dispense information on two stages using this creative set, that comes with editable features. It contains large content boxes to add your information on topics like kpi metrics, dashboard. You can also showcase facts, figures, and other relevant content using this PPT layout. Grab it now.
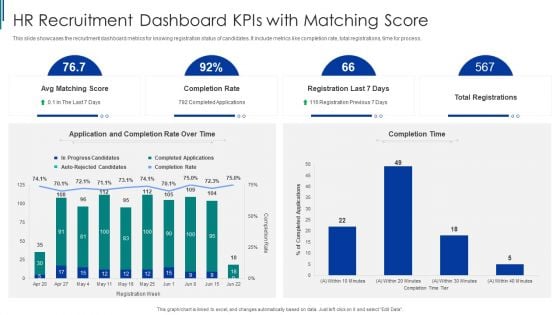
HR Recruitment Dashboard Kpis With Matching Score Ppt Layouts Example PDF
This slide showcases the recruitment dashboard metrics for knowing registration status of candidates. It include metrics like completion rate, total registrations, time for process. Showcasing this set of slides titled HR Recruitment Dashboard Kpis With Matching Score Ppt Layouts Example PDF. The topics addressed in these templates are Completion Rate, Application And Completion, HR Recruitment. All the content presented in this PPT design is completely editable. Download it and make adjustments in color, background, font etc. as per your unique business setting.
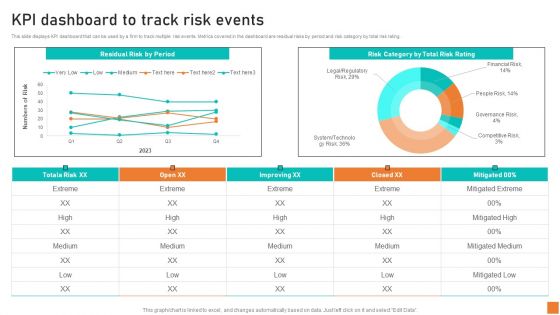
KPI Dashboard To Track Risk Events Ppt Layouts Format Ideas PDF
This slide displays KPI dashboard that can be used by a firm to track multiple risk events. Metrics covered in the dashboard are residual risks by period and risk category by total risk rating. Crafting an eye-catching presentation has never been more straightforward. Let your presentation shine with this tasteful yet straightforward KPI Dashboard To Track Risk Events Ppt Layouts Format Ideas PDF template. It offers a minimalistic and classy look that is great for making a statement. The colors have been employed intelligently to add a bit of playfulness while still remaining professional. Construct the ideal KPI Dashboard To Track Risk Events Ppt Layouts Format Ideas PDF that effortlessly grabs the attention of your audience Begin now and be certain to wow your customers
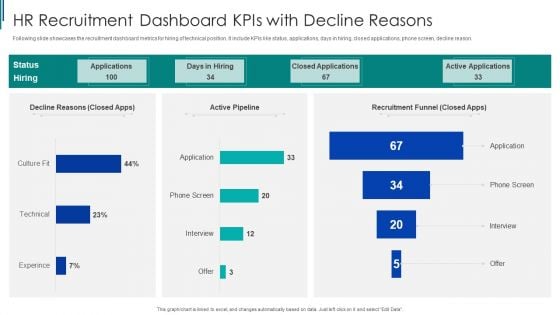
HR Recruitment Dashboard Kpis With Decline Reasons Ppt Pictures Example Introduction PDF
Following slide showcases the recruitment dashboard metrics for hiring of technical position. It include KPIs like status, applications, days in hiring, closed applications, phone screen, decline reason. Showcasing this set of slides titled HR Recruitment Dashboard Kpis With Decline Reasons Ppt Pictures Example Introduction PDF. The topics addressed in these templates are Recruitment Funnel, HR Recruitment, Dashboard Kpis. All the content presented in this PPT design is completely editable. Download it and make adjustments in color, background, font etc. as per your unique business setting.


 Continue with Email

 Home
Home


