Data Analysis Icon
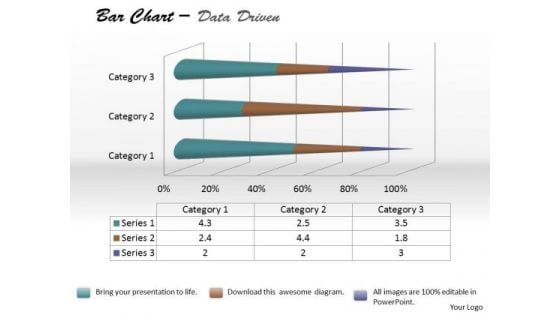
Data Analysis Bar Chart For Foreign Trade PowerPoint Templates
Be The Doer With Our data analysis bar chart for foreign trade Powerpoint Templates. Put Your Thoughts Into Practice.
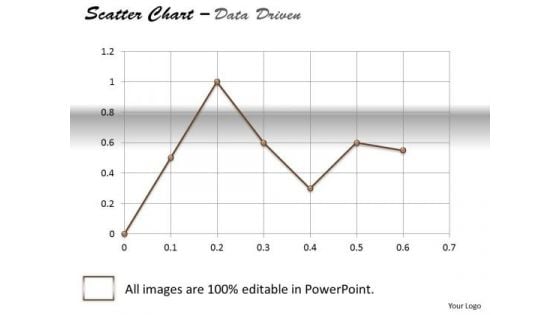
Data Analysis Excel Business Tool Scatter Chart PowerPoint Templates
Dominate Proceedings With Your Ideas. Our data analysis excel business tool scatter chart Powerpoint Templates Will Empower Your Thoughts.
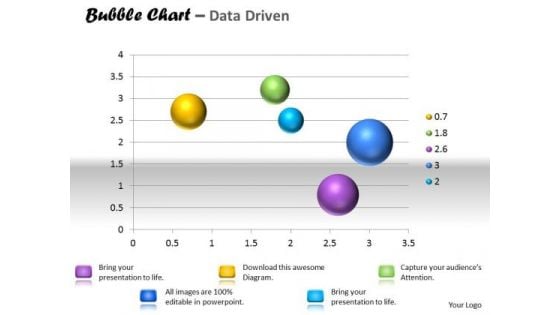
Data Analysis Template Interactive Bubble Chart PowerPoint Templates
Our data analysis template interactive bubble chart Powerpoint Templates Are A Wonder Drug. They Help Cure Almost Any Malaise.
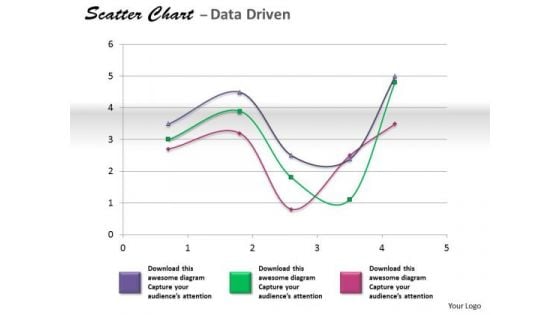
Financial Data Analysis Coordinate With Scatter Chart PowerPoint Templates
Get The Doers Into Action. Activate Them With Our financial data analysis coordinate with scatter chart Powerpoint Templates .
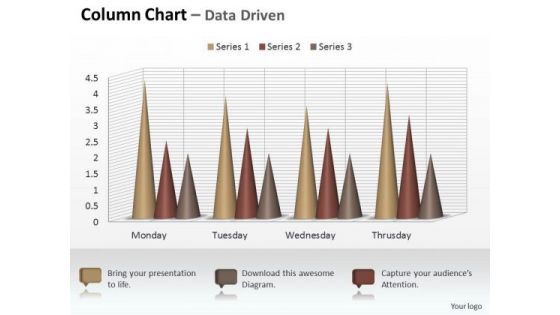
Marketing Data Analysis 3d Sets Of Column Chart PowerPoint Templates
Your Listeners Will Never Doodle. Our marketing data analysis 3d sets of column chart Powerpoint Templates Will Hold Their Concentration.
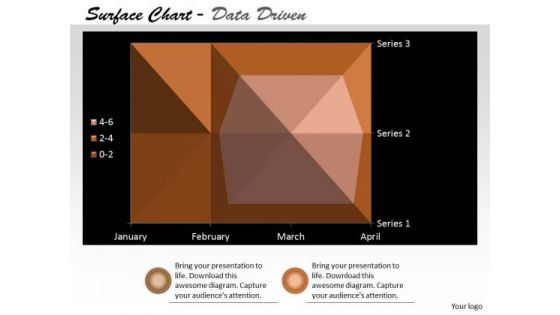
Multivariate Data Analysis Surface Chart Plots Trends PowerPoint Templates
Our multivariate data analysis surface chart plots trends Powerpoint Templates Heighten Concentration. Your Audience Will Be On The Edge.
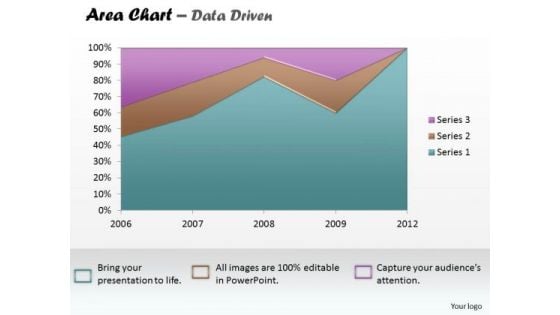
Data Analysis Excel Business Reporting Area Chart PowerPoint Templates
Establish The Dominance Of Your Ideas. Our data analysis excel business reporting area chart Powerpoint Templates Will Put Them On Top.
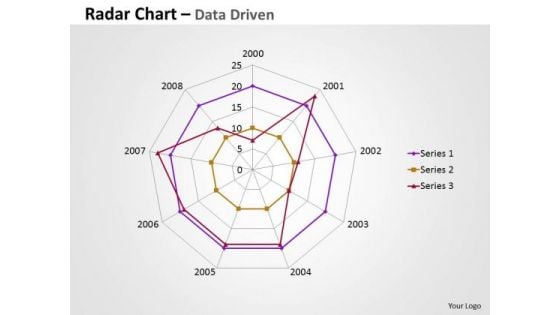
Business Data Analysis Chart Comparing Multiple Entities PowerPoint Templates
Analyze Ailments On Our business data analysis chart comparing multiple entities Powerpoint Templates. Bring Out The Thinking Doctor In You. Dock Your Thoughts With Our Financial Analysis . They Will Launch Them Into Orbit.
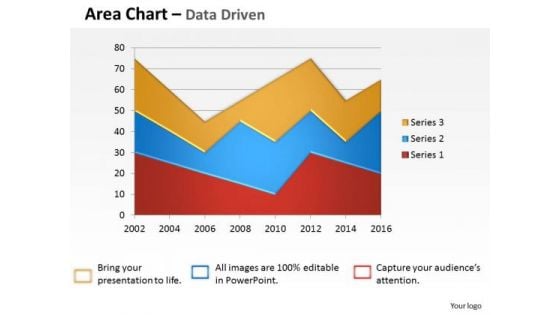
Data Analysis Template Driven Visualization Area Chart PowerPoint Slides Templates
Draw On The Energy Of Our data analysis template driven visualization area chart powerpoint slides Templates . Your Thoughts Will Perk Up.
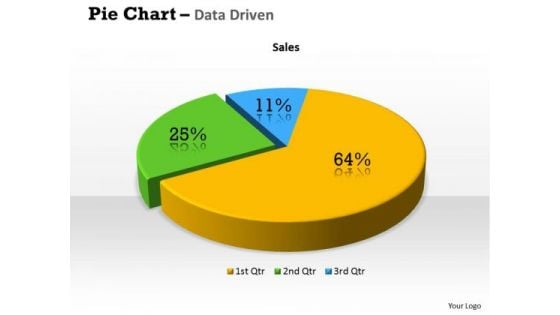
Quantitative Data Analysis 3d Percentage Ratio Pie Chart PowerPoint Templates
Plan Your Storyboard With Our quantitative data analysis 3d percentage ratio pie chart Powerpoint Templates . Give An Outline To The Solutions You Have.
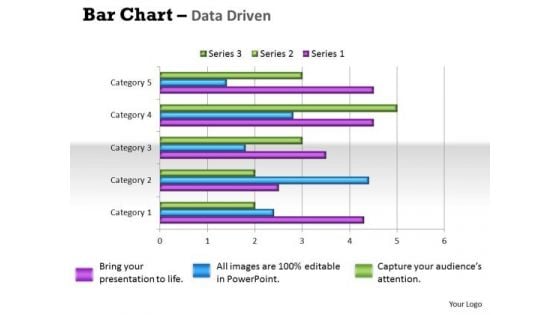
Quantitative Data Analysis Bar Chart For Different Categories PowerPoint Templates
Make Some Dough With Our quantitative data analysis bar chart for different categories Powerpoint Templates . Your Assets Will Rise Significantly.
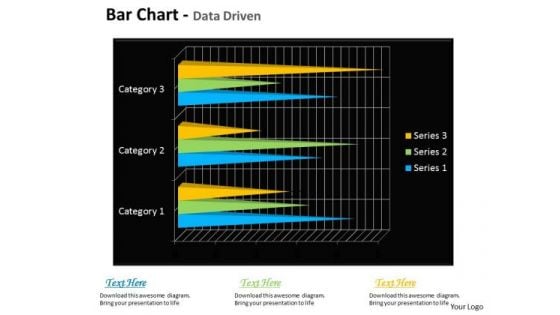
Quantitative Data Analysis Bar Chart For Financial Markets PowerPoint Templates
Draft It Out On Our quantitative data analysis bar chart for financial markets Powerpoint Templates . Give The Final Touches With Your Ideas.
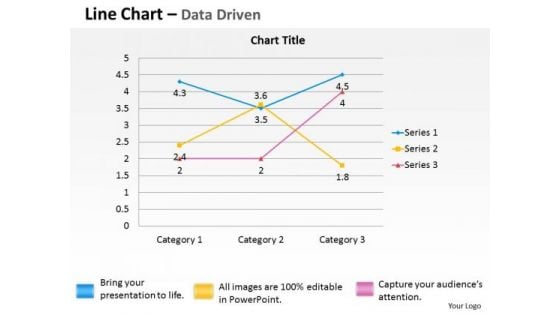
Quantitative Data Analysis Driven Economic Line Chart PowerPoint Slides Templates
Break The Deadlock With Our quantitative data analysis driven economic line chart powerpoint slides Templates . Let The Words Start To Flow.
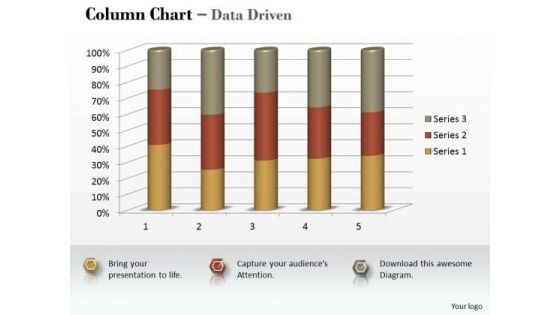
Marketing Data Analysis 3d Statistical Process Column Chart PowerPoint Templates
Be A Donor Of Great Ideas. Display Your Charity On Our marketing data analysis 3d statistical process column chart Powerpoint Templates .
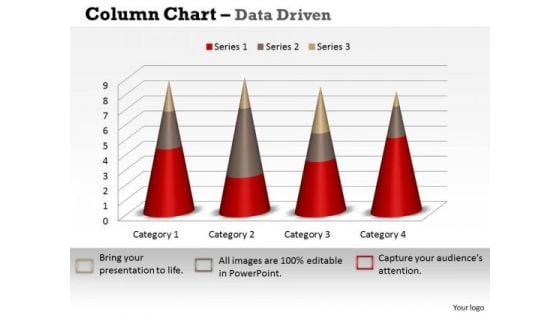
Marketing Data Analysis 3d Statistical Process Control Chart PowerPoint Templates
Open Up Doors That Lead To Success. Our marketing data analysis 3d statistical process control chart Powerpoint Templates Provide The Handles.
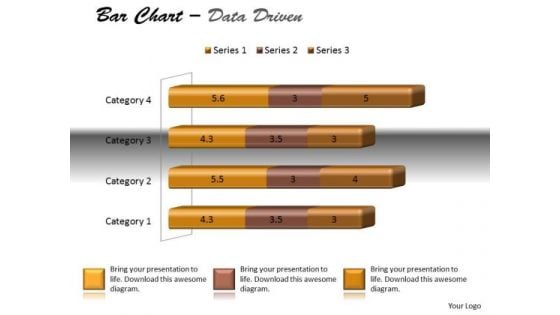
Data Analysis Techniques 3d Bar Chart For Modification PowerPoint Templates
Dreams Generate Thoughts, Thoughts Generate Ideas. Give Them Life With Our data analysis techniques 3d bar chart for modification Powerpoint Templates .
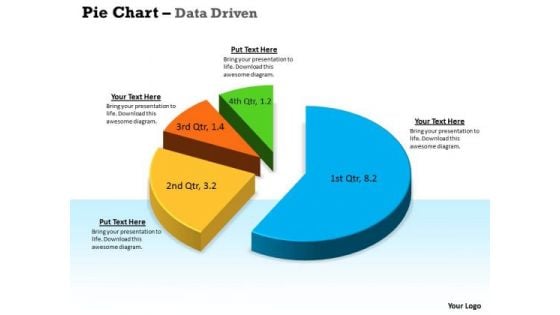
Data Analysis Techniques 3d In Segments Pie Chart PowerPoint Templates
Drink To The Success Of Your Campaign. Our data analysis techniques 3d in segments pie chart Powerpoint Templates Will Raise A Toast.

Business Data Analysis Chart For Case Studies PowerPoint Templates
Get Out Of The Dock With Our business data analysis chart for case studies Powerpoint Templates. Your Mind Will Be Set Free.
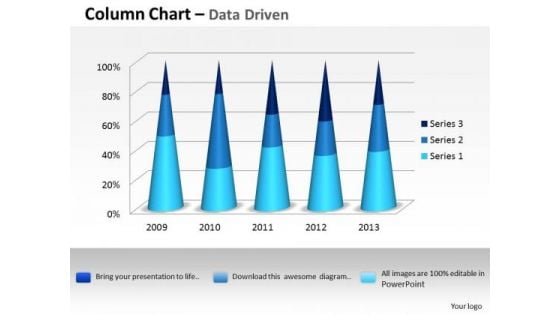
Data Analysis Excel 3d Process Variation Column Chart PowerPoint Templates
Put In A Dollop Of Our data analysis excel 3d process variation column chart Powerpoint Templates. Give Your Thoughts A Distinctive Flavor.
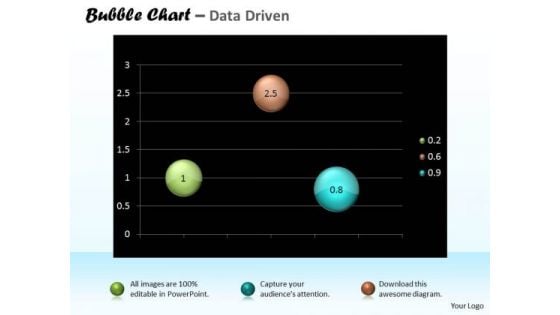
Data Analysis Excel Bubble Chart For Business Tasks PowerPoint Templates
Doll Up Your Thoughts With Our data analysis excel bubble chart for business tasks Powerpoint Templates. They Will Make A Pretty Picture.
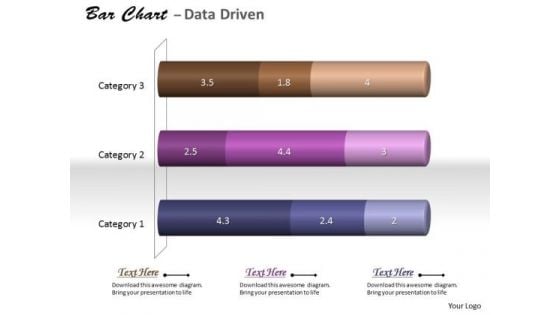
Data Analysis In Excel 3d Classification Of Chart PowerPoint Templates
With Our data analysis in excel 3d classification of chart Powerpoint Templates You Will Be Doubly Sure. They Possess That Stamp Of Authority.
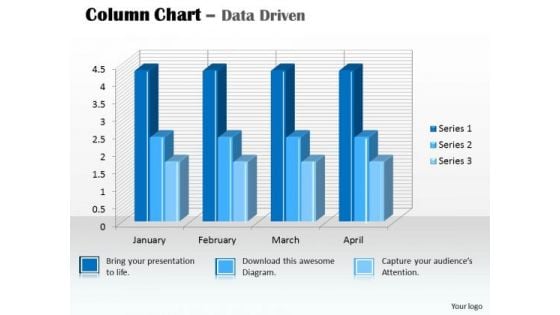
Data Analysis In Excel 3d Column Chart For PowerPoint Templates
Our data analysis in excel 3d column chart for Powerpoint Templates And Your Ideas Make A Great Doubles Pair. Play The Net With Assured Hands.
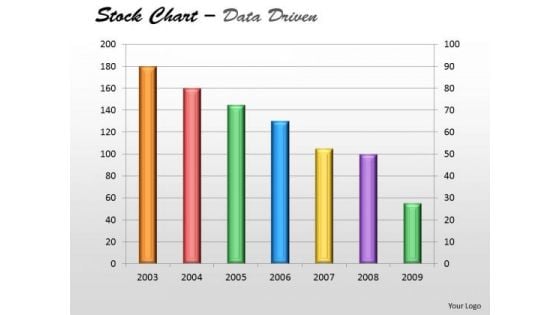
Data Analysis In Excel Of Stock Chart PowerPoint Templates
Plan Your Storyboard With Our data analysis in excel of stock chart Powerpoint Templates . Give An Outline To The Solutions You Have.
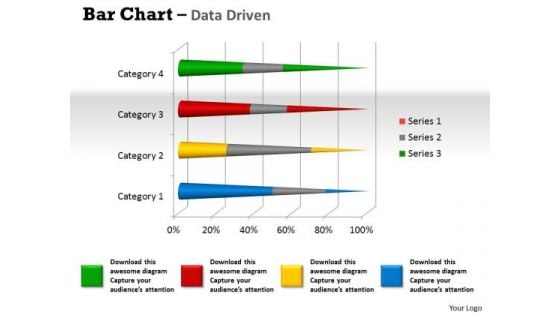
Data Analysis Programs 3d Bar Chart To Dispaly PowerPoint Templates
Lower The Drawbridge With Our data analysis programs 3d bar chart to dispaly Powerpoint Templates . Capture The Minds Of Your Audience.
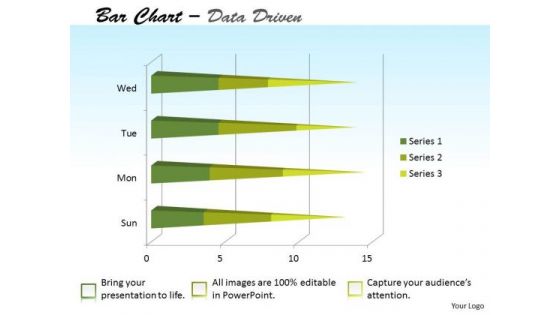
Data Analysis Template Forex Market Bar Chart PowerPoint Templates
Attract A Crowd With Our data analysis template forex market bar chart Powerpoint Templates . They Will Drop It All And Come To Hear You.
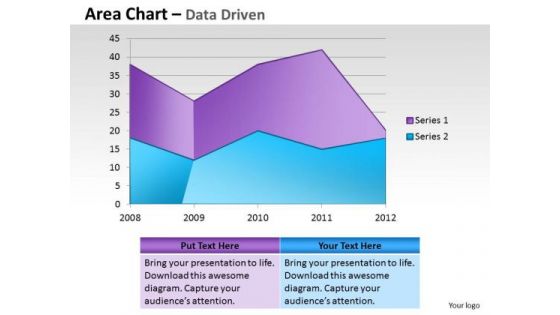
Financial Data Analysis Area Chart For Showing Trends PowerPoint Templates
Document Your Views On Our financial data analysis area chart for showing trends Powerpoint Templates . They Will Create A Strong Impression.
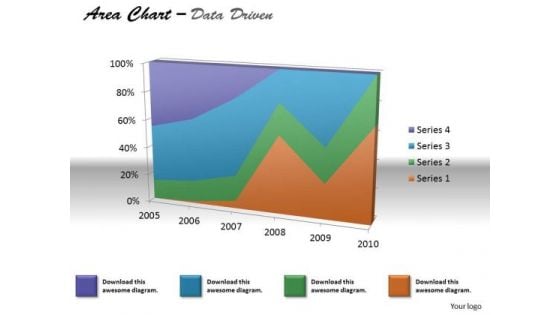
Financial Data Analysis Area Chart For Various Values PowerPoint Templates
Document The Process On Our financial data analysis area chart for various values Powerpoint Templates . Make A Record Of Every Detail.
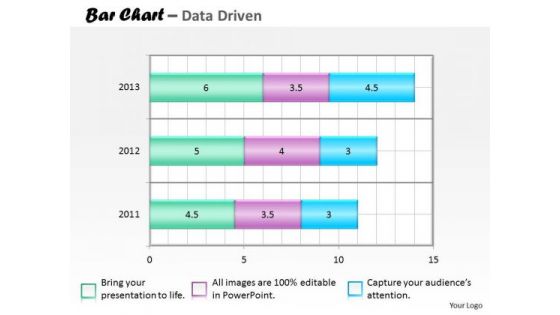
Financial Data Analysis Bar Chart For Collection Of PowerPoint Templates
Our financial data analysis bar chart for collection of Powerpoint Templates Team Are A Dogged Lot. They Keep At It Till They Get It Right.
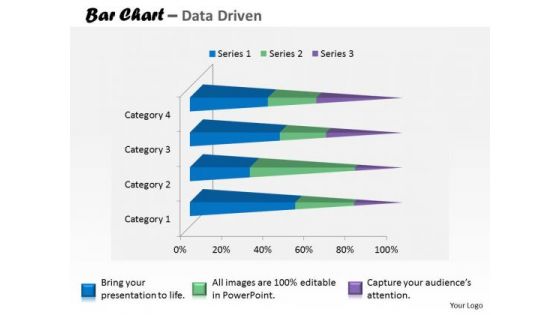
Financial Data Analysis Currency Trading Bar Chart PowerPoint Templates
Put In A Dollop Of Our financial data analysis currency trading bar chart Powerpoint Templates . Give Your Thoughts A Distinctive Flavor.

Microsoft Excel Data Analysis Bar Chart To Handle PowerPoint Templates
Our microsoft excel data analysis bar chart to handle Powerpoint Templates And Your Ideas Make A Great Doubles Pair. Play The Net With Assured Hands.
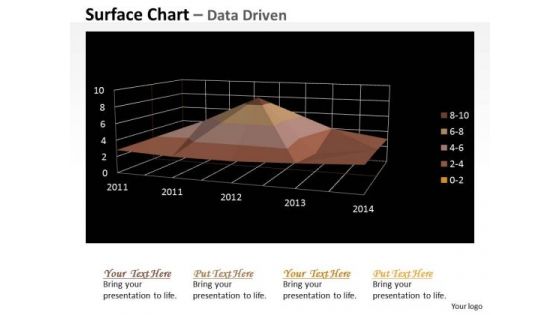
Multivariate Data Analysis Numeric Values Surface Chart PowerPoint Templates
Your Grasp Of Economics Is Well Known. Help Your Audience Comprehend Issues With Our multivariate data analysis numeric values surface chart Powerpoint Templates .
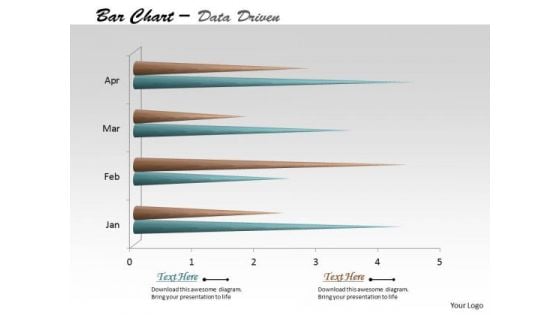
Multivariate Data Analysis Time Based Bar Chart PowerPoint Templates
Edit Your Work With Our multivariate data analysis time based bar chart Powerpoint Templates . They Will Help You Give The Final Form.
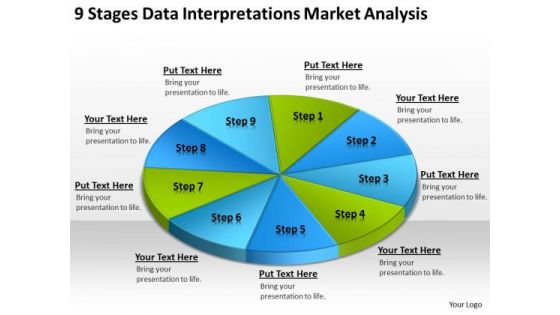
Data Interpretations Market Analysis Templates For Business Plan PowerPoint
We present our data interpretations market analysis templates for business plan PowerPoint.Present our Circle Charts PowerPoint Templates because Our PowerPoint Templates and Slides come in all colours, shades and hues. They help highlight every nuance of your views. Use our Business PowerPoint Templates because Our PowerPoint Templates and Slides will let you Hit the right notes. Watch your audience start singing to your tune. Download our Shapes PowerPoint Templates because Our PowerPoint Templates and Slides will fulfill your every need. Use them and effectively satisfy the desires of your audience. Present our Signs PowerPoint Templates because Our PowerPoint Templates and Slides will provide you a launch platform. Give a lift off to your ideas and send them into orbit. Use our Metaphors-Visual Concepts PowerPoint Templates because You have a driving passion to excel in your field. Our PowerPoint Templates and Slides will prove ideal vehicles for your ideas.Use these PowerPoint slides for presentations relating to business, chart, circle, circular, diagram, economy, finance, framework, graph, isolated, percentage, pie chart, results, scheme, statistics, stats, strategy, success. The prominent colors used in the PowerPoint template are Blue, Green, Blue light. Affiliate our Data Interpretations Market Analysis Templates For Business Plan PowerPoint to your thoughts. They will develop an affinity for them.
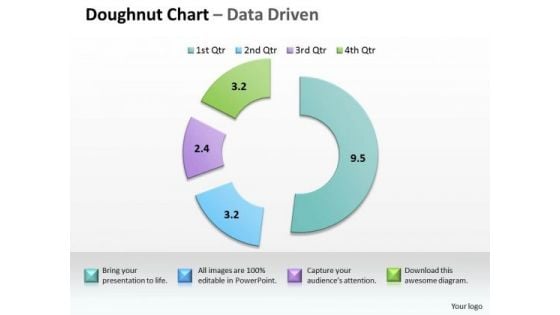
Data Analysis In Excel Completion Project Management PowerPoint Templates
Touch Base With Our data analysis in excel completion project management Powerpoint Templates . Review Your Growth With Your Audience.
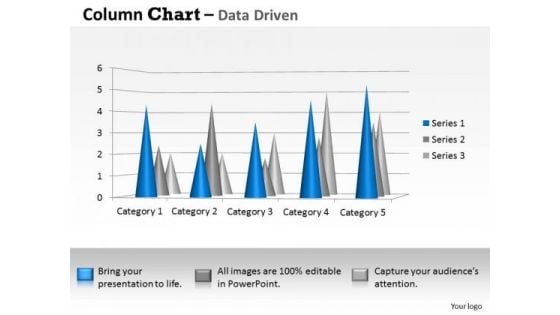
Data Analysis Techniques 3d Distribution Of In Sets PowerPoint Templates
Your Thoughts Will Be The Main Course. Provide The Dressing With Our data analysis techniques 3d distribution of in sets Powerpoint Templates .
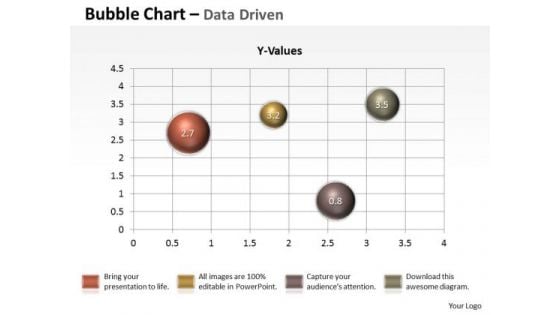
Data Analysis Techniques 3d Graphical Presentation Of PowerPoint Templates
Our data analysis techniques 3d graphical presentation of Powerpoint Templates Will Follow The Drill. They Accomplish The Task Assigned To Them.

Data Analysis Excel Bar Graph To Compare PowerPoint Templates
Get The Domestics Right With Our data analysis excel bar graph to compare Powerpoint Templates. Create The Base For Thoughts To Grow.
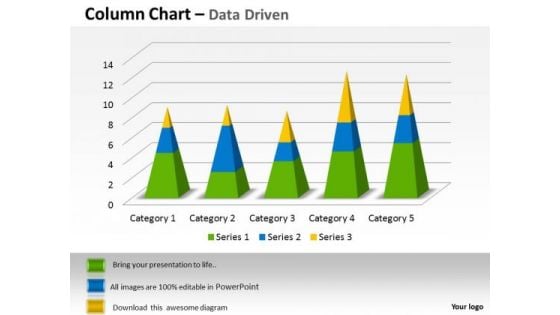
Examples Of Data Analysis Market 3d Categories Sets PowerPoint Templates
Our examples of data analysis market 3d categories sets Powerpoint Templates Give Your Thoughts Their Due. They Project Them With Full Intensity.
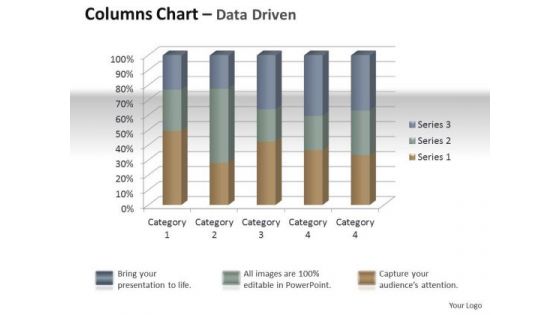
Marketing Data Analysis 3d Quality Control Of Units PowerPoint Templates
Establish Your Dominion With Our marketing data analysis 3d quality control of units Powerpoint Templates . Rule The Stage With Your Thoughts.
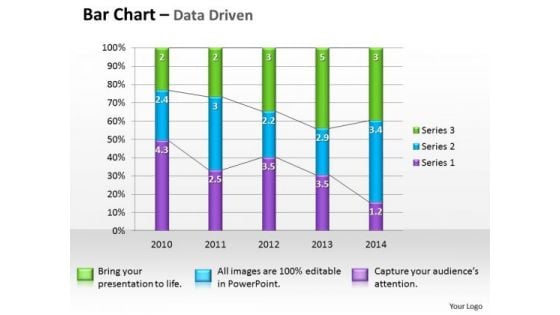
Microsoft Excel Data Analysis Bar Graph PowerPoint Templates
Double The Impact With Our microsoft excel data analysis bar graph Powerpoint Templates . Your Thoughts Will Have An Imposing Effect.

Business Diagram Business Bar Graph For Data Analysis Presentation Template
This business slide displays pie charts with percentage ratios. This diagram is a data visualization tool that gives you a simple way to present statistical information. This slide helps your audience examines and interprets the data you present.
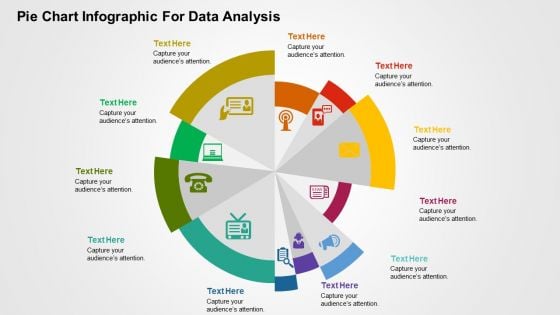
Pie Chart Infographic For Data Analysis PowerPoint Templates
This is one of the most downloaded PowerPoint template. This slide can be used for various purposes and to explain a number of processes. This can be included in your presentation to explain each step of a process and even include its relevance and importance in a single diagram. Using the uneven circular structure of the pie chart, the presenter can also explain random steps or highlight particular steps of process or parts of an organization or business that need special attention of any kind to the audience. Additionally, you can use this slide to show a transformation process or highlight key features of a product.
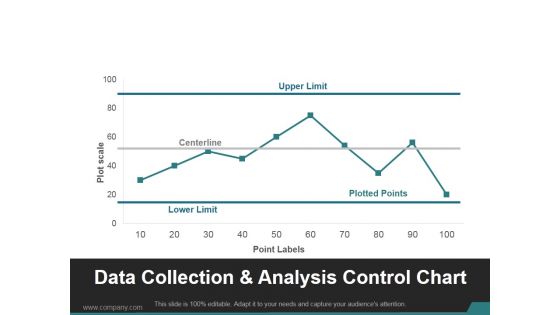
Data Collection And Analysis Control Chart Ppt PowerPoint Presentation Visuals
This is a data collection and analysis control chart ppt powerpoint presentation visuals. This is a ten stage process. The stages in this process are upper limit, centerline, lower limit, plotted points.
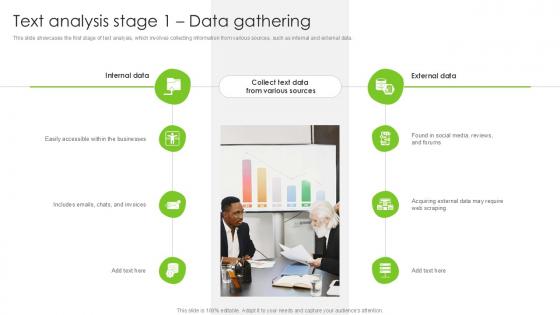
Text Analysis Stage 1 Data Gathering PPT Slide SS
This slide showcases the first stage of text analysis, which involves collecting information from various sources, such as internal and external data. Are you searching for a Text Analysis Stage 1 Data Gathering PPT Slide SS that is uncluttered, straightforward, and original Its easy to edit, and you can change the colors to suit your personal or business branding. For a presentation that expresses how much effort you have put in, this template is ideal With all of its features, including tables, diagrams, statistics, and lists, its perfect for a business plan presentation. Make your ideas more appealing with these professional slides. Download Text Analysis Stage 1 Data Gathering PPT Slide SS from Slidegeeks today. This slide showcases the first stage of text analysis, which involves collecting information from various sources, such as internal and external data.
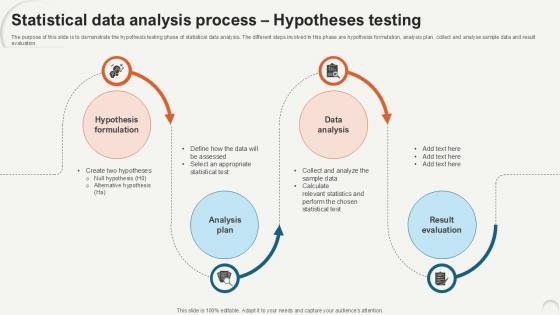
Statistical Data Analysis Process Hypotheses Testing Ppt Slide
The purpose of this slide is to demonstrate the hypothesis testing phase of statistical data analysis. The different steps involved in this phase are hypothesis formulation, analysis plan, collect and analyse sample data and result evaluation. There are so many reasons you need a Statistical Data Analysis Process Hypotheses Testing Ppt Slide. The first reason is you can not spend time making everything from scratch, Thus, Slidegeeks has made presentation templates for you too. You can easily download these templates from our website easily. The purpose of this slide is to demonstrate the hypothesis testing phase of statistical data analysis. The different steps involved in this phase are hypothesis formulation, analysis plan, collect and analyse sample data and result evaluation.
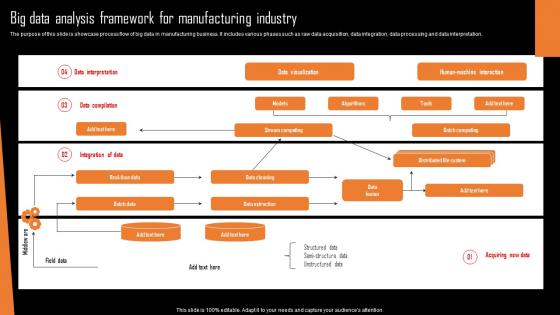
Big Data Analysis Framework For Manufacturing Industry Background Pdf
The purpose of this slide is showcase process flow of big data in manufacturing business. It includes various phases such as raw data acquisition, data integration, data processing and data interpretation.Showcasing this set of slides titled Big Data Analysis Framework For Manufacturing Industry Background Pdf The topics addressed in these templates are Data Visualization, Data Extraction, Data Cleaning All the content presented in this PPT design is completely editable. Download it and make adjustments in color, background, font etc. as per your unique business setting. The purpose of this slide is showcase process flow of big data in manufacturing business. It includes various phases such as raw data acquisition, data integration, data processing and data interpretation.
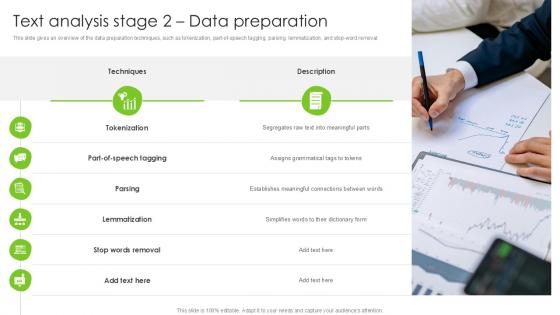
Text Analysis Stage 2 Data Preparation PPT Sample SS
This slide gives an overview of the data preparation techniques, such as tokenization, part-of-speech tagging, parsing, lemmatization, and stop-word removal. Retrieve professionally designed Text Analysis Stage 2 Data Preparation PPT Sample SS to effectively convey your message and captivate your listeners. Save time by selecting pre-made slideshows that are appropriate for various topics, from business to educational purposes. These themes come in many different styles, from creative to corporate, and all of them are easily adjustable and can be edited quickly. Access them as PowerPoint templates or as Google Slides themes. You do not have to go on a hunt for the perfect presentation because Slidegeeks got you covered from everywhere. This slide gives an overview of the data preparation techniques, such as tokenization, part-of-speech tagging, parsing, lemmatization, and stop-word removal.
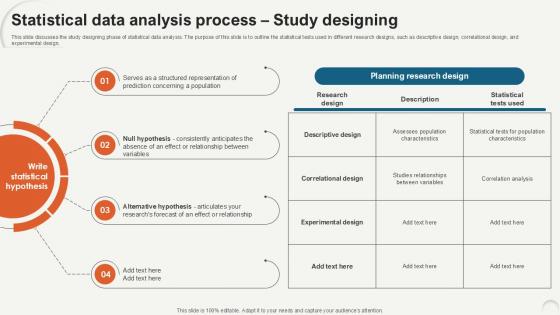
Statistical Data Analysis Process Study Designing Ppt Presentation
This slide discusses the study designing phase of statistical data analysis. The purpose of this slide is to outline the statistical tests used in different research designs, such as descriptive design, correlational design, and experimental design. Do you have to make sure that everyone on your team knows about any specific topic I yes, then you should give Statistical Data Analysis Process Study Designing Ppt Presentation a try. Our experts have put a lot of knowledge and effort into creating this impeccable Statistical Data Analysis Process Study Designing Ppt Presentation. You can use this template for your upcoming presentations, as the slides are perfect to represent even the tiniest detail. You can download these templates from the Slidegeeks website and these are easy to edit. So grab these today This slide discusses the study designing phase of statistical data analysis. The purpose of this slide is to outline the statistical tests used in different research designs, such as descriptive design, correlational design, and experimental design.
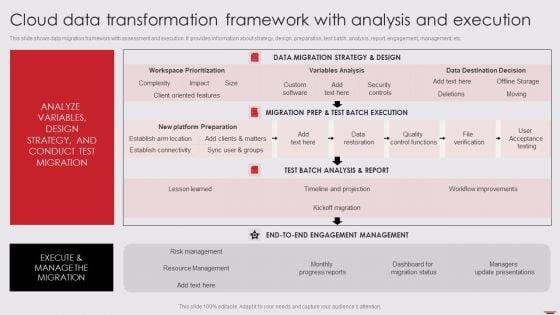
Cloud Data Transformation Framework With Analysis And Execution Diagrams PDF
This slide shows data migration framework with assessment and execution. It provides information about strategy, design, preparation, test batch, analysis, report, engagement, management, etc. Pitch your topic with ease and precision using this Cloud Data Transformation Framework With Analysis And Execution Diagrams PDF. This layout presents information on Data Migration Strategy, Migration Prep Test, Test Batch Analysis. It is also available for immediate download and adjustment. So, changes can be made in the color, design, graphics or any other component to create a unique layout.
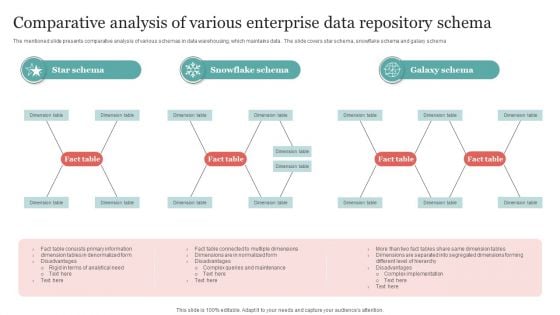
Comparative Analysis Of Various Enterprise Data Repository Schema Microsoft PDF
The mentioned slide presents comparative analysis of various schemas in data warehousing, which maintains data . The slide covers star schema, snowflake schema and galaxy schema Pitch your topic with ease and precision using this Comparative Analysis Of Various Enterprise Data Repository Schema Microsoft PDF. This layout presents information on Galaxy Schema, Snowflake Schema, Star Schema. It is also available for immediate download and adjustment. So, changes can be made in the color, design, graphics or any other component to create a unique layout.
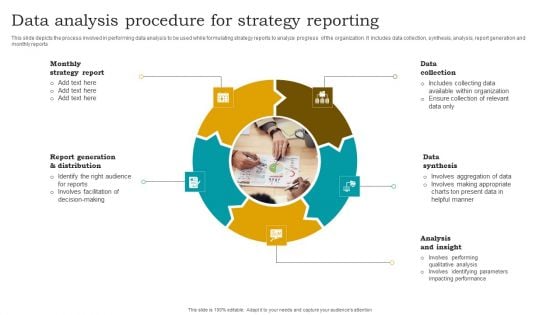
Data Analysis Procedure For Strategy Reporting Designs PDF
This slide depicts the process involved in performing data analysis to be used while formulating strategy reports to analyze progress of the organization. It includes data collection, synthesis, analysis, report generation and monthly reports. Presenting Data Analysis Procedure For Strategy Reporting Designs PDF to dispense important information. This template comprises five stages. It also presents valuable insights into the topics including Data Collection, Data Synthesis, Analysis And Insight. This is a completely customizable PowerPoint theme that can be put to use immediately. So, download it and address the topic impactfully.
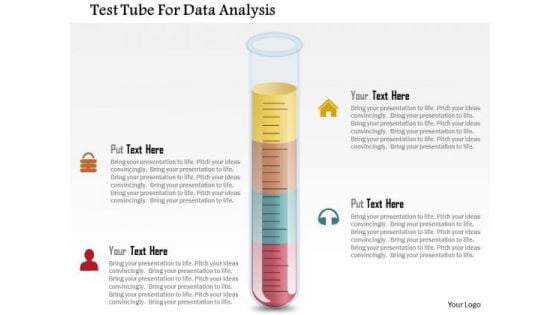
Business Diagram Test Tube For Data Analysis Presentation Template
Graphic of test tube with lock and headphone icons have been used to design this Power Point template. You may use this diagram for data analysis and research. Present your views using our innovative slide and be assured of leaving a lasting impression.
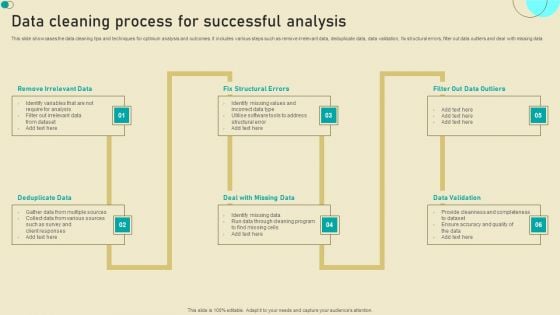
Data Cleaning Process For Successful Analysis Diagrams PDF
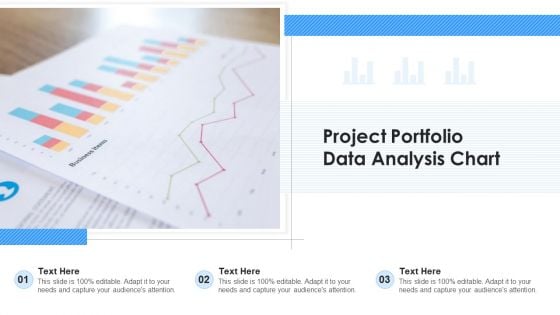
Project Portfolio Data Analysis Chart Ppt Ideas Gallery PDF
Presenting project portfolio data analysis chart ppt ideas gallery pdf to dispense important information. This template comprises three stages. It also presents valuable insights into the topics including project portfolio data analysis chart. This is a completely customizable PowerPoint theme that can be put to use immediately. So, download it and address the topic impactfully.
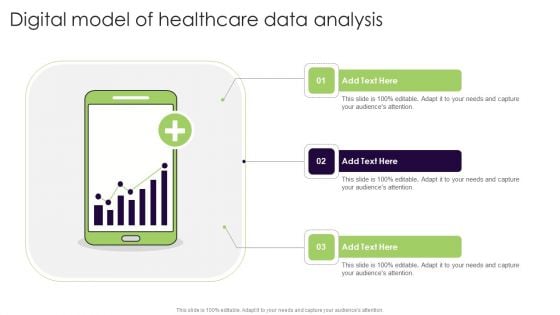
Digital Model Of Healthcare Data Analysis Demonstration PDF
Presenting Digital Model Of Healthcare Data Analysis Demonstration PDF to dispense important information. This template comprises three stages. It also presents valuable insights into the topics including Digital Model, Healthcare Data Analysis. This is a completely customizable PowerPoint theme that can be put to use immediately. So, download it and address the topic impactfully.
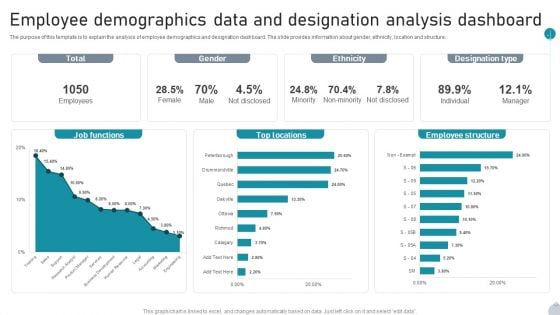
Employee Demographics Data And Designation Analysis Dashboard Introduction PDF
The purpose of this template is to explain the analysis of employee demographics and designation dashboard. The slide provides information about gender, ethnicity, location and structure. Pitch your topic with ease and precision using this Employee Demographics Data And Designation Analysis Dashboard Introduction PDF. This layout presents information on Job Functions, Top Locations, Employee Structure It is also available for immediate download and adjustment. So, changes can be made in the color, design, graphics or any other component to create a unique layout.
Data Analysis Marketing Ppt PowerPoint Presentation Ideas Examples Cpb
This is a data analysis marketing ppt powerpoint presentation ideas examples cpb. This is a two stage process. The stages in this process are data analysis marketing.
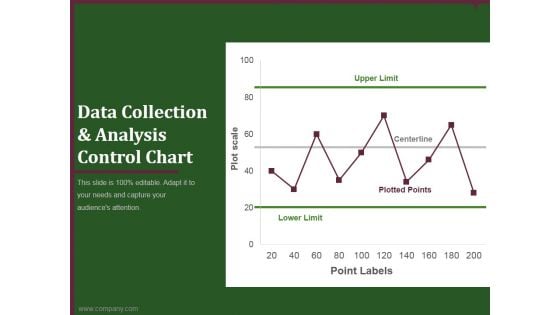
data collection and analysis control chart ppt powerpoint presentation styles
This is a data collection and analysis control chart ppt powerpoint presentation styles. This is a one stage process. The stages in this process are upper limit, centerline, plotted points, lower limit, point labels.
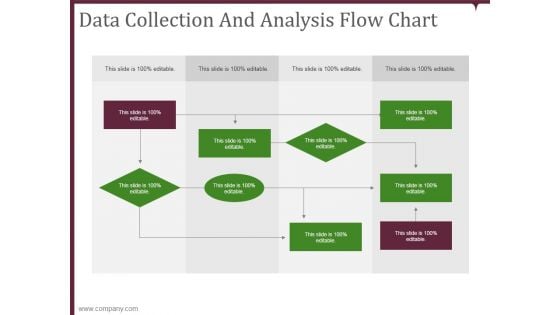
data collection and analysis flow chart ppt powerpoint presentation microsoft
This is a data collection and analysis flow chart ppt powerpoint presentation microsoft. This is a nine stage process. The stages in this process are business, planning, marketing, strategy, management.
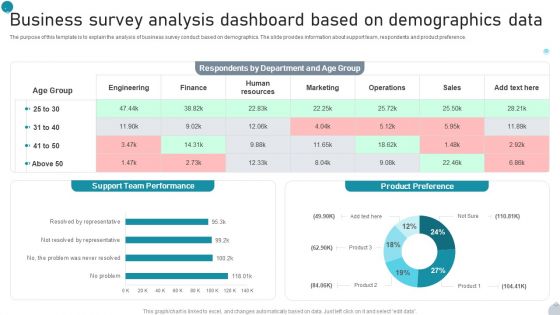
Business Survey Analysis Dashboard Based On Demographics Data Microsoft PDF
The purpose of this template is to explain the analysis of business survey conduct based on demographics. The slide provides information about support team, respondents and product preference. Pitch your topic with ease and precision using this Business Survey Analysis Dashboard Based On Demographics Data Microsoft PDF. This layout presents information on Support, Team Performance, Product Preference It is also available for immediate download and adjustment. So, changes can be made in the color, design, graphics or any other component to create a unique layout.

 Home
Home