Data Analysis Icon
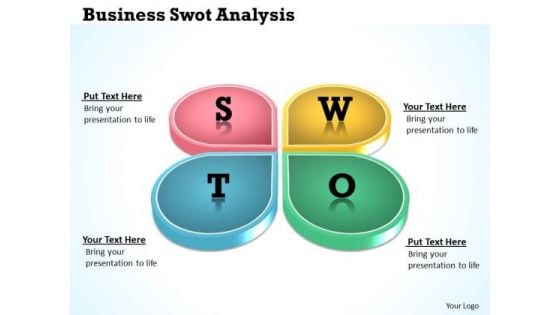
Strategic Management Business Swot Analysis Sales Diagram
Edit Your Work With Our Strategic Management Business Swot Analysis Sales Diagram Powerpoint Templates. They Will Help You Give The Final Form.
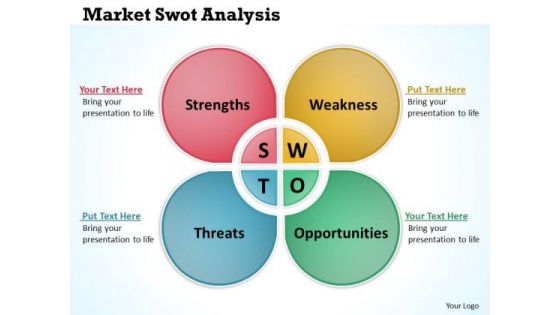
Strategic Management Market Swot Analysis Marketing Diagram
Our Strategic Management Market Swot Analysis Marketing Diagram Powerpoint Templates And Your Ideas Make A Great Doubles Pair. Play The Net With Assured Hands.
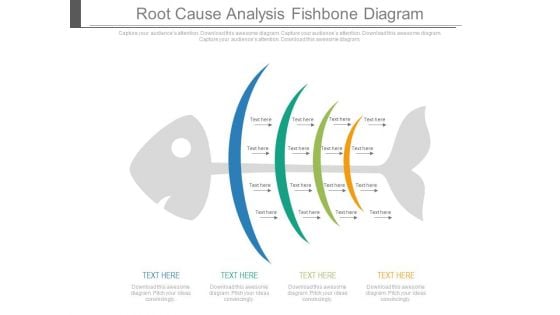
Root Cause Analysis Fishbone Diagram Ppt Slides
This is a root cause analysis fishbone diagram ppt slides. This is a four stage process. The stages in this process are business, success. \n \n
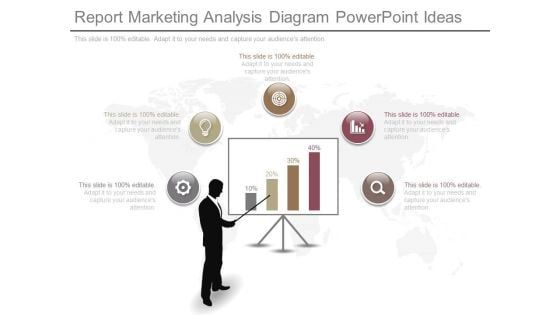
Report Marketing Analysis Diagram Powerpoint Ideas
This is a report marketing analysis diagram powerpoint ideas. This is a five stage process. The stages in this process are man, communication, board, graph, business.
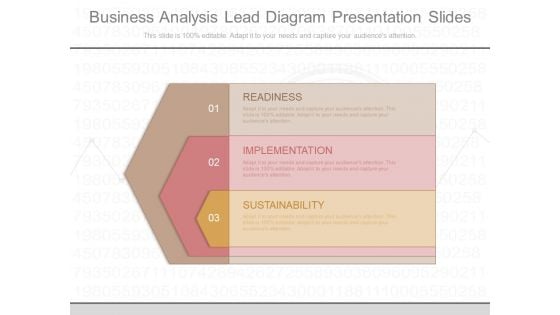
Business Analysis Lead Diagram Presentation Slides

Business Analysis Maturity Model Diagram Ppt Example
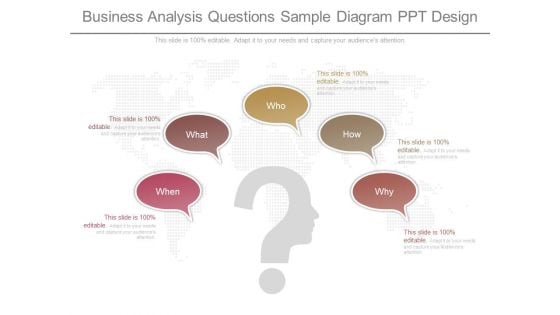
Business Analysis Questions Sample Diagram Ppt Design
This is a business analysis questions sample diagram ppt design. This is a five stage process. The stages in this process are when, what, who, how, why.
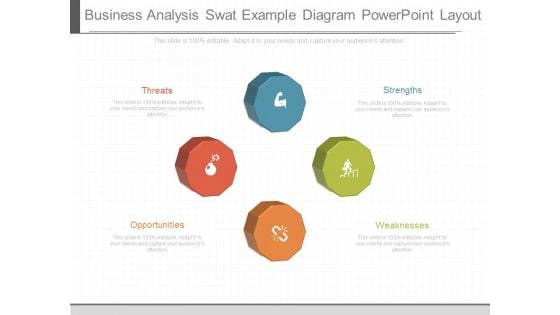
Business Analysis Swat Example Diagram Powerpoint Layout
This is a business analysis swat example diagram powerpoint layout. This is a four stage process. The stages in this process are threats, opportunities, strengths, weaknesses.
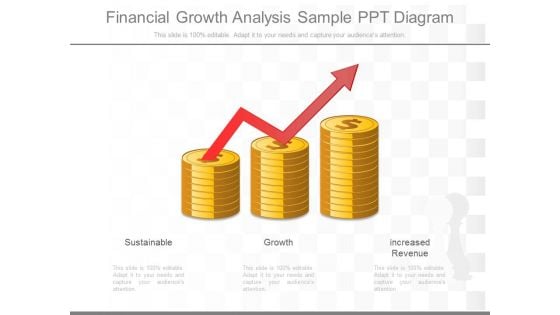
Financial Growth Analysis Sample Ppt Diagram
This is a financial growth analysis sample ppt diagram. This is a three stage process. The stages in this process are sustainable, growth, increased revenue.
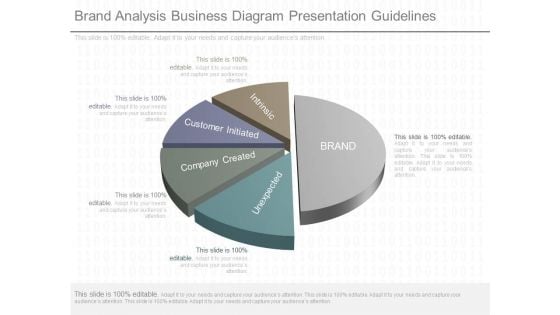
Brand Analysis Business Diagram Presentation Guidelines
This is a brand analysis business diagram presentation guidelines. This is a five stage process. The stages in this process are brand, intrinsic, customer initiated, company created, unexpected.

Business Training And Analysis Diagram Ppt Slides
This is a business training and analysis diagram ppt slides. This is a four stage process. The stages in this process are materials, people, methods, environment.
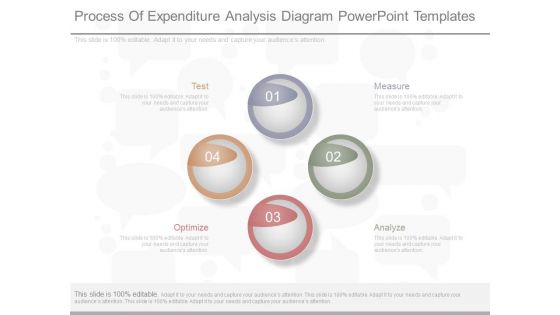
Process Of Expenditure Analysis Diagram Powerpoint Templates
This is a process of expenditure analysis diagram powerpoint templates. This is a four stage process. The stages in this process are test, optimize, measure, analyze.
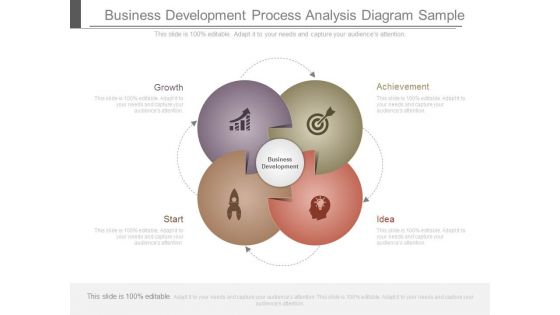
Business Development Process Analysis Diagram Sample
This is a business development process analysis diagram sample. This is a four stage process. The stages in this process are business development, achievement, idea, start, growth.
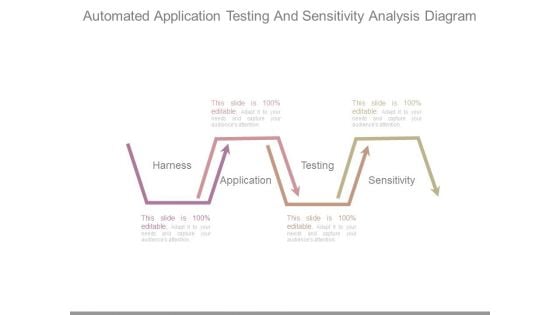
Automated Application Testing And Sensitivity Analysis Diagram
This is a automated application testing and sensitivity analysis diagram. This is a four stage process. The stages in this process are harness, application, testing, sensitivity.
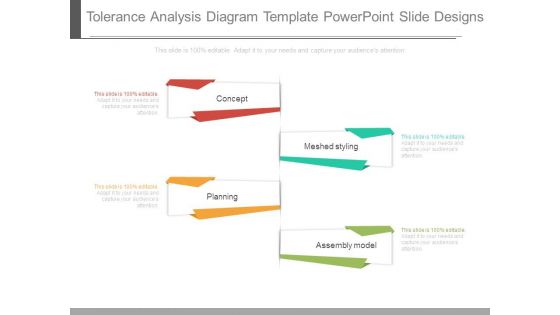
Tolerance Analysis Diagram Template Powerpoint Slide Designs
This is a tolerance analysis diagram template powerpoint slide designs. This is a four stage process. The stages in this process are concept, planning, meshed styling, assembly model.

Calculation Model Analysis Diagram Ppt Sample Download
This is a calculation model analysis diagram ppt sample download. This is a five stage process. The stages in this process are precision, accuracy, bias, repeatability, linearity.
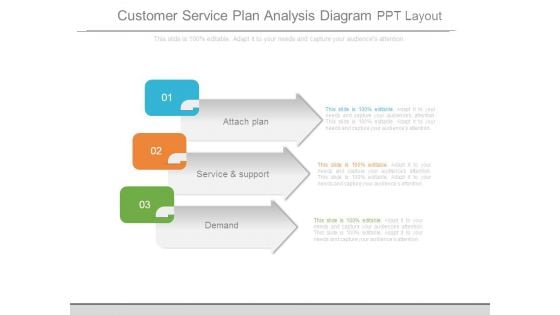
Customer Service Plan Analysis Diagram Ppt Layout
This is a customer service plan analysis diagram ppt layout. This is a three stage process. The stages in this process are attach plan, service and support, demand.
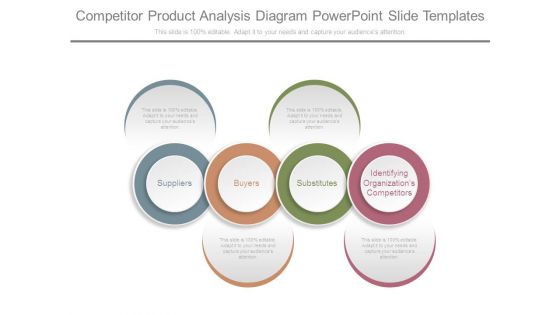
Competitor Product Analysis Diagram Powerpoint Slide Templates
This is a competitor product analysis diagram powerpoint slide templates. This is a four stage process. The stages in this process are suppliers, buyers, substitutes, identifying organization competitors.
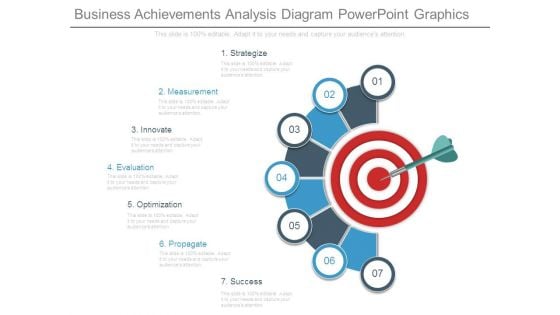
Business Achievements Analysis Diagram Powerpoint Graphics
This is a business achievements analysis diagram powerpoint graphics. This is a seven stage process. The stages in this process are strategize, measurement, innovate, evaluation, optimization, propagate, success.
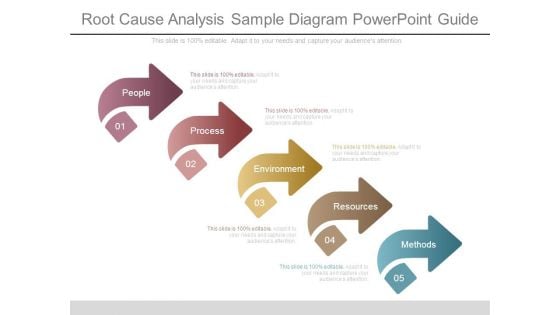
Root Cause Analysis Sample Diagram Powerpoint Guide
This is a root cause analysis sample diagram powerpoint guide. This is a five stage process. The stages in this process are people, process, environment, resources, methods.
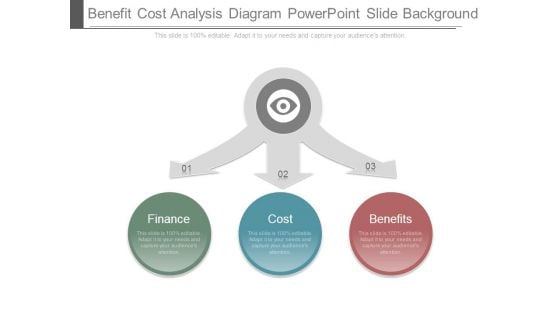
Benefit Cost Analysis Diagram Powerpoint Slide Background
This is a benefit cost analysis diagram powerpoint slide background. This is a three stage process. The stages in this process are finance, cost, benefits.
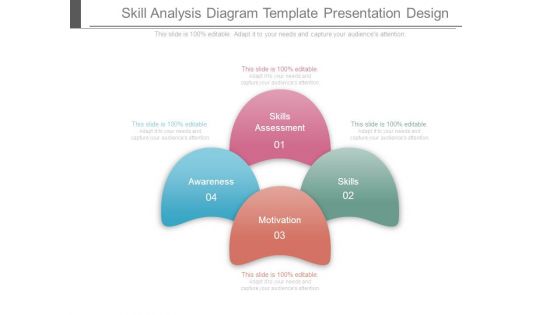
Skill Analysis Diagram Template Presentation Design
This is a skill analysis diagram template presentation design. This is a four stage process. The stages in this process are skills assessment, skills, awareness, motivation.
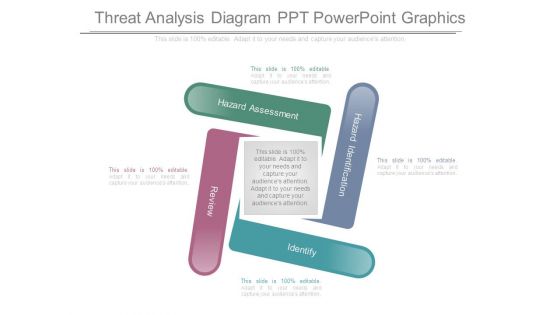
Threat Analysis Diagram Ppt Powerpoint Graphics
This is a threat analysis diagram ppt powerpoint graphics. This is a four stage process. The stages in this process are hazard assessment, hazard identification, review, identify.
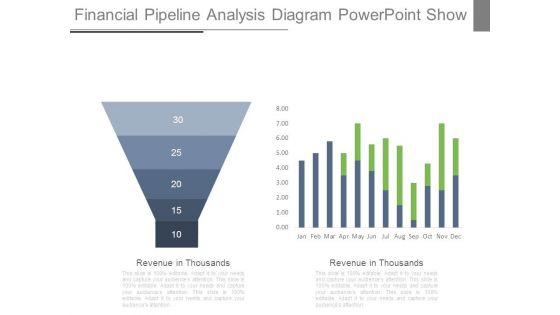
Financial Pipeline Analysis Diagram Powerpoint Show
This is a financial pipeline analysis diagram powerpoint show. This is a five stage process. The stages in this process are revenue in thousands, graph, growth.
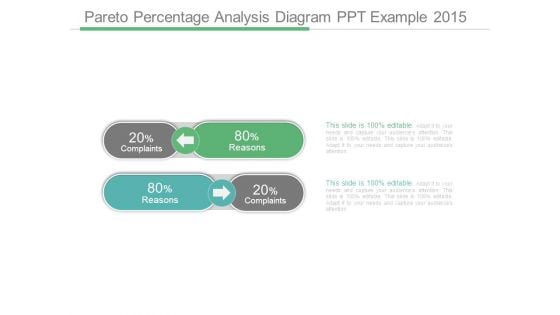
Pareto Percentage Analysis Diagram Ppt Example 2015
This is a pareto percentage analysis diagram ppt example 2015. This is a two stage process. The stages in this process are complaints, reasons.
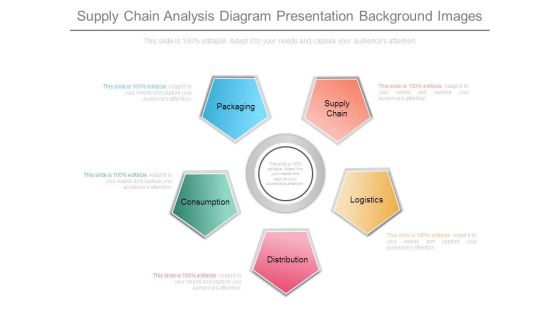
Supply Chain Analysis Diagram Presentation Background Images
This is a supply chain analysis diagram presentation background images. This is a five stage process. The stages in this process are packaging, supply chain, consumption, distribution, logistics.
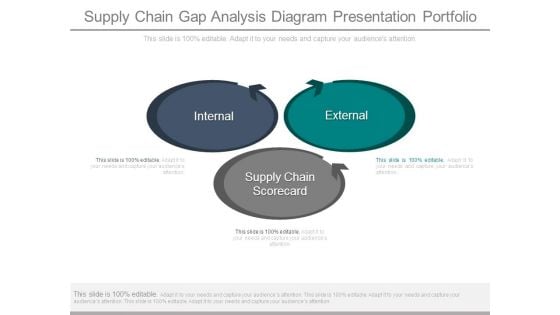
Supply Chain Gap Analysis Diagram Presentation Portfolio
This is a supply chain gap analysis diagram presentation portfolio. This is a three stage process. The stages in this process are internal, external, supply chain scorecard.
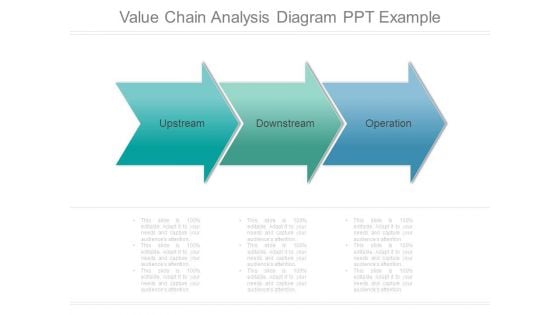
Value Chain Analysis Diagram Ppt Example
This is a value chain analysis diagram ppt example. This is a three stage process. The stages in this process are upstream, downstream, operation.
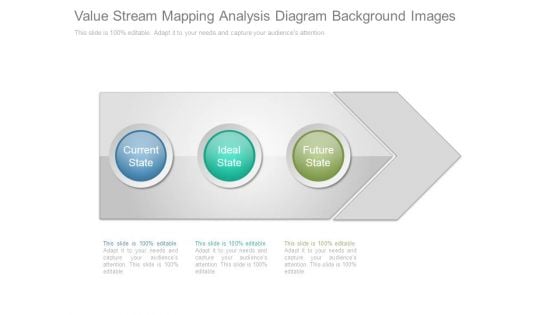
Value Stream Mapping Analysis Diagram Background Images
This is a value stream mapping analysis diagram background images. This is a three stage process. The stages in this process are current state, ideal state, future state.
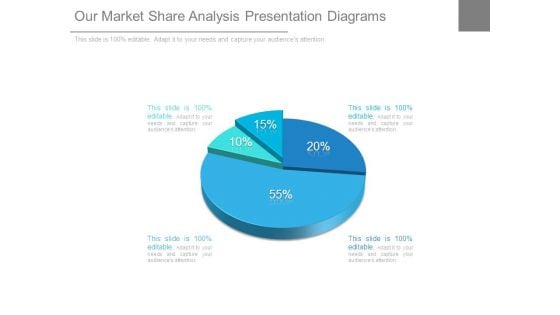
Our Market Share Analysis Presentation Diagrams
This is a our market share analysis presentation diagrams. This is a four stage process. The stages in this process are pie, finance, growth, success, business.
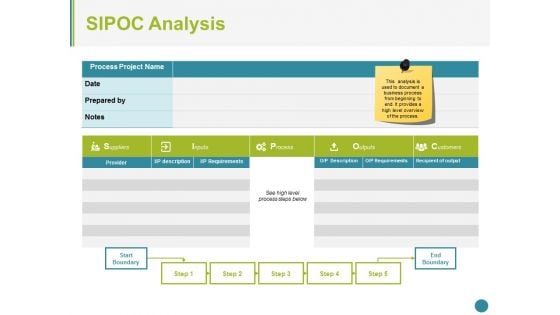
Sipoc Analysis Ppt PowerPoint Presentation Inspiration Diagrams
This is a sipoc analysis ppt powerpoint presentation inspiration diagrams. This is a five stage process. The stages in this process are suppliers, inputs, process, outputs, customers.
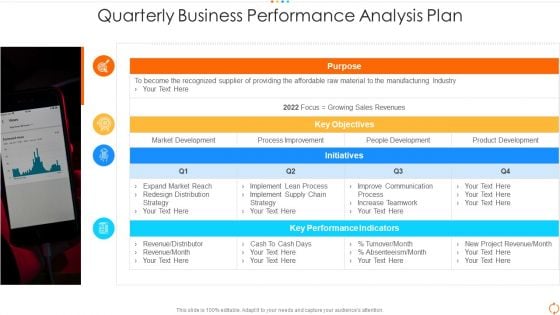
Quarterly Business Performance Analysis Plan Guidelines PDF
Presenting quarterly business performance analysis plan guidelines pdf to dispense important information. This template comprises one stages. It also presents valuable insights into the topics including quarterly business performance analysis plan. This is a completely customizable PowerPoint theme that can be put to use immediately. So, download it and address the topic impactfully.
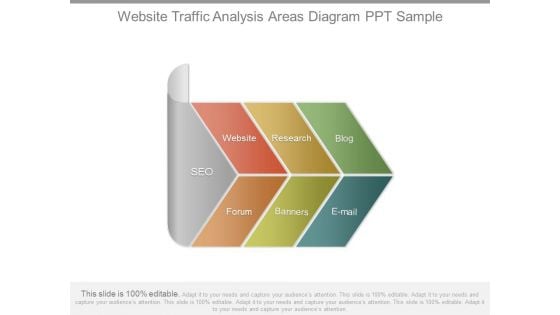
Website Traffic Analysis Areas Diagram Ppt Sample
This is a website traffic analysis areas diagram ppt sample. This is a four stage process. The stages in this process are seo, website, research, blog, forum, banners, e mail.
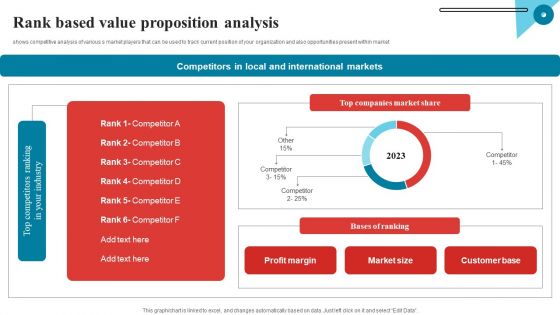
Rank Based Value Proposition Analysis Mockup PDF
shows competitive analysis of various s market players that can be used to track current position of your organization and also opportunities present within market Pitch your topic with ease and precision using this Rank Based Value Proposition Analysis Mockup PDF. This layout presents information on Analysis, Rank, Markets. It is also available for immediate download and adjustment. So, changes can be made in the color, design, graphics or any other component to create a unique layout.
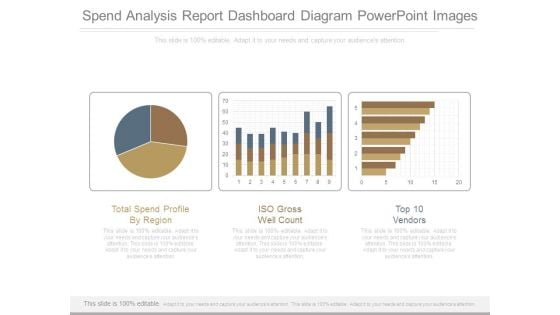
Spend Analysis Report Dashboard Diagram Powerpoint Images
This is a spend analysis report dashboard diagram powerpoint images. This is a three stage process. The stages in this process are total spend profile by region, iso gross well count, top 10 vendors.
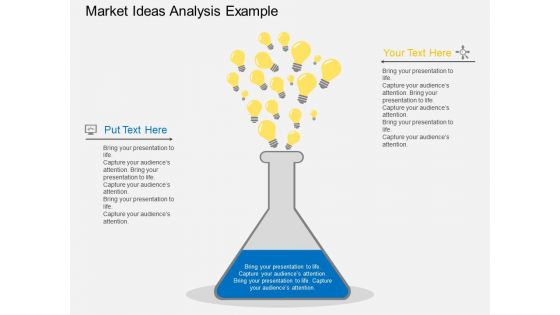
Market Ideas Analysis Example Powerpoint Template
This business slide displays graphics of flasks with multiple bulbs. Download this PowerPoint diagram to display analysis of various marketing ideas. Enlighten your audience with your breathtaking ideas.
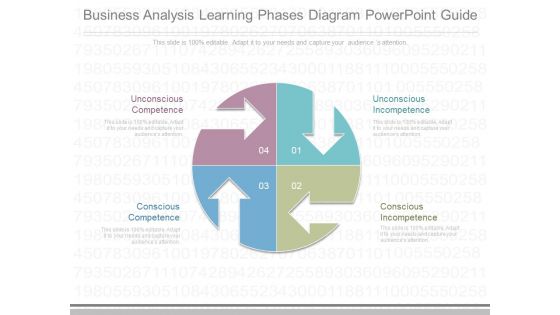
Business Analysis Learning Phases Diagram Powerpoint Guide
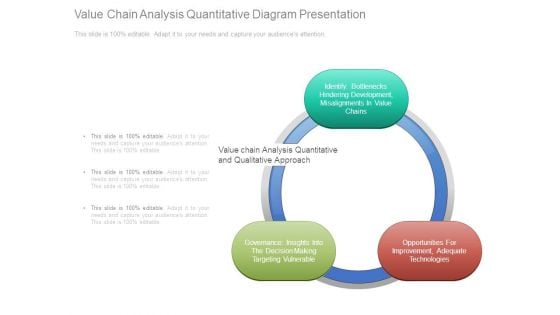
Value Chain Analysis Quantitative Diagram Presentation
This is a value chain analysis quantitative diagram presentation. This is a three stage process. The stages in this process are identify bottlenecks hindering development, misalignments in value chains, governance insights into the decision making targeting vulnerable, opportunities for improvement, adequate technologies, value chain analysis quantitative and qualitative approach.
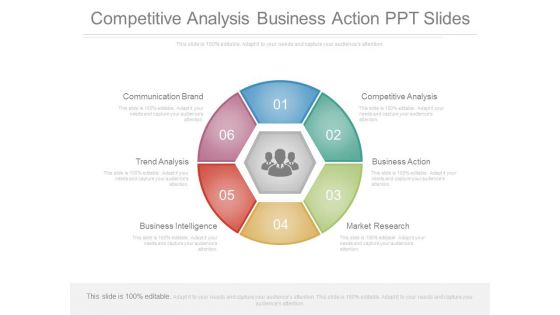
Competitive Analysis Business Action Ppt Slides
This is a competitive analysis business action ppt slides. This is a four stage process. The stages in this process circle chart, process and flow, business.
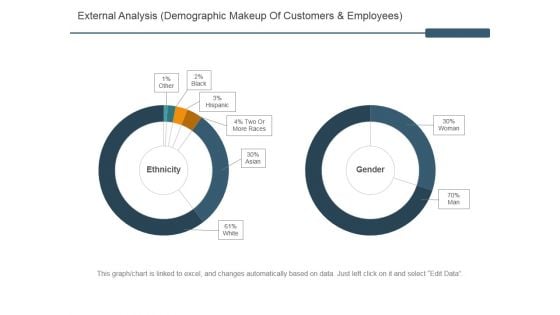
External Analysis Ppt PowerPoint Presentation Infographics Information
This is a external analysis ppt powerpoint presentation infographics information. This is a seven stage process. The stages in this process are education, police, hm forces, local government, civil service.
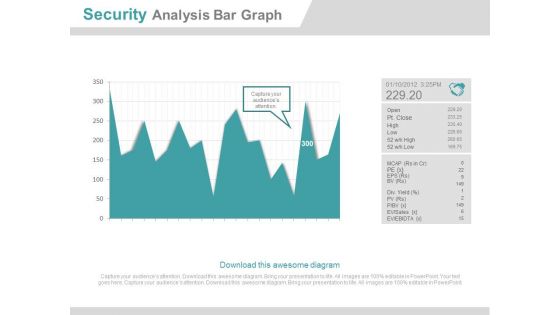
Security Analysis Bar Graph Ppt Slides
This is a security analysis bar chart ppt slides. This is a one stage process. The stages in this process are business, finance, marketing.
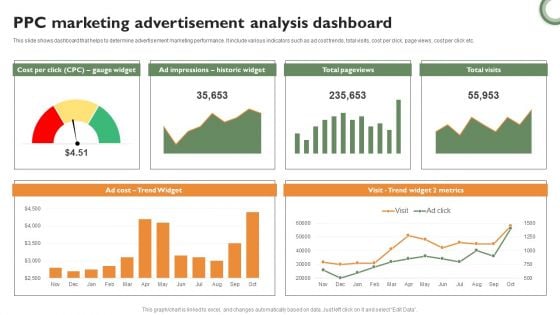
PPC Marketing Advertisement Analysis Dashboard Background PDF
This slide shows dashboard that helps to determine advertisement marketing performance. It include various indicators such as ad cost trends, total visits, cost per click, page views, cost per click etc. Showcasing this set of slides titled PPC Marketing Advertisement Analysis Dashboard Background PDF. The topics addressed in these templates are PPC Marketing, Advertisement Analysis Dashboard. All the content presented in this PPT design is completely editable. Download it and make adjustments in color, background, font etc. as per your unique business setting.
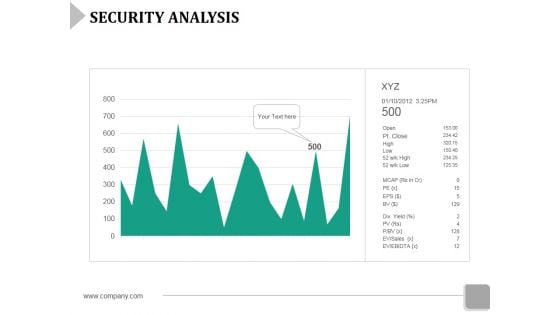
Security Analysis Ppt Powerpoint Presentation File Tips
This is a security analysis ppt powerpoint presentation file tips. This is a one stage process. The stages in this process are graph, marketing, business, growth, finance.
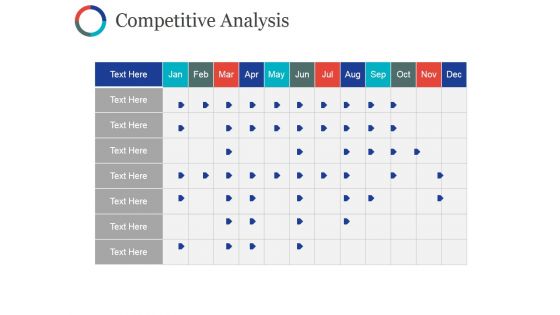
Competitive Analysis Ppt PowerPoint Presentation Summary Model
This is a competitive analysis ppt powerpoint presentation summary model. This is a six stage process. The stages in this process are business, marketing, strategy, bar, finance.

Competitive Analysis Ppt PowerPoint Presentation Portfolio Good
This is a competitive analysis ppt powerpoint presentation portfolio good. This is a one stage process. The stages in this process are business, marketing, strategy, planning, finance.
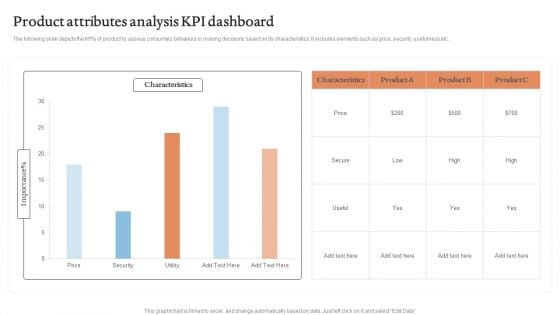
Product Attributes Analysis KPI Dashboard Graphics PDF
The following slide depicts the KPIs of product to assess consumers behaviour in making decisions based on its characteristics. It includes elements such as price, security, usefulness etc.Showcasing this set of slides titled Product Attributes Analysis KPI Dashboard Graphics PDF. The topics addressed in these templates are Characteristics, Product Attributes, Analysis KPI Dashboard. All the content presented in this PPT design is completely editable. Download it and make adjustments in color, background, font etc. as per your unique business setting.
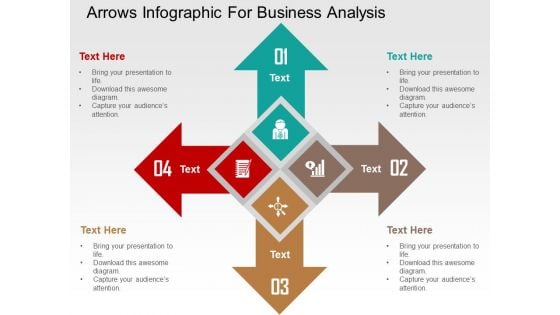
Arrows Infographic For Business Analysis Powerpoint Templates
Concept of business analysis can be well explained with this power point template. This diagram contains design of arrow infographic. Use this slide to make impressive presentations.
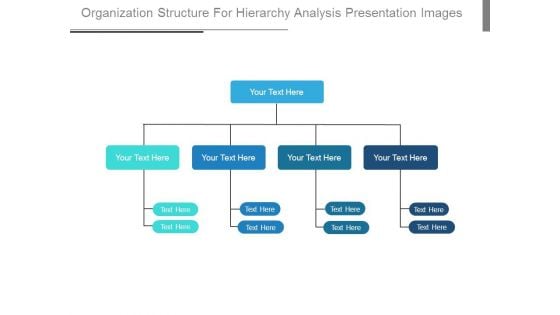
Organization Structure For Hierarchy Analysis Presentation Images
This is a organization structure for hierarchy analysis presentation images. This is a three stage process. The stages in this process are business, marketing, management, success, diagram.
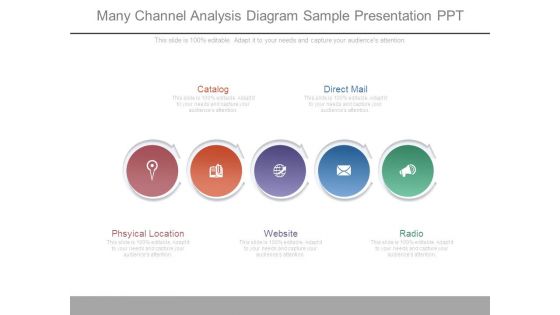
Many Channel Analysis Diagram Sample Presentation Ppt
This is a Many Channel Analysis Diagram Sample Presentation Ppt. This is a five stage process. The stages in this process are catalog, direct mail, phsyical location, website, radio.
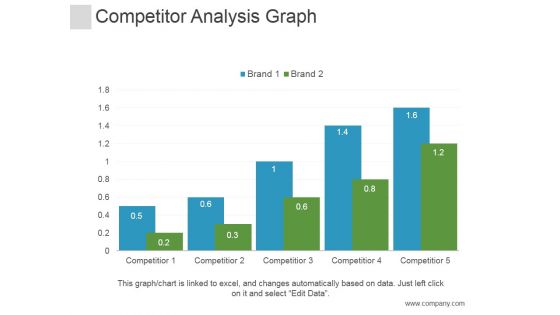
Competitor Analysis Graph Ppt PowerPoint Presentation Styles
This is a competitor analysis graph ppt powerpoint presentation styles. This is a five stage process. The stages in this process are graph, business, marketing, competitor.
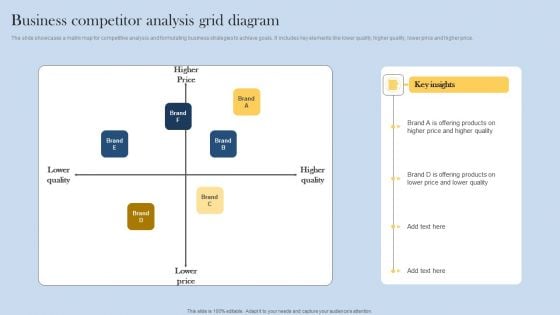
Business Competitor Analysis Grid Diagram Graphics PDF
The slide showcases a matrix map for competitive analysis and formulating business strategies to achieve goals. It includes key elements like lower quality, higher quality, lower price and higher price. Presenting Business Competitor Analysis Grid Diagram Graphics PDF to dispense important information. This template comprises one stages. It also presents valuable insights into the topics including Offering Products, Business Competitor, Analysis Grid Diagram. This is a completely customizable PowerPoint theme that can be put to use immediately. So, download it and address the topic impactfully.
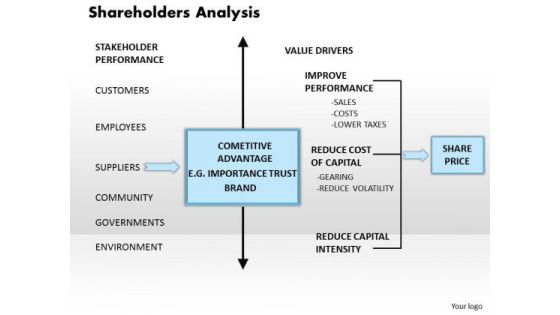
Business Framework Shareholders Analysis PowerPoint Presentation
Explain the concept of shareholder analysis with this innovative graphic template. This power point template contains the graphic of blue colored text box and arrow. This diagram shows the various state of analysis. Use this diagram and build innovative presentation for share and finance related topics.

Business Analysis Levels Sample Diagram Examples Slides
This is a business analysis levels sample diagram examples slides. This is a one stage process. The stages in this process are business analysis, strategic, operational, tactical, vision goal objective, structure polices, i want, you want, we weant, they want, opportunities, problems, application architecture, text, cep, vp marketing, vp proctive, sales manager, project manager, vpit, prodect owner, sme.
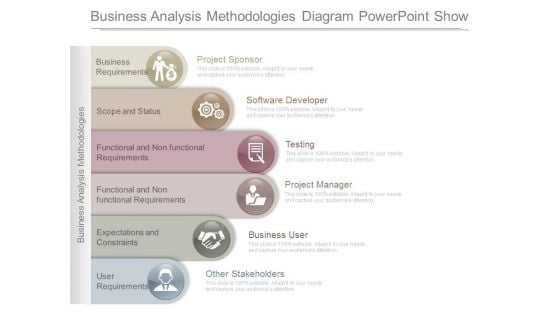
Business Analysis Methodologies Diagram Powerpoint Show
This is a business analysis methodologies diagram powerpoint show. This is a six stage process. The stages in this process are business requirements, scope and status, functional and non functional requirements, functional and non functional requirements, expectations and constraints, user requirements, project sponsor, software developer, testing, project manager, business user, other stakeholders, business analysis methodologies.
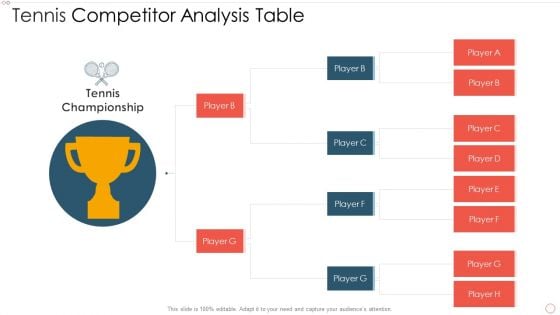
Tennis Competitor Analysis Table Inspiration PDF
Presenting tennis competitor analysis table inspiration pdf to dispense important information. This template comprises three stages. It also presents valuable insights into the topics including tennis competitor analysis table. This is a completely customizable PowerPoint theme that can be put to use immediately. So, download it and address the topic impactfully.
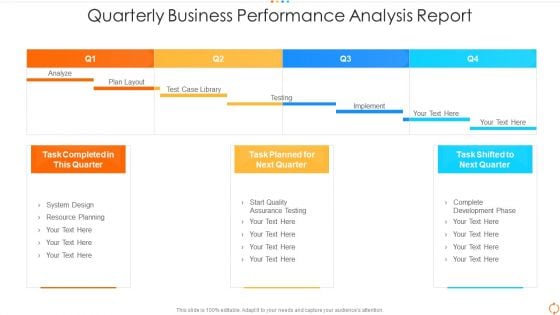
Quarterly Business Performance Analysis Report Structure PDF
Presenting quarterly business performance analysis report structure pdf to dispense important information. This template comprises three stages. It also presents valuable insights into the topics including quarterly business performance analysis report. This is a completely customizable PowerPoint theme that can be put to use immediately. So, download it and address the topic impactfully.
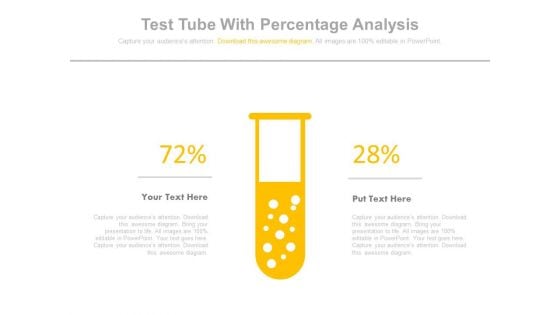
Test Tubes For Statistical Analysis Powerpoint Slides
This business slide contains graphics of test tubes. This diagram helps to display statistical analysis for business. Visual effect this slide helps in maintaining the flow of the discussion and provides more clarity to the subject.
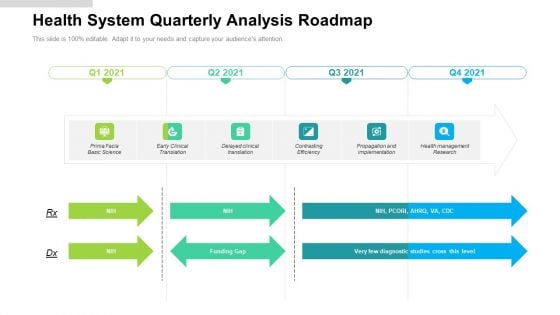
Health System Quarterly Analysis Roadmap Information
Presenting our jaw dropping health system quarterly analysis roadmap information. You can alternate the color, font size, font type, and shapes of this PPT layout according to your strategic process. This PPT presentation is compatible with Google Slides and is available in both standard screen and widescreen aspect ratios. You can also download this well researched PowerPoint template design in different formats like PDF, JPG, and PNG. So utilize this visually appealing design by clicking the download button given below.
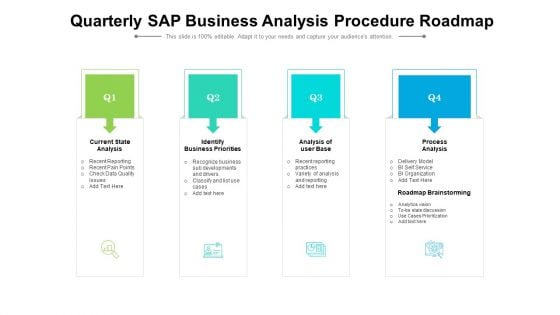
Quarterly SAP Business Analysis Procedure Roadmap Information
Presenting our jaw dropping quarterly sap business analysis procedure roadmap information. You can alternate the color, font size, font type, and shapes of this PPT layout according to your strategic process. This PPT presentation is compatible with Google Slides and is available in both standard screen and widescreen aspect ratios. You can also download this well researched PowerPoint template design in different formats like PDF, JPG, and PNG. So utilize this visually appealing design by clicking the download button given below.
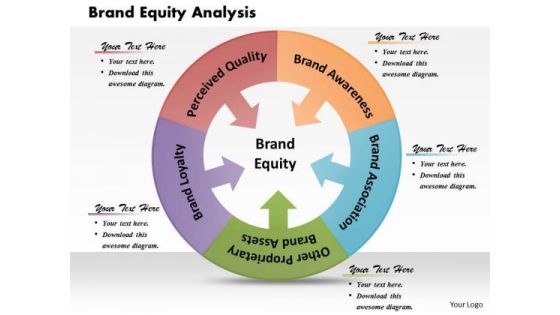
Business Framework Brand Equity Analysis PowerPoint Presentation
Define the term brand equity analysis with our exclusive diagram slide. This power point slide has been designed with graphic of two stage organizational chart which can be used for brand equity analysis. Use this image for financial topics in any business presentations.

 Home
Home