Data Analysis Icon
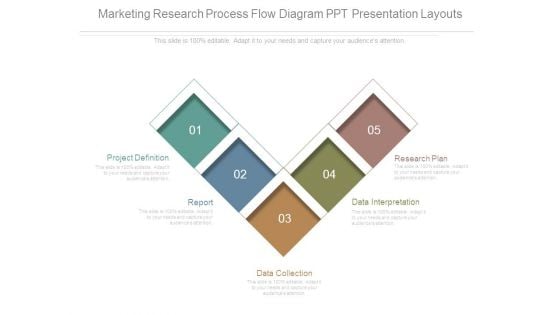
Marketing Research Process Flow Diagram Ppt Presentation Layouts
This is a marketing research process flow diagram ppt presentation layouts. This is a five stage process. The stages in this process are project definition, report, data collection, data interpretation, research plan.
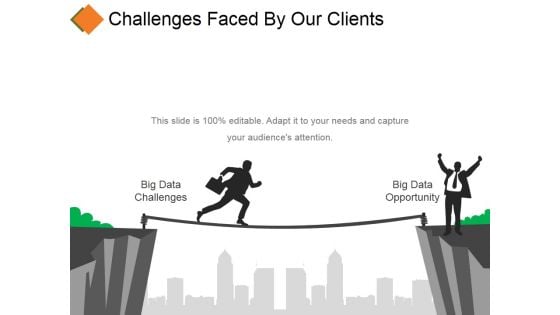
Challenges Faced By Our Clients Template 1 Ppt PowerPoint Presentation Diagrams
This is a challenges faced by our clients template 1 ppt powerpoint presentation diagrams. This is a two stage process. The stages in this process are big data challenges, big data opportunity, threat, communication.
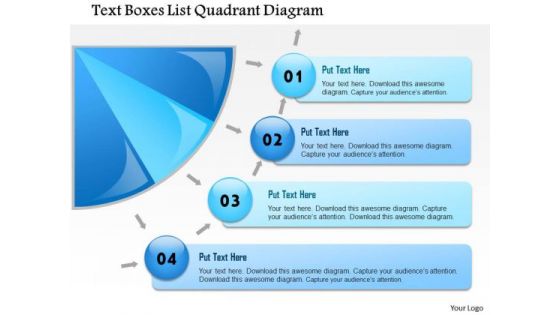
Business Framework Text Boxes List Quadrant Diagram PowerPoint Presentation
A semi circle diagram with text boxes are used to design this power point template slide. This PPT slide contains the concept of displaying business data. This PPT slide may be used for business data representations.
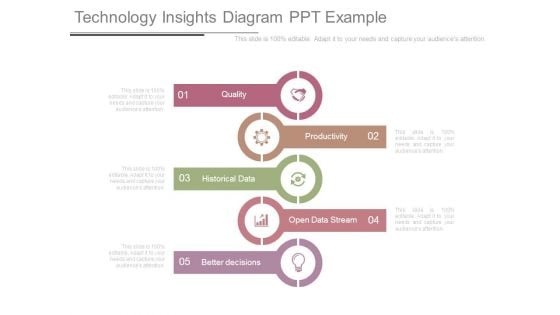
Technology Insights Diagram Ppt Example
This is a technology insights diagram ppt example. This is a five stage process. The stages in this process are quality, productivity, historical data, open data stream, better decisions.
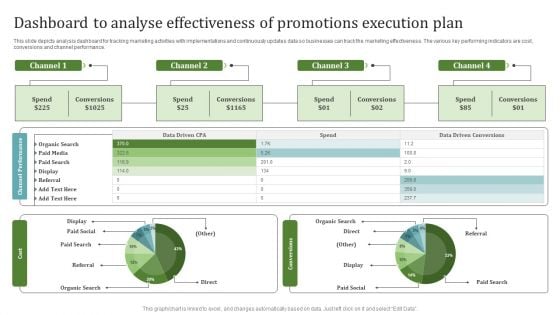
Dashboard To Analyse Effectiveness Of Promotions Execution Plan Diagrams PDF
This slide depicts analysis dashboard for tracking marketing activities with implementations and continuously updates data so businesses can track the marketing effectiveness. The various key performing indicators are cost, conversions and channel performance. Showcasing this set of slides titled Dashboard To Analyse Effectiveness Of Promotions Execution Plan Diagrams PDF. The topics addressed in these templates are Channel Performance, Cost, Conversions. All the content presented in this PPT design is completely editable. Download it and make adjustments in color, background, font etc. as per your unique business setting.
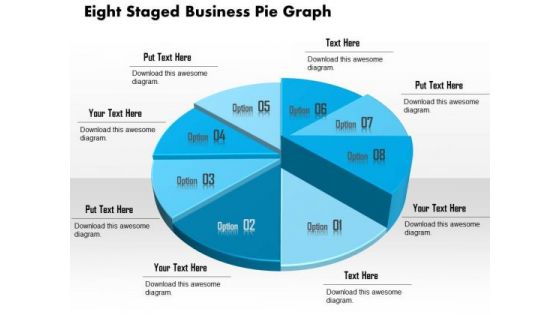
Business Diagram Eight Staged Business Pie Graph Presentation Template
This business slide displays eight staged pie chart. This diagram is a data visualization tool that gives you a simple way to present statistical information. This slide helps your audience examine and interpret the data you present.
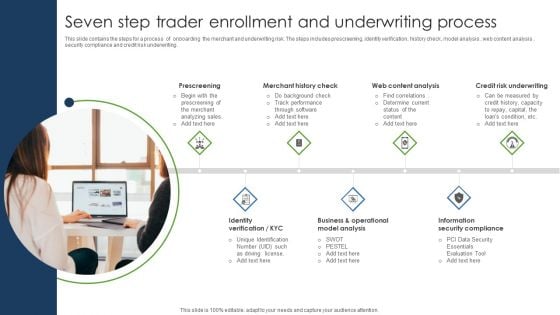
Seven Step Trader Enrollment And Underwriting Process Designs PDF
This slide contains the steps for a process of onboarding the merchant and underwriting risk. The steps includes prescreening, identity verification, history check, model analysis , web content analysis , security compliance and credit risk underwriting. Presenting Seven Step Trader Enrollment And Underwriting Process Designs PDF to dispense important information. This template comprises seven stages. It also presents valuable insights into the topics including Merchant History Check, Web Content Analysis, Credit Risk Underwriting. This is a completely customizable PowerPoint theme that can be put to use immediately. So, download it and address the topic impactfully.

Business Framework Propeller Diagram For PowerPoint Presentation
A three staged text box diagram has been used to decorate this Power point template slide. This slide contains the propeller graphic diagram and display data. Use this PPT for data representation related topics.

Employee Performance Summary Ppt PowerPoint Presentation Styles Slide
This is a employee performance summary ppt powerpoint presentation styles slide. This is a three stage process. The stages in this process are business, icons, marketing, strategy, analysis .
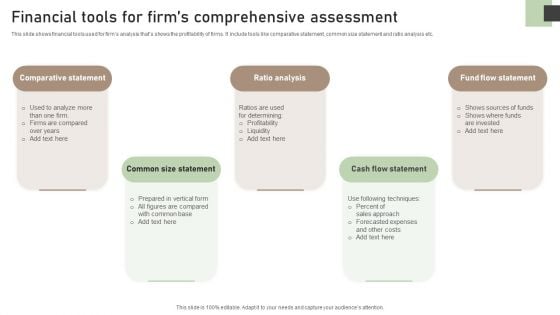
Financial Tools For Firms Comprehensive Assessment Themes PDF
This slide shows financial tools used for firms analysis thats shows the profitability of firms. It include tools like comparative statement, common size statement and ratio analysis etc. Presenting Financial Tools For Firms Comprehensive Assessment Themes PDF to dispense important information. This template comprises five stages. It also presents valuable insights into the topics including Comparative Statement, Common Size Statement, Ratio Analysis. This is a completely customizable PowerPoint theme that can be put to use immediately. So, download it and address the topic impactfully.

Business Diagram Eight Arrows Steps With Globe Presentation Template
Graphic of five staged film roll diagram has been used to craft this power point template diagram. This PPT contains the concept of data representation. Use this PPT for business and marketing data related presentations.
Ppt Complex Flow Business Process PowerPoint Presentation Chart Templates
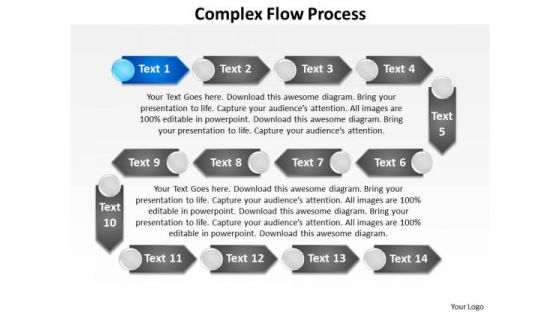
PPT complex flow business process powerpoint presentation chart Templates-This data flow diagram represents processing requirements of a program and the information flows .This diagram can be used during the analysis of requirements for complex systems. This diagram is designed to attract the attention of your audience-PPT complex flow business process powerpoint presentation chart Templates-Advice, Analyze, Arrow, Background, Business, Chart, Concept, Creativity, Decision, Design, Determination, Diagram, Draw, Education, Flowchart, Graphic, Idea, Means, Method, Office, Plan, Pointing, Presentation, Process, Sign, Strategy, Technology Our Ppt Complex Flow Business Process PowerPoint Presentation Chart Templates are quite alluring. They embody the X-factor.
Circular Diagram Of Agile Software Development Powerpoint Templates
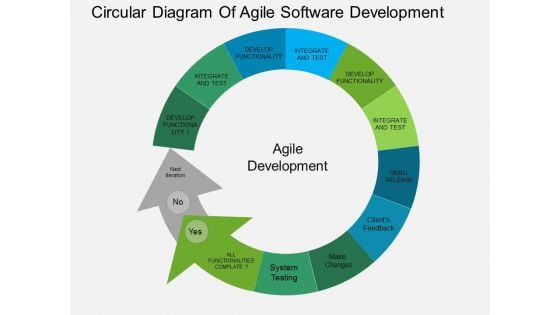
This PowerPoint template has been designed with circular diagram This diagram is a data visualization tool that gives you a simple way to present statistical information. This slide helps your audience examine and interpret the data you present.
Business Diagram Film Roll Diagram With Three Steps Presentation Template
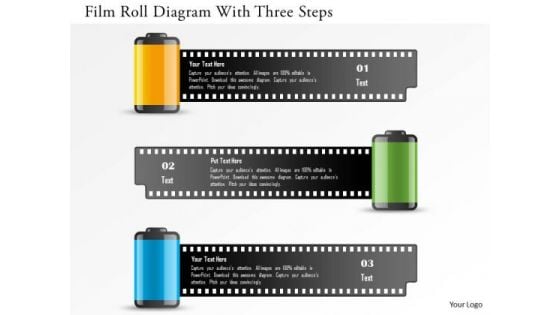
This power point template has been crafted with graphic of three film roll graphics. This PPT contains the concept of data flow. Use this PPT for your data related presentations.
Business Diagram Four Steps Process Diagram Presentation Template
This power point template has been crafted with graphic of dialogue box. This PPT contains the concept of process and data flow. Use this PPT for your business and data related presentations.
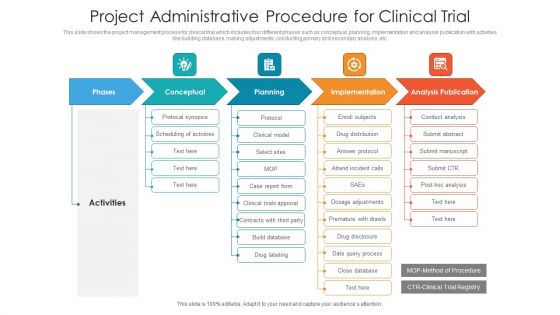
Project Administrative Procedure For Clinical Trial Ppt PowerPoint Presentation File Elements PDF
This slide shows the project management process for clinical trial which includes four different phases such as conceptual, planning, implementation and analysis publication with activities like building database, making adjustments, conducting primary and secondary analysis, etc. Presenting project administrative procedure for clinical trial ppt powerpoint presentation file elements pdf to dispense important information. This template comprises five stages. It also presents valuable insights into the topics including phases, conceptual, planning, implementation, analysis publication. This is a completely customizable PowerPoint theme that can be put to use immediately. So, download it and address the topic impactfully.
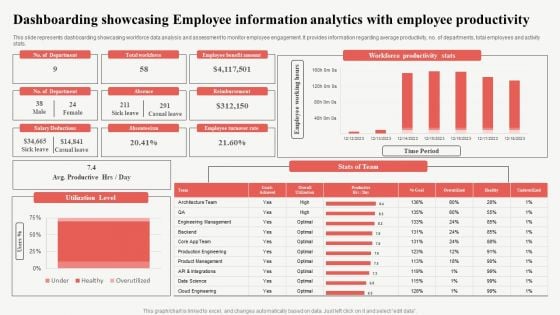
Dashboarding Showcasing Employee Information Analytics With Employee Productivity Slides PDF
This slide represents dashboarding showcasing workforce data analysis and assessment to monitor employee engagement. It provides information regarding average productivity, no. of departments, total employees and activity stats. Pitch your topic with ease and precision using this Dashboarding Showcasing Employee Information Analytics With Employee Productivity Slides PDF. This layout presents information on Reimbursement, Productive, Workforce Productivity Stats. It is also available for immediate download and adjustment. So, changes can be made in the color, design, graphics or any other component to create a unique layout.
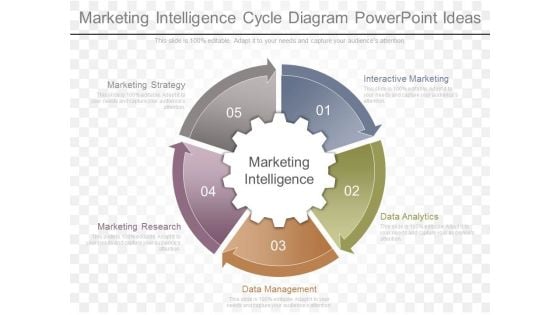
Marketing Intelligence Cycle Diagram Powerpoint Ideas
This is a marketing intelligence cycle diagram powerpoint ideas. This is a five stage process. The stages in this process are marketing strategy, marketing research, interactive marketing, data analytics, data management.
Business Diagram Six Staged Vertical Text Box Diagram Presentation Template
Six staged vertical text box diagram has been used to design this Power Point template slide. This PPT slide contains the concept of business data representation. Use this PPT slide for business data related presentations.
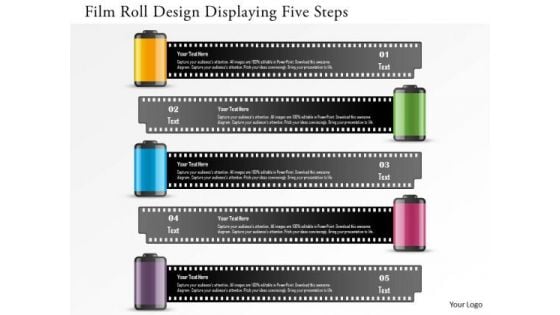
Business Diagram Film Roll Design Displaying Five Steps Presentation Template
Graphic of five staged film roll diagram has been used to craft this power point template diagram. This PPT contains the concept of data representation. Use this PPT for business and marketing data related presentations.
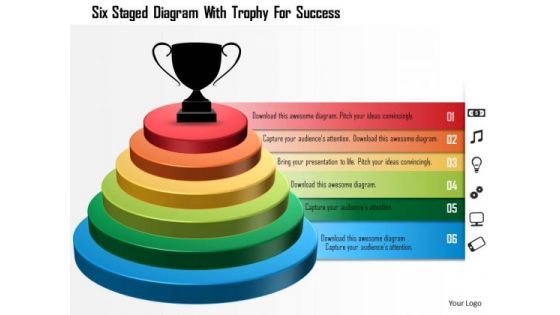
Business Diagram Six Staged Diagram With Trophy For Success Presentation Template
Six staged colorful ribbon text boxes has been used to craft this power point template. This PPT contains the concept of data representation. This PPT is suitable for your data related topics in any business and marketing presentation.
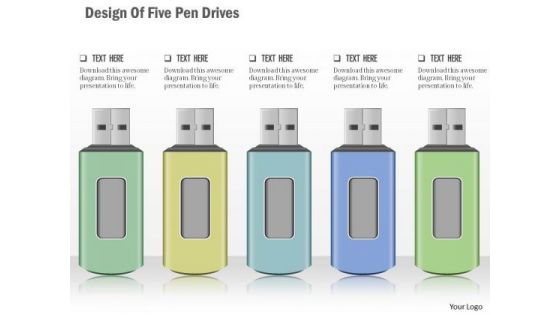
Business Diagram Design Of Five Pen Drives Presentation Template
Graphic of five colored pen drives has been used to craft this power point template. This PPT contains the concept of data storage. Use this PPT for data technology related presentations.
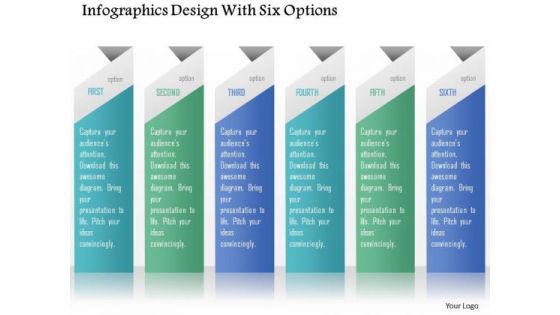
Business Diagram Infographics Design With Six Options Presentation Template
Graphic of six staged info graphics has been used to design this power point template. This PPT diagram contains the concept of data flow and representation. Use this PPT for data technology related presentations.
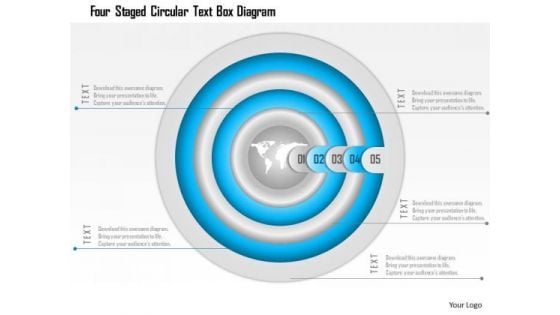
Business Diagram Four Staged Circular Text Box Diagram Presentation Template
This Power point template has been crafted with graphic of four staged circular text boxes. These text boxes can be used for data representation. Use this PPT slide for business data related presentation.
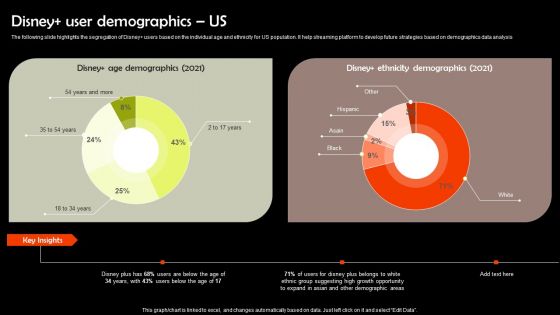
Digital Media Streaming Platform Company Profile Disney User Demographics US Diagrams PDF
The following slide highlights the segregation of Disney users based on the individual age and ethnicity for US population. It help streaming platform to develop future strategies based on demographics data analysis Take your projects to the next level with our ultimate collection of Digital Media Streaming Platform Company Profile Disney User Demographics US Diagrams PDF. Slidegeeks has designed a range of layouts that are perfect for representing task or activity duration, keeping track of all your deadlines at a glance. Tailor these designs to your exact needs and give them a truly corporate look with your own brand colors they will make your projects stand out from the rest.
Business Diagram Three Steps Process Diagram Presentation Template
Graphic of three colored pillars has been used to design this power point template diagram. This PPT contains the concept of text and data representation. Use this PPT diagram for your business data related topics.
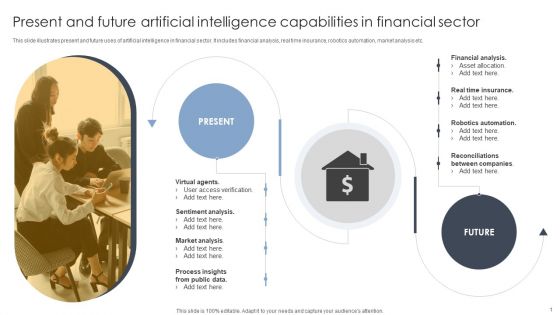
Present And Future Artificial Intelligence Capabilities In Financial Sector Themes PDF
This slide illustrates present and future uses of artificial intelligence in financial sector. It includes financial analysis, real time insurance, robotics automation, market analysis etc. Persuade your audience using this Present And Future Artificial Intelligence Capabilities In Financial Sector Themes PDF. This PPT design covers Three stages, thus making it a great tool to use. It also caters to a variety of topics including Virtual Agents, Sentiment Analysis. Download this PPT design now to present a convincing pitch that not only emphasizes the topic but also showcases your presentation skills.
Hr Business Intelligence Ppt Powerpoint Diagram
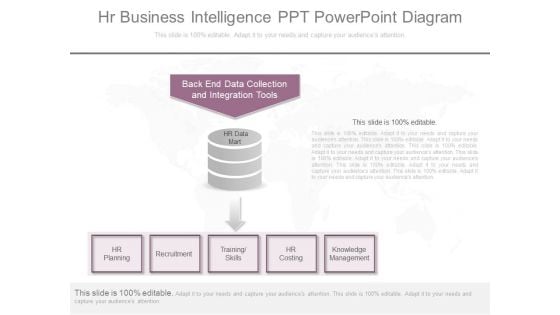
This is a hr business intelligence ppt powerpoint diagram. This is a one stage process. The stages in this process are back end data collection and integration tools, hr data mart, hr planning, recruitment, training skills, hr costing, knowledge management.

Business Diagram Building Diagram With Three Steps Presentation Template
Three staged house graphic has been used to craft this power point template. This PPT diagram contains the concept of data representation. Use this PPT for your data and business related presentations.
Business Diagram Timeline Diagram With Six Options Presentation Template
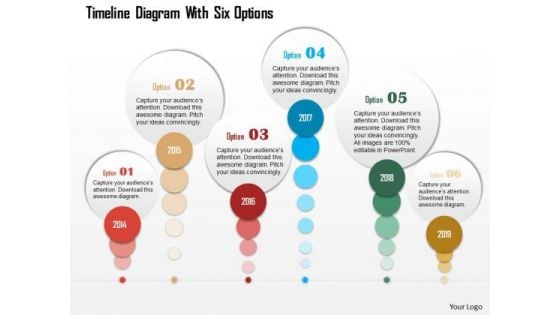
Graphic of designer circles has been used to design this power point template. This PPT contains the concept of data representation. Use this PPT for your business and data related presentation.
Business Diagram Three Interconnected Circles With Text Boxes Presentation Template
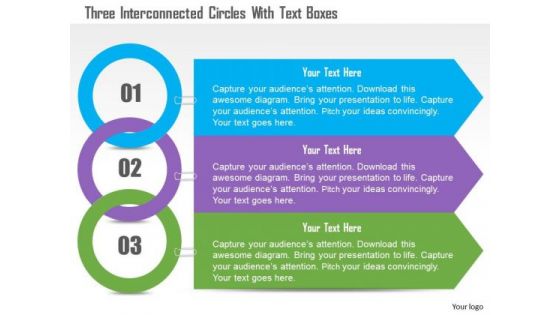
Three interconnected circles and text boxes are used to design this business diagram. This slide contains the concept of data and process flow. Use this amazing slide for your business and data related presentations.
Business Diagram 3d Hexagon Four Text Boxes PowerPoint Template
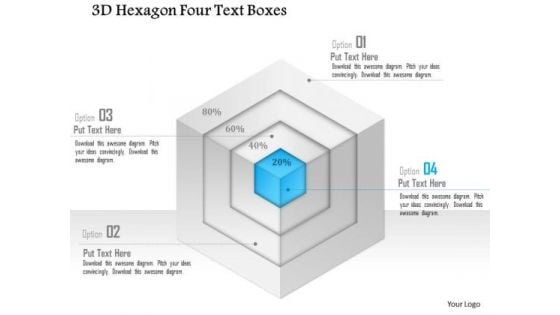
Graphic of 3d hexagon diagram and text boxes are used to craft this power point template slide. This PPT slide contains the concept of data representation. Use this PPT for your business and marketing data flow related presentations.
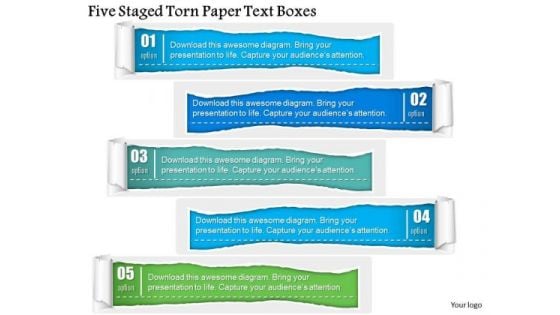
Business Diagram Five Staged Torn Paper Text Boxes PowerPoint Template
Five staged torn paper design text box diagram has been used to craft this power point template slide. This PPT slide contains the concept of data representation. Use this PPT for your business and marketing data related presentations.
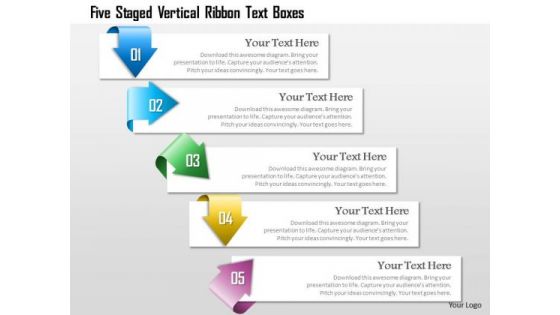
Business Diagram Five Staged Vertical Ribbon Text Boxes Presentation Template
Five staged vertical ribbon text boxes has been used to craft this power point template. This PPT contains the concept of data representation. Use this PPT for your data related topics in any business and marketing presentation.
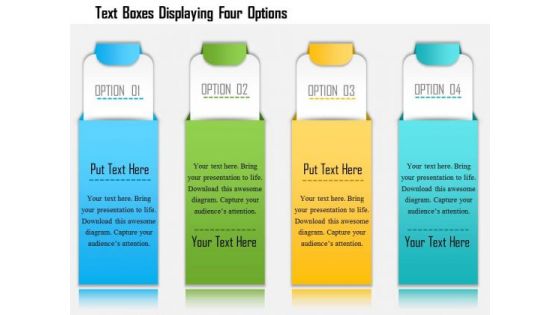
Business Diagram Text Boxes Displaying Four Options Presentation Template
Four staged envelop style text boxes has been used to craft this power point template. This PPT contains the concept of data representation. This PPT can be used for your data related topics in any business and marketing presentation.
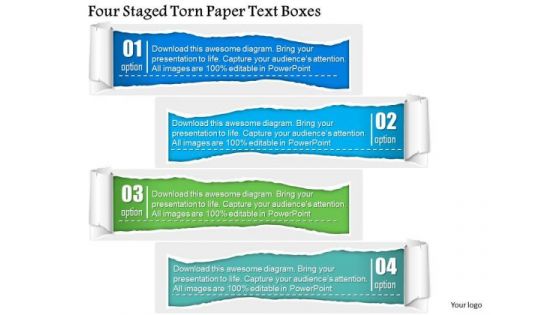
Business Diagram Four Staged Torn Paper Text Boxes PowerPoint Template
Four staged torn paper style text boxes are used to craft this power point template. This PPT contains the concept of data representation for business process. Use this PPT and build an innovative presentation for data based topics.
Business Diagram Three Colorful Balloons With Text PowerPoint Template
Three colorful balloons with text box has been used to craft this power point template slide. This PPt slide contains the concept of business data presentation. Use this PPT slide and build quality presentation on data related presentations.

Business Diagram Secure Connections To The Public Cloud With Folders And Lock Ppt Slide
This technical slide has been designed with graphic of folders and cloud with lock. This PPT slide depicts the concept of secure connections. It focuses on the data safety in cloud technology. Use this diagram for data safety related presentations.
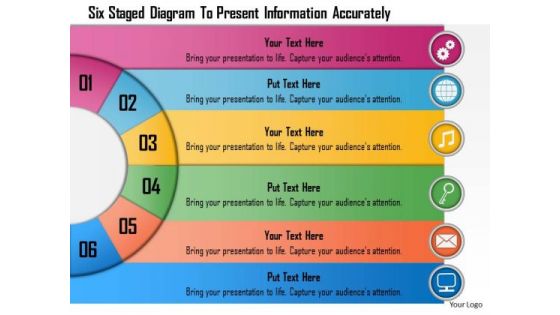
Business Diagram Six Staged Diagram To Present Information Accurately Presentation Template
Six staged semicircular text boxes are used to craft this power point template. This PPT contains the concept of data representation. Use this PPT for your business and sales related data representation in any presentation.
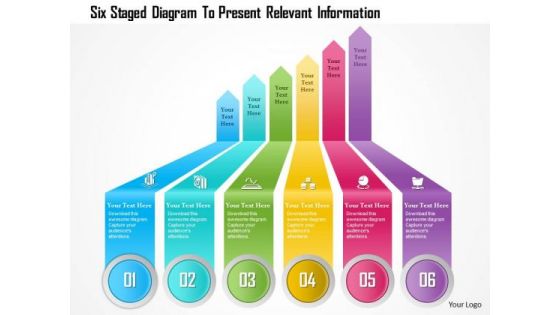
Business Diagram Six Staged Diagram To Present Relevant Information Presentation Template
Six staged colorful ribbon text boxes has been used to craft this power point template. This PPT contains the concept of data representation. This PPT is suitable for your data related topics in any business and marketing presentation.
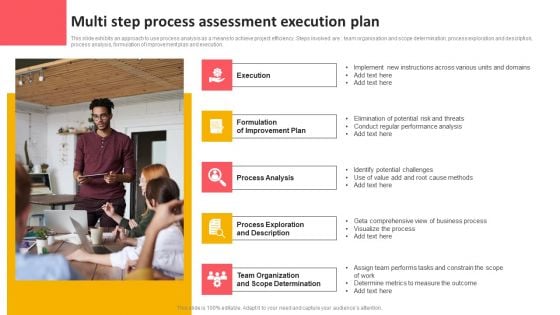
Multi Step Process Assessment Execution Plan Demonstration PDF
This slide exhibits an approach to use process analysis as a means to achieve project efficiency. Steps involved are team organisation and scope determination, process exploration and description, process analysis, formulation of improvement plan and execution. Presenting Multi Step Process Assessment Execution Plan Demonstration PDF to dispense important information. This template comprises five stages. It also presents valuable insights into the topics including Execution, Formulation Improvement Plan, Process Analysis. This is a completely customizable PowerPoint theme that can be put to use immediately. So, download it and address the topic impactfully.

Business Framework Default Placement Style For Strategy Map PowerPoint Presentation
This power point template slide has been crafted with graphic of prism. In this slide prism is contain the ray of light style text boxes for data representation. Use this PPT for data insight process.
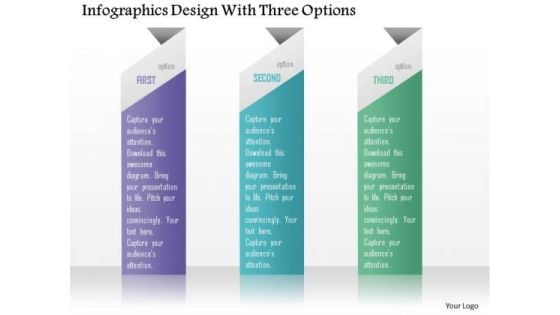
Business Diagram Infographics Design With Three Options Presentation Template
Three staged info graphics has been used to craft this power point template diagram. This PPT diagram contains the concept of data flow and storage. Use this PPT for business and data related presentations.
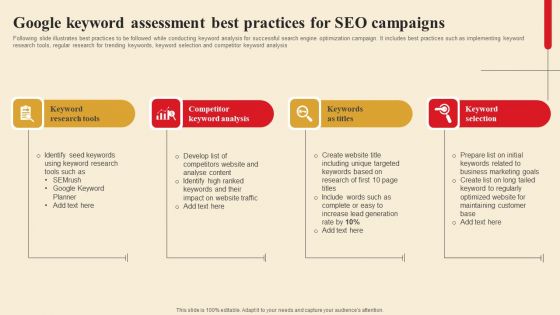
Google Keyword Assessment Best Practices For SEO Campaigns Download PDF
Following slide illustrates best practices to be followed while conducting keyword analysis for successful search engine optimization campaign. It includes best practices such as implementing keyword research tools, regular research for trending keywords, keyword selection and competitor keyword analysis. Presenting Google Keyword Assessment Best Practices For SEO Campaigns Download PDF to dispense important information. This template comprises four stages. It also presents valuable insights into the topics including Keyword Selection, Competitor Keyword Analysis, Keyword Research Tools. This is a completely customizable PowerPoint theme that can be put to use immediately. So, download it and address the topic impactfully.
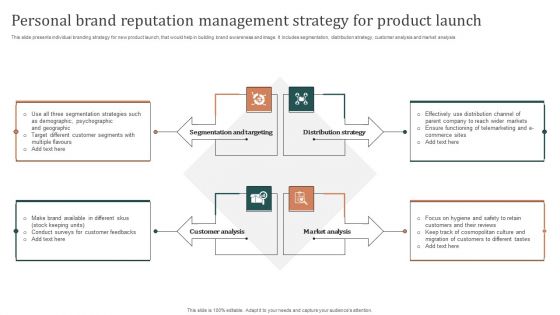
Personal Brand Reputation Management Strategy For Product Launch Pictures PDF
This slide presents individual branding strategy for new product launch, that would help in building brand awareness and image. It includes segmentation, distribution strategy, customer analysis and market analysis Presenting Personal Brand Reputation Management Strategy For Product Launch Pictures PDF to dispense important information. This template comprises four stages. It also presents valuable insights into the topics including Targeting, Customer Analysis, Distribution Strategy. This is a completely customizable PowerPoint theme that can be put to use immediately. So, download it and address the topic impactfully.
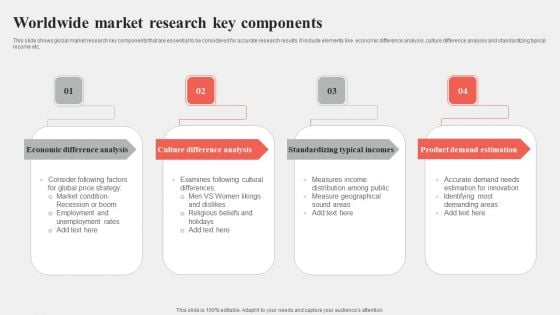
Worldwide Market Research Key Components Sample PDF
This slide shows global market research key components that are essential to be considered for accurate research results. It include elements like economic difference analysis, culture difference analysis and standardizing typical income etc. Presenting Worldwide Market Research Key Components Sample PDF to dispense important information. This template comprises four stages. It also presents valuable insights into the topics including Difference Analysis, Typical Incomes, Estimation. This is a completely customizable PowerPoint theme that can be put to use immediately. So, download it and address the topic impactfully.
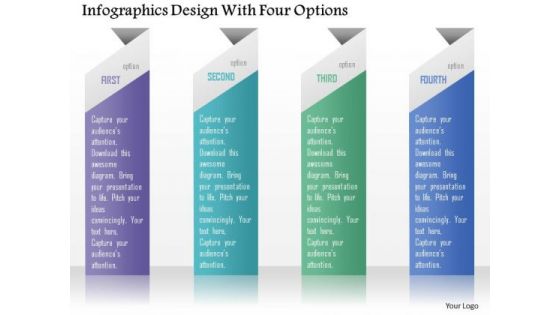
Business Diagram Infographics Design With Four Options Presentation Template
Four staged info graphics has been used to design this power point template. This PPT diagram contains the concept of data flow. Use this PPT for business and marketing data related topics in any presentation.
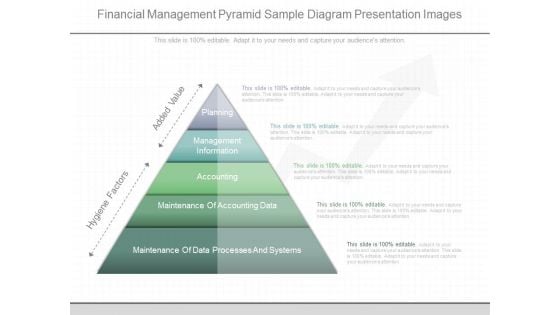
Financial Management Pyramid Sample Diagram Presentation Images
This is a financial management pyramid sample diagram presentation images. This is a five stage process. The stages in this process are planning, management information, accounting, maintenance of accounting data, maintenance of data processes and systems, hygiene factors, added value.
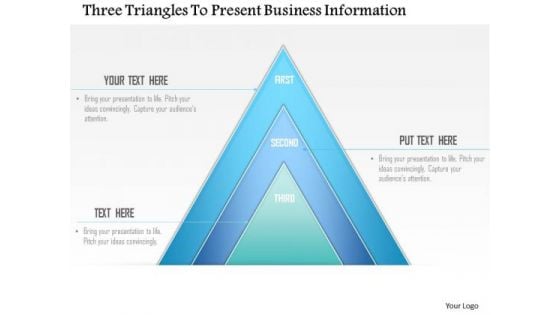
Business Diagram Three Triangles To Present Business Information Presentation Template
Three interconnected triangles are used to design this business diagram. This slide contains the concept of data and process flow. Use this slide for your business and data related presentations.
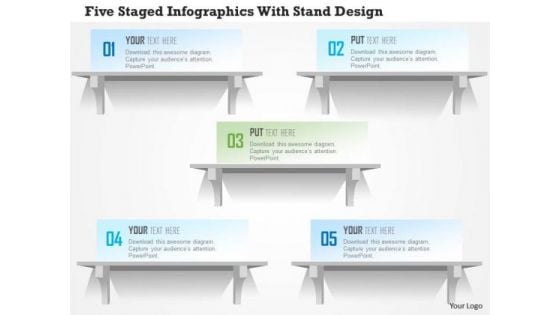
Business Diagram Five Staged Infographics With Stand Design PowerPoint Template
Five staged info graphics with stand has been used to craft this power point template. This PPT contains the concept of data flow. Use this PPT slide for your sales and business data related presentations.
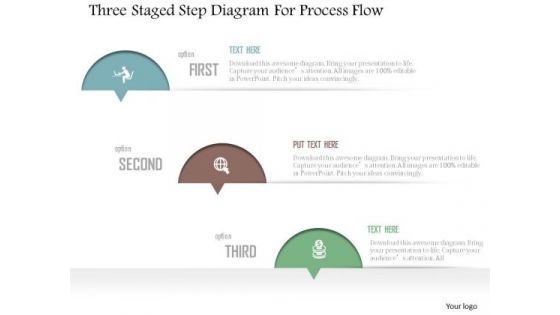
Business Diagram Three Staged Step Diagram For Process Flow Presentation Template
Three staged step diagram has been used to craft this power point template diagram. This PPT contains the concept of data and process flow representation. Use this PPT for business and marketing data related presentations.
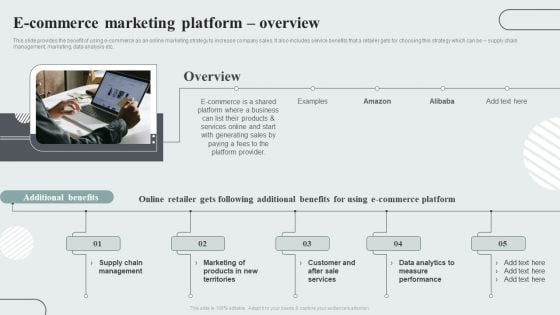
Techniques To Enhance Customer Engagement Via Digital Platforms E Commerce Marketing Platform Overview Diagrams PDF
This slide provides the benefit of using e-commerce as an online marketing strategy to increase company sales. It also includes service benefits that a retailer gets for choosing this strategy which can be supply chain management, marketing, data analysis etc. If your project calls for a presentation, then Slidegeeks is your go-to partner because we have professionally designed, easy-to-edit templates that are perfect for any presentation. After downloading, you can easily edit Techniques To Enhance Customer Engagement Via Digital Platforms E Commerce Marketing Platform Overview Diagrams PDF and make the changes accordingly. You can rearrange slides or fill them with different images. Check out all the handy templates

Business Diagram Pillars Displaying Three Options Presentation Template
Graphic of three colored pillars has been used to design this power point template diagram. This PPT contains the concept of text and data representation. Use this PPT diagram for your business data related topics.
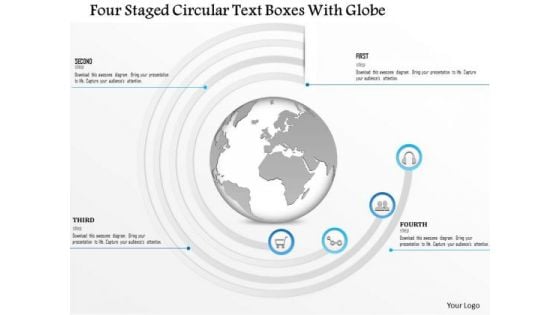
Business Diagram Four Staged Circular Text Boxes With Globe Presentation Template
Four staged circular text boxes with globe graphic are used to craft this power point template. This PPT contains the concept of global business data flow. Use this PPT for your data related topics in business presentation.
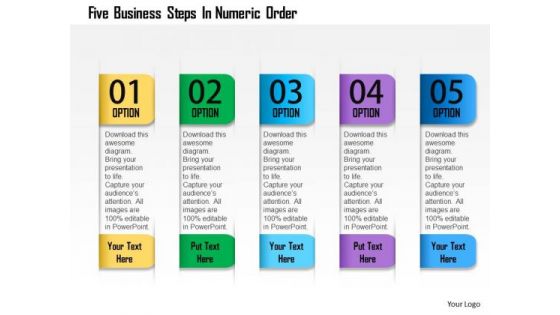
Business Diagram Five Business Steps In Numeric Order Presentation Template
Five colored linear text boxes are used to design this power point template. This PPT contains the concept of data flow updation. Display any data in your business presentation with this unique PPT.
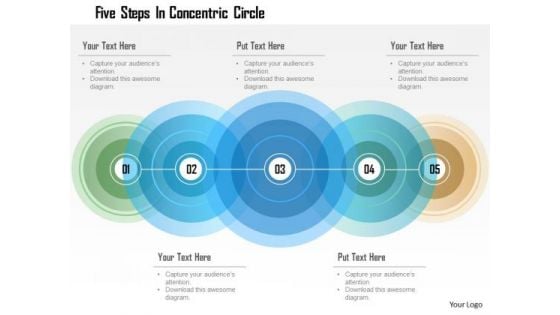
Business Diagram Five Steps In Concentric Circle Presentation Template
Five staged colorful circular text boxes in linear flow has been used to design this power point template. This PPT contains the concept of data representation. Use this PPT for your data related topics in any business or sales presentation.
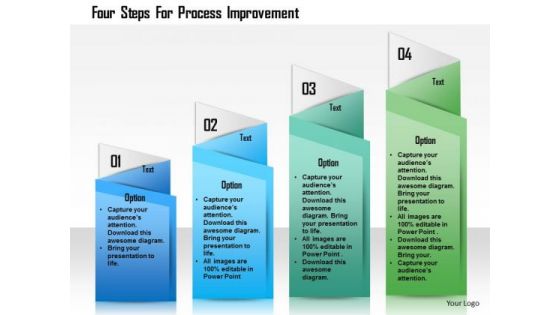
Business Diagram Four Steps For Process Improvement Presentation Template
Graphic of four sequential text boxes are used to design this power point template. This PPT contains the concept of data flow in any process. Use this PPT for your data and process flow related topics in any presentation.
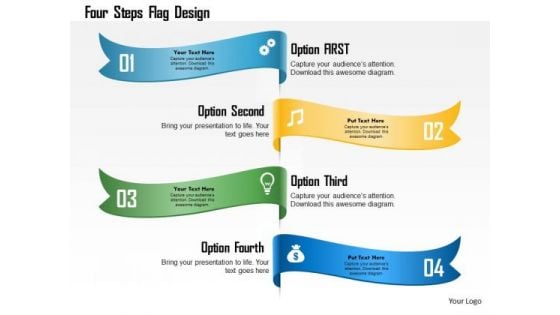
Business Diagram Four Steps Flag Design Presentation Template
Graphic of four vertical colorful flags are used to design this power point template. This PPT contains the concept of data representation. Use this PPT for your data related topics in any presentation.
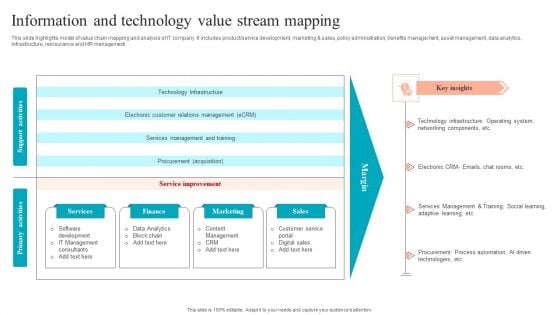
Information And Technology Value Stream Mapping Introduction PDF
This slide highlights model of value chain mapping and analysis of IT company. It includes product service development, marketing and sales, policy administration, benefits management, asset management, data analytics, infrastructure, reinsurance and HR management. Presenting Information And Technology Value Stream Mapping Introduction PDF to dispense important information. This template comprises four stages. It also presents valuable insights into the topics including Support Activities, Primary Activities, Service Improvement. This is a completely customizable PowerPoint theme that can be put to use immediately. So, download it and address the topic impactfully.
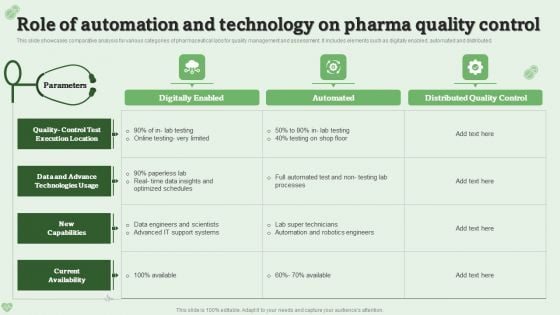
Role Of Automation And Technology On Pharma Quality Control Ppt PowerPoint Presentation Gallery Backgrounds PDF
This slide showcases comparative analysis for various categories of pharmaceutical labs for quality management and assessment. It includes elements such as digitally enabled, automated and distributed. Showcasing this set of slides titled Role Of Automation And Technology On Pharma Quality Control Ppt PowerPoint Presentation Gallery Backgrounds PDF. The topics addressed in these templates are Data Engineers, Current Availability, Quality Control. All the content presented in this PPT design is completely editable. Download it and make adjustments in color, background, font etc. as per your unique business setting.

 Home
Home