Data Analysis Icon
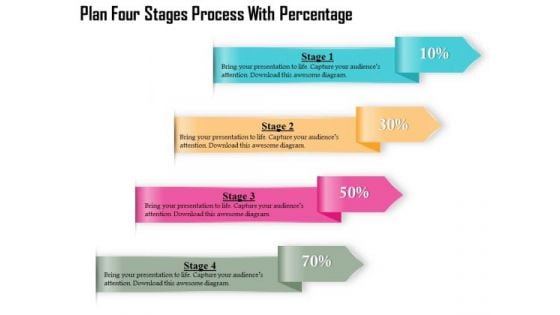
Business Diagram Four Stages Process With Percentage Presentation Template
Four multicolored tags in vertical order has been used to decorate this business diagram. This diagram contains the concept of financial data display with percent values. This diagram can be used for management and finance related presentations.

Business Diagram Three Stages Process Percentage Presentation Template
Three multicolored tags in vertical order has been used to decorate this business diagram. This diagram contains the concept of financial data display with percent values. This diagram can be used for management and finance related presentations.
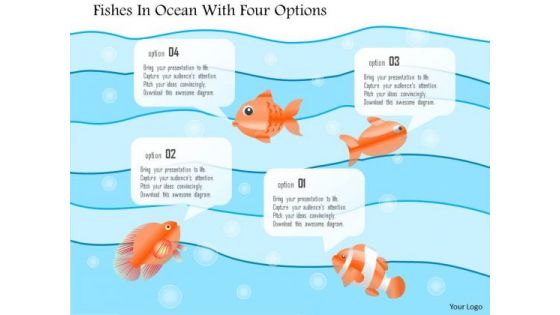
Business Diagram Fishes In Ocean With Four Options Presentation Template
This power point diagram template has been designed with graphic of ocean and fish. This PPT diagram contains the concept of idea generation and data representation. Use this PPT diagram for business and marketing related presentations.
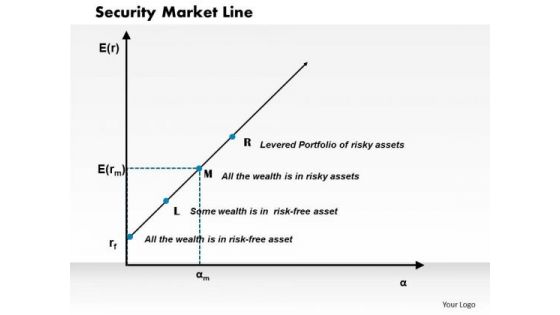
Business Framework Security Market Line PowerPoint Presentation
This diagram displays graph of security market line. You can use line graph to plot changes in data over time, such as monthly revenue and earnings changes or daily changes in stock market prices.
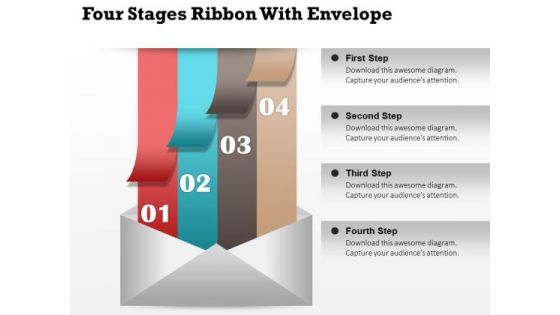
Business Diagram Four Stages Ribbon With Envelope Presentation Template
Concept of data storage and communication has been displayed in this business diagram with graphic of four colored ribbons and envelop. Use this diagram template for business communication related presentations.
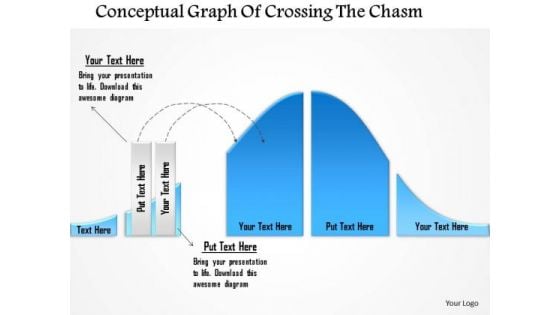
Business Diagram Conceptual Graph Of Crossing The Chasm Presentation Template
This business diagram has been designed with graphic of 3d graph. This slide contains the concept of chasm and data calculation. Use this slide to display chasm crossing condition. This business diagram adds value to your ideas.
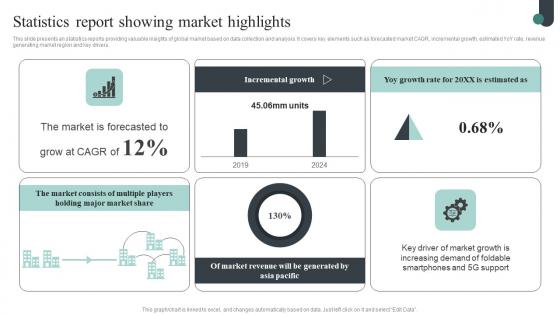
Competitive Intelligence Guide To Determine Market Statistics Report Showing Introduction Pdf
This slide presents an statistics reports providing valuable insights of global market based on data collection and analysis. It covers key elements such as forecasted market CAGR, incremental growth, estimated YoY rate, revenue generating market region and key drivers. The Competitive Intelligence Guide To Determine Market Statistics Report Showing Introduction Pdf is a compilation of the most recent design trends as a series of slides. It is suitable for any subject or industry presentation, containing attractive visuals and photo spots for businesses to clearly express their messages. This template contains a variety of slides for the user to input data, such as structures to contrast two elements, bullet points, and slides for written information. Slidegeeks is prepared to create an impression. This slide presents an statistics reports providing valuable insights of global market based on data collection and analysis. It covers key elements such as forecasted market CAGR, incremental growth, estimated YoY rate, revenue generating market region and key drivers.
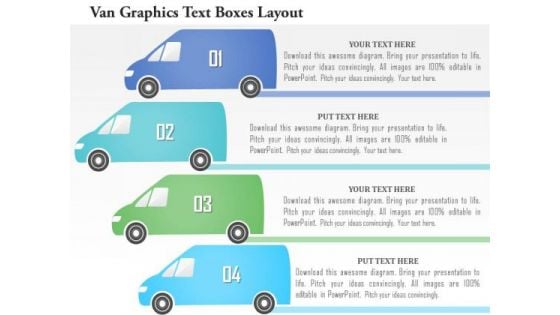
Business Diagram Van Graphics Text Boxes Layout Presentation Template
This business diagram has been designed with graphic of van style four text boxes. These text boxes are used to display data for any process. Download this diagram to build an exclusive presentation for your views.
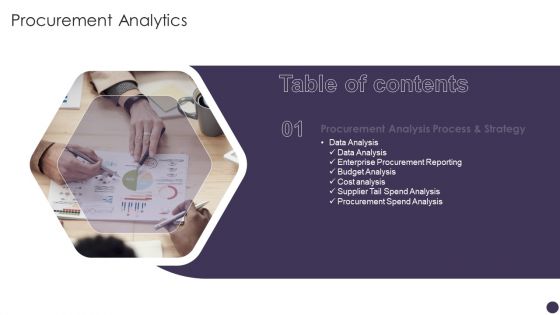
Table Of Contents Procurement Analytics Slide Diagrams PDF
Presenting Table Of Contents Procurement Analytics Slide Diagrams PDF to provide visual cues and insights. Share and navigate important information on one stage that need your due attention. This template can be used to pitch topics like Data Analysis, Enterprise Procurement, Budget Analysis. In addtion, this PPT design contains high resolution images, graphics, etc, that are easily editable and available for immediate download.

Road In Yorkshire Dales Vacation PowerPoint Themes And PowerPoint Slides 0411
Microsoft PowerPoint Theme and Slide with road in yorkshire dales Put up the facts and figures on our Road In Yorkshire Dales Vacation PowerPoint Themes And PowerPoint Slides 0411. Display the data for everyone's consumption.

Road Sign On Desert Success PowerPoint Themes And PowerPoint Slides 0811
Microsoft PowerPoint Theme and Slide with road sign success on desert Put up the facts and figures on our Road Sign On Desert Success PowerPoint Themes And PowerPoint Slides 0811. Display the data for everyone's consumption.
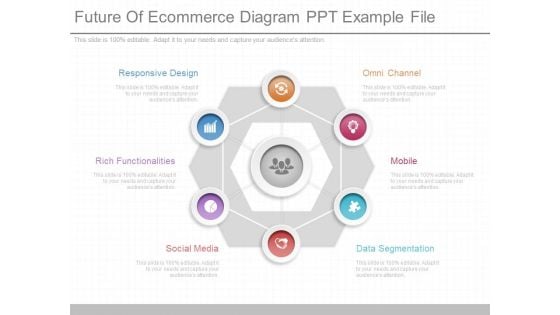
Future Of Ecommerce Diagram Ppt Example File
This is a future of ecommerce diagram ppt example file. This is a six stage process. The stages in this process are responsive design, rich functionalities, social media, omni channel, mobile, data segmentation.
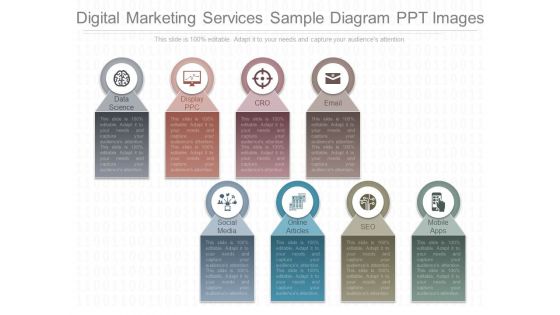
Digital Marketing Services Sample Diagram Ppt Images
This is a digital marketing services sample diagram ppt images. This is a eight stage process. The stages in this process are data science, display ppc, cro, email, social media, online articles, seo, mobile apps.
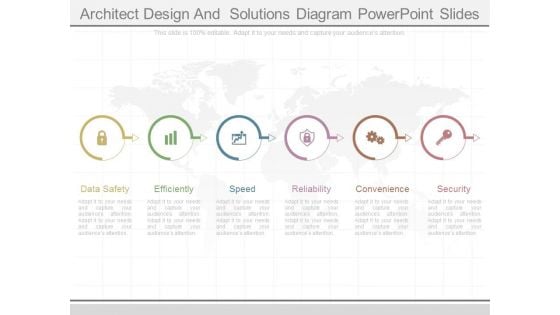
Architect Design And Solutions Diagram Powerpoint Slides
This is a architect design and solutions diagram powerpoint slides. This is a six stage process. The stages in this process are data safety, efficiently, speed, reliability, convenience, security.
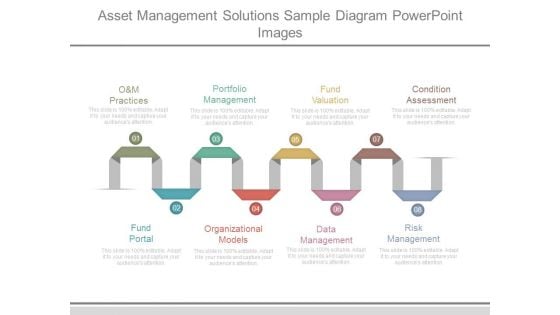
Asset Management Solutions Sample Diagram Powerpoint Images
This is a asset management solutions sample diagram powerpoint images. This is a eight stage process. The stages in this process are o and m practices, portfolio management, fund valuation, condition assessment, fund portal, organizational models, data management, risk management.
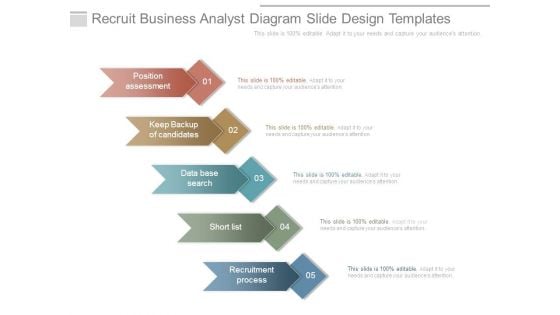
Recruit Business Analyst Diagram Slide Design Templates
This is a recruit business analyst diagram slide design templates. This is a five stage process. The stages in this process are position assessment, keep backup of candidates, data base search, short list, recruitment process.
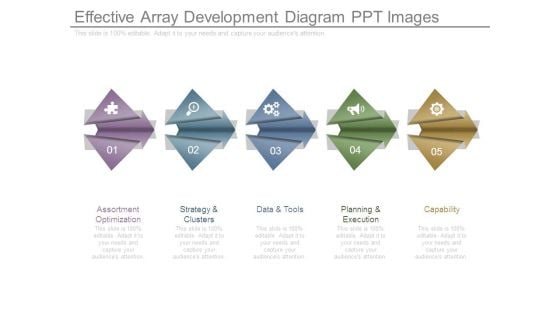
Effective Array Development Diagram Ppt Images
This is a effective array development diagram ppt images. This is a five stage process. The stages in this process are assortment optimization, strategy and clusters, data and tools, planning and execution, capability.
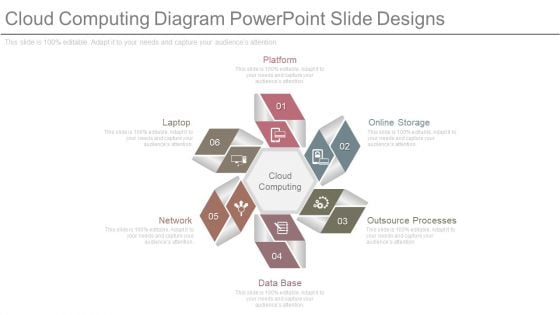
Cloud Computing Diagram Powerpoint Slide Designs
This is a cloud computing diagram powerpoint slide designs. This is a six stage process. The stages in this process are platform, online storage, outsource processes, data base, network, laptop.
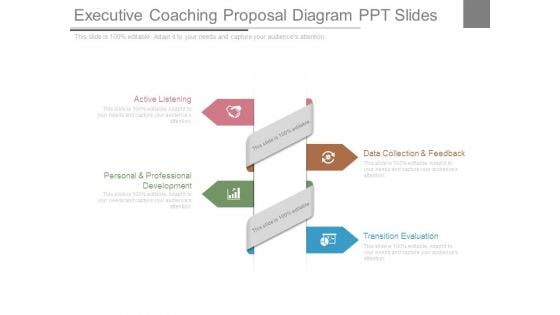
Executive Coaching Proposal Diagram Ppt Slides
This is a executive coaching proposal diagram ppt slides. This is a four stage process. The stages in this process are active listening, personal and professional development, data collection and feedback, transition evaluation.
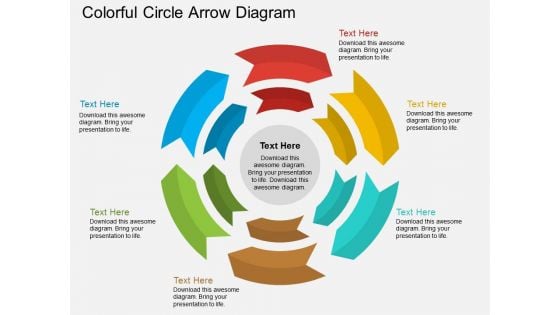
Colorful Circle Arrow Diagram Powerpoint Template
Our above PPT slide contains circular arrow design. This business diagram helps to exhibit process flow. Use this diagram to impart more clarity to data and to create more sound impact on viewers.
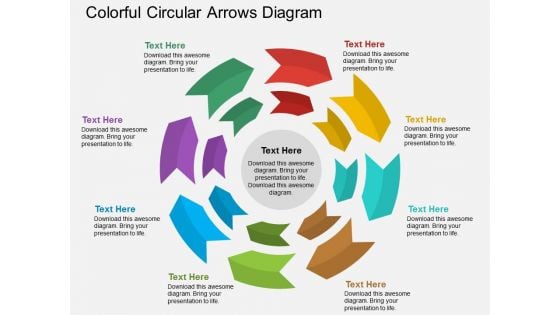
Colorful Circular Arrows Diagram Powerpoint Template
Our above PPT slide contains circular arrow design. This business diagram helps to exhibit process flow. Use this diagram to impart more clarity to data and to create more sound impact on viewers.
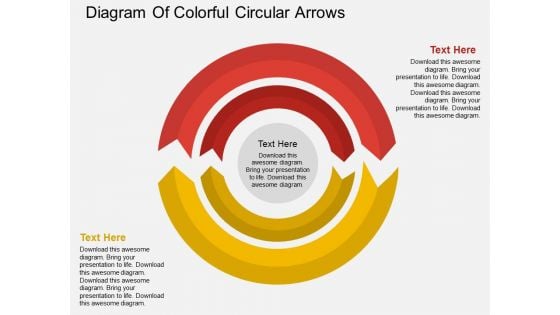
Diagram Of Colorful Circular Arrows Powerpoint Template
Our above PPT slide contains circular arrow design. This business diagram helps to exhibit process flow. Use this diagram to impart more clarity to data and to create more sound impact on viewers.
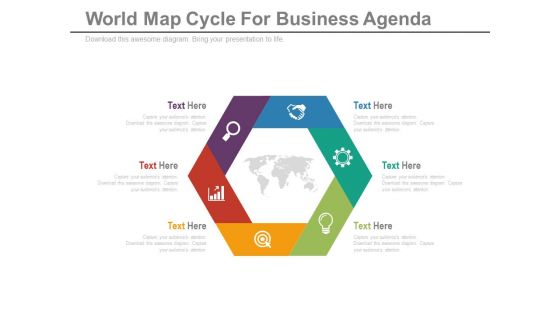
Diagram For Global Business Strategy Powerpoint Template
Our above slide contains hexagonal infographic diagram. This PowerPoint template helps to display global business strategy. Use this diagram to impart more clarity to data and to create more sound impact on viewers.
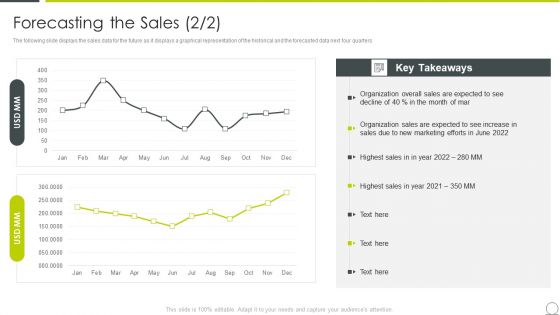
Examining Product Characteristics Brand Messaging Forecasting The Sales Marketing Ideas PDF
The following slide displays the sales data for the future as it displays a graphical representation of the historical and the forecasted data next four quarters Deliver and pitch your topic in the best possible manner with this examining product characteristics brand messaging forecasting the sales marketing ideas pdf. Use them to share invaluable insights on forecasting the sales and impress your audience. This template can be altered and modified as per your expectations. So, grab it now.
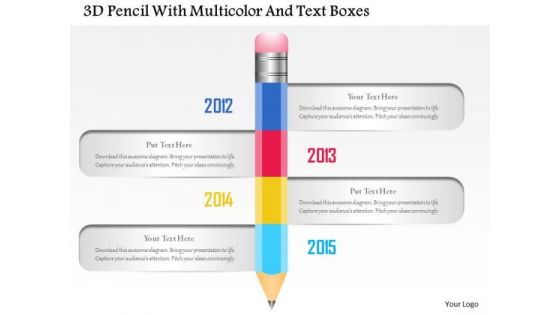
Busines Diagram 3d Pencil With Multicolor And Text Boxes Presentation Template
This business diagram displays four text boxes around a pencil. This professional slide can be used for data display in visual manner. Download this diagram for your school and education related presentations.
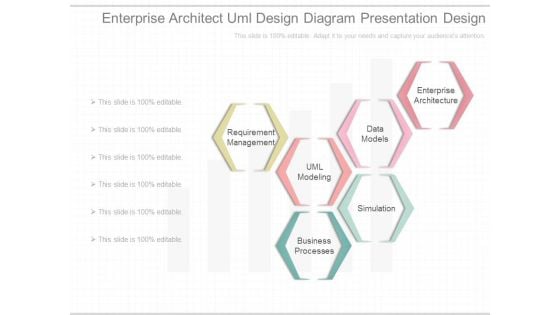
Enterprise Architect Uml Design Diagram Presentation Design
This is a enterprise architect uml design diagram presentation design. This is a six stage process. The stages in this process are requirement management, uml modeling, data models, business processes, simulation, enterprise architecture.
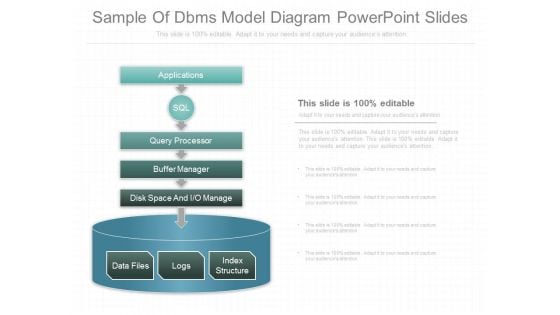
Sample Of Dbms Model Diagram Powerpoint Slides
This is a sample of dbms model diagram powerpoint slides. This is a one stage process. The stages in this process are applications, sql, query processor, buffer manager, disk space and io manage, data files, logs, index structure.
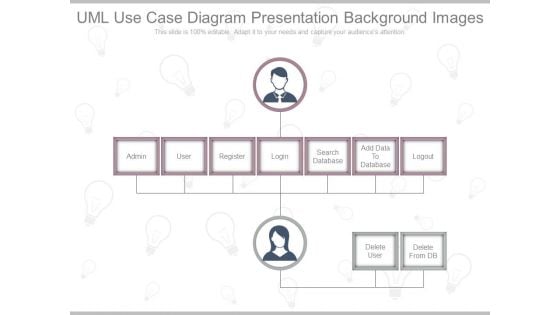
Uml Use Case Diagram Presentation Background Images
This is a uml use case diagram presentation background images. This is a seven stage process. The stages in this process are admin, user, register, login, search database, add data to database, logout.
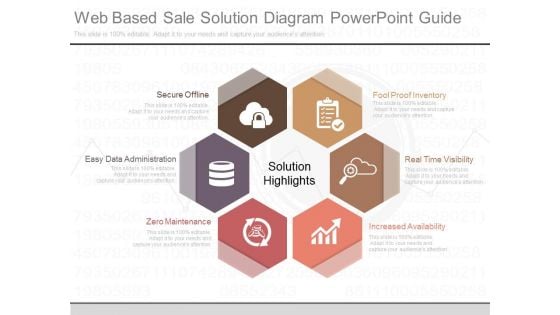
Web Based Sale Solution Diagram Powerpoint Guide
This is a web based sale solution diagram powerpoint guide. This is a six stage process. The stages in this process are fool proof inventory, real time visibility, increased availability, zero maintenance, easy data administration, secure offline.
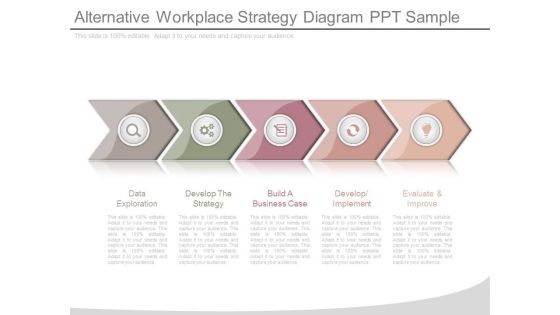
Alternative Workplace Strategy Diagram Ppt Sample
This is a alternative workplace strategy diagram ppt sample. This is a five stage process. The stages in this process are data exploration, develop the strategy, build a business case, develop implement, evaluate and improve.
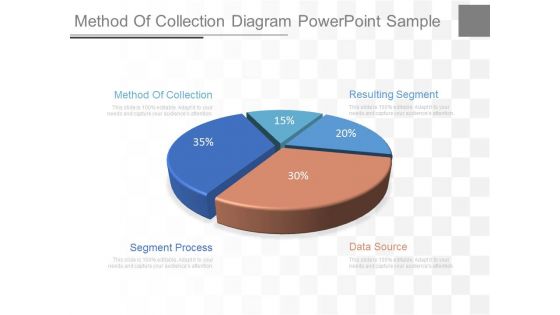
Method Of Collection Diagram Powerpoint Sample
This is a method of collection diagram powerpoint sample. This is a five stage process. The stages in this process are method of collection, segment process, data source, resulting segment.
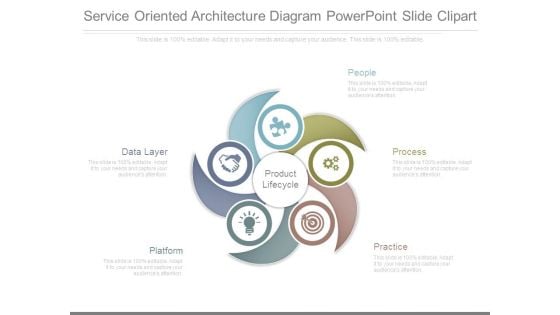
Service Oriented Architecture Diagram Powerpoint Slide Clipart
This is a service oriented architecture diagram powerpoint slide clipart. This is a five stage process. The stages in this process are product lifecycle, data layer, platform, people, process, practice.
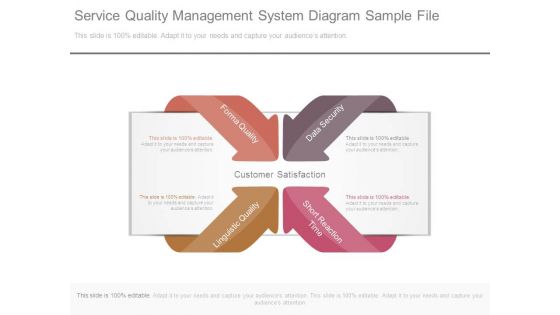
Service Quality Management System Diagram Sample File
This is a service quality management system diagram sample file. This is a four stage process. The stages in this process are forma quality, linguistic quality, data security, short reaction time.
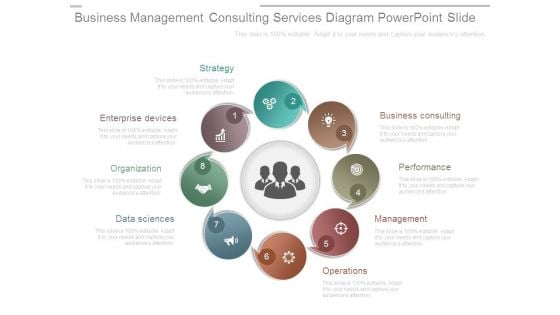
Business Management Consulting Services Diagram Powerpoint Slide
This is a business management consulting services diagram powerpoint slide. This is a eight stage process. The stages in this process are strategy, business consulting, performance, management, operations, data sciences, organization, enterprise devices.
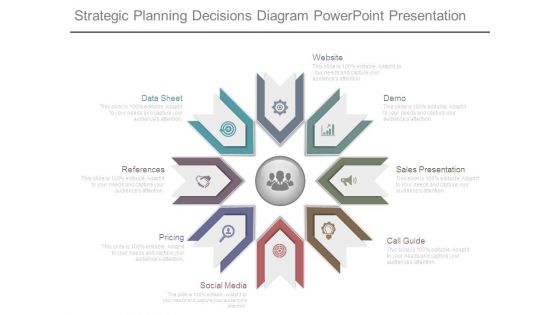
Strategic Planning Decisions Diagram Powerpoint Presentation
This is a strategic planning decisions diagram powerpoint presentation. This is a eight stage process. The stages in this process are data sheet, references, pricing, social media, call guide, sales presentation, demo, website.
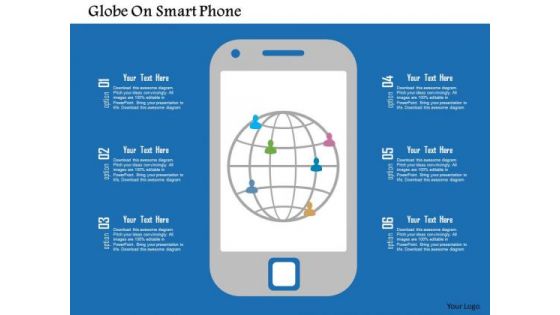
Business Diagram Globe On Smart Phone Presentation Template
Our above slide contains graphics of globe on smart phone. It helps to display GPS service on mobile phones Use this diagram to impart more clarity to data and to create more sound impact on viewers.
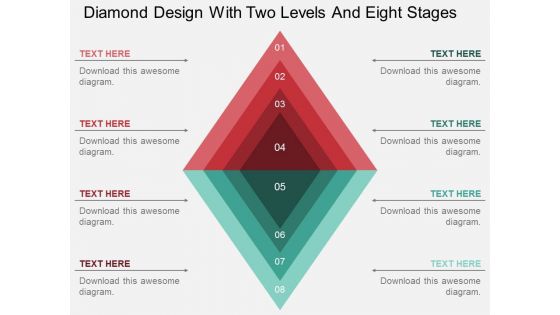
Diamond Design With Two Levels And Eight Stages Powerpoint Template
Our above slide contains graphics of diamond design with two levels and eight stages. It helps to display concepts in visual manner. Use this diagram to impart more clarity to data and to create more sound impact on viewers.

Business Charts Success PowerPoint Templates And PowerPoint Backgrounds 0711
Microsoft PowerPoint Template and Background with a spreadsheet data and business charts Encourage creativity with our Business Charts Success PowerPoint Templates And PowerPoint Backgrounds 0711. You will come out on top.
Graph Charts Business PowerPoint Templates And PowerPoint Backgrounds 0711
Microsoft PowerPoint Template and Background with spreadsheet data and business charts Benefit from diverse contributions with our Graph Charts Business PowerPoint Templates And PowerPoint Backgrounds 0711. They contain the best from all around.
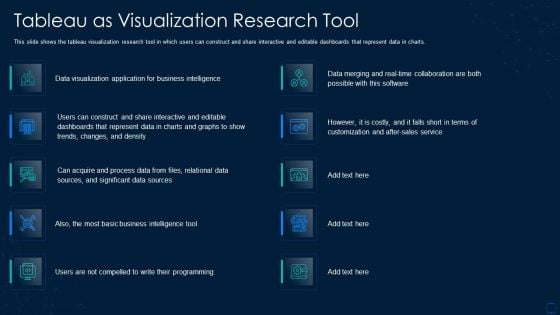
Graphical Representation Of Research IT Tableau As Visualization Research Tool Graphics PDF
This slide shows the tableau visualization research tool in which users can construct and share interactive and editable dashboards that represent data in charts. Deliver and pitch your topic in the best possible manner with this graphical representation of research it tableau as visualization research tool graphics pdf. Use them to share invaluable insights on process data, sources, sales, application and impress your audience. This template can be altered and modified as per your expectations. So, grab it now.
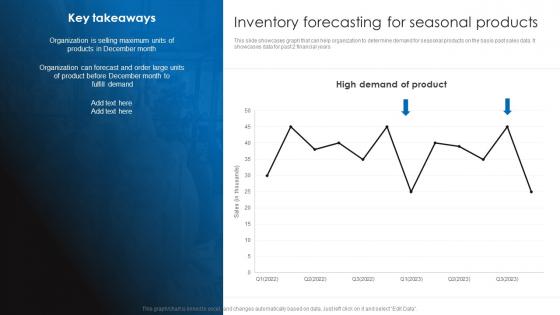
Inventory Forecasting For Seasonal Products Retail Stock Administration Strategies Template Pdf
This slide showcases graph that can help organization to determine demand for seasonal products on the basis past sales data. It showcases data for past 2 financial years.Slidegeeks has constructed Inventory Forecasting For Seasonal Products Retail Stock Administration Strategies Template Pdf after conducting extensive research and examination. These presentation templates are constantly being generated and modified based on user preferences and critiques from editors. Here, you will find the most attractive templates for a range of purposes while taking into account ratings and remarks from users regarding the content. This is an excellent jumping-off point to explore our content and will give new users an insight into our top-notch PowerPoint Templates. This slide showcases graph that can help organization to determine demand for seasonal products on the basis past sales data. It showcases data for past 2 financial years.
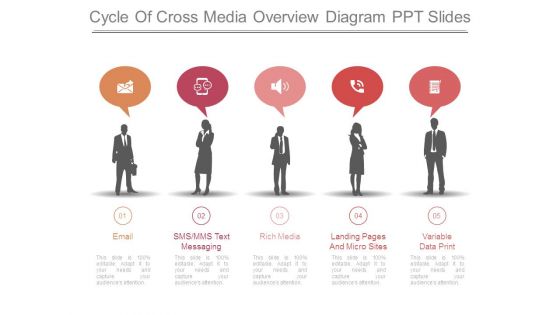
Cycle Of Cross Media Overview Diagram Ppt Slides
This is a cycle of cross media overview diagram ppt slides. This is a five stage process. The stages in this process are email, sms, mms text messaging, rich media, landing pages and micro sites, variable data print.
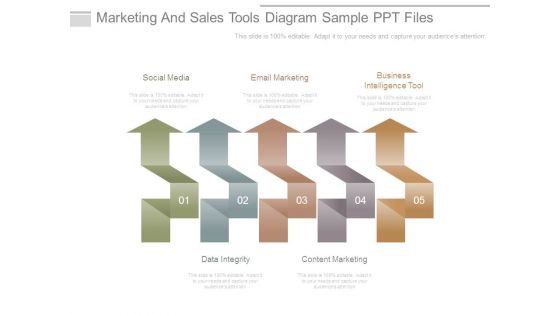
Marketing And Sales Tools Diagram Sample Ppt Files
This is a marketing and sales tools diagram sample ppt files. This is a five stage process. The stages in this process are social media, email marketing, business intelligence tool, data integrity, content marketing.
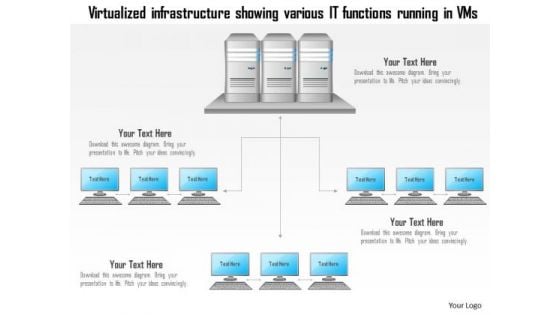
Business Diagram Virtualized Infrastructure Showing Various It Functions Running In Vms Ppt Slide
Graphic of data base server and VMS has been used to design this technology diagram. This slide contains the virtualized infrastructure for various functions. Use this diagram for technology related presentations.
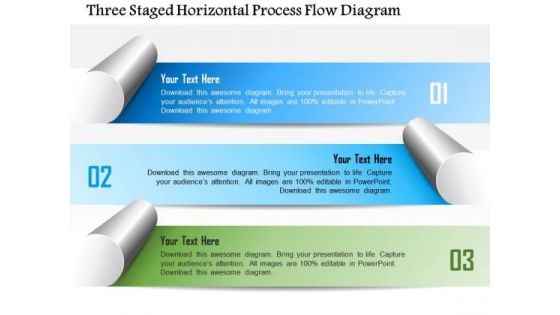
Business Diagram Three Staged Horizontal Process Flow Diagram Presentation Template
This business slide displays three staged horizontal process flow diagram. This diagram is useful for data display. Use this colorful diagram to depict three steps of any business process. It helps in clearly conveying your message to clients and audience.
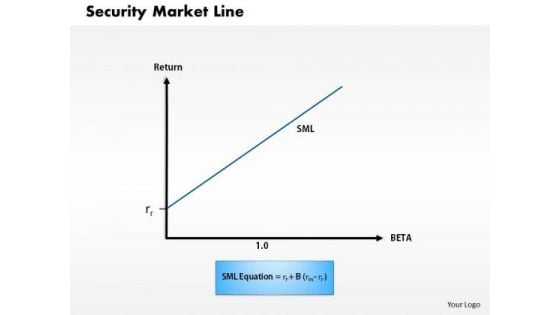
Business Framework Security Market Line 1 PowerPoint Presentation
This diagram displays graph of security market line. You can use line graph to plot changes in data over time, such as monthly revenue and earnings changes or daily changes in stock market prices.
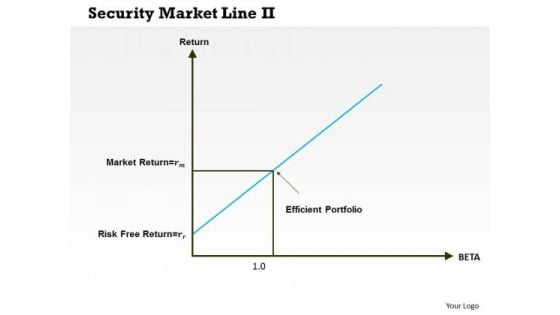
Business Framework Security Market Line 11 PowerPoint Presentation
This diagram displays graph of security market line. You can use line graph to plot changes in data over time, such as monthly revenue and earnings changes or daily changes in stock market prices.
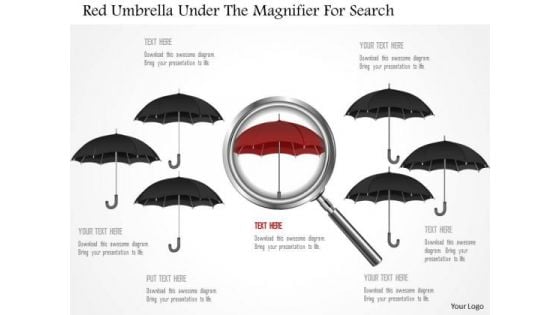
Business Diagram Red Umbrella Under The Magnifier For Search Presentation Template
Graphic of red umbrella and magnifier has been used to craft this PPT diagram. This PPT contains the concept of search. Use this PPT for data and business related presentations.
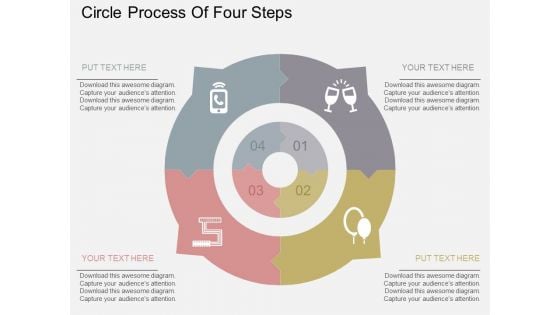
Circle Process Of Four Steps Powerpoint Templates
Our above slide contains graphics of bulb with success graph. It helps to exhibit planning for growth. Use this diagram to impart more clarity to data and to create more sound impact on viewers.
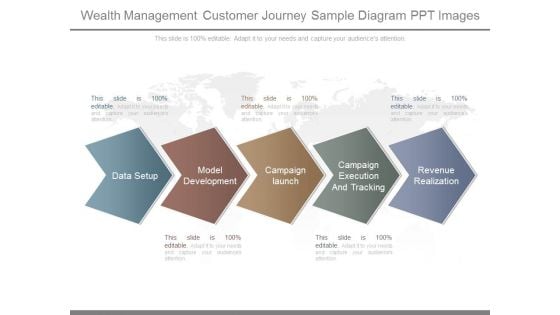
Wealth Management Customer Journey Sample Diagram Ppt Images
This is a wealth management customer journey sample diagram ppt images. This is a five stage process. The stages in this process are data setup, model development, campaign launch, campaign execution and tracking, revenue realization.
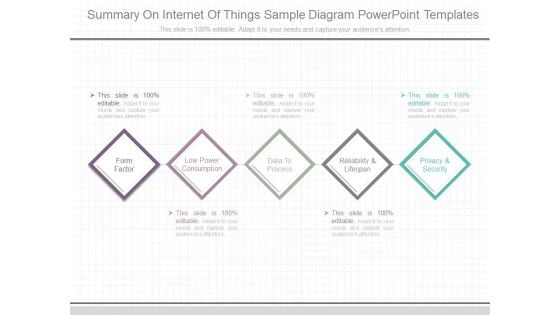
Summary On Internet Of Things Sample Diagram Powerpoint Templates
This is a summary on internet of things sample diagram powerpoint templates. This is a five stage process. The stages in this process are form factor, low power consumption, data to process, reliability and lifespan, privacy and security.
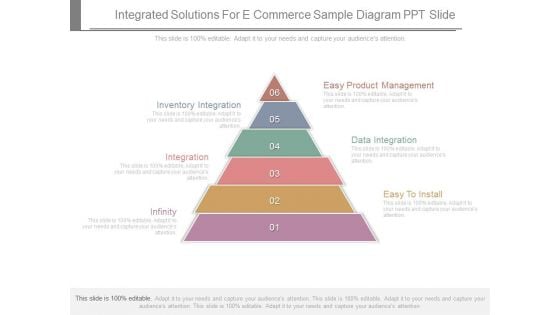
Integrated Solutions For E Commerce Sample Diagram Ppt Slide
This is a integrated solutions for e commerce sample diagram ppt slide. This is a six stage process. The stages in this process are inventory integration, integration, infinity, easy to install, data integration, easy product management.
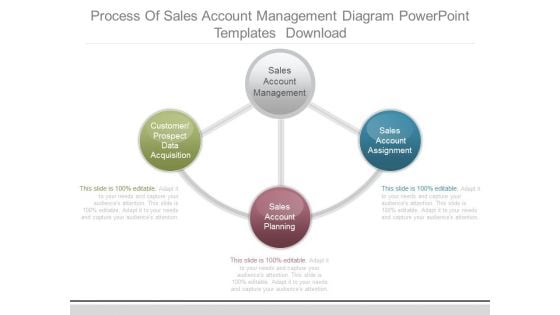
Process Of Sales Account Management Diagram Powerpoint Templates Download
This is a process of sales account management diagram powerpoint templates download. This is a three stage process. The stages in this process are sales account management, customer prospect data acquisition, sales account assignment, sales account planning.
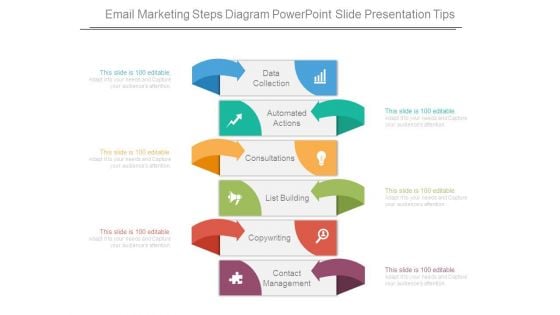
Email Marketing Steps Diagram Powerpoint Slide Presentation Tips
This is a email marketing steps diagram powerpoint slide presentation tips. This is a six stage process. The stages in this process are data collection, automated actions, consultations, list building, copywriting, contact management.
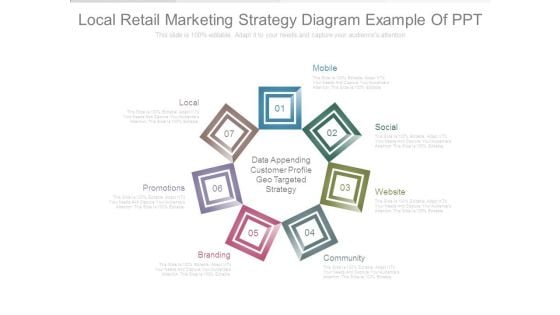
Local Retail Marketing Strategy Diagram Example Of Ppt
This is a local retail marketing strategy diagram example of ppt. This is a seven stage process. The stages in this process are local, promotions, branding, mobile, social, website, community, data appending customer profile geo targeted strategy.
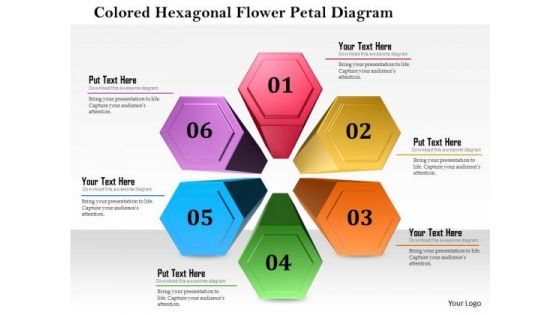
Business Diagram Colored Hexagon Flower Petal Diagram Presentation Template
This business diagram displays colored hexagon flower petal design. This Power Point slide can be used for data representation. Use this PPT slide to show flow of activities in circular manner. Get professional with this exclusive business slide.
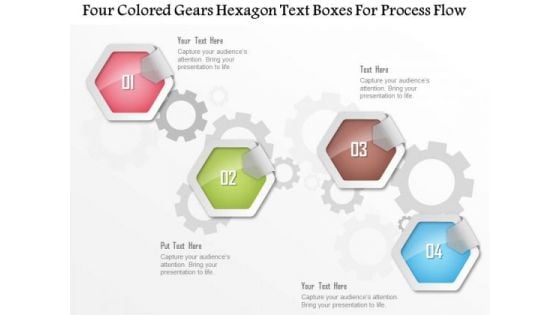
Business Diagram Four Colored Gears Hexagon Text Boxes For Process Flow Presentation Template
Four colored gears hexagon text boxes are used to design this power point template. This diagram contains hexagons for data representation. Use this diagram to display business process workflows in any presentation.
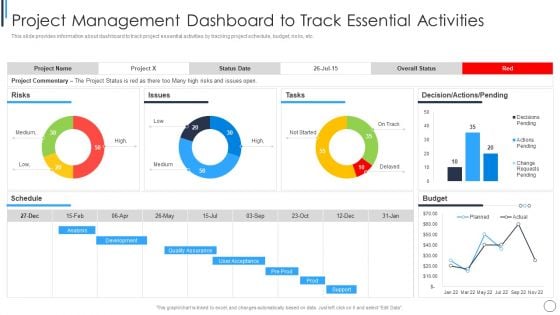
Playbook For Successful Project Management Project Management Dashboard Information PDF
This slide provides information about dashboard to track project essential activities by tracking project schedule, budget, risks, etc.Deliver an awe inspiring pitch with this creative Playbook For Successful Project Management Project Management Dashboard Information PDF bundle. Topics like Quality Assurance, Development, Analysis can be discussed with this completely editable template. It is available for immediate download depending on the needs and requirements of the user.
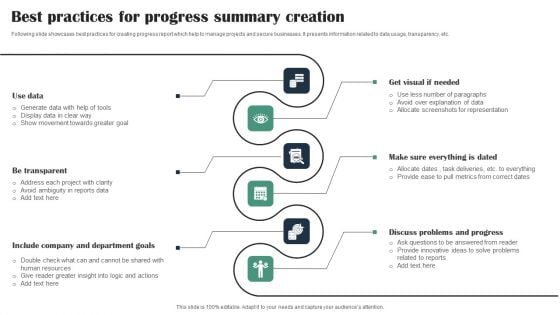
Best Practices For Progress Summary Creation Ideas PDF
Following slide showcases best practices for creating progress report which help to manage projects and secure businesses. It presents information related to data usage, transparency, etc. Presenting Best Practices For Progress Summary Creation Ideas PDF to dispense important information. This template comprises six stages. It also presents valuable insights into the topics including Use Data, Be Transparent, Include Company Department Goals. This is a completely customizable PowerPoint theme that can be put to use immediately. So, download it and address the topic impactfully.
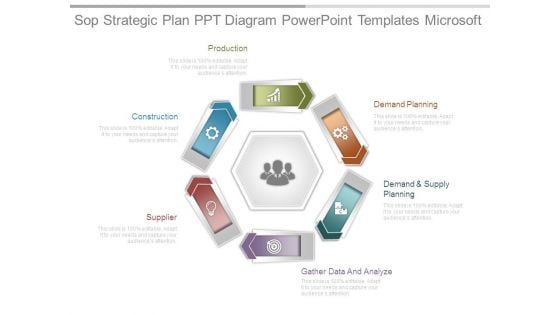
Sop Strategic Plan Ppt Diagram Powerpoint Templates Microsoft
This is a sop strategic plan ppt diagram powerpoint templates microsoft. This is a six stage process. The stages in this process are production, construction, supplier, gather data and analyze, demand and supply, demand planning.

 Home
Home