Data Analysis Icon
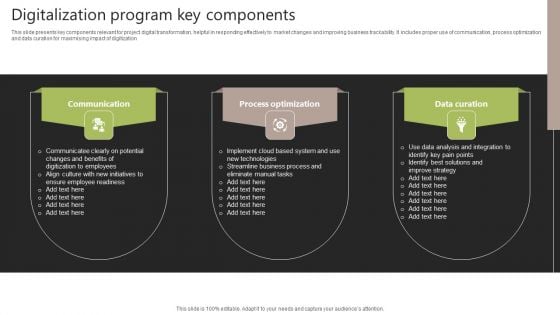
Digitalization Program Key Components Mockup PDF
This slide presents key components relevant for project digital transformation, helpful in responding effectively to market changes and improving business trackability. It includes proper use of communication, process optimization and data curation for maximising impact of digitization. Presenting Digitalization Program Key Components Mockup PDF to dispense important information. This template comprises three stages. It also presents valuable insights into the topics including Communication, Process Optimization, Data Curation. This is a completely customizable PowerPoint theme that can be put to use immediately. So, download it and address the topic impactfully.

Risk Assessment Software Dashboard For Cybersecurity Ppt PowerPoint Presentation Gallery Pictures PDF
This slide represents risk assessment software dashboard for cybersecurity. It includes risk percentage, number of risks, risk analysis progress, risk response progress, risk rating etc. Showcasing this set of slides titled Risk Assessment Software Dashboard For Cybersecurity Ppt PowerPoint Presentation Gallery Pictures PDF. The topics addressed in these templates are Risk Rating Breakdown, Action Plan Breakdown, Top 5 Entities Prone To Risk. All the content presented in this PPT design is completely editable. Download it and make adjustments in color, background, font etc. as per your unique business setting.
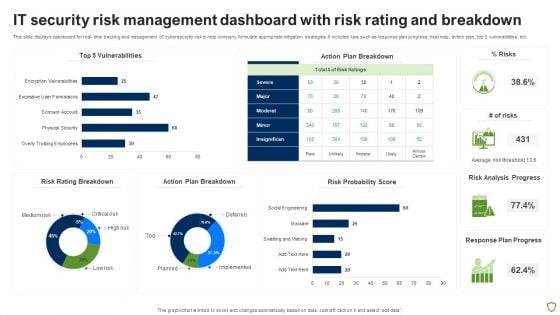
IT Security Risk Management Dashboard With Risk Rating And Breakdown Pictures PDF
This slide displays dashboard for real- time tracking and management of cybersecurity risk to help company formulate appropriate mitigation strategies. It includes kpis such as response plan progress, heat map, action plan, top 5 vulnerabilities, etc. Pitch your topic with ease and precision using this IT Security Risk Management Dashboard With Risk Rating And Breakdown Pictures PDF. This layout presents information on Risk Rating Breakdown, Action Plan Breakdown, Risk Probability Score, Risk Analysis Progress. It is also available for immediate download and adjustment. So, changes can be made in the color, design, graphics or any other component to create a unique layout.
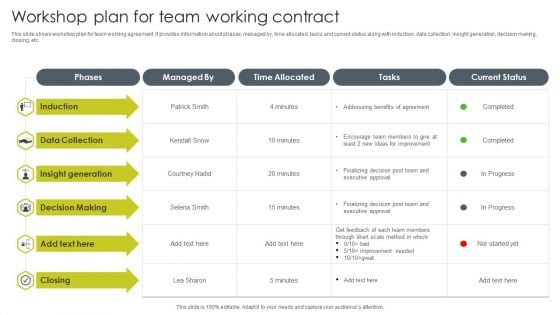
Workshop Plan For Team Working Contract Elements PDF
This slide shows workshop plan for team working agreement. It provides information about phases, managed by, time allocated, tasks and current status along with induction, data collection, insight generation, decision making, closing, etc. Pitch your topic with ease and precision using this Workshop Plan For Team Working Contract Elements PDF. This layout presents information on Insight Generation, Data Collection, Induction. It is also available for immediate download and adjustment. So, changes can be made in the color, design, graphics or any other component to create a unique layout.
Monthly Sales Performance Tracking And Monitoring Dashboard Diagrams PDF
This slide showcases a dashboard presenting various metrics to measure and analyze sales performance for revenue growth. It includes key components such as number of sales, revenue, profit, cost, sales revenue, sales increment, cost analysis and cross sell. Make sure to capture your audiences attention in your business displays with our gratis customizable Monthly Sales Performance Tracking And Monitoring Dashboard Diagrams PDF. These are great for business strategies, office conferences, capital raising or task suggestions. If you desire to acquire more customers for your tech business and ensure they stay satisfied, create your own sales presentation with these plain slides.
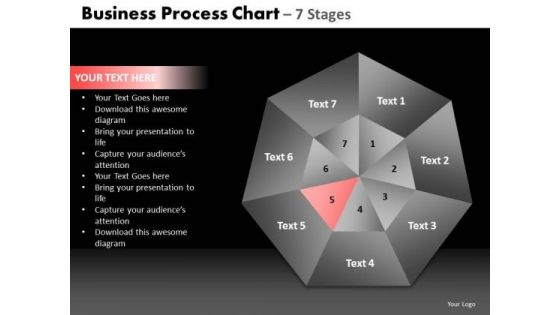
PowerPoint Templates Graphic Quadrant Diagram Ppt Theme
PowerPoint Templates Graphic Quadrant Diagram PPT Theme-These high quality powerpoint pre-designed slides and powerpoint templates have been carefully created by our professional team to help you impress your audience. All slides have been created and are 100% editable in powerpoint. Each and every property of any graphic - color, size, orientation, shading, outline etc. can be modified to help you build an effective powerpoint presentation. Any text can be entered at any point in the powerpoint template or slide. Simply DOWNLOAD, TYPE and PRESENT! Delve on the cold facts in detail. Explain the factual analysis on our PowerPoint Templates Graphic Quadrant Diagram Ppt Theme.
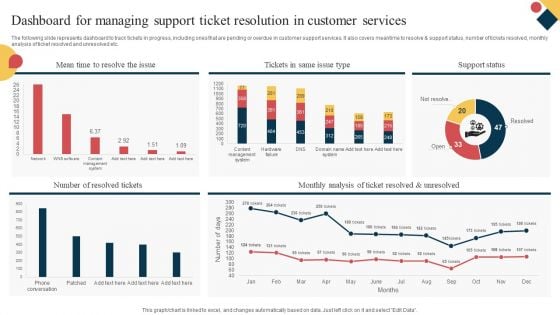
Dashboard For Managing Support Ticket Resolution In Customer Services Ideas PDF
The following slide represents dashboard to track tickets in progress, including ones that are pending or overdue in customer support services. It also covers meantime to resolve and support status, number of tickets resolved, monthly analysis of ticket resolved and unresolved etc. Showcasing this set of slides titled Dashboard For Managing Support Ticket Resolution In Customer Services Ideas PDF. The topics addressed in these templates are Resolved Tickets, Ticket Resolved Unresolved, Support Status. All the content presented in this PPT design is completely editable. Download it and make adjustments in color, background, font etc. as per your unique business setting.
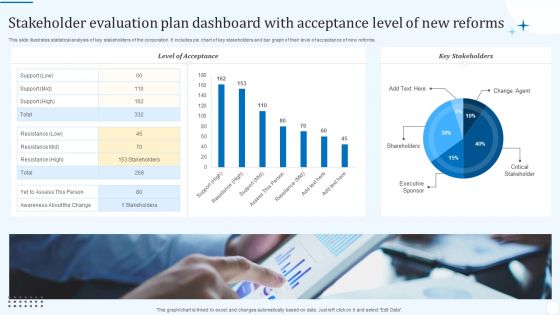
Stakeholder Evaluation Plan Dashboard With Acceptance Level Of New Reforms Background PDF
This slide illustrates statistical analysis of key stakeholders of the corporation. It includes pie chart of key stakeholders and bar graph of their level of acceptance of new reforms. Showcasing this set of slides titled Stakeholder Evaluation Plan Dashboard With Acceptance Level Of New Reforms Background PDF. The topics addressed in these templates are Level Acceptance, Key Stakeholders, Critical Stakeholder. All the content presented in this PPT design is completely editable. Download it and make adjustments in color, background, font etc. as per your unique business setting.
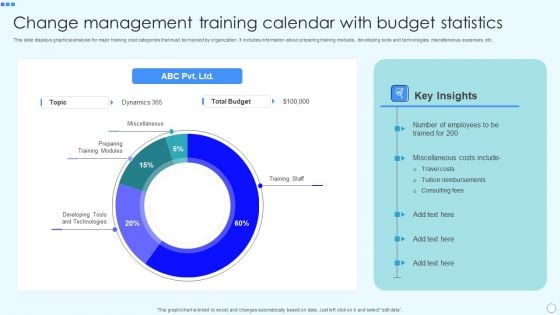
Change Management Training Calendar With Budget Statistics Template PDF
This slide displays graphical analysis for major training cost categories that must be tracked by organization. It includes information about preparing training modules, developing tools and technologies, miscellaneous expenses, etc. Showcasing this set of slides titled Change Management Training Calendar With Budget Statistics Template PDF. The topics addressed in these templates are Miscellaneous, Preparing Training Modules, Developing Tools And Technologies, Training Staff. All the content presented in this PPT design is completely editable. Download it and make adjustments in color, background, font etc. as per your unique business setting.
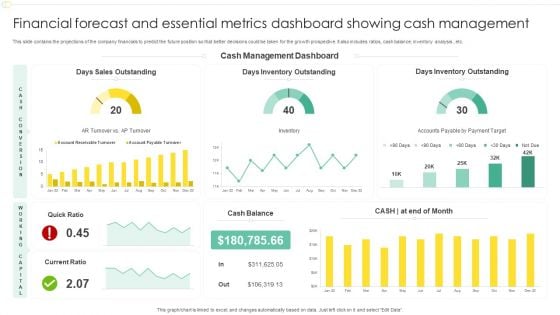
Financial Forecast And Essential Metrics Dashboard Showing Cash Management Designs PDF
This slide contains the projections of the company financials to predict the future position so that better decisions could be taken for the growth prospective. It also includes ratios, cash balance, inventory analysis , etc. Showcasing this set of slides titled Financial Forecast And Essential Metrics Dashboard Showing Cash Management Designs PDF. The topics addressed in these templates are Days Sales Outstanding, Cash Management Dashboard, Days Inventory Outstanding. All the content presented in this PPT design is completely editable. Download it and make adjustments in color, background, font etc. as per your unique business setting.
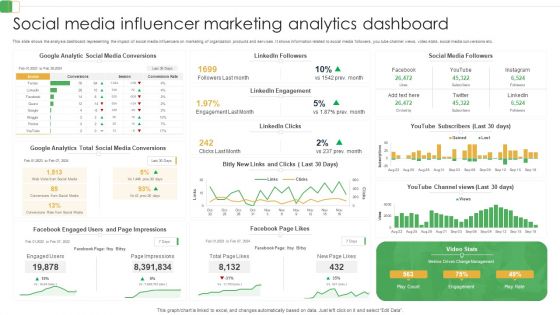
Social Media Influencer Marketing Analytics Dashboard Ppt PowerPoint Presentation File Inspiration PDF
This slide shows the analysis dashboard representing the impact of social media influencers on marketing of organization products and services. It shows information related to social media followers, you tube channel views, video stats, social media conversions etc.Showcasing this set of slides titled Social Media Influencer Marketing Analytics Dashboard Ppt PowerPoint Presentation File Inspiration PDF. The topics addressed in these templates are Linkedin Engagement, Media Conversions, Facebook Engaged. All the content presented in this PPT design is completely editable. Download it and make adjustments in color, background, font etc. as per your unique business setting.
Robotic Process Automation Metrics Dashboard For Tracking Business Return On Investment Information PDF
This slide illustrates KPI Dashboard for measuring time and money saved after RPA deployment. It also include metrics for analysis such as productivity in robot hours, hours saved per process, money saved per process, etc. Pitch your topic with ease and precision using this Robotic Process Automation Metrics Dashboard For Tracking Business Return On Investment Information PDF. This layout presents information on Management, Goal, Productivity. It is also available for immediate download and adjustment. So, changes can be made in the color, design, graphics or any other component to create a unique layout.
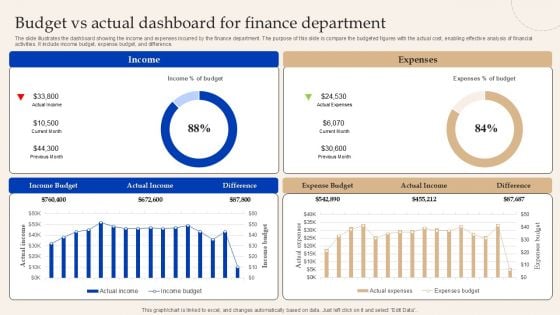
Budget Vs Actual Dashboard For Finance Department Brochure PDF

Pillars To Prioritize Success Of Diversification Measures Ppt Outline Designs PDF
This slide covers five pillars to ensure success of diversity and inclusion measures. It includes pillars such as appointment of executive sponsorship, measure data driven decisions, commitment to equity and justice, enable leaders to adopt change, etc. Presenting Pillars To Prioritize Success Of Diversification Measures Ppt Outline Designs PDF to dispense important information. This template comprises five stages. It also presents valuable insights into the topics including Enable Leaders, Adopt Change, Targeted Investments, Measure Data. This is a completely customizable PowerPoint theme that can be put to use immediately. So, download it and address the topic impactfully.
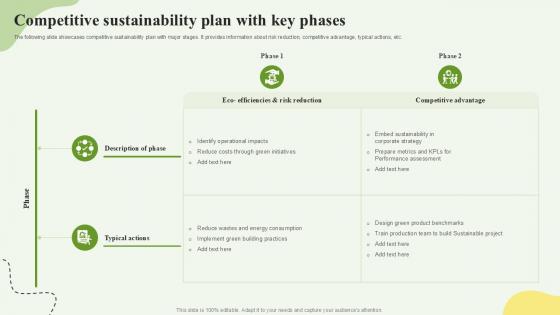
Competitive Sustainability Plan With Key Phases Ppt Template SS
This slide showcases dashboard for real estate company sales. This template aims to show a power bi dashboard for property dealer sales analysis representing total sales by project, actual sales, total revenue, number of contracts signed and marketing details. It is very useful tool for real estate developers and other property dealers. From laying roadmaps to briefing everything in detail, our templates are perfect for you. You can set the stage with your presentation slides. All you have to do is download these easy-to-edit and customizable templates. Competitive Sustainability Plan With Key Phases Ppt Template SS will help you deliver an outstanding performance that everyone would remember and praise you for. Do download this presentation today. This slide showcases dashboard for real estate company sales. This template aims to show a power bi dashboard for property dealer sales analysis representing total sales by project, actual sales, total revenue, number of contracts signed and marketing details. It is very useful tool for real estate developers and other property dealers.
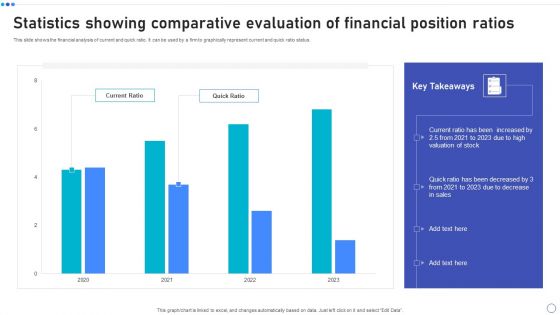
Statistics Showing Comparative Evaluation Of Financial Position Ratios Download PDF
This slide shows the financial analysis of current and quick ratio. It can be used by a firm to graphically represent current and quick ratio status. Pitch your topic with ease and precision using this Statistics Showing Comparative Evaluation Of Financial Position Ratios Download PDF. This layout presents information on Current Ratio, Quick Ratio, 2021 To 2023. It is also available for immediate download and adjustment. So, changes can be made in the color, design, graphics or any other component to create a unique layout.
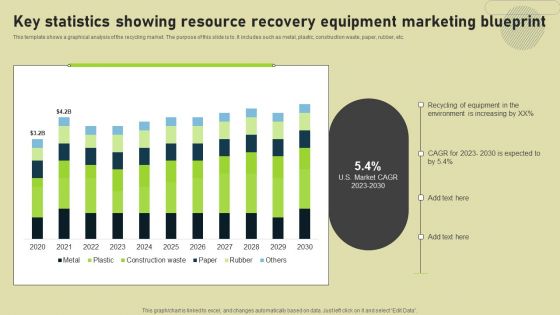
Key Statistics Showing Resource Recovery Equipment Marketing Blueprint Graphics PDF
This template shows a graphical analysis of the recycling market. The purpose of this slide is to. It includes such as metal, plastic, construction waste, paper, rubber, etc. Pitch your topic with ease and precision using this Key Statistics Showing Resource Recovery Equipment Marketing Blueprint Graphics PDF. This layout presents information on Equipment, Environment, Marketing Blueprint. It is also available for immediate download and adjustment. So, changes can be made in the color, design, graphics or any other component to create a unique layout.
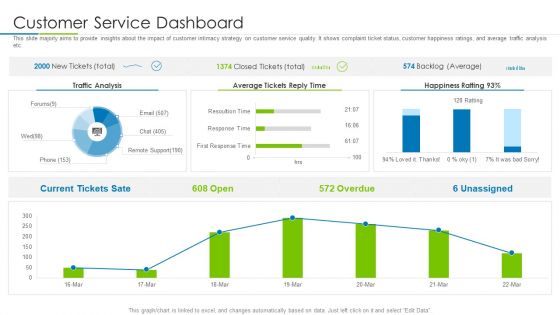
Customer Rapport Strategy To Build Loyal Client Base Customer Service Dashboard Diagrams PDF
This slide majorly aims to provide insights about the impact of customer intimacy strategy on customer service quality. It shows complaint ticket status, customer happiness ratings, and average traffic analysis etc. Deliver and pitch your topic in the best possible manner with this customer rapport strategy to build loyal client base customer service dashboard diagrams pdf. Use them to share invaluable insights on customer service dashboard and impress your audience. This template can be altered and modified as per your expectations. So, grab it now.
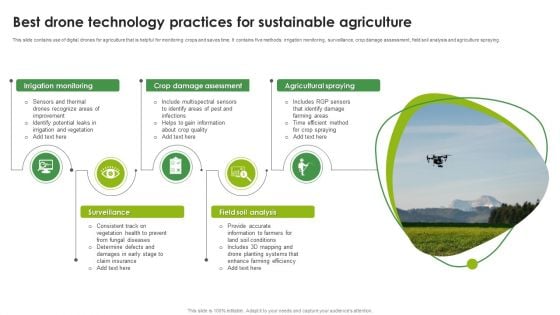
Best Drone Technology Practices For Sustainable Agriculture Themes PDF
This slide contains use of digital drones for agriculture that is helpful for monitoring crops and saves time. It contains five methods irrigation monitoring, surveillance, crop damage assessment, field soil analysis and agriculture spraying. Presenting Best Drone Technology Practices For Sustainable Agriculture Themes PDF to dispense important information. This template comprises five stages. It also presents valuable insights into the topics including Irrigation Monitoring, Crop Damage Assessment, Agricultural Spraying. This is a completely customizable PowerPoint theme that can be put to use immediately. So, download it and address the topic impactfully.
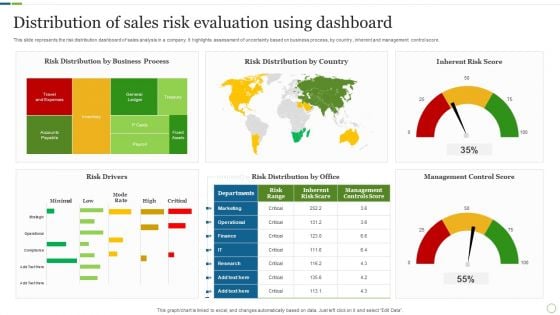
Distribution Of Sales Risk Evaluation Using Dashboard Brochure PDF
This slide represents the risk distribution dashboard of sales analysis in a company. It highlights assessment of uncertainty based on business process, by country , inherent and management control score. Showcasing this set of slides titled Distribution Of Sales Risk Evaluation Using Dashboard Brochure PDF. The topics addressed in these templates are Risk Drivers, Management Control Score, Inherent Risk Score. All the content presented in this PPT design is completely editable. Download it and make adjustments in color, background, font etc. as per your unique business setting.
Business Chart Arrows PowerPoint Templates And PowerPoint Themes 1012
Visually support your Microsoft office PPT Presentation with our above template illustrating a colored bar graph. This image has been professionally designed to emphasize the concept of financial analysis and statistics. This image has been conceived to enable you to emphatically communicate your ideas in your Business and Financial PPT presentations showing reports, ratings and reviews etc. Go ahead and add personality to your presentations with our stunning templates. Identify probable false alarms in advance. Establish correct checks with our Business Chart Arrows PowerPoint Templates And PowerPoint Themes 1012.
Facebook Analytics Pixel Marketing Plan Dashboard Professional PDF
This slide exhibits dashboard which offers free point of view for optimization and in-depth analysis of visitors. This template helps in tracking social media and campaigns performance. It involves information related to revenue, age factor, etc. Showcasing this set of slides titled Facebook Analytics Pixel Marketing Plan Dashboard Professional PDF Graphics. The topics addressed in these templates are People Metrics, Lifetime Value, Purchases Repeated. All the content presented in this PPT design is completely editable. Download it and make adjustments in color, background, font etc. as per your unique business setting.
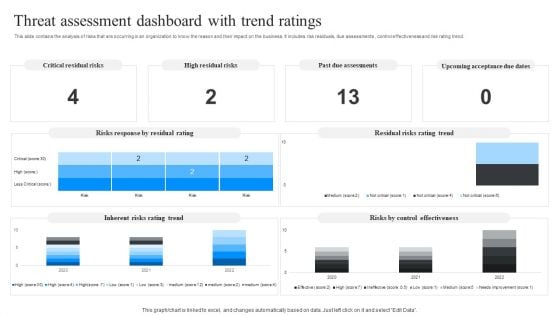
Threat Assessment Dashboard With Trend Ratings Ppt Model Vector PDF
This slide contains the analysis of risks that are occurring in an organization to know the reason and their impact on the business. It includes risk residuals, due assessments , control effectiveness and risk rating trend. Showcasing this set of slides titled Threat Assessment Dashboard With Trend Ratings Ppt Model Vector PDF. The topics addressed in these templates are Critical Residual Risks, High Residual Risks, Past Due Assessments. All the content presented in this PPT design is completely editable. Download it and make adjustments in color, background, font etc. as per your unique business setting.
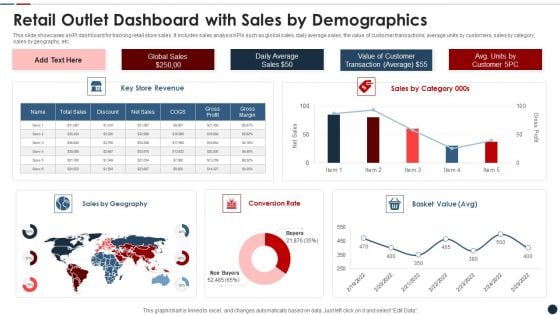
Retail Outlet Dashboard With Sales By Demographics Slides PDF
This slide showcases a KPI dashboard for tracking retail store sales. It includes sales analysis KPIs such as global sales, daily average sales, the value of customer transactions, average units by customers, sales by category, sales by geography, etc. Showcasing this set of slides titled retail outlet dashboard with sales by demographics slides pdf The topics addressed in these templates are Retail outlet dashboard with sales by demographics All the content presented in this PPT design is completely editable. Download it and make adjustments in color, background, font etc. as per your unique business setting.
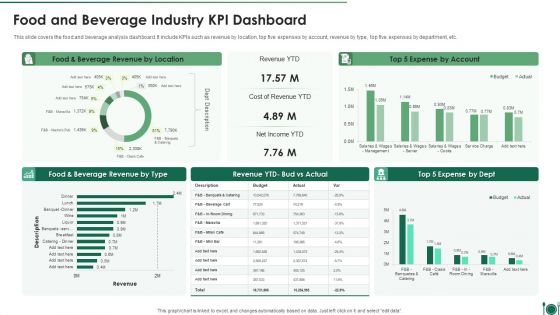
Food And Beverage Industry Kpi Dashboard Professional PDF
This slide covers the food and beverage analysis dashboard. It include KPIs such as revenue by location, top five expenses by account, revenue by type, top five expenses by department, etc.Showcasing this set of slides titled Food And Beverage Industry Kpi Dashboard Professional PDF. The topics addressed in these templates are Food And Beverage Industry KPI Dashboard. All the content presented in this PPT design is completely editable. Download it and make adjustments in color, background, font etc. as per your unique business setting
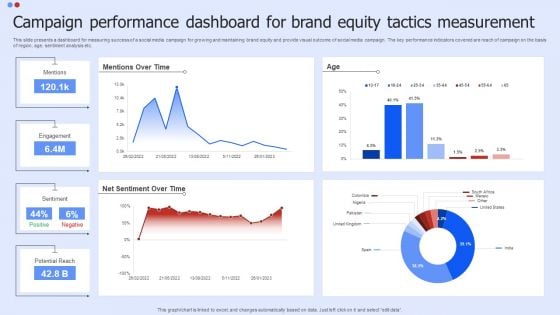
Campaign Performance Dashboard For Brand Equity Tactics Measurement Slides PDF
This slide presents a dashboard for measuring success of a social media campaign for growing and maintaining brand equity and provide visual outcome of social media campaign. The key performance indicators covered are reach of campaign on the basis of region, age, sentiment analysis etc. Showcasing this set of slides titled Campaign Performance Dashboard For Brand Equity Tactics Measurement Slides PDF. The topics addressed in these templates are Campaign Performance Dashboard For Brand Equity Tactics Measurement Slides PDF. All the content presented in this PPT design is completely editable. Download it and make adjustments in color, background, font etc. as per your unique business setting.
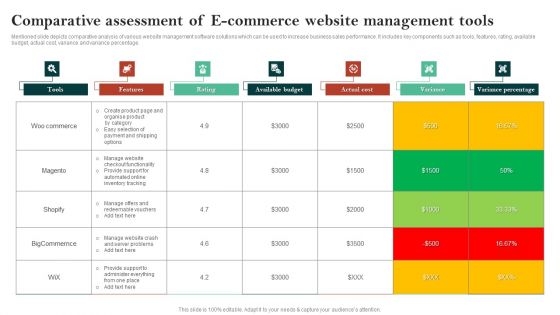
Comparative Assessment Of E Commerce Website Management Tools Themes PDF
Mentioned slide depicts comparative analysis of various website management software solutions which can be used to increase business sales performance. It includes key components such as tools, features, rating, available budget, actual cost, variance and variance percentage. Pitch your topic with ease and precision using this Comparative Assessment Of E Commerce Website Management Tools Themes PDF. This layout presents information on Rating, Available Budget, Actual Cost, Variance. It is also available for immediate download and adjustment. So, changes can be made in the color, design, graphics or any other component to create a unique layout.
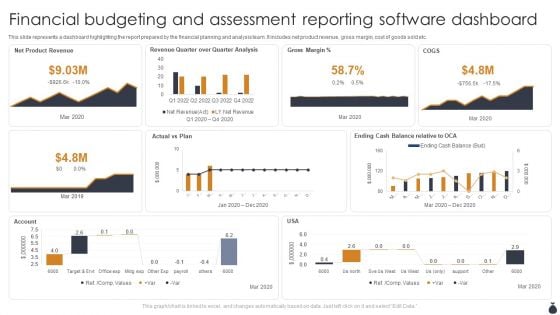
Financial Budgeting And Assessment Reporting Software Dashboard Template PDF
This slide represents a dashboard highlighting the report prepared by the financial planning and analysis team. It includes net product revenue, gross margin, cost of goods sold etc. Showcasing this set of slides titled Financial Budgeting And Assessment Reporting Software Dashboard Template PDF. The topics addressed in these templates are Net Product Revenue, Actual Vs Plan, Account. All the content presented in this PPT design is completely editable. Download it and make adjustments in color, background, font etc. as per your unique business setting.
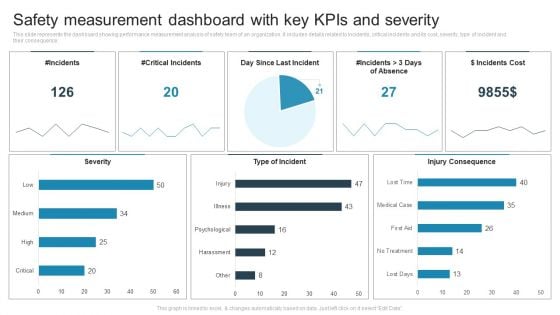
Safety Measurement Dashboard With Key Kpis And Severity Sample PDF
This slide represents the dashboard showing performance measurement analysis of safety team of an organization. It includes details related to incidents, critical incidents and its cost, severity, type of incident and their consequence. Showcasing this set of slides titled Safety Measurement Dashboard With Key Kpis And Severity Sample PDF. The topics addressed in these templates are Incidents, Critical Incidents, Day Since Last Incident. All the content presented in this PPT design is completely editable. Download it and make adjustments in color, background, font etc. as per your unique business setting.
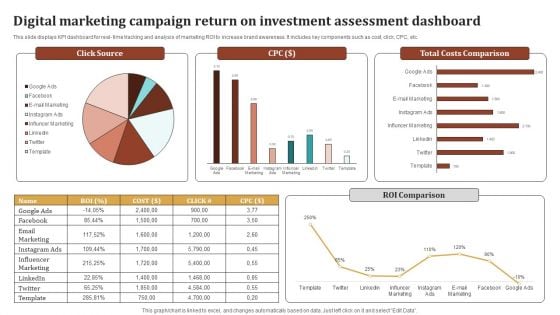
Digital Marketing Campaign Return On Investment Assessment Dashboard Ideas PDF
This slide displays KPI dashboard for real- time tracking and analysis of marketing ROI to increase brand awareness. It includes key components such as cost, click, CPC, etc. Showcasing this set of slides titled Digital Marketing Campaign Return On Investment Assessment Dashboard Ideas PDF. The topics addressed in these templates are Influencer Marketing, Email Marketing, Total Costs Comparison, Roi Comparison. All the content presented in this PPT design is completely editable. Download it and make adjustments in color, background, font etc. as per your unique business setting.
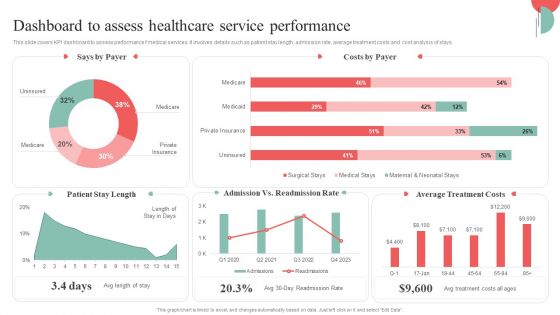
Incorporating HIS To Enhance Healthcare Services Dashboard To Assess Healthcare Service Performance Background PDF
This slide covers KPI dashboard to assess performance f medical services. It involves details such as patient stay length, admission rate, average treatment costs and cost analysis of stays. Boost your pitch with our creative Incorporating HIS To Enhance Healthcare Services Dashboard To Assess Healthcare Service Performance Background PDF. Deliver an awe-inspiring pitch that will mesmerize everyone. Using these presentation templates you will surely catch everyones attention. You can browse the ppts collection on our website. We have researchers who are experts at creating the right content for the templates. So you do not have to invest time in any additional work. Just grab the template now and use them.
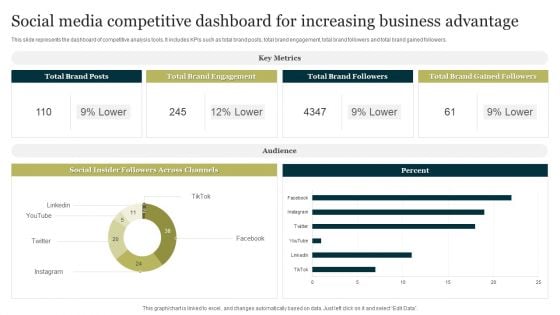
Social Media Competitive Dashboard For Increasing Business Advantage Portrait PDF
This slide represents the dashboard of competitive analysis tools. It includes KPIs such as total brand posts, total brand engagement, total brand followers and total brand gained followers. Pitch your topic with ease and precision using this Social Media Competitive Dashboard For Increasing Business Advantage Portrait PDF. This layout presents information on Social Media Competitive Dashboard, Increasing Business Advantage. It is also available for immediate download and adjustment. So, changes can be made in the color, design, graphics or any other component to create a unique layout.
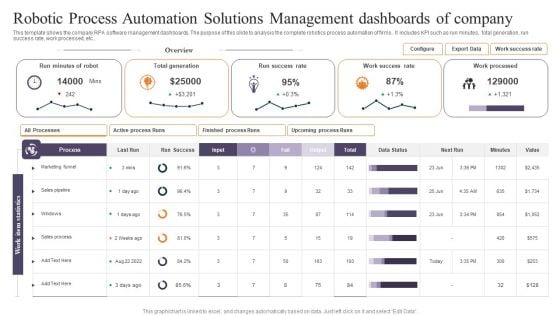
Robotic Process Automation Solutions Management Dashboards Of Company Elements PDF
This template shows the company RPA software management dashboards. The purpose of this slide to analysis the complete robotics process automation of firms . It includes KPI such as run minutes, total generation, run success rate, work processed, etc. Pitch your topic with ease and precision using this Robotic Process Automation Solutions Management Dashboards Of Company Elements PDF. This layout presents information on Minutes Of Robot, Total Generation, Success Rate. It is also available for immediate download and adjustment. So, changes can be made in the color, design, graphics or any other component to create a unique layout.
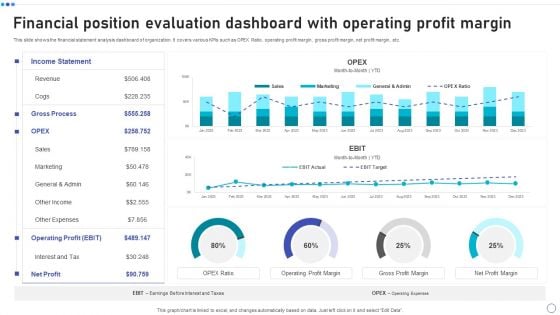
Financial Position Evaluation Dashboard With Operating Profit Margin Elements PDF
This slide shows the financial statement analysis dashboard of organization. It covers various KPIs such as OPEX Ratio, operating profit margin, gross profit margin, net profit margin, etc. Pitch your topic with ease and precision using this Financial Position Evaluation Dashboard With Operating Profit Margin Elements PDF. This layout presents information on Income Statement, Revenue, Operating Profit, Net Profit. It is also available for immediate download and adjustment. So, changes can be made in the color, design, graphics or any other component to create a unique layout.
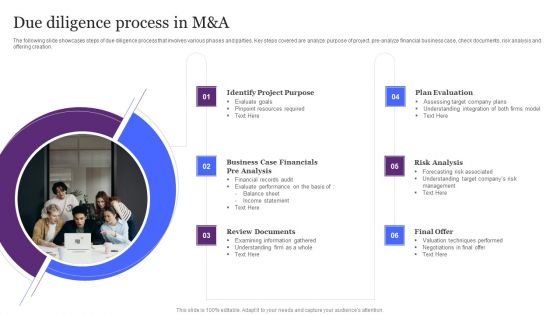
Due Diligence Process In M And A Ppt Styles Information PDF
The following slide showcases steps of due diligence process that involves various phases and parties. Key steps covered are analyze purpose of project, pre-analyze financial business case, check documents, risk analysis and offering creation. Presenting Due Diligence Process In M And A Ppt Styles Information PDF to dispense important information. This template comprises six stages. It also presents valuable insights into the topics including Identify Project Purpose, Business Case Financials, Review Documents. This is a completely customizable PowerPoint theme that can be put to use immediately. So, download it and address the topic impactfully.
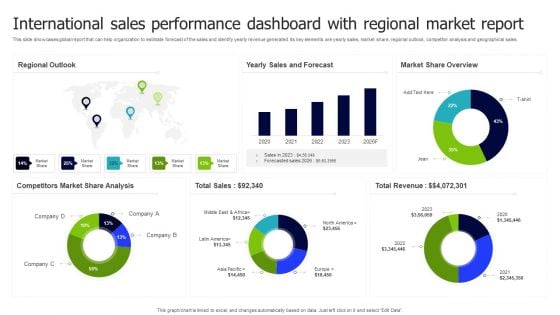
International Sales Performance Dashboard With Regional Market Report Inspiration PDF
This slide showcases global report that can help organization to estimate forecast of the sales and identify yearly revenue generated. Its key elements are yearly sales, market share, regional outlook, competitor analysis and geographical sales. Pitch your topic with ease and precision using this International Sales Performance Dashboard With Regional Market Report Inspiration PDF. This layout presents information on Regional Outlook, Sales And Forecast, Market Share Overview. It is also available for immediate download and adjustment. So, changes can be made in the color, design, graphics or any other component to create a unique layout.
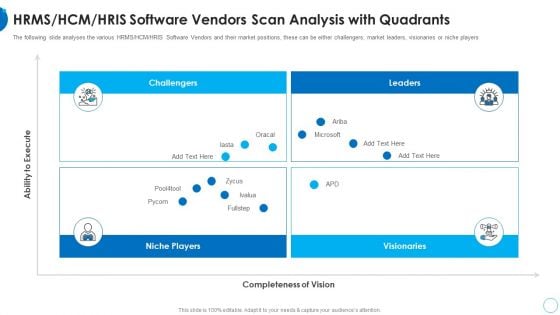
RMS HCM HRIS Software Vendors HR Change Management Tools Themes PDF
The following slide analyses the various HRMS or HCM or HRIS Software Vendors and their market positions, these can be either challengers, market leaders, visionaries or niche players This is a rms hcm hris software vendors hr change management tools themes pdf template with various stages. Focus and dispense information on four stages using this creative set, that comes with editable features. It contains large content boxes to add your information on topics like hrms or hcm or hris software vendors scan analysis with quadrants. You can also showcase facts, figures, and other relevant content using this PPT layout. Grab it now.
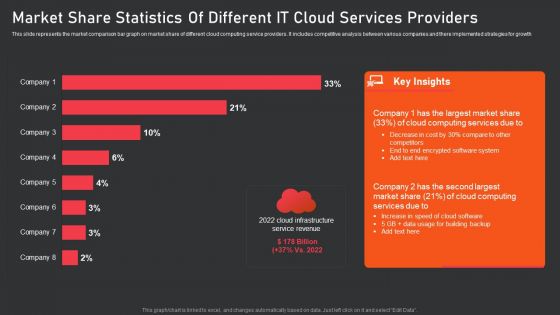
Market Share Statistics Of Different IT Cloud Services Providers Topics PDF
This slide represents the market comparison bar graph on market share of different cloud computing service providers. It includes competitive analysis between various companies and there implemented strategies for growth. Showcasing this set of slides titled market share statistics of different it cloud services providers topics pdf. The topics addressed in these templates are largest market share, cloud computing services. All the content presented in this PPT design is completely editable. Download it and make adjustments in color, background, font etc. as per your unique business setting.
Monthly Sales Performance Tracking And Monitoring Dashboard Designs PDF
This slide showcases a dashboard presenting various metrics to measure and analyze sales performance for revenue growth. It includes key components such as number of sales, revenue, profit, cost, sales revenue, sales increment, cost analysis and cross sell. Make sure to capture your audiences attention in your business displays with our gratis customizable Monthly Sales Performance Tracking And Monitoring Dashboard Designs PDF. These are great for business strategies, office conferences, capital raising or task suggestions. If you desire to acquire more customers for your tech business and ensure they stay satisfied, create your own sales presentation with these plain slides.
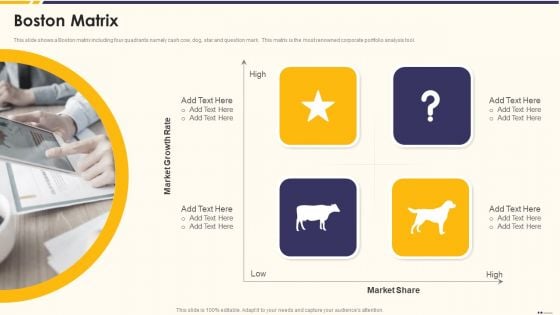
Promotion Standard Practices Tools And Templates Boston Matrix Structure PDF
This slide shows a Boston matrix including four quadrants namely cash cow, dog, star and question mark. This matrix is the most renowned corporate portfolio analysis tool.This is a promotion standard practices tools and templates boston matrix structure pdf template with various stages. Focus and dispense information on four stages using this creative set, that comes with editable features. It contains large content boxes to add your information on topics like boston matrix You can also showcase facts, figures, and other relevant content using this PPT layout. Grab it now.
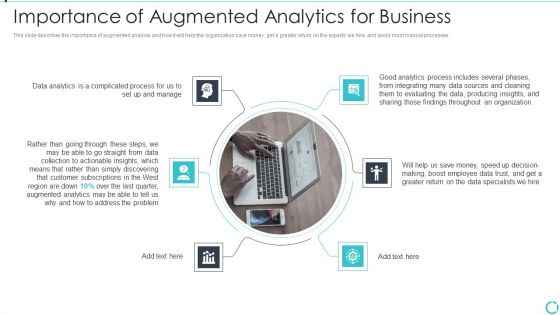
Augmented Analytics Implementation IT Importance Of Augmented Analytics For Business Portrait PDF
This slide describes the importance of augmented analysis and how it will help the organization save money, get a greater return on the experts we hire, and avoid most manual processes. This is a Augmented Analytics Implementation IT Importance Of Augmented Analytics For Business Portrait PDF template with various stages. Focus and dispense information on six stages using this creative set, that comes with editable features. It contains large content boxes to add your information on topics like Good Analytics, Process Includes, Several Phases, Customer Subscriptions. You can also showcase facts, figures, and other relevant content using this PPT layout. Grab it now.
Procurement Kpi Dashboard For Tracking Supplier Action Plan Impact Graphics PDF
This slide covers procurement spend analysis dashboard for tracking new supplier strategy results. It include KPIs such as invoice count, invoices information, due dates, spend by payment terms, supplier payment terms, spend by entity, spend by category, spend by country. Showcasing this set of slides titled procurement kpi dashboard for tracking supplier action plan impact graphics pdf. The topics addressed in these templates are procurement kpi dashboard for tracking supplier action plan impact. All the content presented in this PPT design is completely editable. Download it and make adjustments in color, background, font etc. as per your unique business setting.
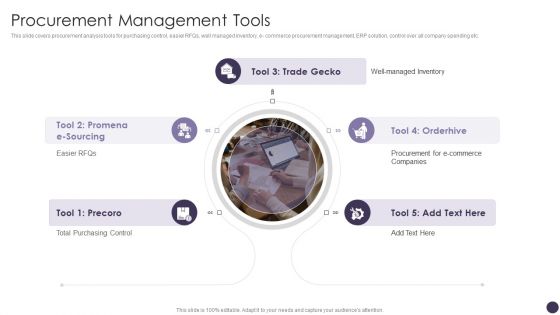
Procurement Management Tools Diagrams PDF
This slide covers procurement analysis tools for purchasing control, easier RFQs, well managed inventory, e commerce procurement management, ERP solution, control over all company spending etc.Presenting Procurement Management Tools Diagrams PDF to provide visual cues and insights. Share and navigate important information on four stages that need your due attention. This template can be used to pitch topics like Managed Inventory, Commerce Companies, Purchasing Control. In addtion, this PPT design contains high resolution images, graphics, etc, that are easily editable and available for immediate download.
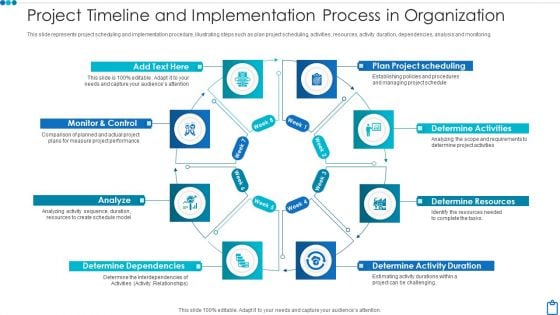
Project Timeline And Implementation Process In Organization Information PDF
This slide represents project scheduling and implementation procedure, illustrating steps such as plan project scheduling, activities, resources, activity duration, dependencies, analysis and monitoring. Presenting project timeline and implementation process in organization information pdf to dispense important information. This template comprises eight stages. It also presents valuable insights into the topics including plan project scheduling, determine activities, determine resources, determine activity duration, determine dependencies. This is a completely customizable PowerPoint theme that can be put to use immediately. So, download it and address the topic impactfully.
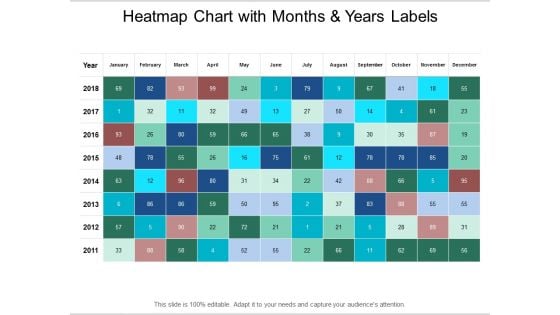
Heatmap Chart With Months And Years Labels Ppt PowerPoint Presentation Ideas Tips
Presenting this set of slides with name heatmap chart with months and years labels ppt powerpoint presentation ideas tips. The topics discussed in these slides are heat map, data analytics, business quarterly. This is a completely editable PowerPoint presentation and is available for immediate download. Download now and impress your audience.
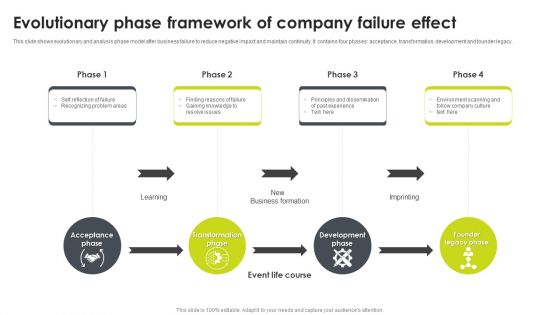
Evolutionary Phase Framework Of Company Failure Effect Infographics PDF
This slide shows evolutionary and analysis phase model after business failure to reduce negative impact and maintain continuity. It contains four phases acceptance, transformation, development and founder legacy. Persuade your audience using this Evolutionary Phase Framework Of Company Failure Effect Infographics PDF. This PPT design covers four stages, thus making it a great tool to use. It also caters to a variety of topics including Business Formation, Development Phase, Transformation Phase. Download this PPT design now to present a convincing pitch that not only emphasizes the topic but also showcases your presentation skills.
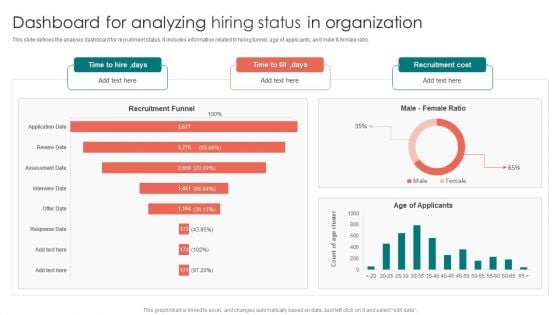
Dashboard For Analyzing Hiring Status In Organization Ppt PowerPoint Presentation Gallery Images PDF
This slide defines the analysis dashboard for recruitment status. It includes information related to hiring funnel, age of applicants, and male and female ratio. Pitch your topic with ease and precision using this Dashboard For Analyzing Hiring Status In Organization Ppt PowerPoint Presentation Gallery Images PDF. This layout presents information on Recruitment Funnel, Time To Hire, Age Applicants. It is also available for immediate download and adjustment. So, changes can be made in the color, design, graphics or any other component to create a unique layout.
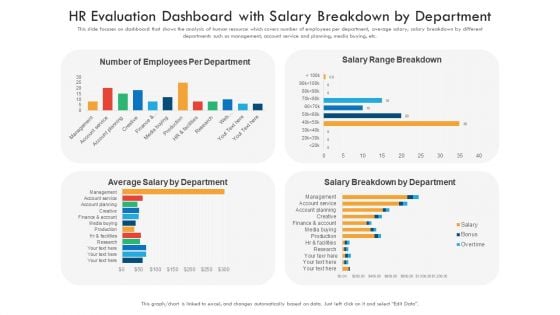
HR Evaluation Dashboard With Salary Breakdown By Department Ppt PowerPoint Presentation Templates PDF
This slide focuses on dashboard that shows the analysis of human resource which covers number of employees per department, average salary, salary breakdown by different departments such as management, account service and planning, media buying, etc. Showcasing this set of slides titled HR evaluation dashboard with salary breakdown by department ppt powerpoint presentation templates pdf. The topics addressed in these templates are finance account, web development, account planning. All the content presented in this PPT design is completely editable. Download it and make adjustments in color, background, font etc. as per your unique business setting.
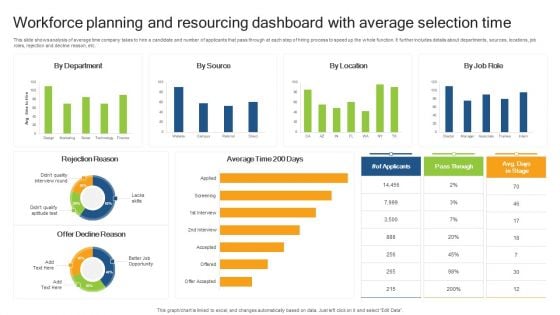
Workforce Planning And Resourcing Dashboard With Average Selection Time Demonstration PDF
This slide shows analysis of average time company takes to hire a candidate and number of applicants that pass through at each step of hiring process to speed up the whole function. It further includes details about departments, sources, locations, job roles, rejection and decline reason, etc. Showcasing this set of slides titled Workforce Planning And Resourcing Dashboard With Average Selection Time Demonstration PDF. The topics addressed in these templates are Rejection Reason, Offer Decline Reason, Average Time. All the content presented in this PPT design is completely editable. Download it and make adjustments in color, background, font etc. as per your unique business setting.
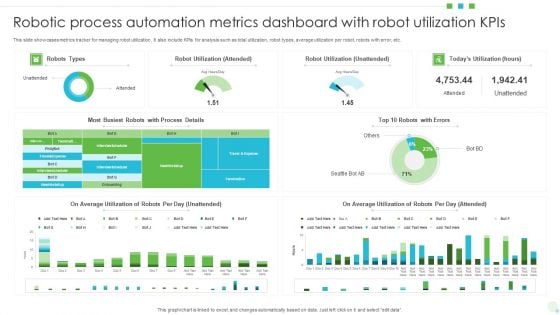
Robotic Process Automation Metrics Dashboard With Robot Utilization Kpis Background PDF
This slide showcases metrics tracker for managing robot utilization. It also include KPIs for analysis such as total utilization, robot types, average utilization per robot, robots with error, etc. Pitch your topic with ease and precision using this Robotic Process Automation Metrics Dashboard With Robot Utilization Kpis Background PDF. This layout presents information on Average Utilization, Robot Utilization, Automation Metrics Dashboard. It is also available for immediate download and adjustment. So, changes can be made in the color, design, graphics or any other component to create a unique layout.
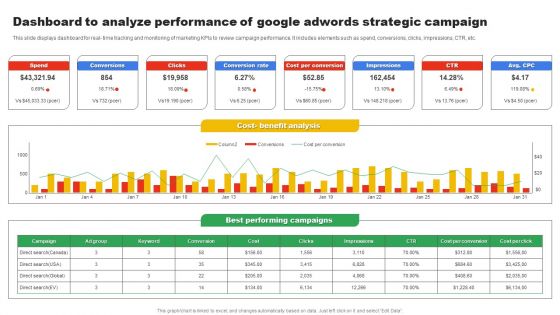
Dashboard To Analyze Performance Of Google Adwords Strategic Campaign Inspiration PDF
This slide displays dashboard for real time tracking and monitoring of marketing KPIs to review campaign performance. It includes elements such as spend, conversions, clicks, impressions, CTR, etc. Pitch your topic with ease and precision using this Dashboard To Analyze Performance Of Google Adwords Strategic Campaign Inspiration PDF. This layout presents information on Spend, Conversions, Cost Benefit Analysis . It is also available for immediate download and adjustment. So, changes can be made in the color, design, graphics or any other component to create a unique layout.
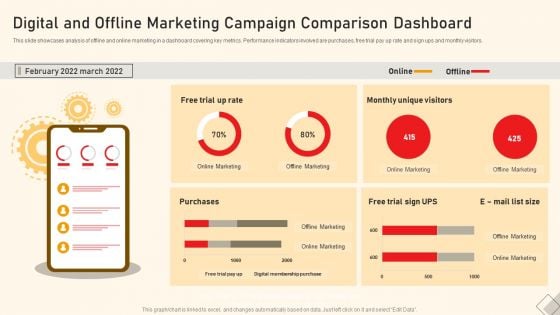
Digital And Offline Marketing Campaign Comparison Dashboard Ppt Inspiration Microsoft PDF
This slide showcases analysis of offline and online marketing in a dashboard covering key metrics. Performance indicators involved are purchases, free trial pay up rate and sign ups and monthly visitors. Pitch your topic with ease and precision using this Digital And Offline Marketing Campaign Comparison Dashboard Ppt Inspiration Microsoft PDF. This layout presents information on Online Marketing, Offline Marketing, Free Trial Sign, UPS. It is also available for immediate download and adjustment. So, changes can be made in the color, design, graphics or any other component to create a unique layout.
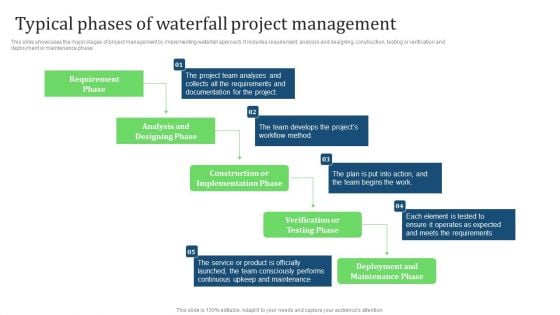
Typical Phases Of Waterfall Project Management Professional PDF
This slide showcases the major stages of project management by implementing waterfall approach. It includes requirement, analysis and designing, construction, testing or verification and deployment or maintenance phase. Make sure to capture your audiences attention in your business displays with our gratis customizable Typical Phases Of Waterfall Project Management Professional PDF. These are great for business strategies, office conferences, capital raising or task suggestions. If you desire to acquire more customers for your tech business and ensure they stay satisfied, create your own sales presentation with these plain slides.
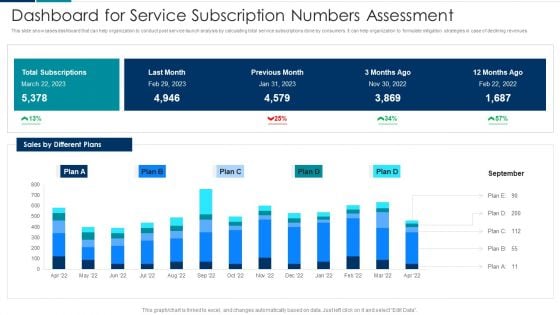
Managing New Service Roll Out And Marketing Procedure Dashboard For Service Subscription Numbers Assessment Clipart PDF
This slide showcases dashboard that can help organization to conduct post service launch analysis by calculating total service subscriptions done by consumers. It can help organization to formulate mitigation strategies in case of declining revenues. Deliver an awe inspiring pitch with this creative Managing New Service Roll Out And Marketing Procedure Dashboard For Service Subscription Numbers Assessment Clipart PDF bundle. Topics like Dashboard For Service, Subscription Numbers Assessment can be discussed with this completely editable template. It is available for immediate download depending on the needs and requirements of the user.
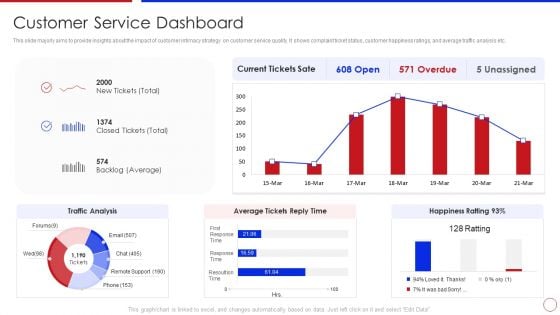
Strategy To Enhance Buyer Intimacy Customer Service Dashboard Ppt Outline Shapes PDF
This slide majorly aims to provide insights about the impact of customer intimacy strategy on customer service quality. It shows complaint ticket status, customer happiness ratings, and average traffic analysis etc. Deliver and pitch your topic in the best possible manner with this strategy to enhance buyer intimacy customer service dashboard ppt outline shapes pdf. Use them to share invaluable insights on customer service dashboard and impress your audience. This template can be altered and modified as per your expectations. So, grab it now.
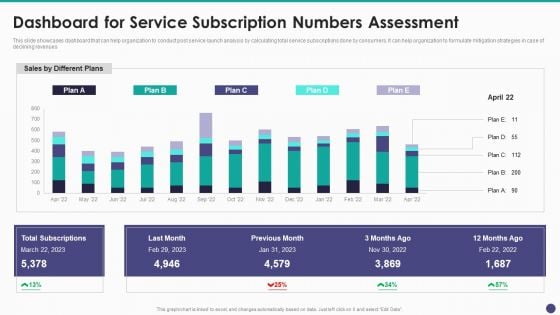
New Service Launch And Development Strategy To Gain Market Share Dashboard For Service Subscription Summary PDF
This slide showcases dashboard that can help organization to conduct post service launch analysis by calculating total service subscriptions done by consumers. It can help organization to formulate mitigation strategies in case of declining revenues.Deliver and pitch your topic in the best possible manner with this New Service Launch And Development Strategy To Gain Market Share Dashboard For Service Subscription Summary PDF Use them to share invaluable insights on Total Subscriptions, Previous Month, Different Plans and impress your audience. This template can be altered and modified as per your expectations. So, grab it now.
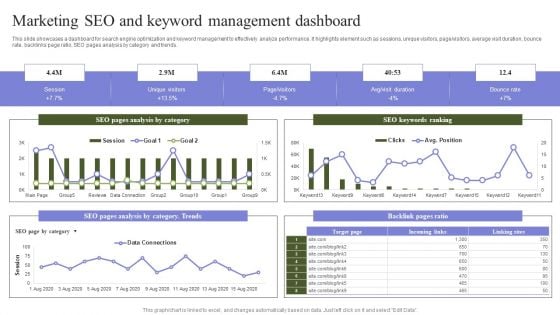
Marketing Mix Strategy Handbook Marketing SEO And Keyword Management Dashboard Pictures PDF
This slide showcases a dashboard for search engine optimization and keyword management to effectively analyze performance. It highlights element such as sessions, unique visitors, page visitors, average visit duration, bounce rate, backlinks page ratio, SEO pages analysis by category and trends. The best PPT templates are a great way to save time, energy, and resources. Slidegeeks have 100 percent editable powerpoint slides making them incredibly versatile. With these quality presentation templates, you can create a captivating and memorable presentation by combining visually appealing slides and effectively communicating your message. Download Marketing Mix Strategy Handbook Marketing SEO And Keyword Management Dashboard Pictures PDF from Slidegeeks and deliver a wonderful presentation.
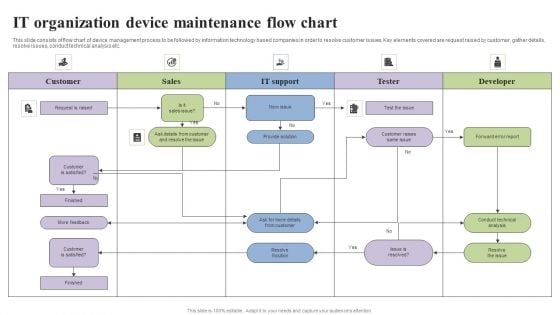
It Organization Device Maintenance Flow Chart Formats PDF
This slide consists of flow chart of device management process to be followed by information technology based companies in order to resolve customer issues. Key elements covered are request raised by customer, gather details, resolve issues, conduct technical analysis etc. Presenting It Organization Device Maintenance Flow Chart Formats PDF to dispense important information. This template comprises one stages. It also presents valuable insights into the topics including Customer, Sales, Tester. This is a completely customizable PowerPoint theme that can be put to use immediately. So, download it and address the topic impactfully.
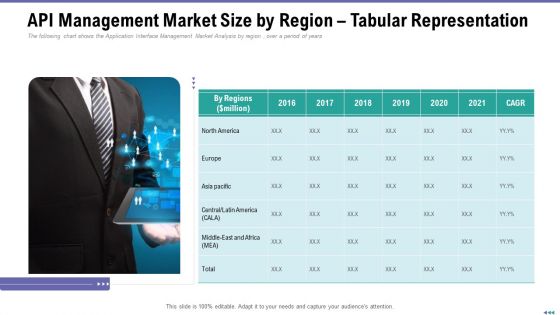
Market Viewpoint Application Programming Interface Governance API Management Market Size By Region Tabular Representation Diagrams PDF
The following chart shows the Application Interface Management Market Analysis by region , over a period of years. Presenting market viewpoint application programming interface governance api management market size by region tabular representation diagrams pdf to provide visual cues and insights. Share and navigate important information on one stages that need your due attention. This template can be used to pitch topics like api management market size by region tabular representation. In addtion, this PPT design contains high resolution images, graphics, etc, that are easily editable and available for immediate download.
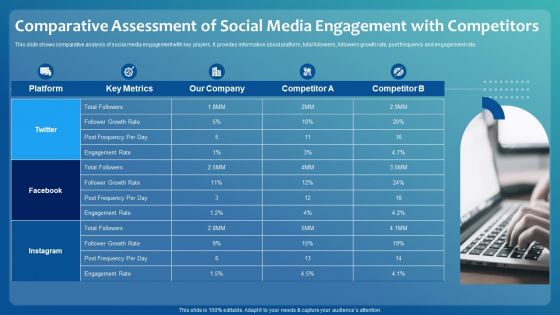
Comparative Assessment Of Social Media Engagement With Competitors Diagrams PDF
This slide shows comparative analysis of social media engagement with key players. It provides information about platform, total followers, followers growth rate, post frequency and engagement rate. Presenting Comparative Assessment Of Social Media Engagement With Competitors Diagrams PDF to provide visual cues and insights. Share and navigate important information on five stages that need your due attention. This template can be used to pitch topics like Growth Rate, Engagement Rate, Key Metrics. In addtion, this PPT design contains high resolution images, graphics, etc, that are easily editable and available for immediate download.

 Home
Home