Data Analysis Icon
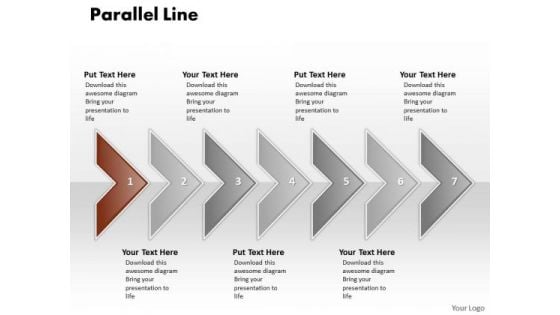
Ppt Correlated PowerPoint Graphics Arrows Parallel Line 7 Stage Templates
PPT correlated powerpoint graphics arrows parallel line 7 stage Templates-This Diagram is used to illustrate how information will move between interrelated systems in the accomplishment of a given function, task or process. The visual description of this information flow with each given level showing how data is fed into a given process step and subsequently passed along at the completion of that step.-PPT correlated powerpoint graphics arrows parallel line 7 stage Templates-Aim, Arrow, Badge, Border, Color, Connection, Curve, Design, Direction, Download, Icon, Illustration, Indicator, Internet, Label, Link, Magenta, Mark, Next, Object, Orientation, Paper, Peeling, Pointer, Rounded, Set, Shadow, Shape, Sign Analyse the effect of different factors. Our Ppt Correlated PowerPoint Graphics Arrows Parallel Line 7 Stage Templates will give them equal attention.
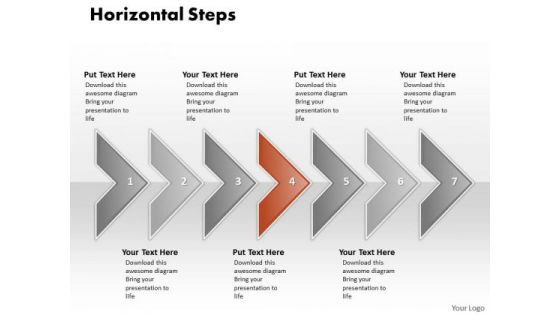
Ppt Correlated Shapes Arrows PowerPoint Horizontal Stages Templates
PPT correlated shapes arrows powerpoint horizontal stages Templates-This Diagram is used to illustrate how information will move between interrelated systems in the accomplishment of a given function, task or process. The visual description of this information flow with each given level showing how data is fed into a given process step and subsequently passed along at the completion of that step.-PPT correlated shapes arrows powerpoint horizontal stages Templates-Aim, Arrow, Badge, Border, Color, Connection, Curve, Design, Direction, Download, Icon, Illustration, Indicator, Internet, Label, Link, Magenta, Mark, Next, Object, Orientation, Paper, Peeling, Pointer, Rounded, Set, Shadow, Shape, Sign Enlist teams with our Ppt Correlated Shapes Arrows PowerPoint Horizontal Stages Templates. Download without worries with our money back guaranteee.
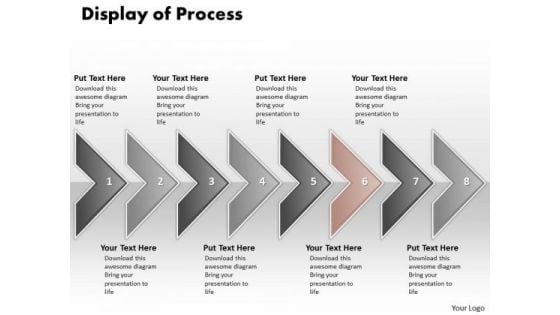
Ppt Display Of Marketing Process Using 8 Power Point Stage PowerPoint Templates
PPT display of marketing process using 8 power point stage PowerPoint Templates-This Diagram is used to illustrate how information will move between interrelated systems in the accomplishment of a given function, task or process. The visual description of this information flow with each given level showing how data is fed into a given process step and subsequently passed along at the completion of that step.-PPT display of marketing process using 8 power point stage PowerPoint Templates-Aim, Arrow, Badge, Border, Color, Connection, Curve, Design, Direction, Download, Icon, Illustration, Indicator, Internet, Label, Link, Magenta, Mark, Next, Object, Orientation, Paper, Peeling, Pointer, Rounded, Set, Shadow, Shape, Sign Solve problems with our Ppt Display Of Marketing Process Using 8 Power Point Stage PowerPoint Templates. Download without worries with our money back guaranteee.
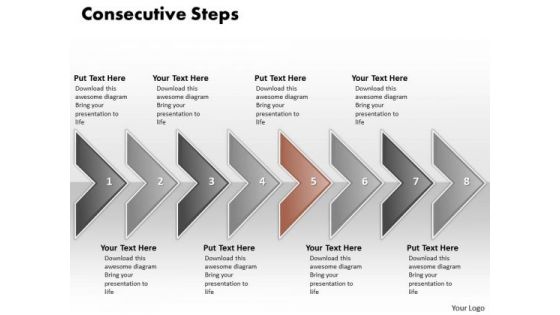
Ppt Eight Consecutive Practice The PowerPoint Macro Steps Of Marketing Process Templates
PPT eight consecutive practice the powerpoint macro steps of marketing process Templates-This Diagram is used to illustrate how information will move between interrelated systems in the accomplishment of a given function, task or process. The visual description of this information flow with each given level showing how data is fed into a given process step and subsequently passed along at the completion of that step.-PPT eight consecutive practice the powerpoint macro steps of marketing process Templates-Aim, Arrow, Badge, Border, Color, Connection, Curve, Design, Direction, Download, Icon, Illustration, Indicator, Internet, Label, Link, Magenta, Mark, Next, Object, Orientation, Paper, Peeling, Pointer, Rounded, Set, Shadow, Shape, Sign Let our Ppt Eight Consecutive Practice The PowerPoint Macro Steps Of Marketing Process Templates escort your thoughts. They will take them safely to their destination.
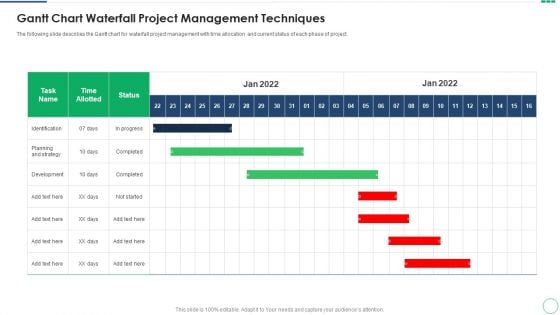
Gantt Chart Waterfall Project Management Techniques Topics PDF
The following slide describes the Gantt chart for waterfall project management with time allocation and current status of each phase of project. Your complex projects can be managed and organized simultaneously using this detailed Gantt Chart Waterfall Project Management Techniques Topics PDF template. Track the milestones, tasks, phases, activities, and subtasks to get an updated visual of your project. Share your planning horizon and release plan with this well crafted presentation template. This exemplary template can be used to plot various dependencies to distinguish the tasks in the pipeline and their impact on the schedules and deadlines of the project. Apart from this, you can also share this visual presentation with your team members and stakeholders. It a resourceful tool that can be incorporated into your business structure. Therefore, download and edit it conveniently to add the data and statistics as per your requirement.
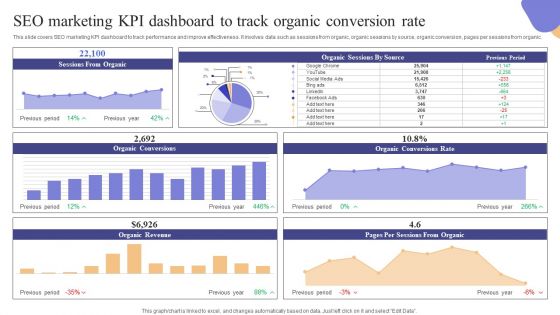
SEO Marketing KPI Dashboard To Track Organic Conversion Rate Microsoft PDF
This slide covers SEO marketing KPI dashboard to track performance and improve effectiveness. It involves data such as sessions from organic, organic sessions by source, organic conversion, pages per sessions from organic. Formulating a presentation can take up a lot of effort and time, so the content and message should always be the primary focus. The visuals of the PowerPoint can enhance the presenters message, so our SEO Marketing KPI Dashboard To Track Organic Conversion Rate Microsoft PDF was created to help save time. Instead of worrying about the design, the presenter can concentrate on the message while our designers work on creating the ideal templates for whatever situation is needed. Slidegeeks has experts for everything from amazing designs to valuable content, we have put everything into SEO Marketing KPI Dashboard To Track Organic Conversion Rate Microsoft PDF
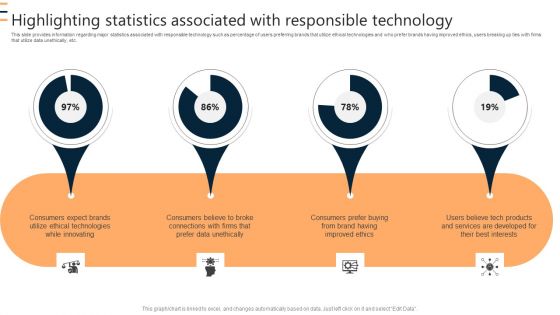
Highlighting Statistics Associated With Responsible Technology Ppt Inspiration Visuals PDF
This slide provides information regarding major statistics associated with responsible technology such as percentage of users preferring brands that utilize ethical technologies and who prefer brands having improved ethics, users breaking up ties with firms that utilize data unethically, etc. Formulating a presentation can take up a lot of effort and time, so the content and message should always be the primary focus. The visuals of the PowerPoint can enhance the presenters message, so our Highlighting Statistics Associated With Responsible Technology Ppt Inspiration Visuals PDF was created to help save time. Instead of worrying about the design, the presenter can concentrate on the message while our designers work on creating the ideal templates for whatever situation is needed. Slidegeeks has experts for everything from amazing designs to valuable content, we have put everything into Highlighting Statistics Associated With Responsible Technology Ppt Inspiration Visuals PDF.

Understanding Various Blockchain Interoperability Approaches BCT CD V

Raising Venture Capital A Holistic Approach For Startups Fin CD V
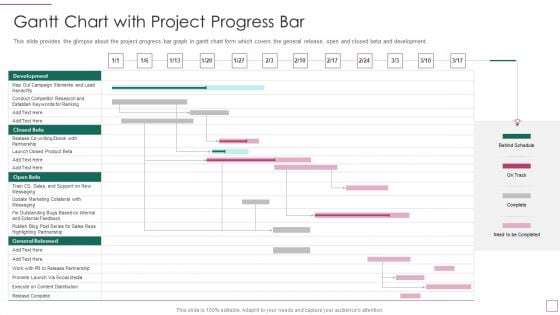
Approach Avoidance Conflict Gantt Chart With Project Progress Bar Topics PDF
This slide provides the glimpse about the project progress bar graph in gantt chart form which covers the general release, open and closed beta and development. Your complex projects can be managed and organized simultaneously using this detailed approach avoidance conflict gantt chart with project progress bar topics pdf template. Track the milestones, tasks, phases, activities, and subtasks to get an updated visual of your project. Share your planning horizon and release plan with this well crafted presentation template. This exemplary template can be used to plot various dependencies to distinguish the tasks in the pipeline and their impact on the schedules and deadlines of the project. Apart from this, you can also share this visual presentation with your team members and stakeholders. It a resourceful tool that can be incorporated into your business structure. Therefore, download and edit it conveniently to add the data and statistics as per your requirement.
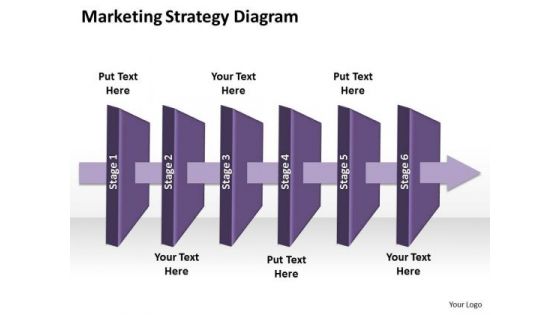
Ppt Continuous Process Social Presentation Startegy Diagram PowerPoint Templates
PPT continuous process social presentation startegy diagram PowerPoint Templates-This Diagram makes information accessible throughout the organization with a collective, visible view of critical data from different perspectives and providing the tools to upcoming business scenarios and plan for change. This image has been professionally designed to emphasize the concept of sequential process using layers represented through arrow. -PPT continuous process social presentation startegy diagram PowerPoint Templates-3d, Air, Arrow, Art, Business, Chart, Clip, Clipart, Cooling, Diagram, Drip, Drop, Dry, Energy, Eps10, Evaporate, Evaporating, Evaporation, Graphic, Heat, Icon, Illustration, Isolated, Isometric, Layers, Material, Moisture, Process Break out of the cocoon with our Ppt Continuous Process Social Presentation Startegy Diagram PowerPoint Templates. Let your thoughts take to the air.
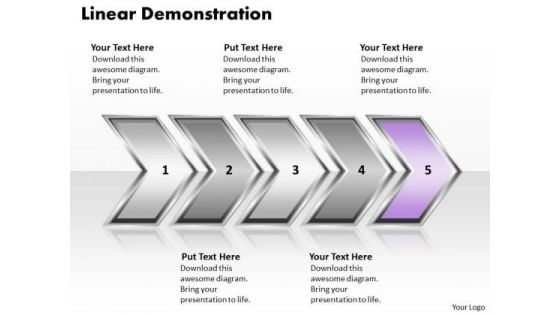
Ppt Linear Demonstration Of Process Using PowerPoint Graphics Arrows Templates
PPT linear demonstration of process using powerpoint graphics arrows Templates-This Diagram makes information accessible throughout the organization with a collective, visible view of critical data from different perspectives and providing the tools to upcoming business scenarios and plan for change. This image has been professionally designed to emphasize the concept of sequential process using curved arrows. It represents the Fifth arrow using purple color.-PPT linear demonstration of process using powerpoint graphics arrows Templates-Aim, Arrow, Arrowheads, Badge, Border, Click, Connection, Curve, Design, Direction, Download, Element, Fuchsia, Icon, Illustration, Indicator, Internet, Magenta, Mark, Object, Orientation, Pointer, Shadow, Shape, Sign Court the audience with our Ppt Linear Demonstration Of Process Using PowerPoint Graphics Arrows Templates. They will certainly be bowled over by you.
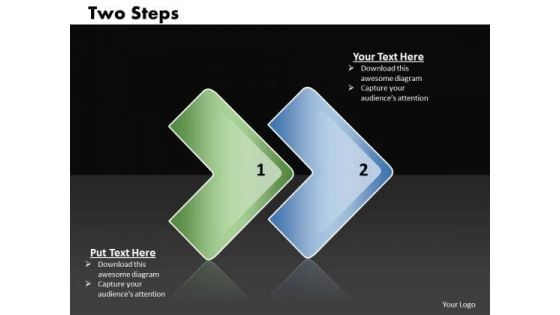
Ppt Linear Way To Represent 2 Practice The PowerPoint Macro Steps Templates
PPT linear way to represent 2 practice the powerpoint macro steps Templates-This Diagram makes information accessible throughout the organization with a collective, visible view of critical data from different perspectives and providing the tools to upcoming business scenarios and plan for change. This image has been professionally designed to emphasize the concept of sequential process using vertical arrows.-PPT linear way to represent 2 practice the powerpoint macro steps Templates-Aim, Arrow, Arrowheads, Badge, Border, Click, Connection, Curve, Design, Direction, Download, Element, Fuchsia, Icon, Illustration, Indicator, Internet, Magenta, Mark, Object, Orientation, Pointer, Shadow, Shape, Sign Our Ppt Linear Way To Represent 2 Practice The PowerPoint Macro Steps Templates are exceptionally customer-centric. They put clients before everything else.
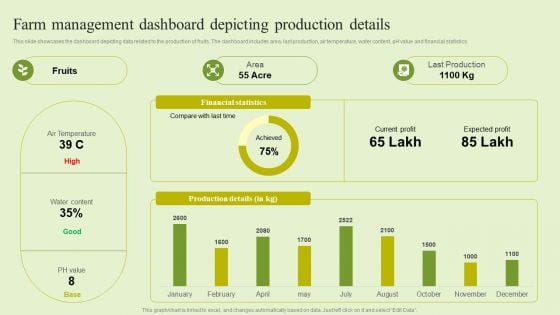
Agriculture Marketing Strategy To Improve Revenue Performance Farm Management Dashboard Depicting Production Themes PDF
This slide showcases the dashboard depicting data related to the production of fruits. The dashboard includes area, last production, air temperature, water content, pH value and financial statistics. Coming up with a presentation necessitates that the majority of the effort goes into the content and the message you intend to convey. The visuals of a PowerPoint presentation can only be effective if it supplements and supports the story that is being told. Keeping this in mind our experts created Agriculture Marketing Strategy To Improve Revenue Performance Farm Management Dashboard Depicting Production Themes PDF to reduce the time that goes into designing the presentation. This way, you can concentrate on the message while our designers take care of providing you with the right template for the situation.
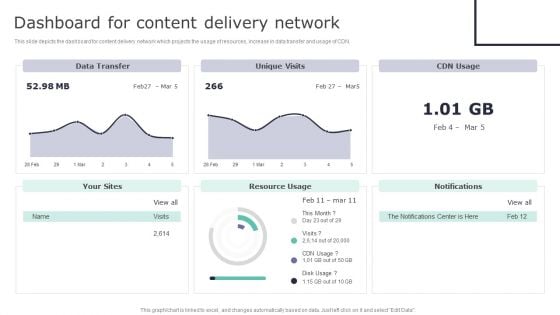
Deploying Content Distribution Network System Dashboard For Content Delivery Network Mockup PDF
This slide depicts the dashboard for content delivery network which projects the usage of resources, increase in data transfer and usage of CDN. Find highly impressive Deploying Content Distribution Network System Dashboard For Content Delivery Network Mockup PDF on Slidegeeks to deliver a meaningful presentation. You can save an ample amount of time using these presentation templates. No need to worry to prepare everything from scratch because Slidegeeks experts have already done a huge research and work for you. You need to download Deploying Content Distribution Network System Dashboard For Content Delivery Network Mockup PDF for your upcoming presentation. All the presentation templates are 100 percent editable and you can change the color and personalize the content accordingly. Download now
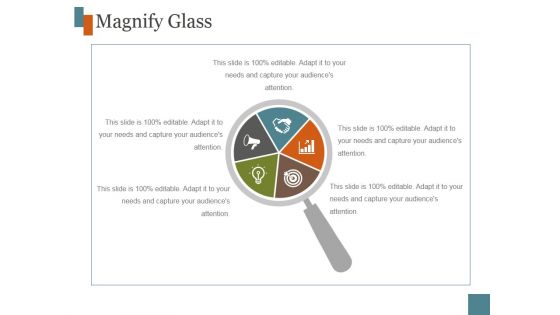
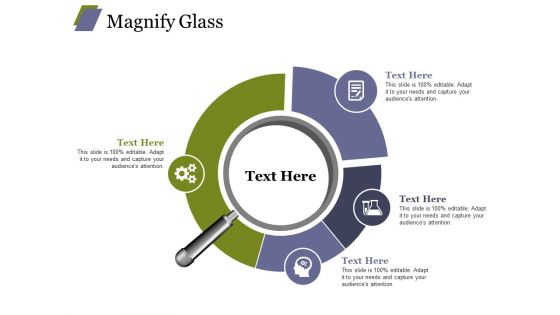
Magnify Glass Ppt PowerPoint Presentation Visuals
This is a magnify glass ppt powerpoint presentation visuals. This is a five stage process. The stages in this process are management, magnifying, glass, icons, business.
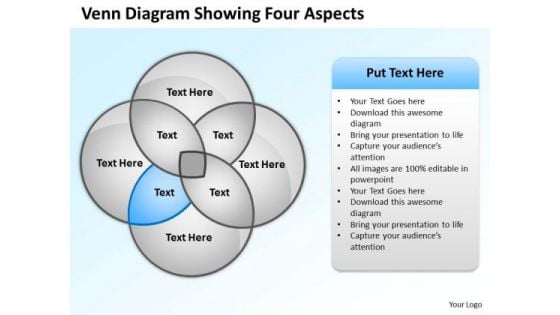
Business Organizational Chart Template Venn Diagram Showing Four Aspects PowerPoint Slides
We present our business organizational chart template venn diagram showing four aspects PowerPoint Slides.Use our Ring Charts PowerPoint Templates because Your audience will believe you are the cats whiskers. Download our Circle Charts PowerPoint Templates because You are well armed with penetrative ideas. Our PowerPoint Templates and Slides will provide the gunpowder you need. Download and present our Process and Flows PowerPoint Templates because They will Put your wonderful verbal artistry on display. Our PowerPoint Templates and Slides will provide you the necessary glam and glitter. Download and present our Flow Charts PowerPoint Templates because Our PowerPoint Templates and Slides help you meet the demand of the Market. Just browse and pick the slides that appeal to your intuitive senses. Download our Business PowerPoint Templates because Our PowerPoint Templates and Slides will let you Illuminate the road ahead to Pinpoint the important landmarks along the way.Use these PowerPoint slides for presentations relating to Business, button, catalog, chart, circle, company, cross, data, design, diagram, direction, document, financial, four, glossy, goals, graph, junction, management, market, marketing, model, multicolored, multiple, navigation, network, options, plan, presentation, process, purple, results, shiny, sphere, statistics. The prominent colors used in the PowerPoint template are Blue light, White, Gray. People tell us our business organizational chart template venn diagram showing four aspects PowerPoint Slides are effectively colour coded to prioritise your plans They automatically highlight the sequence of events you desire. PowerPoint presentation experts tell us our data PowerPoint templates and PPT Slides will impress their bosses and teams. Presenters tell us our business organizational chart template venn diagram showing four aspects PowerPoint Slides will generate and maintain the level of interest you desire. They will create the impression you want to imprint on your audience. Use our data PowerPoint templates and PPT Slides are effectively colour coded to prioritise your plans They automatically highlight the sequence of events you desire. Customers tell us our business organizational chart template venn diagram showing four aspects PowerPoint Slides are specially created by a professional team with vast experience. They diligently strive to come up with the right vehicle for your brilliant Ideas. People tell us our chart PowerPoint templates and PPT Slides are incredible easy to use. Make instructive presentations with our Business Organizational Chart Template Venn Diagram Showing Four Aspects PowerPoint Slides. Dont waste time struggling with PowerPoint. Let us do it for you.
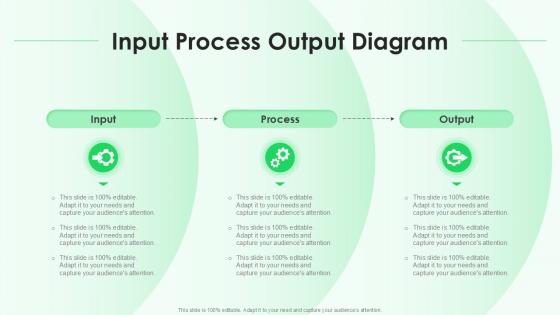
Input Process Output Diagram Sample Of Ppt Presentation
This Input Process Output Diagram Sample Of Ppt Presentation is perfect for any presentation, be it in front of clients or colleagues. It is a versatile and stylish solution for organizing your meetings. The XXXXXXXXXXXXXXXXXXXXXXXXXXXX features a modern design for your presentation meetings. The adjustable and customizable slides provide unlimited possibilities for acing up your presentation. Slidegeeks has done all the homework before launching the product for you. So, do not wait, grab the presentation templates today The Input Process Output Diagram sample PowerPoint presentation offers a clear and concise way to represent workflows, processes, and systems. This diagram effectively breaks down complex operations into three stages input, which represents resources or data process, which details how tasks or transformations occur and output, which highlights results or outcomes. Ideal for a variety of professional contexts, this visual tool helps audiences easily understand and follow the flow of information, making it a valuable addition to any impactful presentation.
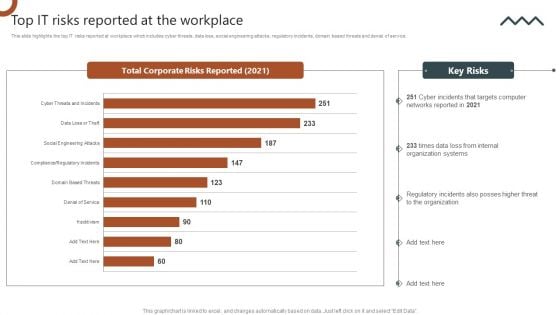
Organizations Risk Management And IT Security Top IT Risks Reported At The Workplace Brochure PDF
This slide highlights the top IT risks reported at workplace which includes cyber threats, data loss, social engineering attacks, regulatory incidents, domain based threats and denial of service. Slidegeeks has constructed Organizations Risk Management And IT Security Top IT Risks Reported At The Workplace Brochure PDF after conducting extensive research and examination. These presentation templates are constantly being generated and modified based on user preferences and critiques from editors. Here, you will find the most attractive templates for a range of purposes while taking into account ratings and remarks from users regarding the content. This is an excellent jumping off point to explore our content and will give new users an insight into our top notch PowerPoint Templates.
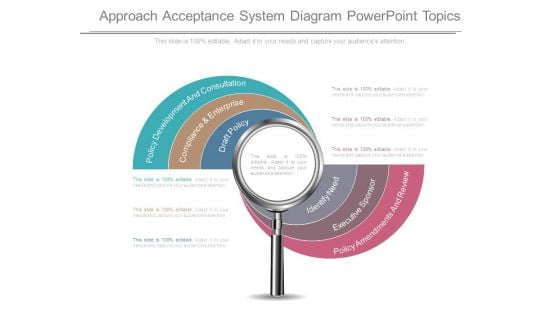
Approach Acceptance System Diagram Powerpoint Topics
This is a approach acceptance system diagram powerpoint topics. This is a six stage process. The stages in this process are policy development and consultation, compliance and enterprise, draft policy, identify need, executive sponsor, policy amendments and review.
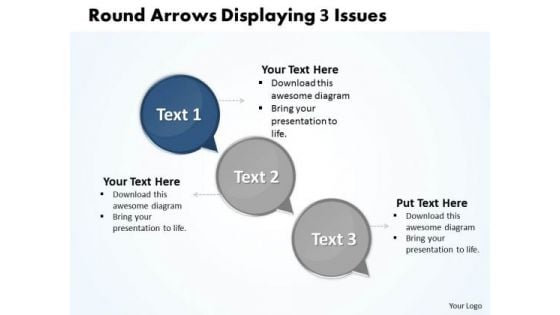
Ppt Circle Curved Arrows PowerPoint 2010 Showing 3 Issues Templates
PPT circle curved arrows powerpoint 2010 showing 3 issues Templates-This Diagram makes information accessible throughout the organization with a collective, visible view of critical data from different perspectives and providing the tools to upcoming business scenarios and plan for change. This compelling graphics can be used to show relations and interfaces among various marketing activities. -PPT circle curved arrows powerpoint 2010 showing 3 issues Templates-Add, Aqua, Arrows, Badges, Bar, Blend, Blue, Bright, Bubbles, Buttons, Caution, Circle, Drop, Elements, Glossy, Glowing, Graphic, Heart, Help, Icons, Idea, Illustration, Navigation, Oblong, Plus, Round, Service, Shadow, Shiny, Sign, Speech, Squares Take your cause forward with passion. Our Ppt Circle Curved Arrows PowerPoint 2010 Showing 3 Issues Templates will espouse your thoughts.
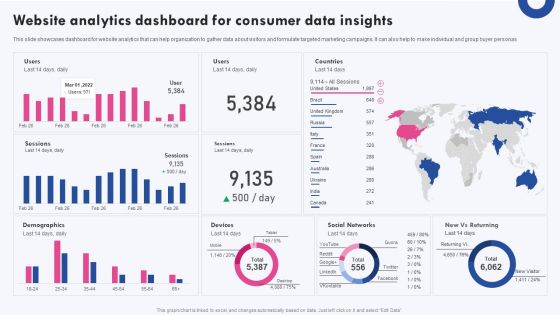
Targeted Marketing Campaigns To Improve Buyers Experience Website Analytics Dashboard For Consumer Infographics PDF
This slide showcases dashboard for website analytics that can help organization to gather data about visitors and formulate targeted marketing campaigns. It can also help to make individual and group buyer personas This modern and well arranged Targeted Marketing Campaigns To Improve Buyers Experience Website Analytics Dashboard For Consumer Infographics PDF provides lots of creative possibilities. It is very simple to customize and edit with the Powerpoint Software. Just drag and drop your pictures into the shapes. All facets of this template can be edited with Powerpoint no extra software is necessary. Add your own material, put your images in the places assigned for them, adjust the colors, and then you can show your slides to the world, with an animated slide included.
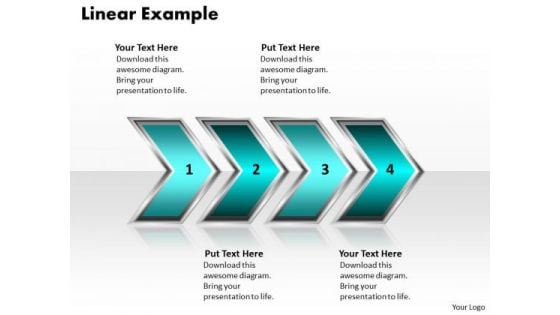
Ppt Linear Example Of Process Using 4 Stages PowerPoint Templates
PPT linear example of process using 4 stages PowerPoint Templates-This PowerPoint Diagram shows you the 3d Sequential Demonstration to explain Internet Marketing. It consists of Seven Layers explaining fourth here. Use this diagram as a method of graphically representing the flow of data as an information processing system. This is a good resource also for Marketing PowerPoint Diagrams or Business Backgrounds for PowerPoint or business presentation PowerPoint Diagram to master your strategic thinking.-PPT linear example of process using 4 stages PowerPoint Templates-Aim, Arrow, Arrowheads, Badge, Border, Click, Connection, Curve, Design, Direction, Download, Element, Fuchsia, Icon, Illustration, Indicator, Internet, Magenta, Mark, Object, Orientation, Pointer, Shadow, Shape, Sign List your strategy succinctly with our Ppt Linear Example Of Process Using 4 Stages PowerPoint Templates. You will be at the top of your game.
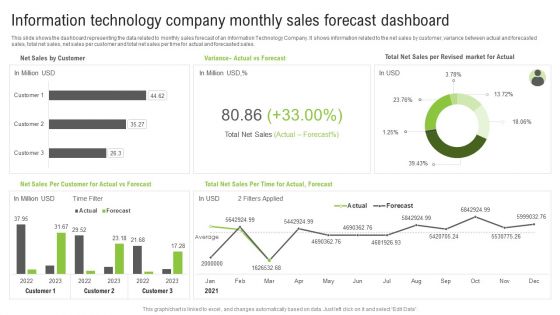
Information Technology Company Monthly Sales Forecast Dashboard Ppt Portfolio Images PDF
This slide shows the dashboard representing the data related to monthly sales forecast of an Information Technology Company. It shows information related to the net sales by customer, variance between actual and forecasted sales, total net sales, net sales per customer and total net sales per time for actual and forecasted sales. Pitch your topic with ease and precision using this Information Technology Company Monthly Sales Forecast Dashboard Ppt Portfolio Images PDF. This layout presents information on Total Net Sales, Actual vs Forecast, Net Sales Customer. It is also available for immediate download and adjustment. So, changes can be made in the color, design, graphics or any other component to create a unique layout.
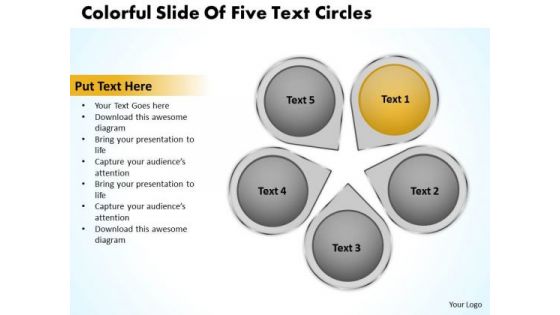
How To Draw Business Process Diagram Circles PowerPoint Templates Backgrounds For Slides
We present our how to draw business process diagram circles PowerPoint templates backgrounds for slides.Present our Circle Charts PowerPoint Templates because You are an avid believer in ethical practices. Highlight the benefits that accrue with our PowerPoint Templates and Slides. Download and present our Ring Charts PowerPoint Templates because Our PowerPoint Templates and Slides will generate and maintain the level of interest you desire. They will create the impression you want to imprint on your audience. Present our Marketing PowerPoint Templates because It is Aesthetically crafted by artistic young minds. Our PowerPoint Templates and Slides are designed to display your dexterity. Use our Business PowerPoint Templates because Our PowerPoint Templates and Slides are aesthetically designed to attract attention. We gaurantee that they will grab all the eyeballs you need. Download and present our Flow Charts PowerPoint Templates because Our PowerPoint Templates and Slides will let you Illuminate the road ahead to Pinpoint the important landmarks along the way.Use these PowerPoint slides for presentations relating to Boxes, business, button, catalog, chart, circle, company, cross, data, design, diagram, direction, document, financial, four, glossy, goals, graph, junction, management, market, marketing, model, multicolored, multiple, navigation, network, options, plan, presentation, process, purple, results, shiny, sphere, statistics. The prominent colors used in the PowerPoint template are Yellow, Gray, White. Professionals tell us our how to draw business process diagram circles PowerPoint templates backgrounds for slides are specially created by a professional team with vast experience. They diligently strive to come up with the right vehicle for your brilliant Ideas. Presenters tell us our data PowerPoint templates and PPT Slides are specially created by a professional team with vast experience. They diligently strive to come up with the right vehicle for your brilliant Ideas. The feedback we get is that our how to draw business process diagram circles PowerPoint templates backgrounds for slides provide you with a vast range of viable options. Select the appropriate ones and just fill in your text. Use our cross PowerPoint templates and PPT Slides are the best it can get when it comes to presenting. You can be sure our how to draw business process diagram circles PowerPoint templates backgrounds for slides will generate and maintain the level of interest you desire. They will create the impression you want to imprint on your audience. Customers tell us our data PowerPoint templates and PPT Slides are second to none. Our How To Draw Business Process Diagram Circles PowerPoint Templates Backgrounds For Slides don't fiddle about. They get into action right away.
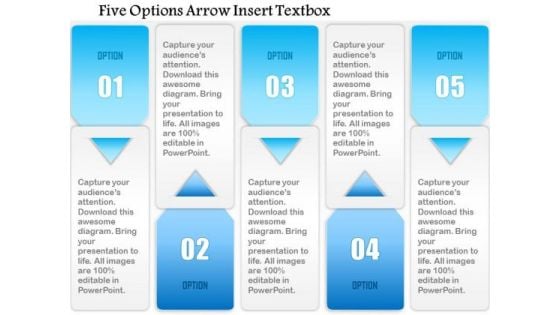
Business Diagram Five Options Arrow Insert Textbox Presentation Template
This PowerPoint template displays textbox diagram. This business diagram contains five points textboxes. Use this diagram, in your presentations to display timeline, strategy, icons and business analysis. Create professional presentations using this professional slide.
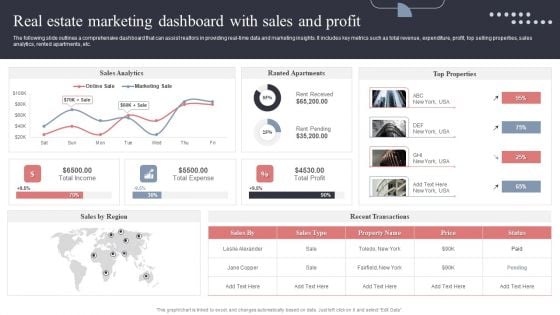
Real Estate Marketing Dashboard With Sales And Profit Formats PDF
The following slide outlines a comprehensive dashboard that can assist realtors in providing real-time data and marketing insights. It includes key metrics such as total revenue, expenditure, profit, top selling properties, sales analytics, rented apartments, etc. This modern and well-arranged Real Estate Marketing Dashboard With Sales And Profit Formats PDF provides lots of creative possibilities. It is very simple to customize and edit with the Powerpoint Software. Just drag and drop your pictures into the shapes. All facets of this template can be edited with Powerpoint, no extra software is necessary. Add your own material, put your images in the places assigned for them, adjust the colors, and then you can show your slides to the world, with an animated slide included.
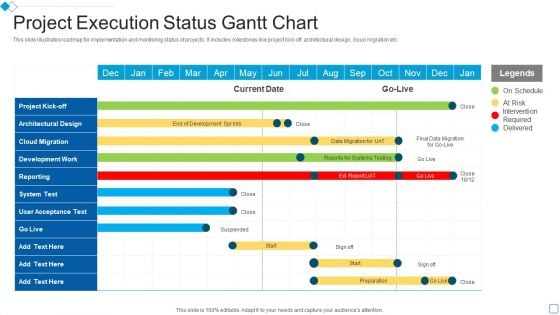
Project Execution Status Gantt Chart Slides PDF
This slide illustrates roadmap for implementation and monitoring status of projects. It includes milestones like project kick off, architectural design, cloud migration etc.Your complex projects can be managed and organized simultaneously using this detailed Project Execution Status Gantt Chart Slides PDF template. Track the milestones, tasks, phases, activities, and subtasks to get an updated visual of your project. Share your planning horizon and release plan with this well crafted presentation template. This exemplary template can be used to plot various dependencies to distinguish the tasks in the pipeline and their impact on the schedules and deadlines of the project. Apart from this, you can also share this visual presentation with your team members and stakeholders. It a resourceful tool that can be incorporated into your business structure. Therefore, download and edit it conveniently to add the data and statistics as per your requirement
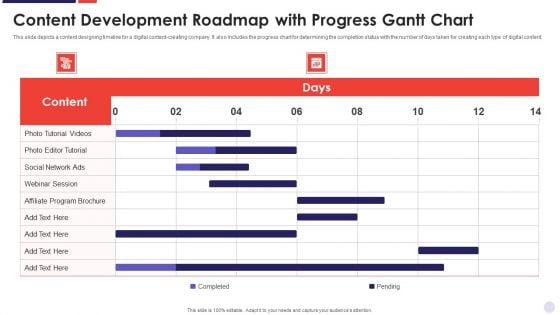
Content Development Roadmap With Progress Gantt Chart Summary PDF
Your complex projects can be managed and organized simultaneously using this detailed Content Development Roadmap With Progress Gantt Chart Summary PDF template. Track the milestones, tasks, phases, activities, and subtasks to get an updated visual of your project. Share your planning horizon and release plan with this well crafted presentation template. This exemplary template can be used to plot various dependencies to distinguish the tasks in the pipeline and their impact on the schedules and deadlines of the project. Apart from this, you can also share this visual presentation with your team members and stakeholders. It a resourceful tool that can be incorporated into your business structure. Therefore, download and edit it conveniently to add the data and statistics as per your requirement.

Definitive Guide On Mass Advertising Techniques For Business Development Complete Deck
This Definitive Guide On Mass Advertising Techniques For Business Development Complete Deck is designed to help you retain your audiences attention. This content-ready PowerPoint Template enables you to take your audience on a journey and share information in a way that is easier to recall. It helps you highlight the crucial parts of your work so that the audience does not get saddled with information download. This sixty five slide PPT Deck comes prepared with the graphs and charts you could need to showcase your information through visuals. You only need to enter your own data in them. Download this editable PowerPoint Theme and walk into that meeting with confidence. Our Definitive Guide On Mass Advertising Techniques For Business Development Complete Deck are topically designed to provide an attractive backdrop to any subject. Use them to look like a presentation pro.

Assessing Corporate Financial Techniques To Boost Profits Ppt Powerpoint Presentation Complete Deck
This Assessing Corporate Financial Techniques To Boost Profits Ppt Powerpoint Presentation Complete Deck is designed to help you retain your audiences attention. This content-ready PowerPoint Template enables you to take your audience on a journey and share information in a way that is easier to recall. It helps you highlight the crucial parts of your work so that the audience does not get saddled with information download. This sixty nine slide PPT Deck comes prepared with the graphs and charts you could need to showcase your information through visuals. You only need to enter your own data in them. Download this editable PowerPoint Theme and walk into that meeting with confidence. Our Assessing Corporate Financial Techniques To Boost Profits Ppt Powerpoint Presentation Complete Deck are topically designed to provide an attractive backdrop to any subject. Use them to look like a presentation pro.
Online Payment Techniques For Providing Services To Global Audience Complete Deck

Key Driver Analytics Templates 1 Ppt PowerPoint Presentation Ideas
This is a key driver analytics templates 1 ppt powerpoint presentation ideas. This is a four stage process. The stages in this process are business, icons marketing, analysis, strategy, success.
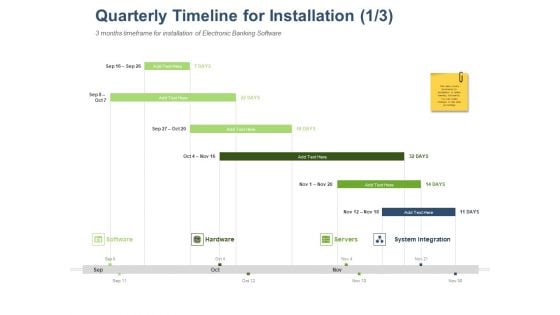
Online Banking Administration Procedure Quarterly Timeline For Installation Ppt Infographic Template Deck PDF
Manage your complex projects and organize them simultaneously with this detailed Gantt Chart PowerPoint Template. Track your milestones, tasks, phases, activities, subtasks amongst other constituents that will give you an updated visual of your project. Reflect your planning horizon and capture your release plan in one view with this Gantt Chart PowerPoint presentation template. You can plot various dependencies directly on this Timeline PowerPoint Presentation Layout to see which tasks are still in the pipeline and how the delays in them are impacting the schedules and deadlines of the project. Apart from this, you can also share this updated visual with your team members and stakeholders, thus making it a resourceful tool to be incorporated in your business structure. Not only this but also the editable layout of this slide helps you to add your data and statistics at your convenience.
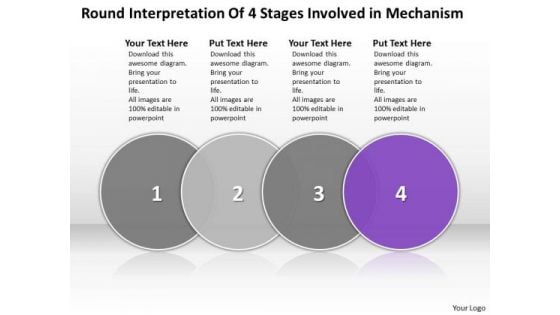
Ppt Evaluation Of Four Stages Involved Mechanism PowerPoint Templates
PPT evaluation of four stages involved mechanism PowerPoint Templates-Use this Amazing PowerPoint Diagram to explain the circular Procedure involved in an Activity. It demonstrates annular, circulate, circling, dislike, indirect, oblique, orbicular, ring-shaped, round, rounded, spheroid. You can change color, size and orientation of any icon to your liking. -PPT evaluation of four stages involved mechanism PowerPoint Templates-3, Advice, Analysis, Analyze, Answer, Area, Career, Chart, Choice, Circles, Concept, Determination, Diagram, Graph, Idea, Illustration, Intersect, Measurement, Opportunities, Options, Overlap, Overlapped, Overlapping, Passion, Passionate, Prioritize, Priority, Profession Be productive with our Ppt Evaluation Of Four Stages Involved Mechanism PowerPoint Templates. You will come out on top.
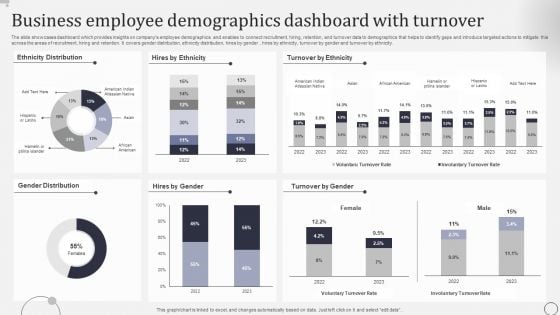
Business Employee Demographics Dashboard With Turnover Graphics PDF
The slide showcases dashboard which provides insights on companys employee demographics and enables to connect recruitment, hiring, retention, and turnover data to demographics that helps to identify gaps and introduce targeted actions to mitigate this across the areas of recruitment, hiring and retention. It covers gender distribution, ethnicity distribution, hires by gender , hires by ethnicity, turnover by gender and turnover by ethnicity. Showcasing this set of slides titled Business Employee Demographics Dashboard With Turnover Graphics PDF The topics addressed in these templates are Ethnicity Distribution, Turnover Ethnicity, Gender Distribution. All the content presented in this PPT design is completely editable. Download it and make adjustments in color, background, font etc. as per your unique business setting.

Ppt Colorful PowerPoint Graphics Arrows Describing Seven Aspects Templates
PPT colorful powerpoint graphics arrows describing seven aspects Templates-Use this PowerPoint Diagram to represent the layers of Linear Process model Graphically. It shows the fifth stage in an animated manner through an Arrow. You can change color, size and orientation of any icon to your liking.-PPT colorful powerpoint graphics arrows describing seven aspects Templates-analysis, arrow, background, business, chart, communication, concept, construction, delivery, design, development, engineering, fabrication, feasibiliti, generated, growth, idea, industry, making, production, products, science, sequence, shape Corporate battles can be fierce. Be appropriately armed with our Ppt Colorful PowerPoint Graphics Arrows Describing Seven Aspects Templates.
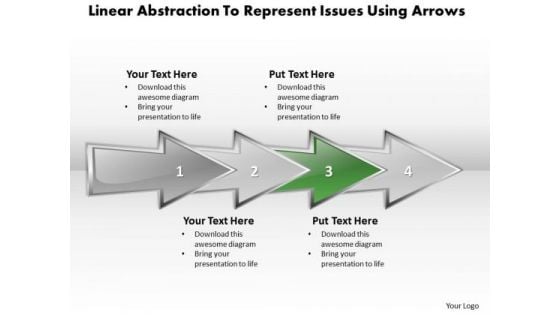
Ppt Linear Abstraction To Represent Key Issues Business PowerPoint Templates
PPT linear abstraction to represent key issues Business PowerPoint Templates-Use this Horizontally placed Curved arrows illustrating the Business Process. This image has been professionally designed to emphasize the concept of continuous process using three rectangular arrows. You can change color, size and orientation of any icon to your liking.-PPT linear abstraction to represent key issues Business PowerPoint Templates-analysis, arrow, background, business, chart, communication, concept, construction, delivery, design, development, engineering, fabrication, feasibiliti, generated, growth, idea, industry, making, production, products, science, sequence, shape Exhort your team with our Ppt Linear Abstraction To Represent Key Issues Business PowerPoint Templates. Urge them on to go one better.

Understanding Investment Banking Framework Functions And More Fin CD V
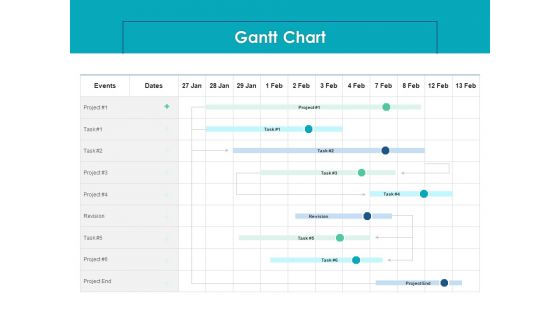
Housing Mortgage Proposal Gantt Chart Ppt Pictures Brochure PDF
Your complex projects can be managed and organized simultaneously using this detailed housing mortgage proposal gantt chart ppt pictures brochure pdf template. Track the milestones, tasks, phases, activities, and subtasks to get an updated visual of your project. Share your planning horizon and release plan with this well crafted presentation template. This exemplary template can be used to plot various dependencies to distinguish the tasks in the pipeline and their impact on the schedules and deadlines of the project. Apart from this, you can also share this visual presentation with your team members and stakeholders. It a resourceful tool that can be incorporated into your business structure. Therefore, download and edit it conveniently to add the data and statistics as per your requirement.
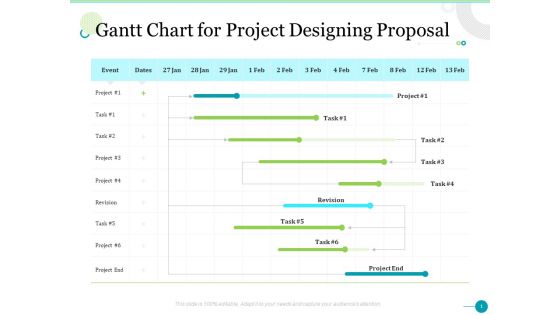
Gantt Chart For Project Designing Proposal Ppt Inspiration Pictures PDF
Your complex projects can be managed and organized simultaneously using this detailed gantt chart for project designing proposal ppt inspiration pictures pdf template. Track the milestones, tasks, phases, activities, and subtasks to get an updated visual of your project. Share your planning horizon and release plan with this well crafted presentation template. This exemplary template can be used to plot various dependencies to distinguish the tasks in the pipeline and their impact on the schedules and deadlines of the project. Apart from this, you can also share this visual presentation with your team members and stakeholders. It a resourceful tool that can be incorporated into your business structure. Therefore, download and edit it conveniently to add the data and statistics as per your requirement.
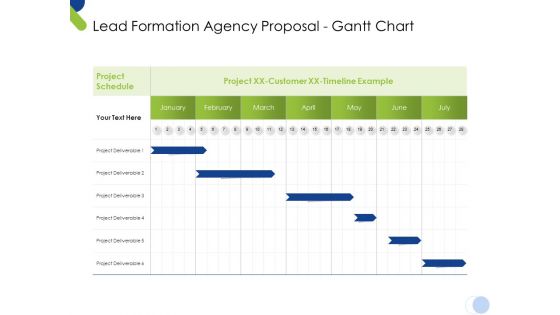
Lead Formation Agency Proposal Gantt Chart Ppt Summary Infographics PDF
Your complex projects can be managed and organized simultaneously using this detailed lead formation agency proposal gantt chart ppt summary infographics pdf template. Track the milestones, tasks, phases, activities, and subtasks to get an updated visual of your project. Share your planning horizon and release plan with this well crafted presentation template. This exemplary template can be used to plot various dependencies to distinguish the tasks in the pipeline and their impact on the schedules and deadlines of the project. Apart from this, you can also share this visual presentation with your team members and stakeholders. It a resourceful tool that can be incorporated into your business structure. Therefore, download and edit it conveniently to add the data and statistics as per your requirement.
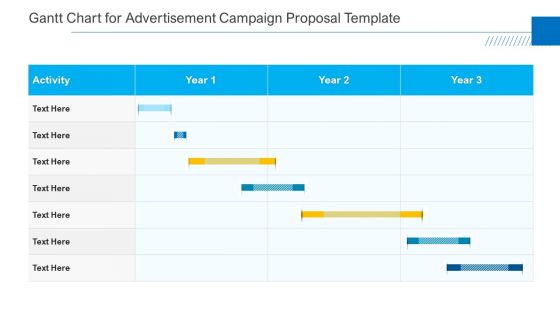
Gantt Chart For Advertisement Campaign Proposal Template Summary PDF
Your complex projects can be managed and organized simultaneously using this detailed gantt chart for advertisement campaign proposal template summary pdf template. Track the milestones, tasks, phases, activities, and subtasks to get an updated visual of your project. Share your planning horizon and release plan with this well crafted presentation template. This exemplary template can be used to plot various dependencies to distinguish the tasks in the pipeline and their impact on the schedules and deadlines of the project. Apart from this, you can also share this visual presentation with your team members and stakeholders. It a resourceful tool that can be incorporated into your business structure. Therefore, download and edit it conveniently to add the data and statistics as per your requirement.

Gantt Chart For Better Project Problem Administration Ideas PDF
Your complex projects can be managed and organized simultaneously using this detailed gantt chart for better project problem administration ideas pdf template. Track the milestones, tasks, phases, activities, and subtasks to get an updated visual of your project. Share your planning horizon and release plan with this well crafted presentation template. This exemplary template can be used to plot various dependencies to distinguish the tasks in the pipeline and their impact on the schedules and deadlines of the project. Apart from this, you can also share this visual presentation with your team members and stakeholders. It a resourceful tool that can be incorporated into your business structure. Therefore, download and edit it conveniently to add the data and statistics as per your requirement.
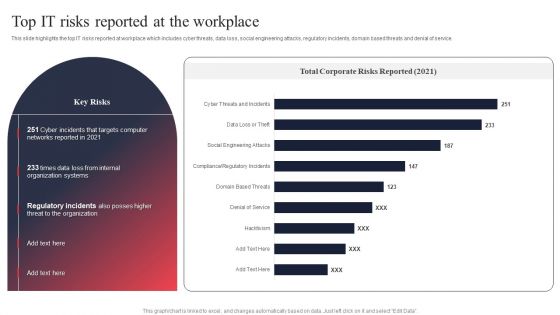
IT System Risk Management Guide Top IT Risks Reported At The Workplace Infographics PDF
This slide highlights the top IT risks reported at workplace which includes cyber threats, data loss, social engineering attacks, regulatory incidents, domain based threats and denial of service. Do you have to make sure that everyone on your team knows about any specific topic I yes, then you should give IT System Risk Management Guide Top IT Risks Reported At The Workplace Infographics PDF a try. Our experts have put a lot of knowledge and effort into creating this impeccable IT System Risk Management Guide Top IT Risks Reported At The Workplace Infographics PDF. You can use this template for your upcoming presentations, as the slides are perfect to represent even the tiniest detail. You can download these templates from the Slidegeeks website and these are easy to edit. So grab these today.
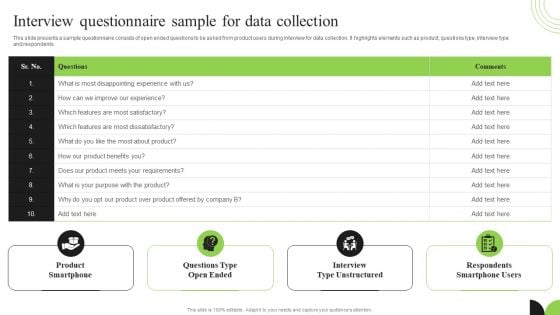
Guidebook For Executing Business Market Intelligence Interview Questionnaire Sample Themes PDF
This slide presents a sample questionnaire consists of open ended questions to be asked from product users during interview for data collection. It highlights elements such as product, questions type, interview type and respondents. Presenting this PowerPoint presentation, titled Guidebook For Executing Business Market Intelligence Interview Questionnaire Sample Themes PDF, with topics curated by our researchers after extensive research. This editable presentation is available for immediate download and provides attractive features when used. Download now and captivate your audience. Presenting this Guidebook For Executing Business Market Intelligence Interview Questionnaire Sample Themes PDF. Our researchers have carefully researched and created these slides with all aspects taken into consideration. This is a completely customizable Guidebook For Executing Business Market Intelligence Interview Questionnaire Sample Themes PDF that is available for immediate downloading. Download now and make an impact on your audience. Highlight the attractive features available with our PPTs.
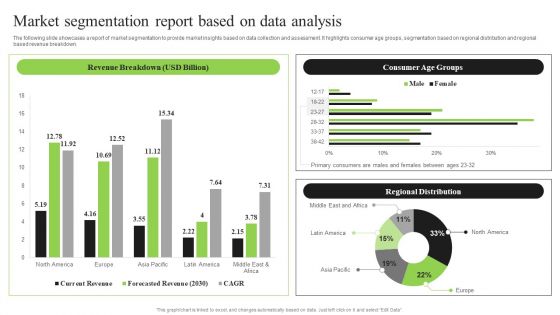
Guidebook For Executing Business Market Intelligence Market Segmentation Report Rules PDF
The following slide showcases a report of market segmentation to provide market insights based on data collection and assessment. It highlights consumer age groups, segmentation based on regional distribution and regional based revenue breakdown. Slidegeeks is one of the best resources for PowerPoint templates. You can download easily and regulate Guidebook For Executing Business Market Intelligence Market Segmentation Report Rules PDF for your personal presentations from our wonderful collection. A few clicks is all it takes to discover and get the most relevant and appropriate templates. Use our Templates to add a unique zing and appeal to your presentation and meetings. All the slides are easy to edit and you can use them even for advertisement purposes.
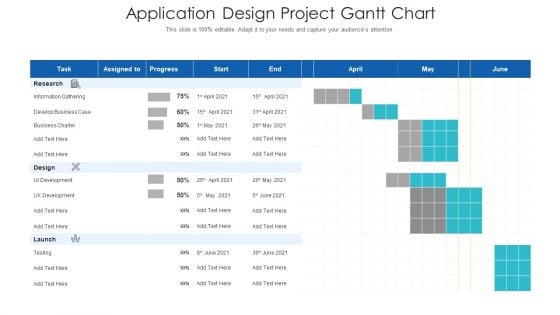
Application Design Project Gantt Chart Diagrams PDF
Your complex projects can be managed and organized simultaneously using this detailed application design project gantt chart diagrams pdf template. Track the milestones, tasks, phases, activities, and subtasks to get an updated visual of your project. Share your planning horizon and release plan with this well crafted presentation template. This exemplary template can be used to plot various dependencies to distinguish the tasks in the pipeline and their impact on the schedules and deadlines of the project. Apart from this, you can also share this visual presentation with your team members and stakeholders. It a resourceful tool that can be incorporated into your business structure. Therefore, download and edit it conveniently to add the data and statistics as per your requirement.
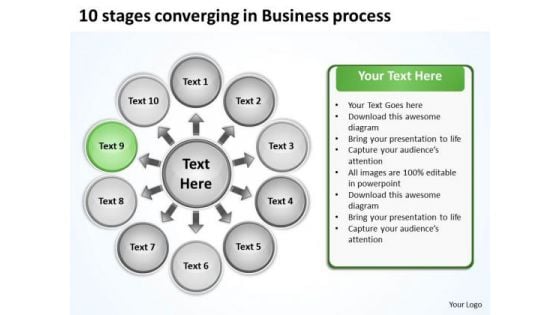
10 Stages Converging Business PowerPoint Theme Process Radial Chart Slides
We present our 10 stages converging business powerpoint theme process Radial Chart Slides.Use our Arrows PowerPoint Templates because they help to lay the base of your trend of thought. Use our Flow charts PowerPoint Templates because this template with an image of helps you chart the course of your presentation. Download and present our Business PowerPoint Templates because the majestic tiger lord of all it surveys.It exudes power even when it is in repose. Present our Process and Flows PowerPoint Templates because you can Take your team along by explaining your plans. Present our Circle charts PowerPoint Templates because it is the time to bond with family, friends, colleagues and any other group of your choice.Use these PowerPoint slides for presentations relating to Business, chart, circle, colors, concept, corporate, cycle, data, design, detail, development, diagram, engineering, graphic, ideas, illustration, image, implement, implementation, life, lifecycle, management, model, objects, organization, plan, process, product, professional, project, quality, schema, shape, stack, stage, steps, strategy, structure, success, symbol. The prominent colors used in the PowerPoint template are Yellow, Black, Gray. You can be sure our 10 stages converging business powerpoint theme process Radial Chart Slides are Luxuriant. Presenters tell us our corporate PowerPoint templates and PPT Slides are effectively colour coded to prioritise your plans They automatically highlight the sequence of events you desire. We assure you our 10 stages converging business powerpoint theme process Radial Chart Slides are Efficient. Customers tell us our data PowerPoint templates and PPT Slides are One-of-a-kind. Presenters tell us our 10 stages converging business powerpoint theme process Radial Chart Slides are Stunning. You can be sure our cycle PowerPoint templates and PPT Slides are Lush. Get rid of the blues with our 10 Stages Converging Business PowerPoint Theme Process Radial Chart Slides. Let hope and happiness flow into your mind.
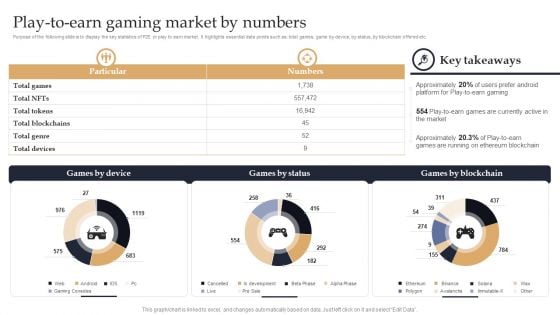
Web 3 0 Blockchain Based P2E Mobile Game Sector Report Promotional Plan Play To Earn Gaming Market By Numbers Summary PDF
Purpose of the following slide is to display the key statistics of P2E or play to earn market. It highlights essential data points such as total games, game by device, by status, by blockchain offered etc. Coming up with a presentation necessitates that the majority of the effort goes into the content and the message you intend to convey. The visuals of a PowerPoint presentation can only be effective if it supplements and supports the story that is being told. Keeping this in mind our experts created Web 3 0 Blockchain Based P2E Mobile Game Sector Report Promotional Plan Play To Earn Gaming Market By Numbers Summary PDF to reduce the time that goes into designing the presentation. This way, you can concentrate on the message while our designers take care of providing you with the right template for the situation.
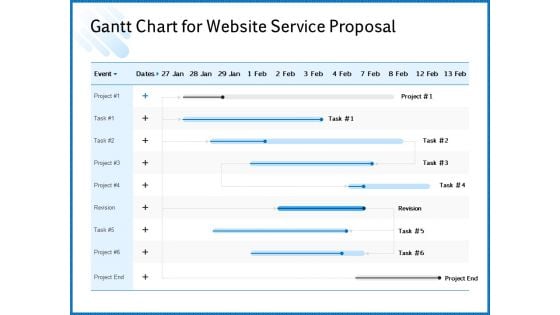
Web Design Template Gantt Chart For Website Service Proposal Formats PDF
Your complex projects can be managed and organized simultaneously using this detailed web design template gantt chart for website service proposal formats pdf template. Track the milestones, tasks, phases, activities, and subtasks to get an updated visual of your project. Share your planning horizon and release plan with this well crafted presentation template. This exemplary template can be used to plot various dependencies to distinguish the tasks in the pipeline and their impact on the schedules and deadlines of the project. Apart from this, you can also share this visual presentation with your team members and stakeholders. It a resourceful tool that can be incorporated into your business structure. Therefore, download and edit it conveniently to add the data and statistics as per your requirement.
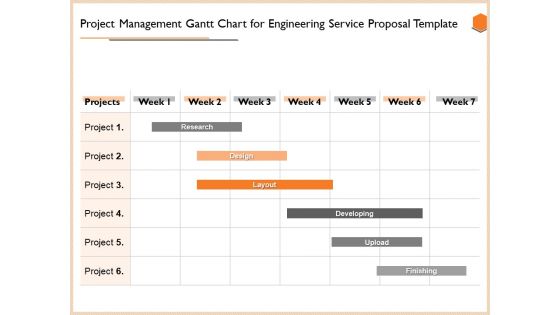
Project Management Gantt Chart For Engineering Service Proposal Template Graphics PDF
Your complex projects can be managed and organized simultaneously using this detailed project management gantt chart for engineering service proposal template graphics pdf template. Track the milestones, tasks, phases, activities, and subtasks to get an updated visual of your project. Share your planning horizon and release plan with this well crafted presentation template. This exemplary template can be used to plot various dependencies to distinguish the tasks in the pipeline and their impact on the schedules and deadlines of the project. Apart from this, you can also share this visual presentation with your team members and stakeholders. It a resourceful tool that can be incorporated into your business structure. Therefore, download and edit it conveniently to add the data and statistics as per your requirement.
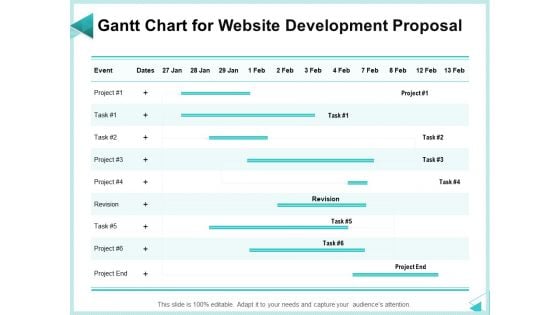
Web Development IT And Design Templates Gantt Chart For Website Development Proposal Demonstration PDF
Your complex projects can be managed and organized simultaneously using this detailed web development it and design templates gantt chart for website development proposal demonstration pdf template. Track the milestones, tasks, phases, activities, and subtasks to get an updated visual of your project. Share your planning horizon and release plan with this well crafted presentation template. This exemplary template can be used to plot various dependencies to distinguish the tasks in the pipeline and their impact on the schedules and deadlines of the project. Apart from this, you can also share this visual presentation with your team members and stakeholders. It a resourceful tool that can be incorporated into your business structure. Therefore, download and edit it conveniently to add the data and statistics as per your requirement.
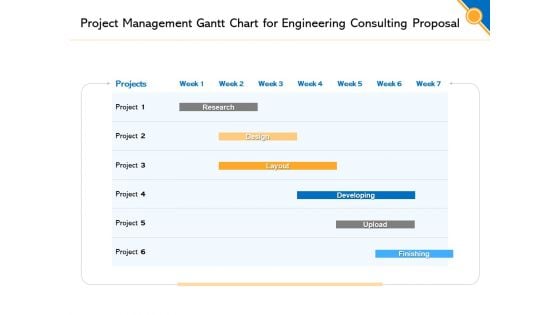
Civil Construction Project Management Gantt Chart For Engineering Consulting Proposal Introduction PDF
Your complex projects can be managed and organized simultaneously using this detailed civil construction project management gantt chart for engineering consulting proposal introduction pdf template. Track the milestones, tasks, phases, activities, and subtasks to get an updated visual of your project. Share your planning horizon and release plan with this well crafted presentation template. This exemplary template can be used to plot various dependencies to distinguish the tasks in the pipeline and their impact on the schedules and deadlines of the project. Apart from this, you can also share this visual presentation with your team members and stakeholders. It a resourceful tool that can be incorporated into your business structure. Therefore, download and edit it conveniently to add the data and statistics as per your requirement.
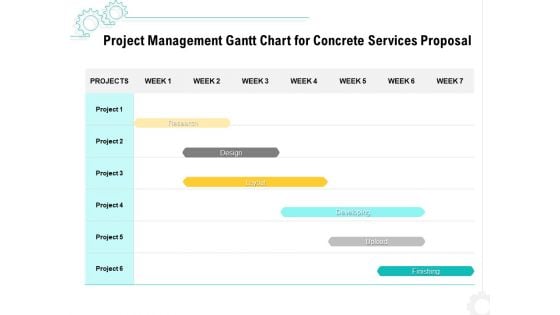
Construction Material Service Project Management Gantt Chart For Concrete Services Proposal Professional PDF
Your complex projects can be managed and organized simultaneously using this detailed construction material service project management gantt chart for concrete services proposal professional pdf template. Track the milestones, tasks, phases, activities, and subtasks to get an updated visual of your project. Share your planning horizon and release plan with this well crafted presentation template. This exemplary template can be used to plot various dependencies to distinguish the tasks in the pipeline and their impact on the schedules and deadlines of the project. Apart from this, you can also share this visual presentation with your team members and stakeholders. It a resourceful tool that can be incorporated into your business structure. Therefore, download and edit it conveniently to add the data and statistics as per your requirement.
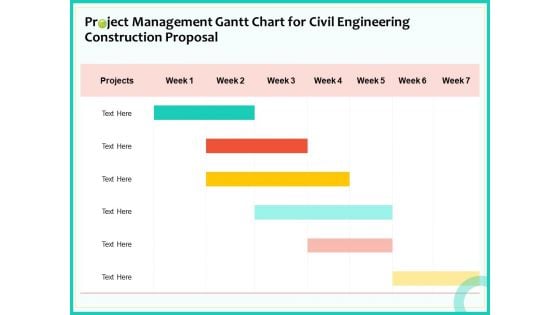
Civil Engineering Consulting Services Project Management Gantt Chart For Civil Engineering Construction Proposal Formats PDF
Your complex projects can be managed and organized simultaneously using this detailed civil engineering consulting services project management gantt chart for civil engineering construction proposal formats pdf template. Track the milestones, tasks, phases, activities, and subtasks to get an updated visual of your project. Share your planning horizon and release plan with this well crafted presentation template. This exemplary template can be used to plot various dependencies to distinguish the tasks in the pipeline and their impact on the schedules and deadlines of the project. Apart from this, you can also share this visual presentation with your team members and stakeholders. It a resourceful tool that can be incorporated into your business structure. Therefore, download and edit it conveniently to add the data and statistics as per your requirement.
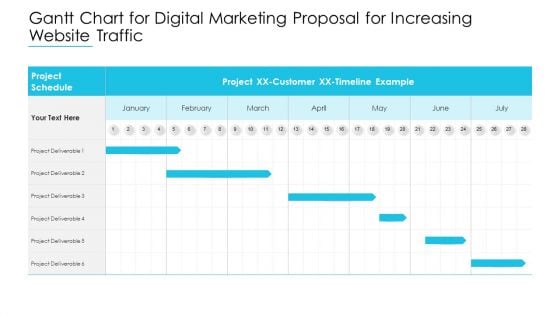
Gantt Chart For Digital Marketing Proposal For Increasing Website Traffic Summary PDF
Your complex projects can be managed and organized simultaneously using this detailed gantt chart for digital marketing proposal for increasing website traffic summary pdf template. Track the milestones, tasks, phases, activities, and subtasks to get an updated visual of your project. Share your planning horizon and release plan with this well crafted presentation template. This exemplary template can be used to plot various dependencies to distinguish the tasks in the pipeline and their impact on the schedules and deadlines of the project. Apart from this, you can also share this visual presentation with your team members and stakeholders. It a resourceful tool that can be incorporated into your business structure. Therefore, download and edit it conveniently to add the data and statistics as per your requirement.
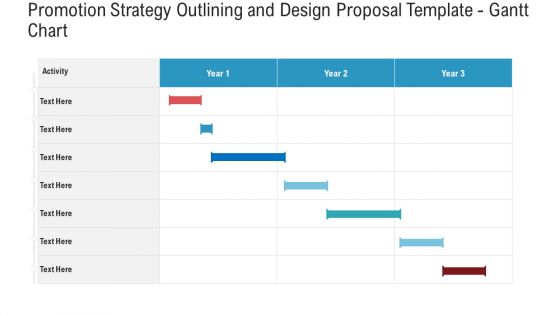
Promotion Strategy Outlining And Design Proposal Template Gantt Chart Clipart PDF
Your complex projects can be managed and organized simultaneously using this detailed promotion strategy outlining and design proposal template gantt chart clipart pdf template. Track the milestones, tasks, phases, activities, and subtasks to get an updated visual of your project. Share your planning horizon and release plan with this well crafted presentation template. This exemplary template can be used to plot various dependencies to distinguish the tasks in the pipeline and their impact on the schedules and deadlines of the project. Apart from this, you can also share this visual presentation with your team members and stakeholders. It a resourceful tool that can be incorporated into your business structure. Therefore, download and edit it conveniently to add the data and statistics as per your requirement.
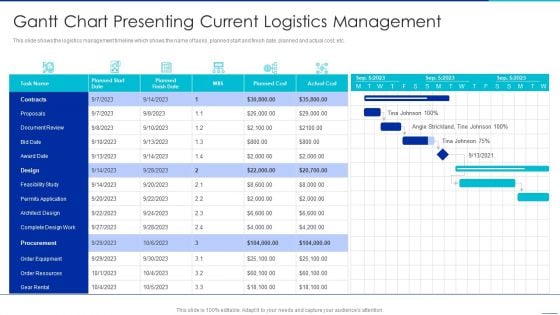
Optimizing Logistics Management Process Gantt Chart Presenting Current Logistics Management Clipart PDF
This slide shows the logistics management timeline which shows the name of tasks, planned start and finish date, planned and actual cost, etc. Your complex projects can be managed and organized simultaneously using this detailed optimizing logistics management process gantt chart presenting current logistics management clipart pdf template. Track the milestones, tasks, phases, activities, and subtasks to get an updated visual of your project. Share your planning horizon and release plan with this well crafted presentation template. This exemplary template can be used to plot various dependencies to distinguish the tasks in the pipeline and their impact on the schedules and deadlines of the project. Apart from this, you can also share this visual presentation with your team members and stakeholders. It a resourceful tool that can be incorporated into your business structure. Therefore, download and edit it conveniently to add the data and statistics as per your requirement.

Interoperability Software Testing Plan Phase Of PDCA Cycle Microsoft PDF
This slide depicts the planning phase of the PDCA cycle in which the main focus of the test condition should be on the flow of data through all of the applications. Welcome to our selection of the Interoperability Software Testing Plan Phase Of PDCA Cycle Microsoft PDF. These are designed to help you showcase your creativity and bring your sphere to life. Planning and Innovation are essential for any business that is just starting out. This collection contains the designs that you need for your everyday presentations. All of our PowerPoints are 100 percent editable, so you can customize them to suit your needs. This multi purpose template can be used in various situations. Grab these presentation templates today.
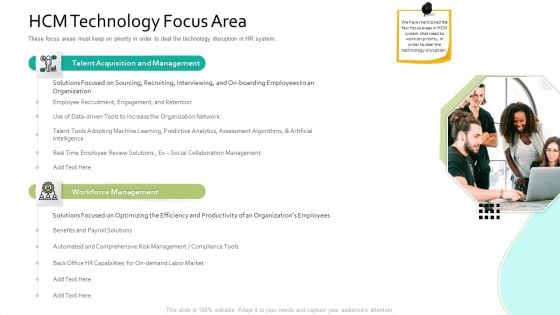
HCM Technology Focus Area Human Resource Information System For Organizational Effectiveness Sample PDF
Your complex projects can be managed and organized simultaneously using this detailed Hcm Technology Focus Area Human Resource Information System For Organizational Effectiveness Sample Pdf template. Track the milestones, tasks, phases, activities, and subtasks to get an updated visual of your project. Share your planning horizon and release plan with this well crafted presentation template. This exemplary template can be used to plot various dependencies to distinguish the tasks in the pipeline and their impact on the schedules and deadlines of the project. Apart from this, you can also share this visual presentation with your team members and stakeholders. It a resourceful tool that can be incorporated into your business structure. Therefore, download and edit it conveniently to add the data and statistics as per your requirement.
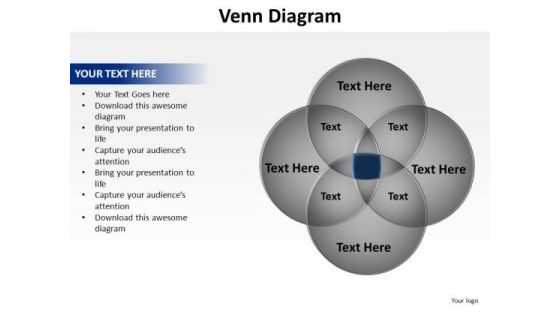
PowerPoint Layout Graphic Venn Diagram Ppt Template
PowerPoint Layout Graphic Venn Diagram PPT Template Business Power Points-The Venn graphic comprising interlinking circles geometrically demonstrate how various functions operating independently, to a large extent, are essentially interdependent. Amplify on this basic corporate concept and forefront the benefits of overlapping processes to arrive at common goals.-These amazing PowerPoint pre-designed slides and PowerPoint templates have been carefully created by our team of experts to help you impress your audience. Our stunning collection of Powerpoint slides are 100% editable and can easily fit in any PowerPoint presentations. By using these animations and graphics in PowerPoint and you can easily make professional presentations. Any text can be entered at any point in the PowerPoint template or slide. Just DOWNLOAD our awesome PowerPoint templates and you are ready to go. Put up the facts and figures on our PowerPoint Layout Graphic Venn Diagram Ppt Template. Display the data for everyone's consumption.
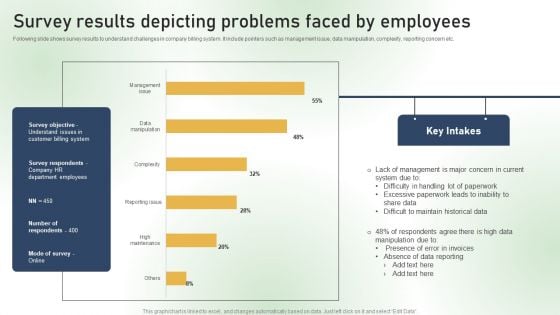
Survey Results Depicting Problems Faced By Employees Ppt PowerPoint Presentation File Styles PDF
Following slide shows survey results to understand challenges in company billing system. It include pointers such as management issue, data manipulation, complexity, reporting concern etc. Do you have to make sure that everyone on your team knows about any specific topic I yes, then you should give Survey Results Depicting Problems Faced By Employees Ppt PowerPoint Presentation File Styles PDF a try. Our experts have put a lot of knowledge and effort into creating this impeccable Survey Results Depicting Problems Faced By Employees Ppt PowerPoint Presentation File Styles PDF. You can use this template for your upcoming presentations, as the slides are perfect to represent even the tiniest detail. You can download these templates from the Slidegeeks website and these are easy to edit. So grab these today.
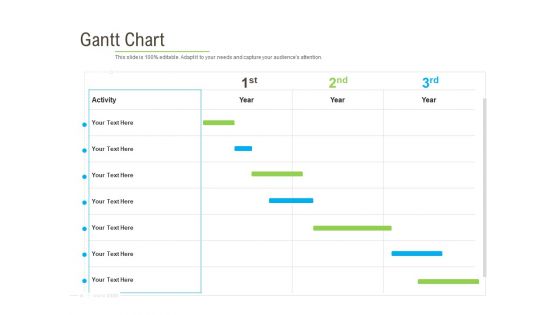
Rapid Innovation In HR Technology Space Gantt Chart Graphics PDF
Your complex projects can be managed and organized simultaneously using this detailed rapid innovation in hr technology space gantt chart graphics pdf template. Track the milestones, tasks, phases, activities, and subtasks to get an updated visual of your project. Share your planning horizon and release plan with this well crafted presentation template. This exemplary template can be used to plot various dependencies to distinguish the tasks in the pipeline and their impact on the schedules and deadlines of the project. Apart from this, you can also share this visual presentation with your team members and stakeholders. It a resourceful tool that can be incorporated into your business structure. Therefore, download and edit it conveniently to add the data and statistics as per your requirement.
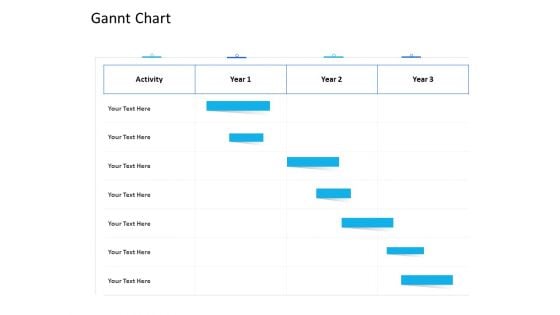
Organization Manpower Management Technology Gannt Chart Infographics PDF
Your complex projects can be managed and organized simultaneously using this detailed organization manpower management technology gannt chart infographics pdf template. Track the milestones, tasks, phases, activities, and subtasks to get an updated visual of your project. Share your planning horizon and release plan with this well crafted presentation template. This exemplary template can be used to plot various dependencies to distinguish the tasks in the pipeline and their impact on the schedules and deadlines of the project. Apart from this, you can also share this visual presentation with your team members and stakeholders. It a resourceful tool that can be incorporated into your business structure. Therefore, download and edit it conveniently to add the data and statistics as per your requirement.
Magnify Glass Ppt PowerPoint Presentation Show Themes
This is a magnify glass ppt powerpoint presentation show themes. This is a four stage process. The stages in this process are magnifier glass, research, business, marketing, focus.
Magnifying Glass Ppt PowerPoint Presentation Summary Themes
This is a magnifying glass ppt powerpoint presentation summary themes. This is a four stage process. The stages in this process are magnifier glass, research, business, marketing, focus.
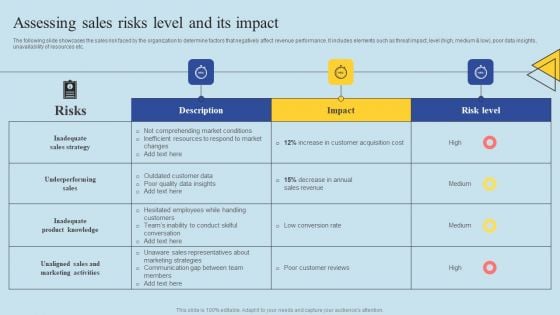
Determining Risks In Sales Administration Procedure Assessing Sales Risks Level And Its Impact Themes PDF
The following slide showcases the sales risk faced by the organization to determine factors that negatively affect revenue performance. It includes elements such as threat impact, level high, medium and low, poor data insights, unavailability of resources etc. Are you in need of a template that can accommodate all of your creative concepts This one is crafted professionally and can be altered to fit any style. Use it with Google Slides or PowerPoint. Include striking photographs, symbols, depictions, and other visuals. Fill, move around, or remove text boxes as desired. Test out color palettes and font mixtures. Edit and save your work, or work with colleagues. Download Determining Risks In Sales Administration Procedure Assessing Sales Risks Level And Its Impact Themes PDF and observe how to make your presentation outstanding. Give an impeccable presentation to your group and make your presentation unforgettable.
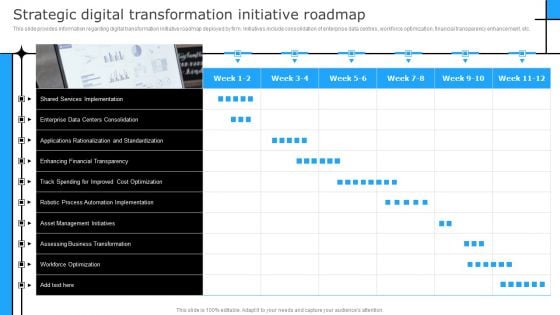
Successful Corporate Technique Enhancing Firms Performance Strategic Digital Transformation Infographics PDF
This slide provides information regarding digital transformation initiative roadmap deployed by firm. Initiatives include consolidation of enterprise data centres, workforce optimization, financial transparency enhancement, etc. Whether you have daily or monthly meetings, a brilliant presentation is necessary. Successful Corporate Technique Enhancing Firms Performance Strategic Digital Transformation Infographics PDF can be your best option for delivering a presentation. Represent everything in detail using Successful Corporate Technique Enhancing Firms Performance Strategic Digital Transformation Infographics PDF and make yourself stand out in meetings. The template is versatile and follows a structure that will cater to your requirements. All the templates prepared by Slidegeeks are easy to download and edit. Our research experts have taken care of the corporate themes as well. So, give it a try and see the results.
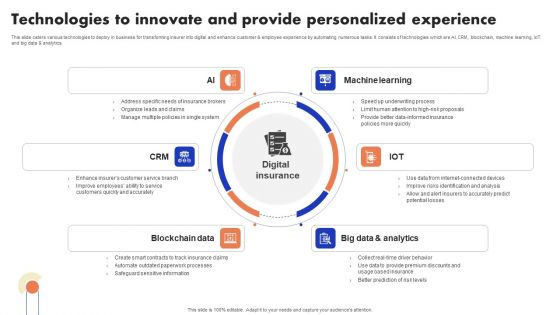
Implementation Of Digital Advancement Techniques Technologies To Innovate And Provide Portrait PDF
This slide caters various technologies to deploy in business for transforming insurer into digital and enhance customer and employee experience by automating numerous tasks. It consists of technologies which are AI, CRM, blockchain, machine learning, IoT and big data and analytics. Retrieve professionally designed Implementation Of Digital Advancement Techniques Technologies To Innovate And Provide Portrait PDF to effectively convey your message and captivate your listeners. Save time by selecting pre made slideshows that are appropriate for various topics, from business to educational purposes. These themes come in many different styles, from creative to corporate, and all of them are easily adjustable and can be edited quickly. Access them as PowerPoint templates or as Google Slides themes. You do not have to go on a hunt for the perfect presentation because Slidegeeks got you covered from everywhere.

Smart Wireless Sensor Networks Dashboard For Spectrum Consumption In Cognitive Radio Professional PDF
This slide depicts the dashboard for spectrum consumption in cognitive radio by covering an overview of the types of data that spectrum contains, spectrum results, user reputation, and locations. Get a simple yet stunning designed Smart Wireless Sensor Networks Dashboard For Spectrum Consumption In Cognitive Radio Professional PDF. It is the best one to establish the tone in your meetings. It is an excellent way to make your presentations highly effective. So, download this PPT today from Slidegeeks and see the positive impacts. Our easy-to-edit Smart Wireless Sensor Networks Dashboard For Spectrum Consumption In Cognitive Radio Professional PDF can be your go-to option for all upcoming conferences and meetings. So, what are you waiting for Grab this template today.
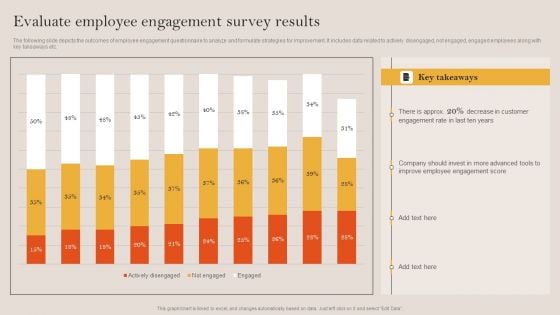
Tactical Employee Engagement Action Planning Evaluate Employee Engagement Survey Results Brochure PDF
The following slide depicts the outcomes of employee engagement questionnaire to analyze and formulate strategies for improvement. It includes data related to actively disengaged, not engaged, engaged employees along with key takeaways etc. Here you can discover an assortment of the finest PowerPoint and Google Slides templates. With these templates, you can create presentations for a variety of purposes while simultaneously providing your audience with an eye catching visual experience. Download Tactical Employee Engagement Action Planning Evaluate Employee Engagement Survey Results Brochure PDF to deliver an impeccable presentation. These templates will make your job of preparing presentations much quicker, yet still, maintain a high level of quality. Slidegeeks has experienced researchers who prepare these templates and write high quality content for you. Later on, you can personalize the content by editing the Tactical Employee Engagement Action Planning Evaluate Employee Engagement Survey Results Brochure PDF.
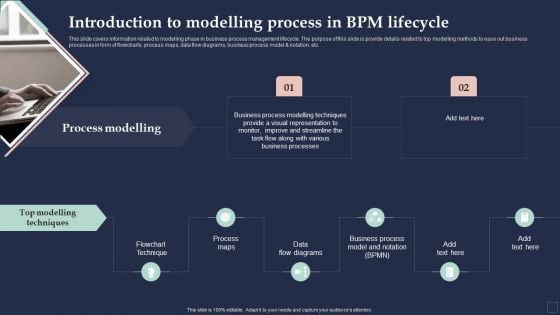
BPM System Methodology Introduction To Modelling Process In BPM Lifecycle Demonstration PDF
This slide covers information related to modelling phase in business process management lifecycle. The purpose of this slide is provide details related to top modelling methods to ease out business processes in form of flowcharts, process maps, data flow diagrams, business process model and notation, etc. Do you know about Slidesgeeks BPM System Methodology Introduction To Modelling Process In BPM Lifecycle Demonstration PDF These are perfect for delivering any kind od presentation. Using it, create PowerPoint presentations that communicate your ideas and engage audiences. Save time and effort by using our pre-designed presentation templates that are perfect for a wide range of topic. Our vast selection of designs covers a range of styles, from creative to business, and are all highly customizable and easy to edit. Download as a PowerPoint template or use them as Google Slides themes.
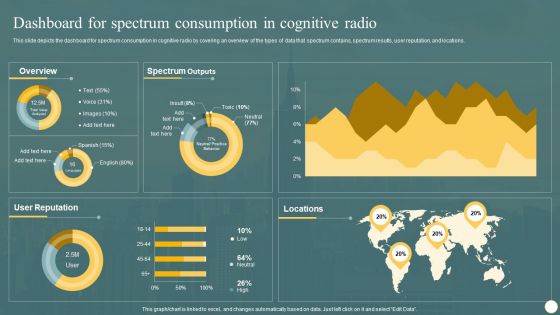
Cognitive Radio Network IT Dashboard For Spectrum Consumption In Cognitive Radio Graphics PDF
This slide depicts the dashboard for spectrum consumption in cognitive radio by covering an overview of the types of data that spectrum contains, spectrum results, user reputation, and locations. Slidegeeks is one of the best resources for PowerPoint templates. You can download easily and regulate Cognitive Radio Network IT Dashboard For Spectrum Consumption In Cognitive Radio Graphics PDF for your personal presentations from our wonderful collection. A few clicks is all it takes to discover and get the most relevant and appropriate templates. Use our Templates to add a unique zing and appeal to your presentation and meetings. All the slides are easy to edit and you can use them even for advertisement purposes.
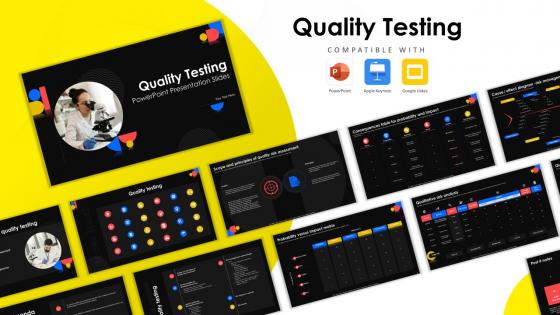
Quality Testing Powerpoint Presentation Slides
Use this meticulously designed PPT deck to make the data presentation and understanding easy for the audience. It is an ideal option for your presentation as it covers all the critical elements of the concept and design. Bring your best foot forward and show your presentation skills with this expertly-designed Quality Testing Powerpoint Presentation Slides. Take the help of this PowerPoint Set to deliver a neat, professional presentation and win the applause of viewers. Customize the images, text, format, colors, and theme of any and every template of this presentation deck using the help manual come along. Get hold of this PPT bundle from the link below. Explore our expertly designed Quality Testing template, which follows a risk-based approach to quality management crucial in the pharmaceutical industry to ensure customer health and safety. This deck covers key aspects of quality risk management, including assessment, control, communication, and review. It also highlights various risk assessment tools, stakeholder risk tolerance, and a future risk tracker. Additionally, our QRM PowerPoint details risk assessment and control processes, such as identification, analysis, evaluation, reduction, and acceptance. It features methodologies like risk ranking, fault tree analysis, and hazard operability analysis. Get this comprehensive template today.
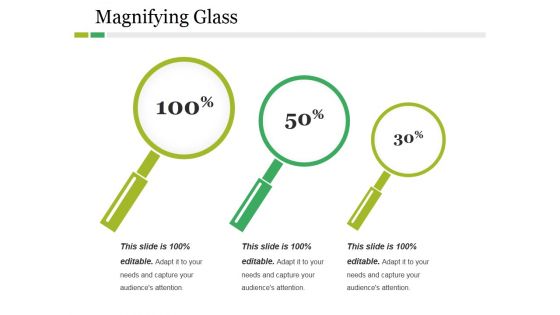
Magnifying Glass Ppt PowerPoint Presentation Diagram Ppt
This is a magnifying glass ppt powerpoint presentation diagram ppt. This is a three stage process. The stages in this process are magnifier glass, research, business, marketing, focus.

Concept Of Locked Money Finance PowerPoint Templates And PowerPoint Themes 1012
Concept Of Locked Money Finance PowerPoint Templates And PowerPoint Themes 1012-Develop competitive advantage with our above template which contains a diagram of 3d money and lock. This image signifies the concept of data security. This image has been conceived to enable you to emphatically communicate your ideas in your Business and Financial PPT presentations on finance, protection and banking. Our PPT images are so perfectly designed that it reveals the very basis of our PPT template to make your clients understand.-Concept Of Locked Money Finance PowerPoint Templates And PowerPoint Themes 1012-This PowerPoint template can be used for presentations relating to-Money and lock, security, success, money, finance, business Describe your path to success with our Concept Of Locked Money Finance PowerPoint Templates And PowerPoint Themes 1012. You will come out on top.
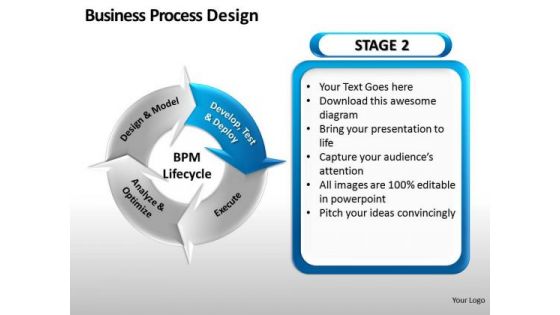
4 Stage Business Process Design PowerPoint Slides And Ppt Diagram Templates
4 Stage Business Process Design PowerPoint Slides And PPT Diagram Templates-These high quality, editable pre-designed powerpoint slides have been carefully created by our professional team to help you impress your audience. Each graphic in every slide is vector based and is 100% editable in powerpoint. Each and every property of any slide - color, size, shading etc can be modified to build an effective powerpoint presentation. Use these slides to convey complex business concepts in a simplified manner. Any text can be entered at any point in the powerpoint slide. Simply DOWNLOAD, TYPE and PRESENT! Examine data with our 4 Stage Business Process Design PowerPoint Slides And Ppt Diagram Templates. You will come out on top.
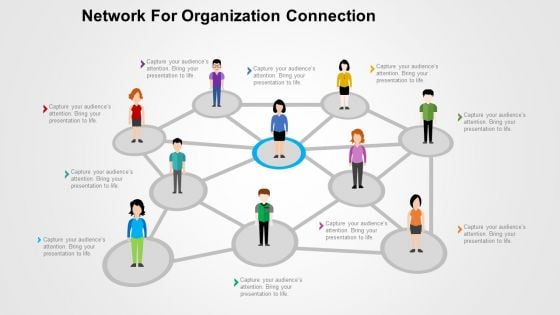
Network For Organization Connection Powerpoint Templates
Feel free to use this professionally created PowerPoint slide for various purposes. The person in the center can be used to portray a leader, a boss, a chairman, a CEO or any other important person. The PowerPoint template can be used to depict a society. This template is exactly what is needed to explain concepts of communication within society. It can be used to portray interconnection amongst various departments or professionals in an organization or business. This slide can be effectively used to explain the concept of networking or bonding. The web of people can be used to show a team and the responsibilities shared. This can also be used to show the order in which ideas, orders or any data is shared in a firm. This can be your answer to explain the working or hierarchy of your business to your clients or customers.
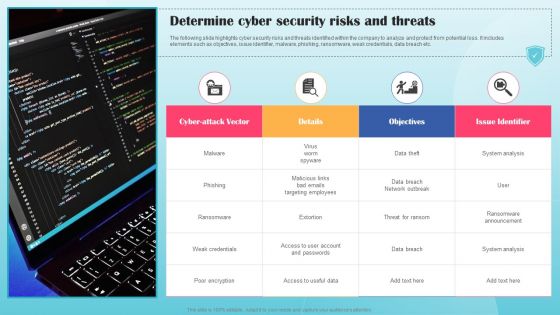
Determine Cyber Security Risks And Threats Ppt PowerPoint Presentation Diagram Lists PDF
The following slide highlights cyber security risks and threats identified within the company to analyze and protect from potential loss. It includes elements such as objectives, issue identifier, malware, phishing, ransomware, weak credentials, data breach etc. This Determine Cyber Security Risks And Threats Ppt PowerPoint Presentation Diagram Lists PDF is perfect for any presentation, be it in front of clients or colleagues. It is a versatile and stylish solution for organizing your meetings. The Determine Cyber Security Risks And Threats Ppt PowerPoint Presentation Diagram Lists PDF features a modern design for your presentation meetings. The adjustable and customizable slides provide unlimited possibilities for acing up your presentation. Slidegeeks has done all the homework before launching the product for you. So, do not wait, grab the presentation templates today

Effective Workforce Participation Action Planning Evaluate Employee Engagement Survey Results Microsoft PDF
The following slide depicts the outcomes of employee engagement questionnaire to analyze and formulate strategies for improvement. It includes data related to actively disengaged, not engaged, engaged employees along with key takeaways etc. Present like a pro with Effective Workforce Participation Action Planning Evaluate Employee Engagement Survey Results Microsoft PDF Create beautiful presentations together with your team, using our easy to use presentation slides. Share your ideas in real time and make changes on the fly by downloading our templates. So whether you are in the office, on the go, or in a remote location, you can stay in sync with your team and present your ideas with confidence. With Slidegeeks presentation got a whole lot easier. Grab these presentations today.
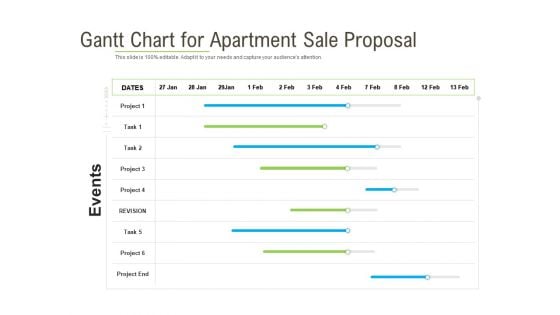
Rapid Innovation In HR Technology Space Gantt Chart For Apartment Sale Proposal Structure PDF
Your complex projects can be managed and organized simultaneously using this detailed rapid innovation in hr technology space gantt chart for apartment sale proposal structure pdf template. Track the milestones, tasks, phases, activities, and subtasks to get an updated visual of your project. Share your planning horizon and release plan with this well crafted presentation template. This exemplary template can be used to plot various dependencies to distinguish the tasks in the pipeline and their impact on the schedules and deadlines of the project. Apart from this, you can also share this visual presentation with your team members and stakeholders. It a resourceful tool that can be incorporated into your business structure. Therefore, download and edit it conveniently to add the data and statistics as per your requirement.
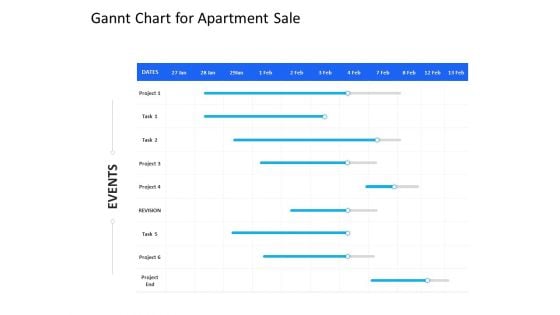
Organization Manpower Management Technology Gannt Chart For Apartment Sale Elements PDF
Your complex projects can be managed and organized simultaneously using this detailed organization manpower management technology gannt chart for apartment sale elements pdf template. Track the milestones, tasks, phases, activities, and subtasks to get an updated visual of your project. Share your planning horizon and release plan with this well crafted presentation template. This exemplary template can be used to plot various dependencies to distinguish the tasks in the pipeline and their impact on the schedules and deadlines of the project. Apart from this, you can also share this visual presentation with your team members and stakeholders. It a resourceful tool that can be incorporated into your business structure. Therefore, download and edit it conveniently to add the data and statistics as per your requirement.
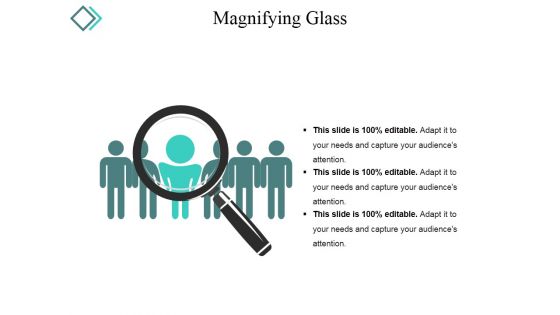
Magnifying Glass Ppt PowerPoint Presentation Pictures Diagrams
This is a magnifying glass ppt powerpoint presentation pictures diagrams. This is a three stage process. The stages in this process are magnifier glass, research, business, marketing.
Magnify Glass Ppt PowerPoint Presentation Gallery Diagrams
This is a magnify glass ppt powerpoint presentation gallery diagrams. This is a one stage process. The stages in this process are search, business, strategy, marketing, management.
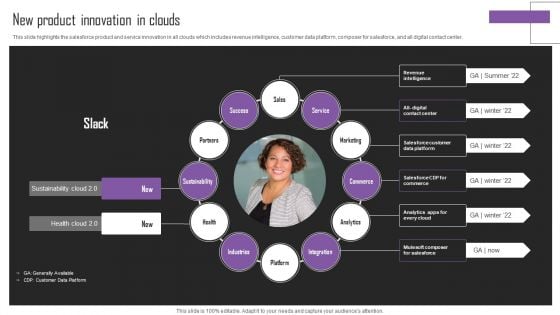
Web Hosting Software Company Outline New Product Innovation In Clouds Portrait PDF
This slide highlights the salesforce product and service innovation in all clouds which includes revenue intelligence, customer data platform, composer for salesforce, and all digital contact center. Whether you have daily or monthly meetings, a brilliant presentation is necessary. Web Hosting Software Company Outline New Product Innovation In Clouds Portrait PDF can be your best option for delivering a presentation. Represent everything in detail using Web Hosting Software Company Outline New Product Innovation In Clouds Portrait PDF and make yourself stand out in meetings. The template is versatile and follows a structure that will cater to your requirements. All the templates prepared by Slidegeeks are easy to download and edit. Our research experts have taken care of the corporate themes as well. So, give it a try and see the results.

Key Texting And SMS Marketing Statistics Ppt PowerPoint Presentation Diagram Graph Charts PDF
This slide represents the statistical data to help marketers analyze the benefits and importance of SMS marketing for business growth and development. It includes key SMS marketing statistics such as click through rates, opt-ins etc. Get a simple yet stunning designed Key Texting And SMS Marketing Statistics Ppt PowerPoint Presentation Diagram Graph Charts PDF. It is the best one to establish the tone in your meetings. It is an excellent way to make your presentations highly effective. So, download this PPT today from Slidegeeks and see the positive impacts. Our easy to edit Key Texting And SMS Marketing Statistics Ppt PowerPoint Presentation Diagram Graph Charts PDF can be your go to option for all upcoming conferences and meetings. So, what are you waiting for Grab this template today.
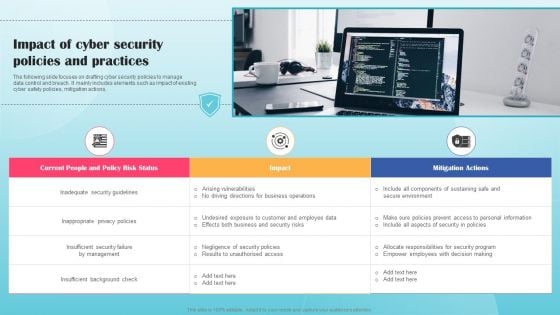
Impact Of Cyber Security Policies And Practices Ppt PowerPoint Presentation Diagram Graph Charts PDF
The following slide focuses on drafting cyber security policies to manage data control and breach. It mainly includes elements such as impact of existing cyber safety policies, mitigation actions, Presenting this PowerPoint presentation, titled Impact Of Cyber Security Policies And Practices Ppt PowerPoint Presentation Diagram Graph Charts PDF, with topics curated by our researchers after extensive research. This editable presentation is available for immediate download and provides attractive features when used. Download now and captivate your audience. Presenting this Impact Of Cyber Security Policies And Practices Ppt PowerPoint Presentation Diagram Graph Charts PDF. Our researchers have carefully researched and created these slides with all aspects taken into consideration. This is a completely customizable Impact Of Cyber Security Policies And Practices Ppt PowerPoint Presentation Diagram Graph Charts PDF that is available for immediate downloading. Download now and make an impact on your audience. Highlight the attractive features available with our PPTs.
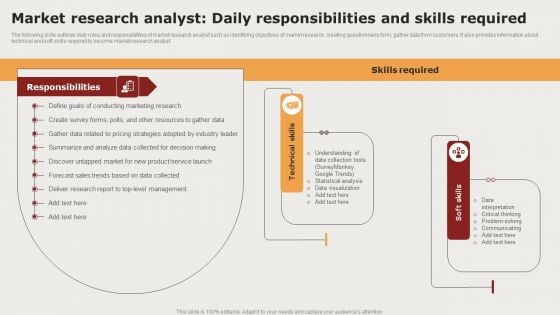
Creating Positioning Techniques For Market Research Market Research Analyst Daily Responsibilities And Skills Required Themes PDF
The following slide outlines daily roles and responsibilities of market research analyst such as identifying objectives of market research, creating questionnaire form, gather data from customers. It also provides information about technical and soft skills required to become market research analyst. Do you have to make sure that everyone on your team knows about any specific topic I yes, then you should give Creating Positioning Techniques For Market Research Market Research Analyst Daily Responsibilities And Skills Required Themes PDF a try. Our experts have put a lot of knowledge and effort into creating this impeccable Creating Positioning Techniques For Market Research Market Research Analyst Daily Responsibilities And Skills Required Themes PDF. You can use this template for your upcoming presentations, as the slides are perfect to represent even the tiniest detail. You can download these templates from the Slidegeeks website and these are easy to edit. So grab these today.
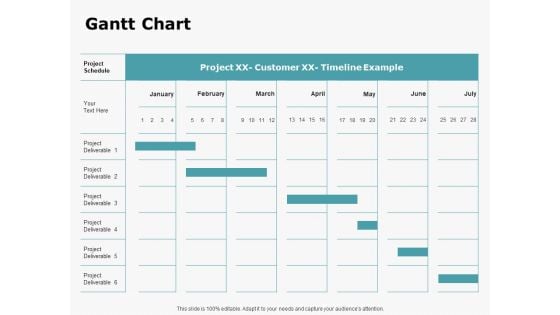
HR Outsourcing Service Proposal Gantt Chart Ppt Infographic Template Visuals PDF
Manage your complex projects and organize them simultaneously with this detailed Gantt Chart PowerPoint Template. Track your milestones, tasks, phases, activities, subtasks amongst other constituents that will give you an updated visual of your project. Reflect your planning horizon and capture your release plan in one view with this Gantt Chart PowerPoint presentation template. You can plot various dependencies directly on this Timeline PowerPoint Presentation Layout to see which tasks are still in the pipeline and how the delays in them are impacting the schedules and deadlines of the project. Apart from this, you can also share this updated visual with your team members and stakeholders, thus making it a resourceful tool to be incorporated in your business structure. Not only this but also the editable layout of this slide helps you to add your data and statistics at your convenience.
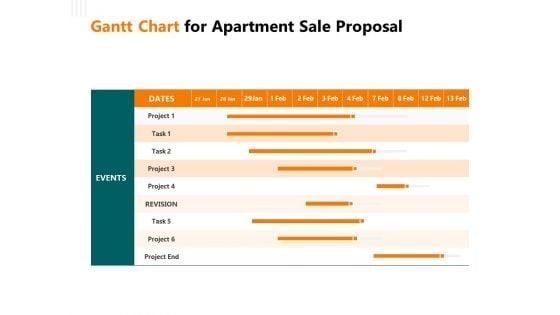
Rent Condominium Gantt Chart For Apartment Sale Proposal Ppt Gallery Visuals PDF
Your complex projects can be managed and organized simultaneously using this detailed rent condominium gantt chart for apartment sale proposal ppt gallery visuals pdf template. Track the milestones, tasks, phases, activities, and subtasks to get an updated visual of your project. Share your planning horizon and release plan with this well-crafted presentation template. This exemplary template can be used to plot various dependencies to distinguish the tasks in the pipeline and their impact on the schedules and deadlines of the project. Apart from this, you can also share this visual presentation with your team members and stakeholders. It a resourceful tool that can be incorporated into your business structure. Therefore, download and edit it conveniently to add the data and statistics as per your requirement.
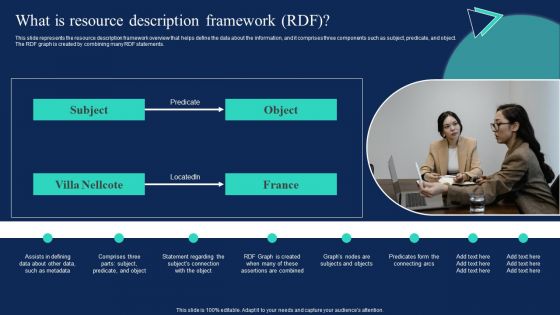
Enterprise Information Web Standards What Is Resource Description Framework RDF Diagrams PDF
This slide represents the resource description framework overview that helps define the data about the information, and it comprises three components such as subject, predicate, and object. The RDF graph is created by combining many RDF statements. Welcome to our selection of the Enterprise Information Web Standards What Is Resource Description Framework RDF Diagrams PDF. These are designed to help you showcase your creativity and bring your sphere to life. Planning and Innovation are essential for any business that is just starting out. This collection contains the designs that you need for your everyday presentations. All of our PowerPoints are 100 percent editable, so you can customize them to suit your needs. This multi purpose template can be used in various situations. Grab these presentation templates today.
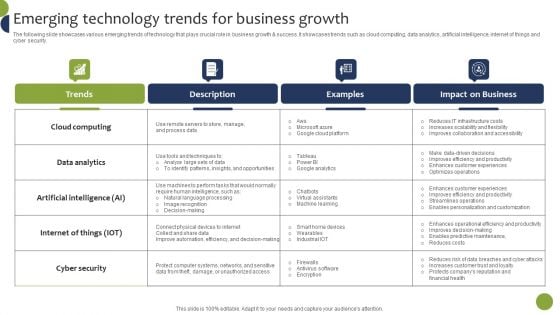
Emerging Technology Trends For Business Growth Diagrams PDF
The following slide showcases various emerging trends of technology that plays crucial role in business growth and success. It showcases trends such as cloud computing, data analytics, artificial intelligence, internet of things and cyber security. Formulating a presentation can take up a lot of effort and time, so the content and message should always be the primary focus. The visuals of the PowerPoint can enhance the presenters message, so our Emerging Technology Trends For Business Growth Diagrams PDF was created to help save time. Instead of worrying about the design, the presenter can concentrate on the message while our designers work on creating the ideal templates for whatever situation is needed. Slidegeeks has experts for everything from amazing designs to valuable content, we have put everything into Emerging Technology Trends For Business Growth Diagrams PDF.
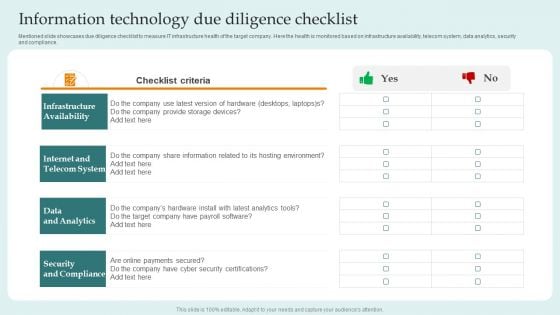
Information Technology Due Diligence Checklist Guide For Successful Merger And Acquisition Pictures PDF
Mentioned slide showcases due diligence checklist to measure IT infrastructure health of the target company. Here the health is monitored based on infrastructure availability, telecom system, data analytics, security and compliance.Slidegeeks has constructed Information Technology Due Diligence Checklist Guide For Successful Merger And Acquisition Pictures PDF after conducting extensive research and examination. These presentation templates are constantly being generated and modified based on user preferences and critiques from editors. Here, you will find the most attractive templates for a range of purposes while taking into account ratings and remarks from users regarding the content. This is an excellent jumping-off point to explore our content and will give new users an insight into our top-notch PowerPoint Templates.
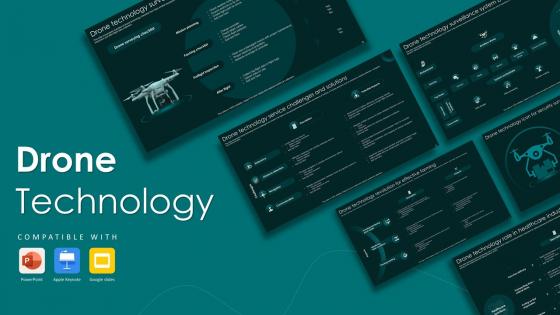
Drone Technology Powerpoint Ppt Template Bundles
This Drone Technology Powerpoint Ppt Template Bundles is designed to help you retain your audiences attention. This content-ready PowerPoint Template enables you to take your audience on a journey and share information in a way that is easier to recall. It helps you highlight the crucial parts of your work so that the audience does not get saddled with information download. This UAV Technology, Aerial Robotics, Drone Innovation, Unmanned Aerial Vehicle Tech, Autonomous Drone Systems-slide PPT Deck comes prepared with the graphs and charts you could need to showcase your information through visuals. You only need to enter your own data in them. Download this editable PowerPoint Theme and walk into that meeting with confidence. Explore our engaging PPT on Drone Technology, involving how drones are transforming industries like security and agriculture. Learn about their evolving role in surveillance, disaster response, etc. Get glimpse into future of unmanned aerial systems and their potential impact.
User Manual With Magnifying Glass Ppt Powerpoint Presentation Diagram Ppt
This is a user manual with magnifying glass ppt powerpoint presentation diagram ppt. This is a three stage process. The stages in this process are advice, guidance, counsel.
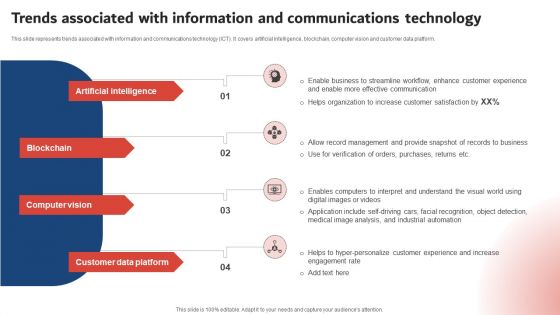
Trends Associated With Information And Communications Technology Pictures PDF
This slide represents trends associated with information and communications technology ICT. It covers artificial intelligence, blockchain, computer vision and customer data platform. Retrieve professionally designed Trends Associated With Information And Communications Technology Pictures PDF to effectively convey your message and captivate your listeners. Save time by selecting pre made slideshows that are appropriate for various topics, from business to educational purposes. These themes come in many different styles, from creative to corporate, and all of them are easily adjustable and can be edited quickly. Access them as PowerPoint templates or as Google Slides themes. You do not have to go on a hunt for the perfect presentation because Slidegeeks got you covered from everywhere.
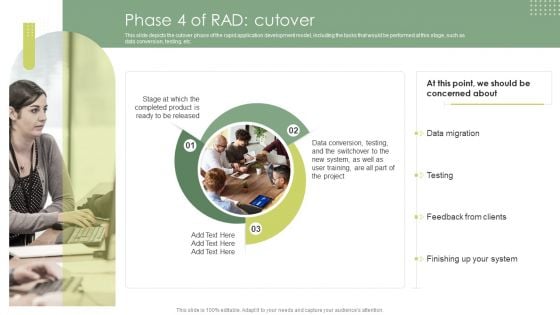
Phase 4 Of Rad Cutover Rapid Application Building RAB Model Graphics PDF
This slide depicts the cutover phase of the rapid application development model, including the tasks that would be performed at this stage, such as data conversion, testing, etc.Are you in need of a template that can accommodate all of your creative concepts This one is crafted professionally and can be altered to fit any style. Use it with Google Slides or PowerPoint. Include striking photographs, symbols, depictions, and other visuals. Fill, move around, or remove text boxes as desired. Test out color palettes and font mixtures. Edit and save your work, or work with colleagues. Download Phase 4 Of Rad Cutover Rapid Application Building RAB Model Graphics PDF and observe how to make your presentation outstanding. Give an impeccable presentation to your group and make your presentation unforgettable.

Online PR Techniques To Boost Brands Online Visibility Ppt PowerPoint Presentation Complete Deck With Slides
This Online PR Techniques To Boost Brands Online Visibility Ppt PowerPoint Presentation Complete Deck With Slides is designed to help you retain your audiences attention. This content ready PowerPoint Template enables you to take your audience on a journey and share information in a way that is easier to recall. It helps you highlight the crucial parts of your work so that the audience does not get saddled with information download. This sixty five slide PPT Deck comes prepared with the graphs and charts you could need to showcase your information through visuals. You only need to enter your own data in them. Download this editable PowerPoint Theme and walk into that meeting with confidence.
Approaches To Targeting New Customers In Various Markets Ppt PowerPoint Presentation Complete Deck With Slides
This Approaches To Targeting New Customers In Various Markets Ppt PowerPoint Presentation Complete Deck With Slides is designed to help you retain your audiences attention. This content-ready PowerPoint Template enables you to take your audience on a journey and share information in a way that is easier to recall. It helps you highlight the crucial parts of your work so that the audience does not get saddled with information download. This seventy three slide PPT Deck comes prepared with the graphs and charts you could need to showcase your information through visuals. You only need to enter your own data in them. Download this editable PowerPoint Theme and walk into that meeting with confidence.
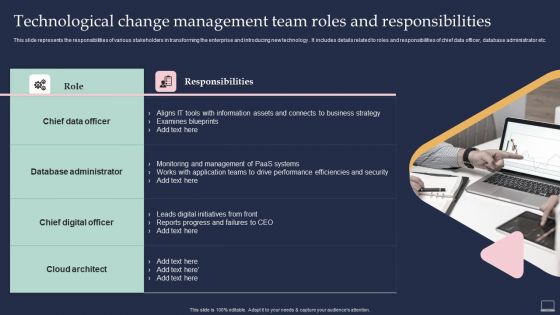
Training Program For Implementing Technological Change Management Team Roles Information PDF
This slide represents the responsibilities of various stakeholders in transforming the enterprise and introducing new technology . It includes details related to roles and responsibilities of chief data officer, database administrator etc. If you are looking for a format to display your unique thoughts, then the professionally designed Training Program For Implementing Technological Change Management Team Roles Information PDF is the one for you. You can use it as a Google Slides template or a PowerPoint template. Incorporate impressive visuals, symbols, images, and other charts. Modify or reorganize the text boxes as you desire. Experiment with shade schemes and font pairings. Alter, share or cooperate with other people on your work. Download Training Program For Implementing Technological Change Management Team Roles Information PDF and find out how to give a successful presentation. Present a perfect display to your team and make your presentation unforgettable.

Comprehensive Influencer Promotional Guide To Improve Brand Reputation Survey Insights On Social Media Mockup PDF
This slide represents the statistical data to help enterprise to find out the best social media platform for influencer marketing. It includes details related to most popular social media platforms used for social media advertising such as Instagram, YouTube etc. Get a simple yet stunning designed Comprehensive Influencer Promotional Guide To Improve Brand Reputation Survey Insights On Social Media Mockup PDF. It is the best one to establish the tone in your meetings. It is an excellent way to make your presentations highly effective. So, download this PPT today from Slidegeeks and see the positive impacts. Our easy to edit Comprehensive Influencer Promotional Guide To Improve Brand Reputation Survey Insights On Social Media Mockup PDF can be your go to option for all upcoming conferences and meetings. So, what are you waiting for Grab this template today.
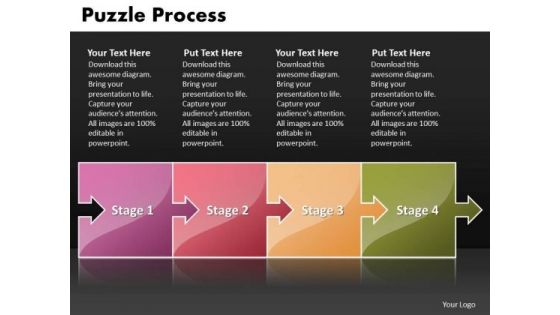
Ppt Puzzle Process Social Network PowerPoint Backgrounds Startegy Templates
PPT puzzle process social network powerpoint backgrounds startegy Templates-Illustrate your ideas and imprint them in the minds of your team with this template. Feel the buzz as they comprehend your plan to get the entire act together. Watch their eyes light up with enthusiasm as they see the dream emerge.-PPT puzzle process social network powerpoint backgrounds startegy Templates-abstract action attach box business center chain chart color communication concept connection cube cycle data diagram flow globe horizontal idea illustration individual information interaction jigsaw join link merge missing opportunity part people piece pieces process puzzle relation relationship search shape silhouette success Illustrate your plans for greater efficiency with our Ppt Puzzle Process Social Network PowerPoint Backgrounds Startegy Templates. Work out how to get more for less.
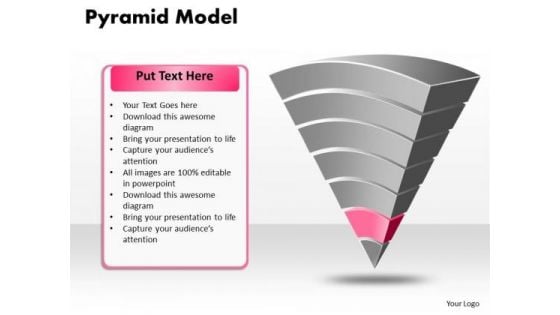
Ppt Pyramid Business Model Spider Diagram PowerPoint Template Templates
PPT pyramid business model spider diagram powerpoint template Templates-You can divide a Pyramid Chart into segments for illustrating proportion. Pyramid chart is an effective way of displaying information you can edit text, color, shade and style as per you need. This pyramid chart is perhaps the most widely used statistical chart in the business world.-PPT pyramid business model spider diagram powerpoint template Templates-Business, Chart, Color, Data Pyramid, Diagram, Graph, Group, Growth, Hierarchy, Illustration, Layer, Layered, Layered Pyramid, Level, Multicolor, Object, Performance, Presentation, Progress, Pyramid, Rank, Seam, Segment, Set, Shape, Stage, Structure, Symbol, System, Top Dismiss the blues with our Ppt Pyramid Business Model Spider Diagram PowerPoint Template Templates. Your thoughts will dispel all despondency.
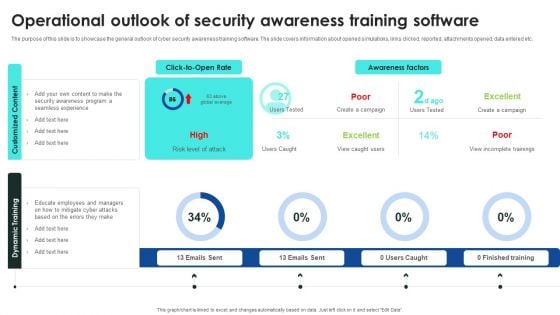
Implementing Cybersecurity Awareness Program To Prevent Attacks Operational Outlook Of Security Awareness Elements PDF
The purpose of this slide is to showcase the general outlook of cyber security awareness training software. The slide covers information about opened simulations, links clicked, reported, attachments opened, data entered etc. Slidegeeks has constructed Implementing Cybersecurity Awareness Program To Prevent Attacks Operational Outlook Of Security Awareness Elements PDF after conducting extensive research and examination. These presentation templates are constantly being generated and modified based on user preferences and critiques from editors. Here, you will find the most attractive templates for a range of purposes while taking into account ratings and remarks from users regarding the content. This is an excellent jumping off point to explore our content and will give new users an insight into our top notch PowerPoint Templates.
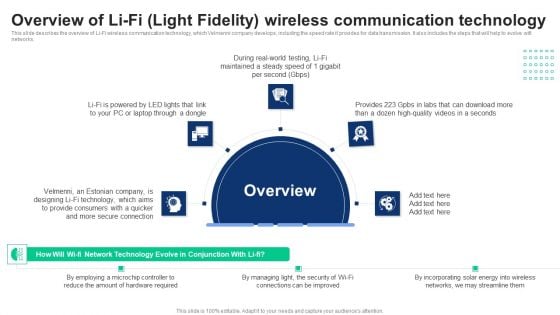
1G To 5G Cellular Overview Of Lifi Light Fidelity Wireless Communication Technology Diagrams PDF
This slide describes the overview of Li-Fi wireless communication technology, which Velmenni company develops, including the speed rate it provides for data transmission. It also includes the steps that will help to evolve wifi networks. If you are looking for a format to display your unique thoughts, then the professionally designed 1G To 5G Cellular Overview Of Lifi Light Fidelity Wireless Communication Technology Diagrams PDF is the one for you. You can use it as a Google Slides template or a PowerPoint template. Incorporate impressive visuals, symbols, images, and other charts. Modify or reorganize the text boxes as you desire. Experiment with shade schemes and font pairings. Alter, share or cooperate with other people on your work. Download 1G To 5G Cellular Overview Of Lifi Light Fidelity Wireless Communication Technology Diagrams PDF and find out how to give a successful presentation. Present a perfect display to your team and make your presentation unforgettable.
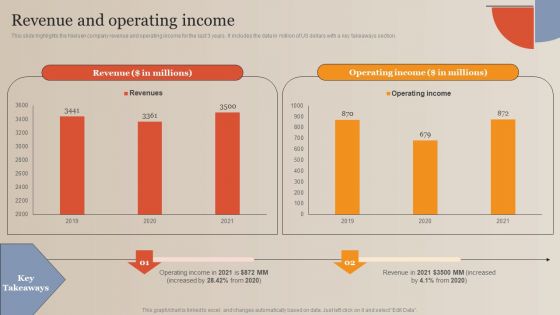
Market Study Company Outline Revenue And Operating Income Themes PDF
This slide highlights the Nielsen company revenue and operating income for the last 3 years. It includes the data in million of US dollars with a key takeaways section. Slidegeeks is here to make your presentations a breeze with Market Study Company Outline Revenue And Operating Income Themes PDF With our easy to use and customizable templates, you can focus on delivering your ideas rather than worrying about formatting. With a variety of designs to choose from, you are sure to find one that suits your needs. And with animations and unique photos, illustrations, and fonts, you can make your presentation pop. So whether you are giving a sales pitch or presenting to the board, make sure to check out Slidegeeks first.
Automation Technology Powerpoint Presentation Slides
With well-researched insights and carefully-constructed design, this Automation Technology Powerpoint Presentation Slides is all that you need for your next business meeting with clients and win them over. Add your data to graphs, charts, and tables that are already ready to display it with stunning visuals and help your audience recall your work. With this PPT Complete Deck, you will be able to display your knowledge of the subject as well as your skills as a communicator. Share your ideas and make an impact on the audience with this PowerPoint Layout and ensure that you are known as a presentation professional. Download this PPT Template Bundle to create the most interesting presentation anyone has ever seen. Our Automation Technology PowerPoint Presentation Slides are expertly designed to create a visually appealing backdrop for any topic. Use them to present with confidence and professionalism.
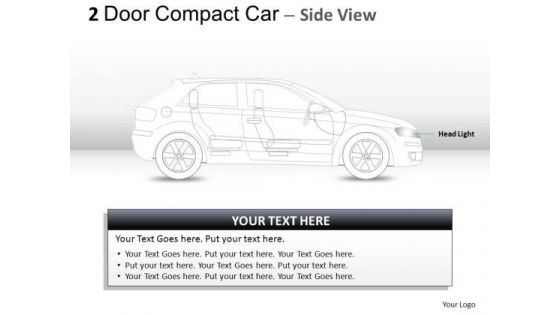
Elegance Expensive 2 Door Gray Car Side PowerPoint Slides And Ppt Diagram Templates
Elegance Expensive 2 Door Gray Car Side PowerPoint Slides And PPT Diagram Templates-These high quality powerpoint pre-designed slides and powerpoint templates have been carefully created by our professional team to help you impress your audience. All slides have been created and are 100% editable in powerpoint. Each and every property of any graphic - color, size, orientation, shading, outline etc. can be modified to help you build an effective powerpoint presentation. Any text can be entered at any point in the powerpoint template or slide. Simply DOWNLOAD, TYPE and PRESENT! Gather the data and present with our Elegance Expensive 2 Door Gray Car Side PowerPoint Slides And Ppt Diagram Templates. Try us out and see what a difference our templates make.
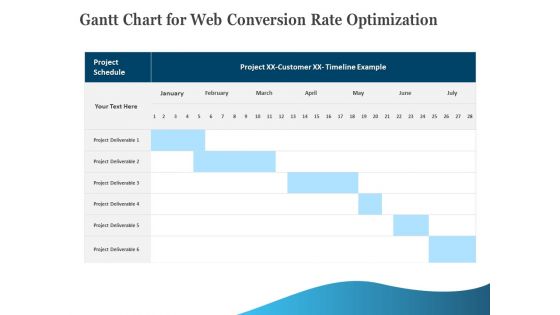
Gantt Chart For Web Conversion Rate Optimization Download PDF
Your complex projects can be managed and organized simultaneously using this detailed gantt chart for web conversion rate optimization download pdf template. Track the milestones, tasks, phases, activities, and subtasks to get an updated visual of your project. Share your planning horizon and release plan with this well-crafted presentation template. This exemplary template can be used to plot various dependencies to distinguish the tasks in the pipeline and their impact on the schedules and deadlines of the project. Apart from this, you can also share this visual presentation with your team members and stakeholders. It a resourceful tool that can be incorporated into your business structure. Therefore, download and edit it conveniently to add the data and statistics as per your requirement.

Information Technology Operations Administration With ML Ppt PowerPoint Presentation Complete Deck With Slides
With well-researched insights and carefully-constructed design, this Information Technology Operations Administration With ML Ppt PowerPoint Presentation Complete Deck With Slides is all that you need for your next business meeting with clients and win them over. Add your data to graphs, charts, and tables that are already ready to display it with stunning visuals and help your audience recall your work. With this PPT Complete Deck, you will be able to display your knowledge of the subject as well as your skills as a communicator. Share your ideas and make an impact on the audience with this PowerPoint Layout and ensure that you are known as a presentation professional. Download this PPT Template Bundle to create the most interesting presentation anyone has ever seen.
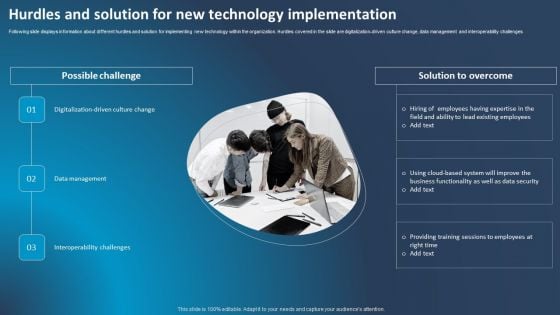
Improving Corporate Performance Hurdles And Solution For New Technology Themes PDF
Following slide displays information about different hurdles and solution for implementing new technology within the organization. Hurdles covered in the slide are digitalization-driven culture change, data management and interoperability challenges. Whether you have daily or monthly meetings, a brilliant presentation is necessary. Improving Corporate Performance Hurdles And Solution For New Technology Themes PDF can be your best option for delivering a presentation. Represent everything in detail using Improving Corporate Performance Hurdles And Solution For New Technology Themes PDF and make yourself stand out in meetings. The template is versatile and follows a structure that will cater to your requirements. All the templates prepared by Slidegeeks are easy to download and edit. Our research experts have taken care of the corporate themes as well. So, give it a try and see the results.
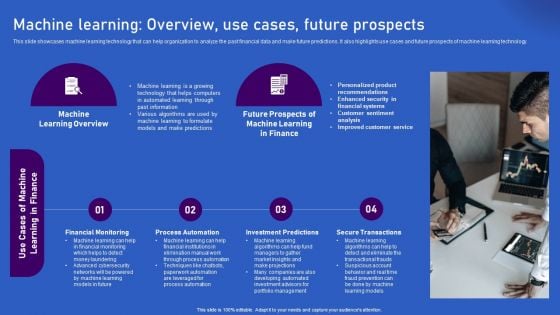
Ways Artificial Intelligence Is Transforming Finance Sector Machine Learning Overview Use Cases Future Diagrams PDF
This slide showcases machine learning technology that can help organization to analyze the past financial data and make future predictions. It also highlights use cases and future prospects of machine learning technology. Explore a selection of the finest Ways Artificial Intelligence Is Transforming Finance Sector Machine Learning Overview Use Cases Future Diagrams PDF here. With a plethora of professionally designed and pre made slide templates, you can quickly and easily find the right one for your upcoming presentation. You can use our Ways Artificial Intelligence Is Transforming Finance Sector Machine Learning Overview Use Cases Future Diagrams PDF to effectively convey your message to a wider audience. Slidegeeks has done a lot of research before preparing these presentation templates. The content can be personalized and the slides are highly editable. Grab templates today from Slidegeeks.
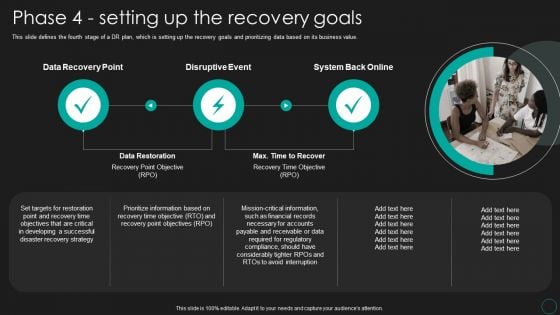
Disaster Recovery Strategic Plan Phase 4 Setting Up The Recovery Goals Topics PDF
This slide defines the fourth stage of a DR plan, which is setting up the recovery goals and prioritizing data based on its business value. Do you have to make sure that everyone on your team knows about any specific topic I yes, then you should give Disaster Recovery Strategic Plan Phase 4 Setting Up The Recovery Goals Topics PDF a try. Our experts have put a lot of knowledge and effort into creating this impeccable Disaster Recovery Strategic Plan Phase 4 Setting Up The Recovery Goals Topics PDF. You can use this template for your upcoming presentations, as the slides are perfect to represent even the tiniest detail. You can download these templates from the Slidegeeks website and these are easy to edit. So grab these today.
Leveraging Risk Management Strategies To Optimize Sales Team Performance Ppt PowerPoint Presentation Complete Deck
With well-researched insights and carefully-constructed design, this Leveraging Risk Management Strategies To Optimize Sales Team Performance Ppt PowerPoint Presentation Complete Deck is all that you need for your next business meeting with clients and win them over. Add your data to graphs, charts, and tables that are already ready to display it with stunning visuals and help your audience recall your work. With this PPT Complete Deck, you will be able to display your knowledge of the subject as well as your skills as a communicator. Share your ideas and make an impact on the audience with this PowerPoint Layout and ensure that you are known as a presentation professional. Download this PPT Template Bundle to create the most interesting presentation anyone has ever seen.
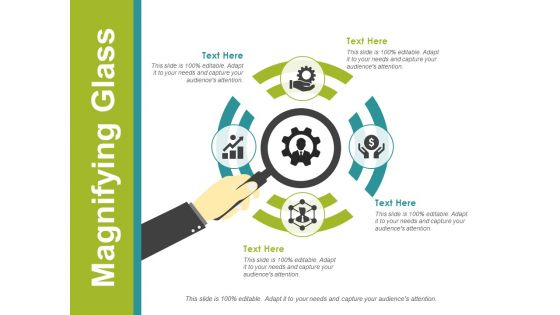
Magnifying Glass Ppt PowerPoint Presentation Visual Aids Show
This is a magnifying glass ppt powerpoint presentation visual aids show. This is a four stage process. The stages in this process are magnifying glass, business, marketing, technology, icons.
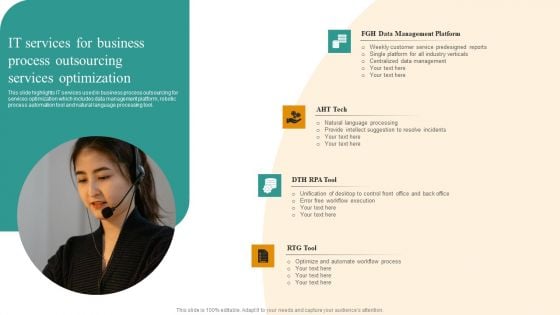
Comprehensive Guide For Enhancing Performance Of Customer Service Center IT Services For Business Process Themes PDF
This slide highlights IT services used in business process outsourcing for services optimization which includes data management platform, robotic process automation tool and natural language processing tool. Slidegeeks is here to make your presentations a breeze with Comprehensive Guide For Enhancing Performance Of Customer Service Center IT Services For Business Process Themes PDF With our easy to use and customizable templates, you can focus on delivering your ideas rather than worrying about formatting. With a variety of designs to choose from, you are sure to find one that suits your needs. And with animations and unique photos, illustrations, and fonts, you can make your presentation pop. So whether you are giving a sales pitch or presenting to the board, make sure to check out Slidegeeks first.
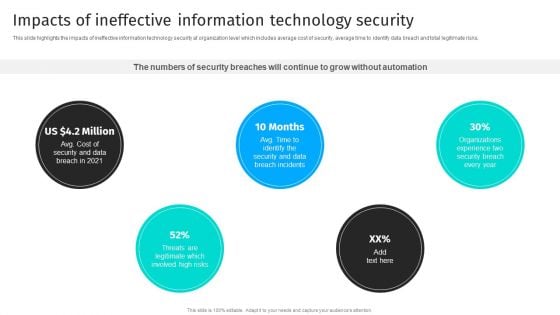
Security Automation To Analyze And Mitigate Cyberthreats Impacts Of Ineffective Information Designs PDF
This slide highlights the impacts of ineffective information technology security at organization level which includes average cost of security, average time to identify data breach and total legitimate risks.If you are looking for a format to display your unique thoughts, then the professionally designed Security Automation To Analyze And Mitigate Cyberthreats Impacts Of Ineffective Information Designs PDF is the one for you. You can use it as a Google Slides template or a PowerPoint template. Incorporate impressive visuals, symbols, images, and other charts. Modify or reorganize the text boxes as you desire. Experiment with shade schemes and font pairings. Alter, share or cooperate with other people on your work. Download Security Automation To Analyze And Mitigate Cyberthreats Impacts Of Ineffective Information Designs PDF and find out how to give a successful presentation. Present a perfect display to your team and make your presentation unforgettable.
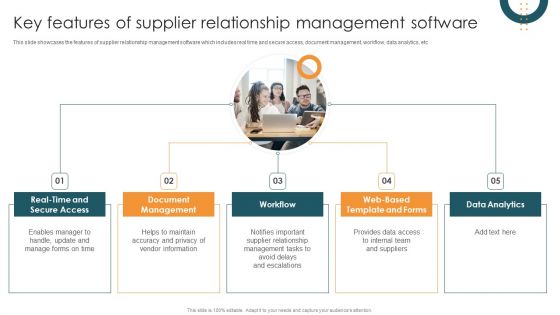
Vendor Relation Management Techniques Key Features Of Supplier Relationship Management Software Download PDF
This slide showcases the features of supplier relationship management software which includes real time and secure access, document management, workflow, data analytics, etc. Do you know about Slidesgeeks Vendor Relation Management Techniques Key Features Of Supplier Relationship Management Software Download PDF These are perfect for delivering any kind od presentation. Using it, create PowerPoint presentations that communicate your ideas and engage audiences. Save time and effort by using our pre designed presentation templates that are perfect for a wide range of topic. Our vast selection of designs covers a range of styles, from creative to business, and are all highly customizable and easy to edit. Download as a PowerPoint template or use them as Google Slides themes.

Key Characteristics Of Modern ZTNA Solution Portrait PDF
This slide outlines the top features that a modern ZTNA model should include. This slide highlights the characteristics of modern ZTNA solutions, including data loss prevention, scalable performance, granular visibility and reporting, BYOD deployment options, advanced threat protection, and SASE offering. Are you searching for a Key Characteristics Of Modern ZTNA Solution Portrait PDF that is uncluttered, straightforward, and original Its easy to edit, and you can change the colors to suit your personal or business branding. For a presentation that expresses how much effort you have put in, this template is ideal With all of its features, including tables, diagrams, statistics, and lists, its perfect for a business plan presentation. Make your ideas more appealing with these professional slides. Download Key Characteristics Of Modern ZTNA Solution Portrait PDF from Slidegeeks today.

 Home
Home